socio-economic impacts of the forest industry - fwpa · socio-economic impacts of the forest...
TRANSCRIPT
Socio-economic impacts of the forest industry
Green Triangle
November 2017
Jacki Schirmer1,2, Mel Mylek1, Anders Magnusson3, Brigitta Yabsley1 and Julian
Morison3
1 Health Research Institute, University of Canberra 2 Institute for Applied Ecology, University of Canberra 3 EconSearch
i
Contents
Acknowledgments .................................................................................................................................. iv Executive Summary ................................................................................................................................. v Introduction ............................................................................................................................................ 1 Methods .................................................................................................................................................. 2 Overview of the industry – Green Triangle ............................................................................................. 3
Industry structure ............................................................................................................................... 3 Industry sectors ................................................................................................................................... 5
Softwood plantation sector ............................................................................................................ 5 Hardwood plantation sector ........................................................................................................... 6
Other activities ........................................................................................................................................ 7 Economic value ....................................................................................................................................... 8
Measuring economic impact ............................................................................................................... 8 Categories of economic impact ...................................................................................................... 8 Value of output ............................................................................................................................... 9 Industry expenditure....................................................................................................................... 9 Industry contribution to Gross Regional Product (GRP) ............................................................... 10 Employment .................................................................................................................................. 11
Direct economic value ...................................................................................................................... 11 Direct value of output of the Green Triangle forest industry ....................................................... 11 Direct expenditure by the Green Triangle forest industry ............................................................ 12 Contribution of the forest industry to Gross Regional Production ............................................... 13
Total economic value including both direct and flow-on effects ..................................................... 14 Employment .......................................................................................................................................... 17
Direct employment ........................................................................................................................... 17 Flow-on employment ........................................................................................................................ 20 Employment by local government area ............................................................................................ 21 Comparing employment estimates................................................................................................... 23 Employment over time ..................................................................................................................... 26
Working conditions ............................................................................................................................... 29 Working hours ................................................................................................................................... 29 Income .............................................................................................................................................. 31
Workforce diversity and sustainability ................................................................................................. 32 Gender .............................................................................................................................................. 32 Age .................................................................................................................................................... 34 Aboriginal and Torres Strait Islanders ............................................................................................... 34 Recruiting workers and contractors.................................................................................................. 35
Industry skills and training needs ......................................................................................................... 38 Formal skills attainment.................................................................................................................... 40
Business and market outlook ................................................................................................................ 42 Overall business conditions .............................................................................................................. 42 Future business expectations ........................................................................................................... 42 Business challenges ........................................................................................................................... 43
Community perceptions of the social, economic, service and infrastructure effects of the forest industry ................................................................................................................................................. 45
Quality of life and liveability ............................................................................................................. 45 Perceptions of regional industries .................................................................................................... 50
Conclusions ........................................................................................................................................... 55 References ............................................................................................................................................ 56 Appendix 1 Data tables ......................................................................................................................... 58 Appendix 2 Using ABS Census data to identify employment in secondary processing ........................ 71
ii
Tables Table 1 Direct expenditure generated by the Green Triangle forest industry in different region by growing,
harvesting and primary processing, 2015-16, by supply chain stage ................................................................... 12
Table 2 Direct expenditure generated by different parts of the Green Triangle forest industry by growing,
harvesting and primary processing, 2015-16, by supply chain stage ................................................................... 13
Table 3 Total economic value of the Green Triangle forest industry (including direct and flow-on effects), up to
and including primary processing ......................................................................................................................... 15
Table 4 Direct employment generated by the forest industry the Green Triangle, 2017, by sector (Data source:
2017 industry survey, unless otherwise noted) .................................................................................................... 18
Table 5 Direct employment generated by the Green Triangle forest industry, 2017, by region (Data source:
2017 industry survey, unless otherwise noted) .................................................................................................... 19
Table 6 Employment multipliers: indirect employment generated by the Green Triangle forest industry, by
sector .................................................................................................................................................................... 20
Table 7 Employment multipliers: indirect employment generated by the Green Triangle forest industry, by
region .................................................................................................................................................................... 21
Table 8 Direct employment generated by the Green Triangle forest industry, 2017, by local government area 22
Table 9 Comparison of forest industry employment generated up to point of sale of primary processed
products: 2016 Census and 2017 Forest Industry Survey .................................................................................... 24
Table 10 Green Triangle forest industry employment recorded in the ABS Census of Population and Housing
over time .............................................................................................................................................................. 28
Table 11 Full-time, part-time and casual work in the softwood plantation industry, 2017 – industry survey
results ................................................................................................................................................................... 29
Table 12 Proportion of the Green Triangle workforce employed full-time and part-time, 2006-2016 – ABS
Census of Population and Housing ....................................................................................................................... 30
Table 13 Working hours by industry sector, 2006-2016, Green Triangle – ABS Census of Population and Housing
.............................................................................................................................................................................. 30
Table 14 Income earned by workers, 2006-2016, Green Triangle – ABS Census of Population and Housing ...... 31
Table 15 Income earned by full-time workers, 2006-2016, Green Triangle – ABS Census of Population and
Housing ................................................................................................................................................................. 31
Table 16 Workforce characteristics, Green Triangle and Victorian forest industry: gender (2017 Industry survey)
.............................................................................................................................................................................. 32
Table 17 Workforce by gender composition, 2006-2016, Green Triangle – ABS Census of Population and
Housing ................................................................................................................................................................. 32
Table 18 Workforce by age, 2006-2016, Green Triangle – ABS Census of Population and Housing .................... 34
Table 19 Aboriginal and Torres Strait Islander participation in workforce, 2006-2016, Green Triangle – ABS
Census ................................................................................................................................................................... 34
Table 20 Skills and accreditation needs reported by businesses in Victoria and the Green Triangle .................. 39
Table 21 Types of training used by forest industry businesses in Victoria and the Green Triangle ..................... 40
Table 22 Formal educational attainment: rates of attainment of high school and post-school qualifications in
the Green Triangle forest industry, 2006 to 2016 ................................................................................................ 41
Table A1.1 Expenditure by the forest industry, 2015-16, by region ..................................................................... 58
Table A1.2 Expenditure by the forest industry, 2015-16, by industry sector ....................................................... 59
Table A1.3 Economic impacts of the Green Triangle forest industry, by sector, on the Victorian part of the
Green Triangle ...................................................................................................................................................... 60
Table A1.4 Economic impacts of the Green Triangle forest industry, by sector, on the South Australian part of
the Green Triangle ................................................................................................................................................ 61
Table A1.5 Economic impacts of the Green Triangle hardwood plantation industry on the Green Triangle region
.............................................................................................................................................................................. 62
iii
Table A1.6 Economic impacts of the Green Triangle softwood plantation industry on the Green Triangle region
.............................................................................................................................................................................. 63
Table A1.7 Economic impacts of the Green Triangle forest industry – whole industry – on the Green Triangle
region .................................................................................................................................................................... 64
Table A1.8 Economic impacts on Victoria of the Victorian part of the Green Triangle forest industry and forest
industry in the rest of Victoria dependent on the Green Triangle ....................................................................... 65
Table A1.9 Economic impacts on South Australia of the South Australian part of the Green Triangle forest
industry ................................................................................................................................................................. 66
Table A1.10 Proportion of South Australian Green Triangle residents who reported the forest, farming and
tourism industries had a NEGATIVE impact on different aspects of community life ........................................... 67
Table A1.11 Proportion of Victorian Green Triangle residents who reported the forest, farming and tourism
industries had a NEGATIVE impact on different aspects of community life ......................................................... 68
Table A1.12 Proportion of South Australian Green Triangle residents who reported the forest, farming and
tourism industries had a POSITIVE impact on different aspects of community life ............................................. 69
Table A1.13 Proportion of Victorian Green Triangle residents who reported the forest, farming and tourism
industries had a POSITIVE impact on different aspects of community life .......................................................... 70
Figures
Figure 1 Stylised structure of the forest and wood products industry ................................................................... 5
Figure 2 Distribution of softwood and hardwood plantations in Green Triangle .................................................. 6
Figure 3 Calculation and decomposition of direct contribution to GRP, Green Triangle – all parts of the industry
.............................................................................................................................................................................. 14
Figure 4 Calculation and decomposition of total contribution to GRP, Green Triangle – all parts of the industry
.............................................................................................................................................................................. 16
Figure 5 Level of difficulty involved in recruiting different types of workers, as rated by Victorian and Green
Triangle forest industry businesses ...................................................................................................................... 35
Figure 6 Level of difficulty involved in recruiting different types of contractors, as rated by Victorian and Green
Triangle forest industry businesses involved in engaging contractors ................................................................. 36
Figure 7 Key issues preventing recruitment of skilled workers into forest industry in Victoria and the Green
Triangle ................................................................................................................................................................. 37
Figure 8 Expectations for business revenue, profitability, workforce size and investment over the next 12
months .................................................................................................................................................................. 43
Figure 9 Challenges experienced by Green Triangle forest industry businesses .................................................. 44
Figure 10 Perceptions of overall liveability and economy of local region – Regional Wellbeing Survey 2016 .... 47
Figure 11 Perceptions of friendliness, safety and crime ....................................................................................... 48
Figure 12 Perceptions of landscape aesthetics and environmental health .......................................................... 49
Figure 13 Proportion of residents who viewed the different industries as important contributors to their local
community ............................................................................................................................................................ 51
Figure 14 Proportion of SA Green Triangle residents who felt the forestry, farming and tourism industries had a
positive impact on different aspects of their local community ............................................................................ 53
Figure 15 Proportion of Victorian Green Triangle residents who felt the forestry, farming and tourism
industries had a positive impact on different aspects of their local community ................................................. 53
Figure 16 Proportion of SA Green Triangle residents who felt the forestry, farming and tourism industries had a
negative impact on different aspects of their local community ........................................................................... 54
Figure 17 Proportion of Victorian Green Triangle residents who felt the forestry, farming and tourism
industries had a negative impact on different aspects of their local community ................................................ 54

iv
Acknowledgments This study was funded by Forest and Wood Products Australia. Many businesses in Victoria and
South Australia contributed considerable time to this study, providing detailed information about
their operations and about the industry in the region more generally. We thank all those who
provided their time, effort and expertise to help inform the study. We also thank Dominic Peel, who
contributed analysis of data from the Australian Bureau of Statistics Census of Population and
Housing to this project.
v
Executive Summary
Introduction
The forest industry in Australia contributes to jobs and economic activity in many communities.
During the last decade, there has been little information on how the industry is changing in different
regions, in terms of the type and number of jobs generated, economic activity, or how residents of
forest-industry dependent communities view the industry and its effects.
Forest and Wood Products Australia has invested in research to produce up-to-date information on
the socio-economic impacts of the forest industry in Victoria, South Australia, Tasmania,
Queensland, Western Australia and parts of New South Wales. This report presents findings for the
forest industry in the Green Triangle, a region that includes the softwood and hardwood plantations
in south-west Victoria and south-east South Australia. The forest industry in other parts of Victoria is
examined in a separate report.
Methods
The data analysed for this report was drawn from (i) a survey of forest industry businesses
conducted in 2016 to 2017, in which 62% of businesses completed the survey, with data on the
remaining 38% obtained from industry experts, other businesses, and publicly available information;
(ii) the 2006, 2011 and 2016 Australian Bureau of Statistics (ABS) Census of Population and Housing,
(iii) economic modelling using EconSearch’s RISE regional input-output model; and (iv) the 2016
Regional Wellbeing Survey, used to examine perceptions of the forest industry by residents living in
communities in which the forest industry operates were measured.
The Green Triangle forest industry
The forest industry in the Green Triangle is based on production of wood and fibre from softwood
plantations and hardwood plantations grown in south west Victoria and south east South Australia,
as well as the processing of wood and fibre imported from other parts of Australia and other
countries. Softwood plantation logs harvested in the Green Triangle region are processed at 11 sites
located in the Green Triangle; some of these also processed small volumes of logs harvested outside
the Green Triangle (in other parts of Victoria and South Australia). Hardwood plantations are
predominantly harvested and processed into woodchips which are then exported. In addition to
producing wood and fibre, plantations in the Green Triangle provide a base for other socio-economic
activities including livestock grazing, bee keeping, and some recreational activities such as
bushwalking. The economic value of these other activities has not been estimated as part of this
report, which includes only the economic value of the fibre, wood and paper products produced
from plantations and native forest.
Understanding the forest industry
The forest in the Green Triangle includes wood and fibre production from hardwood plantations and
softwood plantations, as well as the processing of timber imported from other states and countries.
It has a supply chain with three distinct parts. In the first two parts – primary production and primary
processing - plantations are grown and harvested (primary production), and logs are processed into
primary products such as sawntimber, woodchips, pulp and paper (primary processing). In primary
vi
production and primary processing the jobs generated depend almost entirely on harvest of wood
and fibre from the Green Triangle, with only small volumes of logs imported for processing from
nearby locations in Victoria and South Australia. These ‘primary’ products are then either sold
directly into a range of markets, including a range of end uses in industries such as construction, or
sold for further processing into ‘secondary’ products by other processors. In the third part of the
supply chain, the ‘secondary processing’ sector, primary wood and fibre products are further
processed into a range of products (for example, cabinets, furniture, paper packaging products).
While these jobs still rely on wood and fibre as a key input in processing, the wood or fibre used can
be sourced either from wood and fibre grown in the Green Triangle, or from wood and fibre that has
been grown and undergone primary processing in other parts of Australia or other countries.
Which parts of the forest industry are analysed in this report?
This report primarily examines the primary production and primary processing part of the forest
industry. In addition, a limited amount of data on secondary processing is provided, drawing on
employment data from the Australian Bureau of Statistics (ABS) Census of Population and Housing.
Economic value
In 2015-16, the direct value of output generated by the Green Triangle forest industry at the point of
sale of primary processed products was $1,170 million, increasing to $1,909 million when flow-on
effects generated in other industries as a result of spending by the forest industry are included. This
$1,909 million included $532 million generated in the Victorian part of the Green Triangle, $1,273
million in the South Australian part of the region, and $104 million generated by ‘cross-border’
activity crossing both parts of the region. If examined based on economic contribution to the states
of South Australia and Victoria – a much larger region that captures more of the total economic
activity generated by the industry than the Green Triangle region - the total value of output of the
industry in 2015-16 increases substantially, contributing $3,238 million across the two states.
However, value of output is not always a good indicator of the industry’s overall contribution to the
local economy, as it does not identify the extent to which the economy of a given region benefited
from the industry’s activity in the form of returns to business owners, wages and salaries, and taxes.
Measuring the industry’s contribution to Gross Regional Product (GRP – the regional equivalent of
Gross Domestic Product) helps address this. Measures of GRP quantify the value added by the
industry to the local economy as a whole, meaning value contributed after subtracting non-wage
expenditure from revenue. In 2015-16, the forest industry directly contributed $382.9 million to GRP
in the Green Triangle, and a total of $729 million once flow-on effects through the entire economy
were included. This total included $318 million dependent on softwood plantation, $206 million
dependent on hardwood plantations, and $205 million dependent on plantations and forests grown
in other regions. The $729 million included $181 million in the Victorian part of the region, $505
million in the South Australian part of the region, and a further $43 million from activity only
captured when the parts are modelled together. If examined based on economic contribution to the
states of South Australia and Victoria – the industry’s total contribution to GRP in these two states is
substantially larger than it’s contribution to the Green Triangle economy, rising to $1,396 million,
including $534 million in Victoria and $862 million in South Australia.
vii
Employment
The forest industry in the Green Triangle generated a total of 2,344 direct jobs up to the point of sale
of primary processed products in the first half of 2017. The estimated flow-on employment
generated by this activity was an additional 2,903 jobs, meaning the industry contributed a total of
5,247 jobs to the Green Triangle up to and including primary processing once flow-on jobs are
included. In addition, a further estimated 250 direct jobs were generated in secondary processing.
Of the 2,344 direct jobs generated up to the point of sale of primary processed products:
• The majority (53%) were generated in the processing of wood and paper products
• Almost one-third (31%) were generated by harvest and haulage
• Just over two-thirds (69%) were generated in the softwood plantation sector, including 1260
jobs generated as a result of softwood plantations grown in the region and a further 363
jobs that relied on softwood plantations grown in other regions
• 29% of direct jobs were generated by hardwood plantations, the majority of which
depended on hardwood plantations grown within the Green Triangle (670 jobs compared to
15 dependent on hardwood plantations grown in other regions)
• 23% of the direct jobs up to primary processing generated by the Green Triangle forest
industry were based in the Victorian part of the region, and 77% in the South Australian part.
When examining direct jobs generated by location, including primary and secondary processing, the
forest industry directly generates 4% of all jobs in the Green Triangle, including 8% of employment in
the South Australian part of the Green Triangle, and 1% of those in the Victorian part. The largest
numbers of forest industry workers directly employed in the industry lived in the local government
areas (LGAs) of Mount Gambier (1,035 jobs up to primary processing, 1,171 jobs when secondary
processing is included), Wattle Range (495 jobs up to primary processing, 497 including secondary
processing), Glenelg (324 jobs and 328 including secondary processing) and Grant (276 jobs, growing
to 305 when secondary processing is included), while 172 jobs were located in the Southern
Grampians (189 including secondary processing). When examined as a proportion of the workforce,
these direct jobs (up to and including secondary processing, but not including flow-on jobs
generated in other industries) made up 10% of the workforce in Mount Gambier and Wattle Range,
8% in Grant, 4% in Glenelg, 3% in South Grampians, and 1% or less of the workforce in other LGAs in
the Green Triangle.
The survey data collected for this report differed in some respects to forest industry employment
estimates from the Australian Bureau of Statistics 2016 Census of Population and Housing (ABS 2016
Census). The 2016 Census recorded substantially fewer forest industry workers in the Victorian parts
of the Green Triangle than our survey. This is almost entirely because the Census data record a large
number of harvest and haulage workers as being employed in the transport industry, rather than
recording them as a part of the forest industry. On the South Australian side of the Green Triangle,
our survey data recorded very similar numbers of workers to the 2016 Census.
The number of workers employed in the forest, wood and paper industries recorded in the
Australian Bureau of Statistics Census of Population and Housing fell by 16% between 2006 and
2011, and by a further 5% between 2011 and 2016. The overall decline of 5% in jobs since 2011 is a
consequence of two different types of change: between 2011 and 2016, employment grew
viii
substantially in primary production, with growth of 73% in the number of jobs in the growing,
harvest and haulage of plantations; at the same time, employment in wood and paper product
manufacturing declined by 25% between 2011 and 2016.
Working conditions
Successfully recruiting and maintaining a strong workforce can be challenging for a regionally-based
industry, with many rural and regional areas having a relatively small labour force compared to
larger urban areas. The Green Triangle forest industry generates more full-time jobs than other
industries, with 88% of those employed in the industry working full-time, compared to 67% of the
broader workforce in the region. People employed in some parts of the industry work longer hours
than is typical in most industries, particularly those employed in harvest and haulage contracting
firms. Forest industry workers in the Green Triangle generally earn higher incomes than the average
for the region: in 2011, only 17% of full-time forest industry workers earned less than $600 per
week, compared to 33% of full-time workers in the Green Triangle, and 37% earned $1,250 or more
per week, compared to only 27% of full-time workers in the broader workforce of the region.
Workforce diversity and sustainability
To be sustainable over time, every industry needs to successfully recruit and retain workers. In the
Green Triangle, only 13% of forest industry workers were female in 2017 (compared to 46% of the
broader employed labour force). The industry’s workforce as of 2011 was slightly more likely to be
middle aged than the workforce as a whole in the region, and was ageing at a slightly slower rate to
the rest of the Green Triangle’s workforce.
When asked how easy or difficult they found it to recruit different types of workers, 70% of forest
industry businesses operating in the Green Triangle and Victoria reported finding it difficult to recruit
managers and high level professional staff, followed by transport workers (69% finding it difficult to
recruit staff), heavy machine operators (67%) and field staff (63%). Only 30% per cent found it
challenging to source finance/book keeping staff, and most businesses (57%) found it easy to source
administration staff. Two-thirds of plantation managers (67%) found it difficult recruiting harvest
contractors. Factors that made recruitment challenging included a lack of available workers with
appropriate skills (88% of businesses), lack of suitable workers based locally (65%), the time required
to build the right skills (59%), workers not wishing to shift to local areas (50%) and negative
perceptions of the industry (46%).
Industry skills and training needs
Forest industry businesses operating in the Green Triangle and Victoria were asked what types of
skills were needed by their workforce, whether they required workers to have formal accreditation
in these skills, and how they currently provided training. Businesses most commonly reported
needing workers with skills in occupational health and safety training (100% of businesses),
operation of heavy machinery (89%) and chainsaws (85%), compliance training (89%), business and
financial management (80%) and fire-fighting (70%). There was variation in needs for skills and
accreditation between businesses types, with some skills specialised to particular parts of the
industry.
ix
Businesses were also asked to identify whether they delivered skills training in different competency
areas via in-house training by other staff, in-house training by an expert, or training via a registered
training organisation (RTO). RTOs were most commonly used to provide training in forest ecology
and silviculture, hand-held machinery operation, road transport and driver training and heavy
machinery operation; in some cases this was supplemented by in-house training. RTOs were also the
most common methods for training in occupational health and safety training, business and financial
management, and fire-fighting, although less than 70% of businesses used RTOs and many
businesses opted for in-house training by other staff. Compliance training was delivered through an
RTO for just over half of all businesses, and in-house training by other staff or experts for most
remaining businesses was almost half, suggesting opportunities for additional provision of training in
this area through more formal mechanisms. In-house training was more common than use of a RTO
for marketing/sales, IT/software training, and community relations/engagement.
As of 2016, forest industry workers in most parts of the industry were less likely to have completed
high school than those working in other industries, were more likely to have a certificate
qualification, and less likely to have a Bachelor degree or other university qualification than the
average for the employed labour force.
Business and market outlook
Forest industry businesses were asked about the business and market conditions and challenges
they were experiencing, and the extent to which they could cope with difficult business conditions.
Fifty one per cent of businesses operating in the Green Triangle and Victoria described business
condition in early 2017 as ‘more challenging than usual’, 33% as ‘the same as usual’ and 16% as
‘easier than usual’. These questions help identify both areas of strength and areas of challenge being
experienced by the industry. Businesses were also asked whether they felt that, over the next 12
months, demand for their services or products were likely to grow, remain about the same, or
shrink. About half (51%) felt demand would remain the same, about one third (31%) felt that that
demand would grow and few (18%) that demand would reduce.
Businesses were asked to rate the extent to which different factors had been a challenge or
problems for their business in the last three years. The most common challenges in the last three
years were government regulation (61% of businesses reporting this as a big challenge), increasing
cost of labour (52%), difficulty obtaining labour (44%), rising input costs (41%) and lack of investment
in the industry (39%). Softwood plantation dependent businesses were more likely than others to
report that difficulty maintaining competitiveness with other similar businesses (29%), decreasing
prices (41%), and lack of demand (24%) were problems. Hardwood plantation dependent businesses
were more likely to report difficulty obtaining labour (75%) and lack of investment in the industry
(50%) as key issues.
Community perceptions of the social, economic, service and infrastructure effects of the forest
industry
To further evaluate the socio-economic effects of the forest industry in the communities in which it
operates, residents living the Green Triangle were asked about (i) their overall views about quality of
life and liveability of their community, and (ii) the extent to which they felt the different industries
that operated in their region affected different social and economic aspects of their lives. Overall,
x
residents living in forest industry dependent communities in the Green Triangle reported a similar
quality of life to those living in communities with less dependence on the industry.
Of those living in Green Triangle communities with higher dependence on the forest industry, most
reported that the forest industry was important to their local community, including 91% of those
living in the South Australian LGAs of Grant, Mount Gambier and Wattle Range, and 67% of those
living in the Victorian LGAs of Glenelg and Southern Grampians.
When asked to assess the effects they felt the forest industry had on their community, the large
majority of residents – 87% in the South Australian Green Triangle, 75% in the Victorian Green
Triangle - felt the forest industry had positive impacts on local employment. However, when asked
about contributions than employment, residents generally perceived the forest industry as having
fewer positive effects than the farming and tourism industries, and more negative effects. When
views about negative impacts were examined, the most common concerns reported about the forest
industry were related to road impacts, bushfire risk and landscape aesthetics.
Conclusions
This report quantifies the employment and economic activity generated by the forest industry, and
identifies the communities in which the industry generates a significant proportion of local jobs. The
analysis shows that the industry is an important contributor to the economy in several LGAs in the
Green Triangle, particularly in Mount Gambier, Wattle Range, and Grant. The majority of jobs
generated by the industry are generated by the processing sector, as is the majority of the flow-on
economic impact of the industry; however, these jobs have declined significantly over time, and this
decline has only been partially offset by growth in harvest and haulage jobs as the first rotation of
hardwood plantations has been harvested in the region. This highlights the importance of local
processing of wood and fibre for generation of jobs from the industry; far fewer jobs are created if
logs are harvested and exported with no or little processing. While relatively few businesses feel
demand will decline for their products, half report business conditions as being more challenging
than usual, and many find it difficult to recruit some types of workers. Increasing labour and input
costs and lack of investment in the industry are concerns for many businesses. The industry is
viewed by communities as contributing strongly to employment, but less to other aspects of quality
of life. The results highlight both the importance of the industry to the region, and a likely continuing
trend of loss of jobs in wood and paper manufacturing unless there is significant investment in
additional plantation estate or processing capacity in the region.
1
Introduction The forest industry in Australia contributes to jobs and economic activity in many communities. This
contribution results from the growing, management and harvesting of plantations and native forests
(primary production), and primary and secondary processing of logs into wood and fibre products
such as sawn timber for use in construction, appearance products such as flooring and decking,
woodchips for export, pulp and paper.
Like many other industries, Australia’s forest, wood and paper industries are changing rapidly, with
ongoing investment in new technology, skills and changing markets all contributing to evolving skills,
training and technology needs. During the last decade, there has been little information on how the
industry is changing in different regions, including change in the number of jobs generated,
dependence of different communities on the economic activity generated by the industry, the type
and quality of work generated in the industry, and how residents of forest-industry dependent
communities view the industry and its effects.
Forest and Wood Products Australia has invested in research to produce up-to-date information on
the socio-economic impacts of the forest industry in Victoria, South Australia, Tasmania,
Queensland, Western Australia and parts of New South Wales. This report presents findings for the
forest industry in the Green Triangle, a region that includes the softwood and hardwood plantations
in south-west Victoria and south-east South Australia. The forest industry in other parts of Victoria is
examined in a separate report. This report examines the following aspects of the Green Triangle’s
forest industry:
• Employment generated by the industry, including direct and flow-on jobs
• Economic value of the industry, including direct and flow-on economic activity
• Working conditions, workforce diversity, and workforce sustainability
• Skills and training needs for the forest industry
• Business and market outlook reported by businesses operating in the industry
• Community perceptions of the industry.
2
Methods The data analysed for this report was drawn from the following sources:
• 2016-17 Industry Survey: A survey of forest industry businesses operating in both Victoria
(examined in this report) and the Green Triangle (south west Victoria and south east South
Australia, reported in a separate report), conducted between February 2017 and May 2017.
As many businesses operate in both these regions, survey participation rates are reported
for both regions together. Of 156 key businesses (including nurseries, plantation
management businesses, silvicultural contractors, harvest and haulage contractors, and
wood and paper processors), 62% completed the survey, while 38% (60 businesses) did not
take part. A further 60 small contracting businesses were not asked to take part, with
information instead obtained via data provided by forest managers who used their services.
Of the 62% of the 156 surveyed businesses who completed the survey, 32 businesses
completed every question, including most large businesses operating in the industry, and 64
completed a shorter version over the phone. Most non-participants managed smaller
businesses, particularly contracting businesses. Information on businesses was identified
based on (i) information provided by forest and plantation managers on their use of
contracting services, (ii) information from past surveys, (iii) advice from industry experts
familiar with the businesses, and (iv) publicly available data on non-responding businesses.
• 2006, 2011 and 2016 Census: Data from the 2006, 2011 and 2016 Australian Bureau of
Statistics (ABS) Census of Population and Housing are drawn on to examine working
conditions of the industry’s workforce.
• Economic modelling: Economic modelling using EconSearch’s RISE regional input-output
model has been used to identify flow-on jobs and economic activity generated by the forest
industry.
• 2016 Regional Wellbeing Survey: Perceptions of the forest industry by residents living in
communities in which the forest industry operates were measured as part of the Regional
Wellbeing Survey, a large survey of 13,000 Australians living in regional and rural areas.
A detailed description of these methods is provided in Schirmer et al. (2017), as well as discussion of
key methodological considerations when examining social and economic effects of the industry.
3
Overview of the industry – Green Triangle The Green Triangle’s forest industry primarily includes wood and fibre production from softwood
plantations and hardwood plantations grown within south west Victoria and south east South
Australia, as well as processing of wood and fibre imported from other parts of Victoria and South
Australia, other states and other countries. While a very small amount of native forest management
occurs in the region of south west Victoria, this has been included in a separate report produced as
part of this study, examining socio-economic impacts of the forest industry in Victoria (excluding the
Green Triangle). The small number of workers who live in the Green Triangle and whose jobs depend
on native forests in other regions are included in job estimates in this report. This section briefly
describes the industry. First, the structure of the industry is examined, focusing on understanding
the industry supply chain from the growing of plantations in the Green Triangle to processing of a
range of products using both wood and fibre grown in the Green Triangle, and wood and fibre
sourced imported from other regions. The second part then examines the softwood plantation and
hardwood plantation sectors of the Green Triangle forest industry in more detail, focusing on the
location of the plantations these two key industry sectors depend on, and the type of processors
that utilise wood and fibre from each.
Industry structure The forest industry in the Green Triangle, like most of Australia, has a supply chain with three
distinct parts: primary production, primary processing and secondary processing. Primary production
involves the establishing, growing and harvesting of logs ready for primary processing. Primary
processing involves processing of roundwood (logs) into initial products such as sawn timber,
woodchips and basic pulp and paper products, and usually uses logs grown within a relatively short
distance of the processing plant (less than 200 kilometres in most cases). Secondary processing
involves further processing of these initial products into a wide range of further processed products,
and is less reliant on locally-grown timber, with secondary processors often importing their wood
and paper inputs from other states or other countries as well as purchasing them from local primary
processors. Each stage is described in more detail below.
1. Jobs generated in primary production of wood and fibre products. In this part of the industry,
trees are grown and harvested to produce roundwood (logs), in softwood and hardwood
plantations. The activities involved in primary production include management of plantations by
forest management businesses and agencies, silvicultural contractors, and harvesting and haulage of
logs to primary processors by harvest and haulage contractors.
2. Jobs generated up to and including primary processing of wood and fibre products. Primary
processing means processing of logs into initial products. This part of the industry is based mostly on
wood and fibre grown in the Green Triangle, with small volumes of logs and fibre products imported
for processing from other regions. This means that the primary production of logs and primary
processing combine to create a strongly inter-linked supply chain. This supply chain generates
employment and economic activity based on the management and harvesting of mostly Green
Triangle-grown logs for wood and fibre production from softwood plantations and hardwood
plantations. Harvested logs from plantations are processed from logs into a range of primary
products including sawn timber, composite wood products such as particleboard, and woodchips.
The products from primary processing are then either sold directly into a range of markets, including
4
a range of end uses in industries such as construction, or sold for further processing into ‘secondary’
products by other processors.
3. Jobs generated in ‘secondary’ processing. These ‘secondary’ jobs involve further processing of
primary processed wood and fibre (for example, rough sawn timber or paper) into a range of further
products (for example, cabinets, furniture, paper packaging products). While these jobs still rely on
wood and fibre as a key input in processing, the wood or fibre used is often combined with other
products (for example, fabric covers on furniture, plastic components), and it can be sourced either
from Green Triangle-grown wood and fibre or from wood and fibre that has been grown and
undergone primary processing in other parts of Australia or other countries prior to being imported
into the Green Triangle for secondary processing. In addition to primary processed products such as
sawntimber and woodchips entering secondary processing, the residues produced in primary
processing (for example, bark, sawdust and docking ends of logs) are also typically sold to businesses
such as firewood sellers, agricultural businesses for use as animal bedding, and garden and
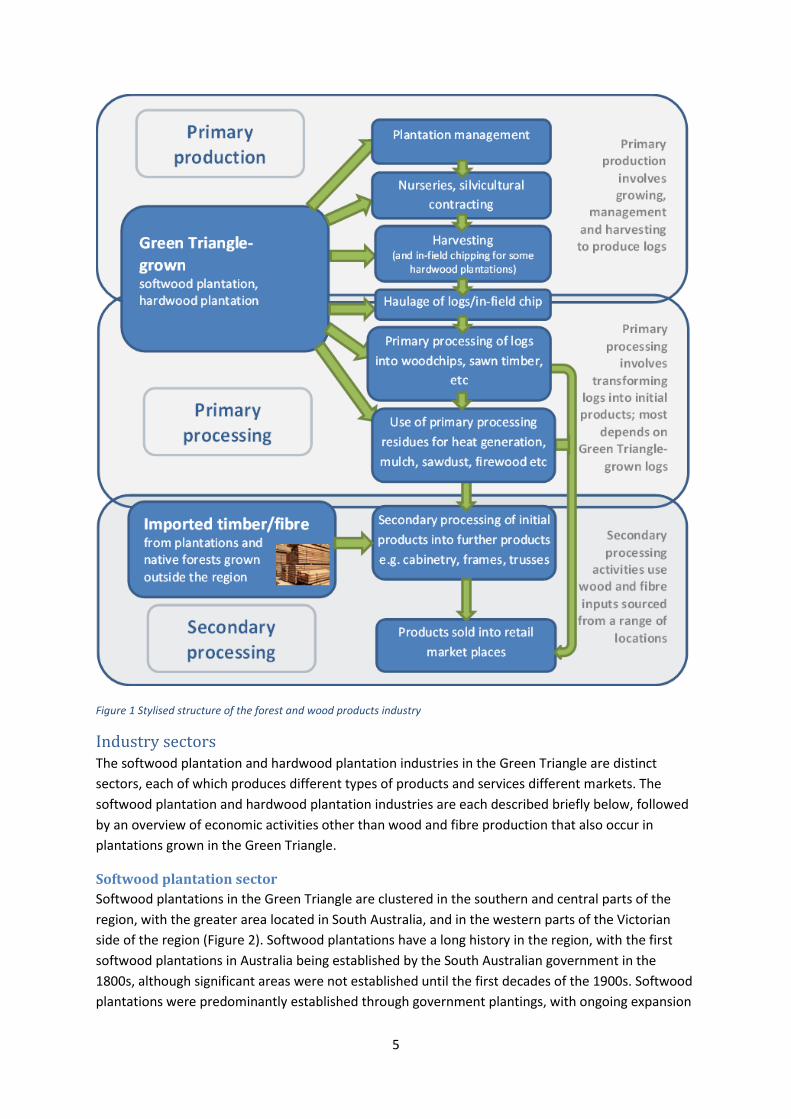
landscape businesses. Figure 1 provides a stylised representation of this structure.
This report focuses primarily on understanding the employment and activity generated by the
industry up to the ‘primary processing’ stage. The primary processing stage was defined for this
report as including all processors who take roundwood (logs) harvested from plantations or native
forests, and includes all products from those processors. In some cases, a single processor may
process roundwood into multiple products on a single site, including engaging in some activities
often considered part of the secondary processing sector. In these cases, all that processor’s
activities were included in the analysis.
In addition to examining the industry up to primary processing, basic data on secondary processing is
provided in this report, using data from the Australian Bureau of Statistics (ABS) Census of
Population and Housing to estimate the jobs generated in secondary processing of fibre and wood
products in the Green Triangle. However, these data do not enable identification of what proportion
of these jobs rely on wood or fibre from plantations grown in the Green Triangle versus in other
states or other countries.
5
Figure 1 Stylised structure of the forest and wood products industry
Industry sectors The softwood plantation and hardwood plantation industries in the Green Triangle are distinct
sectors, each of which produces different types of products and services different markets. The
softwood plantation and hardwood plantation industries are each described briefly below, followed
by an overview of economic activities other than wood and fibre production that also occur in
plantations grown in the Green Triangle.
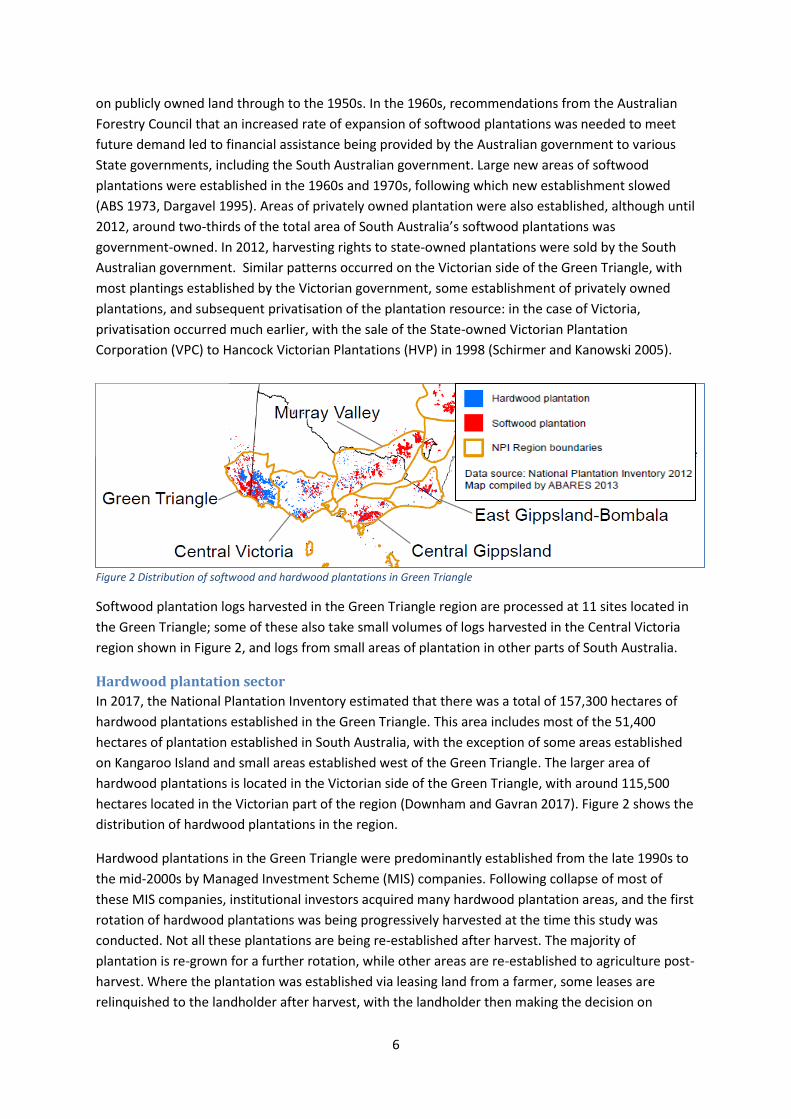
Softwood plantation sector
Softwood plantations in the Green Triangle are clustered in the southern and central parts of the
region, with the greater area located in South Australia, and in the western parts of the Victorian
side of the region (Figure 2). Softwood plantations have a long history in the region, with the first
softwood plantations in Australia being established by the South Australian government in the
1800s, although significant areas were not established until the first decades of the 1900s. Softwood
plantations were predominantly established through government plantings, with ongoing expansion
6
on publicly owned land through to the 1950s. In the 1960s, recommendations from the Australian
Forestry Council that an increased rate of expansion of softwood plantations was needed to meet
future demand led to financial assistance being provided by the Australian government to various
State governments, including the South Australian government. Large new areas of softwood
plantations were established in the 1960s and 1970s, following which new establishment slowed
(ABS 1973, Dargavel 1995). Areas of privately owned plantation were also established, although until
2012, around two-thirds of the total area of South Australia’s softwood plantations was
government-owned. In 2012, harvesting rights to state-owned plantations were sold by the South
Australian government. Similar patterns occurred on the Victorian side of the Green Triangle, with
most plantings established by the Victorian government, some establishment of privately owned
plantations, and subsequent privatisation of the plantation resource: in the case of Victoria,
privatisation occurred much earlier, with the sale of the State-owned Victorian Plantation
Corporation (VPC) to Hancock Victorian Plantations (HVP) in 1998 (Schirmer and Kanowski 2005).
Figure 2 Distribution of softwood and hardwood plantations in Green Triangle
Softwood plantation logs harvested in the Green Triangle region are processed at 11 sites located in
the Green Triangle; some of these also take small volumes of logs harvested in the Central Victoria
region shown in Figure 2, and logs from small areas of plantation in other parts of South Australia.
Hardwood plantation sector
In 2017, the National Plantation Inventory estimated that there was a total of 157,300 hectares of
hardwood plantations established in the Green Triangle. This area includes most of the 51,400
hectares of plantation established in South Australia, with the exception of some areas established
on Kangaroo Island and small areas established west of the Green Triangle. The larger area of
hardwood plantations is located in the Victorian side of the Green Triangle, with around 115,500
hectares located in the Victorian part of the region (Downham and Gavran 2017). Figure 2 shows the
distribution of hardwood plantations in the region.
Hardwood plantations in the Green Triangle were predominantly established from the late 1990s to
the mid-2000s by Managed Investment Scheme (MIS) companies. Following collapse of most of
these MIS companies, institutional investors acquired many hardwood plantation areas, and the first
rotation of hardwood plantations was being progressively harvested at the time this study was
conducted. Not all these plantations are being re-established after harvest. The majority of
plantation is re-grown for a further rotation, while other areas are re-established to agriculture post-
harvest. Where the plantation was established via leasing land from a farmer, some leases are
relinquished to the landholder after harvest, with the landholder then making the decision on
7
whether or not to re-grow the plantation, either from coppice growth from stumps or replanting
new seedlings, or to revert the land use back to agriculture. Almost all hardwood plantation timber
is either woodchipped as part of the harvest process (in-field chipping) and sent to export facilities,
or sent to a woodchip mill for woodchipping and export.
Other activities In addition to producing fibre to supply the wood and paper processing industry in the Green
Triangle, plantations in the Green Triangle provide a base for other socio-economic activities.
Plantation managers reported a range of activities occurring on the land they managed:
• Livestock grazing: This occurred on several thousand hectares of plantation land
• Bee keeping: Bee keeping occurred on many areas of plantation land, including in hardwood
plantations and in areas of native vegetation on plantation land (for example, native
vegetation occurring in riparian areas within a plantation)
• Bushwalking, horse riding and camping areas: These activities were available on some areas
of plantation land
• Hunting: Recreational hunting occurred in some plantation areas.
The economic value of these other activities has not been estimated as part of this report, which
focuses on the economic value of the fibre, wood and paper products produced by the forest
industry in the Green Triangle.
8
Economic value This section examines the economic value generated by the forest industry in the Green Triangle. .
As economic value can be estimated using multiple approaches, we first describe the measures used
in this report. This is followed by analysis of:
(i) the direct value of the industry – the value of the activity generated by the forest
industry, without including flow-on effects of this activity through the broader economy,
and
(ii) the total economic value of the industry, which includes both economic activity
generated directly by forest industry businesses, and the flow-on effects of this activity
through the broader economy.
Measuring economic impact A number of economic indicators can be used to examine the value of an industry and estimate its
impact on a specific regional economy. These range from simple measures of expenditure, to
modelled estimates of the net contribution of an industry to the total value of economic activity in a
given region (Gross Regional Production, or GRP). This section explains the measures used in this
report, and why each is used.
Categories of economic impact
When using any measure of economic impact – whether it is value of output, expenditure by an
industry, contribution of an industry to GRP, or generation of employment – it is possible to model
this with a focus solely on the industry’s direct activities, or with a broader focus on how these
activities flow-on through the economy. In this report, we model economic impact based on (i)
direct impacts of the industry, and (ii) total impacts which are the sum of direct impacts plus flow-on
(indirect) impacts of the industry across the whole economy:
• Direct impact is generated directly by firms, businesses and organisations engaged in a
particular industry, in this case the forest industry.
• Flow-on or indirect impacts are the economic activity generated in other industries as a
result of the activity of the forest industry. Total flow-on or indirect impact is the sum of
production-induced and consumption-induced impacts.
o Production-induced impact is generated by businesses outside the forest industry
that supply forest industry businesses. It also includes impacts generated by the
suppliers of those suppliers and so on as successive waves of impact occur in the
economy.
o Consumption-induced impact is generated when workers involved in the forest
industry, and in businesses that supply the forest industry, spend their wages on
goods and services. The impact generated as a result of spending of wages on these
goods and services is consumption-induced.
• Total impact is the sum of direct and flow-on (or indirect) impacts.
When calculating direct and total economic value in this report, the forest industry is treated as a
vertically integrated industry (one part of the industry supplies goods and services to the next in a
chain of supply), in which there are transfers between different parts of the industry at each point in
9
the supply chain. When calculating economic value of a vertically integrated industry, transfers
between forest industry businesses are cancelled out so economic value can be quantified in terms
of the interaction between the forest industry and the rest of the economy. Unless otherwise
specified, all economic value estimates have excluded transfers occurring within the forest industry.
Direct and flow-on (indirect) impacts of the industry are estimated using four key measures of
economic impact: value of output, value of industry expenditure, contribution to GRP, and
employment.
Value of output
The total value of output of an industry is a relatively simple measure: it is the total revenue earned
by forest industry businesses from sales of goods and services. This provides useful information
about the total economic size of an industry and its output. When reporting value of output, it is
important to estimate value at a specific ‘end point of sale’ – i.e. a particular point in the supply
chain. In this report, the ‘end point of sale’ is the value of the sale of goods from primary processing.
Note that this value excludes sales of products and services between industry businesses at earlier
points in the forest industry supply chain to avoid double counting.
While this indicator provides a useful estimate of total value of an industry at a particular stage of
production – in this case, at the point of sale of primary processed wood and paper products – it
does not provide substantial information about how that industry has contributed to the local
economy, for two key reasons. First, it doesn’t consider the cost of producing the output. For
example, an industry with a turnover (output) of two billion dollars and expenditure on goods and
services of two billion dollars creates less value-add than one that has a turnover of two billion
dollars and expenditure on goods and services of one billion dollars. Secondly, it matters where
expenditures occur when considering flow-on impact. For example, an industry might generate two
billion dollars of sales in a given region, but rely largely on imported goods and services to produce
its output, generating very little local spending or employment as a result. Another industry,
meanwhile, might also generate two billion dollars of sales, but do this through a locally-based
supply chain, generating substantial jobs and expenditure in the local area as a result. To better
understand this, economic modelling can be used to estimate how much additional value of output
is generated in other industries in a given region as a result of the expenditure of the forest industry
in that region. This can be done by modelling production-induced and consumption-induced effects,
as defined earlier.
Given the importance of expenditure to understand how an industry contributes to an economy, it
follows that the amount and location of expenditure should be considered when determining the
economic value of an industry to a region.
Industry expenditure
Industry activity can also be measured by examining value of expenditure. This indicator measures
how much is spent by the industry on goods and services as part of generating the final goods and
services sold. When measured at regional level, this indicator provides an idea of the extent to which
the industry contributes to the economy locally, as it will show how much the industry has spent
within the region versus outside it.
10
Measures of expenditure differ to value of output, for a range of reasons. In particular, expenditure
excludes business profits (which are captured in value of output), expenditure can sometimes be
higher than value of sales over a given period depending on business investment and timing of
production; and not all the expenditure used to produce a given amount of output will have
occurred in the region in which expenditure is being estimated. For example, a business may
generated $1 million in sales in a given region, but only spend $200,000 in that region as part of
generating those sales, with the business purchasing most goods and services from other regions as
part of the production process.
Value of expenditure can be measured in two ways, both of which are presented in this report:
• Gross expenditure – total expenditure by all forest industry businesses, including spending
within and outside the industry. This means some expenditure is ‘double counted’ as it
involves ‘within industry transfers’. For example, if expenditure by a wood processor
purchasing logs from a plantation growing company is included as well as the expenditure
incurred by that company in growing the plantations, this results in ‘double counting’: the
gross expenditure includes the amount spent by the processor on the logs, and also includes
the amount spent by growers to produce those logs. Because of this double counting, gross
expenditure does not indicate the extent to which spending by the industry contributes to
the broader economy.
• Net expenditure – expenditure by the forest industry excluding transfers within the industry.
This measure excludes payments made by businesses in one part of the industry to
businesses in another part of the industry. It is a better indicator of the overall economic
activity the industry provides to the local economy, as it identifies the net expenditure the
industry as a whole contributes to the rest of the economy.
Industry expenditure is a useful indicator and provides more concrete data on the extent to which
production of wood and paper products results in local economic activity compared to value of
output measures. However, it is still subject to some problems of double counting: if the net
expenditure of all industries in a region is added together, it will result in a value that is larger than
the total value of production in that economy. This is due to the multiple transactions occurring
between different industries in any given economy, some of which are double counted when
expenditure of each individual industry is added together. This potential for double counting means
it is also important to identify the net contribution of the industry to a regional economy, after
taking into account the interactions between all sectors of the economy. This is done through
identifying industry contribution to Gross Regional Production (GRP), described below.
Industry contribution to Gross Regional Product (GRP)
Gross Regional Product (GRP) is the total value of economic production in a region over a period of
time. This can be defined as the sale value of all final goods and services produced in a region over a
given period, less the expenditure on goods and services used to produce them (such as fuel,
utilities, wood and fibre, accountants, office supplies, etc.). Operating a business requires more than
just goods and services as inputs, it also requires capital (such as vehicles, machines and buildings),
labour and land. These are known as ‘primary factors of production’ and GRP is the total amount
paid to the owners of these primary factors. Workers ‘own’ labour and are paid a wage for it,
business owners own land and/or capital and are paid a profit for them. Different types of
11
businesses use different amounts of each primary factor. For example, a forest plantation uses
relatively more land and less capital than a sawmill.
GRP includes taxes because it concerns the whole economy, not just business. Even though business
pays some profit to governments, that value is just a transfer within the economy of value that
business produced. By the same logic, donations made by the business are also included in GRP.
Annuities paid by growers are payments to the owner of the land used in production. While these
are costs to businesses, they are income to owners of land so are included in GRP.
This report describes the direct and total contribution to GRP of the forest industry. The direct
contribution to GRP is the GRP created by forest businesses themselves. Total contribution to GRP is
the GRP created by forest businesses, plus the proportion of GRP created in the rest of the economy
of Victoria due to the flow-on demand created by the forest industry (the production-induced and
consumption induced flow-on effects described earlier). GRP is the preferred measure of economic
contribution because it avoids the problem of double counting that can arise from using value of
output or industry expenditure.
Employment
Subsequent parts of this report describe the employment generated by the forest industry in detail.
Employment is defined in this report as the total number of people employed in the industry. It is
measured as both direct employment (generated by the forest industry) and flow-on/indirect
employment generated in other industries as a result of forest industry activity.
Employment in this report is reported based on the total number of people employed, rather than
full-time equivalents (FTE). This is done for two reasons: first, because a person whose job is in the
industry is likely to rely on that income for their livelihood irrespective of whether the job is part-
time or full-time; and second, because data from other sources such as the Australian Bureau of
Statistics (ABS) measure jobs in terms of numbers of people, not FTE.
Direct economic value This section examines the ‘direct’ value of the industry, meaning the value of the output produced
by the industry, expenditure made by the industry, and the subsequent contribution of the industry
to GRP. These direct estimates do not take into account the flow-on, or indirect, activity that is
generated in other parts of the economy as a result of forest industry activity. This information
provides context on the overall economic size of the industry and its activities. The next section then
examines the total economic contribution of the industry after taking into account interactions
between the forest industry and other parts of the economy.
Direct value of output of the Green Triangle forest industry
In 2015-16, the direct value of output from the Green Triangle forest industry at the point of sale of
primary processed products was $1,170 million. This excludes sales of products or services occurring
at earlier points in the supply chain prior to primary processing, to avoid double counting. This
included $430 million of sales generated by the softwood plantation sector, $334 million in sales of
products produced from hardwood plantations grown in the region, and $406 million in sales of
products processed in the Green Triangle using logs from forests and plantations grown in other
regions (for example, hardwood plantations in Central Victoria that are harvested and in-field
woodchipped by contractors who live in the Green Triangle, and exported as woodchips through the
12
Portland export facility in the Victorian part of the Green Triangle). The figure of $1,170 million does
not include the value of the output generated by secondary processing which, as described earlier,
generates additional value and draws on both wood and fibre produced in the Green Triangle, and
on wood and fibre products imported from other states or from other countries.
Direct expenditure by the Green Triangle forest industry
Value of output does not always provide a picture of the extent to which an industry contributes
directly to the region it is located in. Examining expenditure helps to answer questions such as
whether industry expenditure largely occurs locally, or is mostly occurring some distance from the
region in which the business is located.
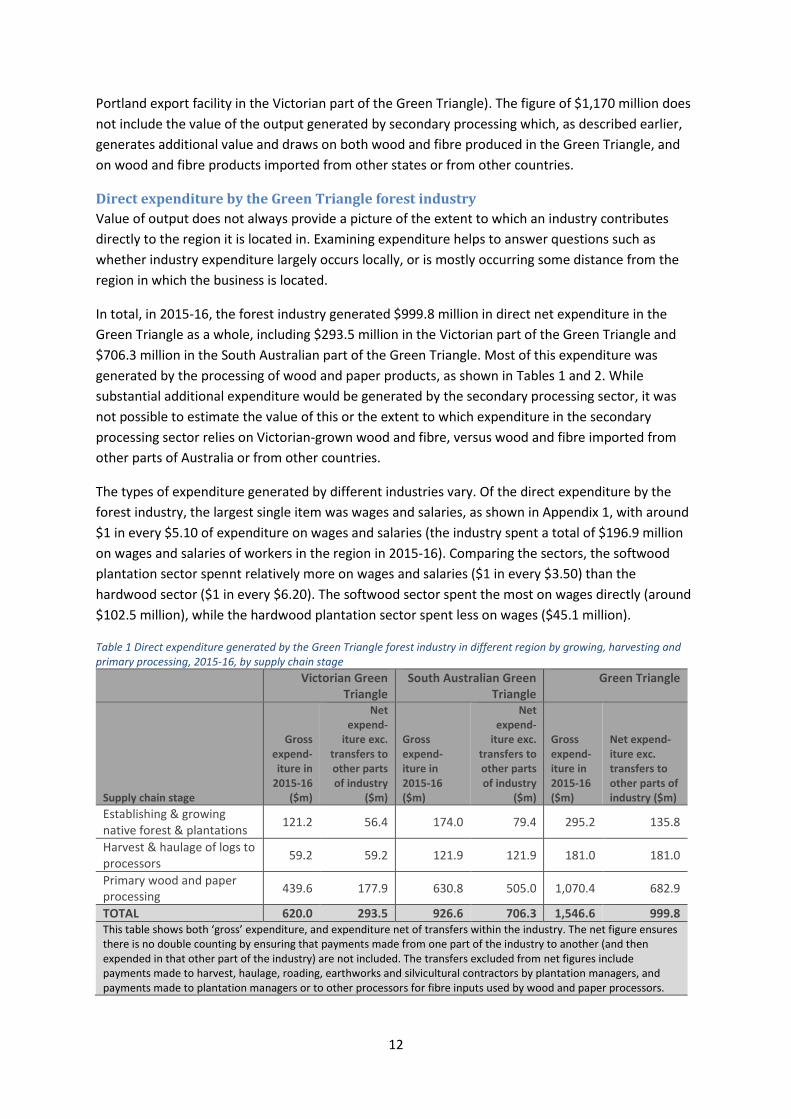
In total, in 2015-16, the forest industry generated $999.8 million in direct net expenditure in the
Green Triangle as a whole, including $293.5 million in the Victorian part of the Green Triangle and
$706.3 million in the South Australian part of the Green Triangle. Most of this expenditure was
generated by the processing of wood and paper products, as shown in Tables 1 and 2. While
substantial additional expenditure would be generated by the secondary processing sector, it was
not possible to estimate the value of this or the extent to which expenditure in the secondary
processing sector relies on Victorian-grown wood and fibre, versus wood and fibre imported from
other parts of Australia or from other countries.
The types of expenditure generated by different industries vary. Of the direct expenditure by the
forest industry, the largest single item was wages and salaries, as shown in Appendix 1, with around
$1 in every $5.10 of expenditure on wages and salaries (the industry spent a total of $196.9 million
on wages and salaries of workers in the region in 2015-16). Comparing the sectors, the softwood
plantation sector spennt relatively more on wages and salaries ($1 in every $3.50) than the
hardwood sector ($1 in every $6.20). The softwood sector spent the most on wages directly (around
$102.5 million), while the hardwood plantation sector spent less on wages ($45.1 million).
Table 1 Direct expenditure generated by the Green Triangle forest industry in different region by growing, harvesting and primary processing, 2015-16, by supply chain stage
Victorian Green
Triangle South Australian Green
Triangle Green Triangle
Supply chain stage
Gross expend-iture in
2015-16 ($m)
Net expend-
iture exc. transfers to other parts of industry
($m)
Gross expend-iture in 2015-16 ($m)
Net expend-
iture exc. transfers to other parts of industry
($m)
Gross expend-iture in 2015-16 ($m)
Net expend-iture exc. transfers to other parts of industry ($m)
Establishing & growing native forest & plantations
121.2 56.4 174.0 79.4 295.2 135.8
Harvest & haulage of logs to processors
59.2 59.2 121.9 121.9 181.0 181.0
Primary wood and paper processing
439.6 177.9 630.8 505.0 1,070.4 682.9
TOTAL 620.0 293.5 926.6 706.3 1,546.6 999.8 This table shows both ‘gross’ expenditure, and expenditure net of transfers within the industry. The net figure ensures there is no double counting by ensuring that payments made from one part of the industry to another (and then expended in that other part of the industry) are not included. The transfers excluded from net figures include payments made to harvest, haulage, roading, earthworks and silvicultural contractors by plantation managers, and payments made to plantation managers or to other processors for fibre inputs used by wood and paper processors.
13
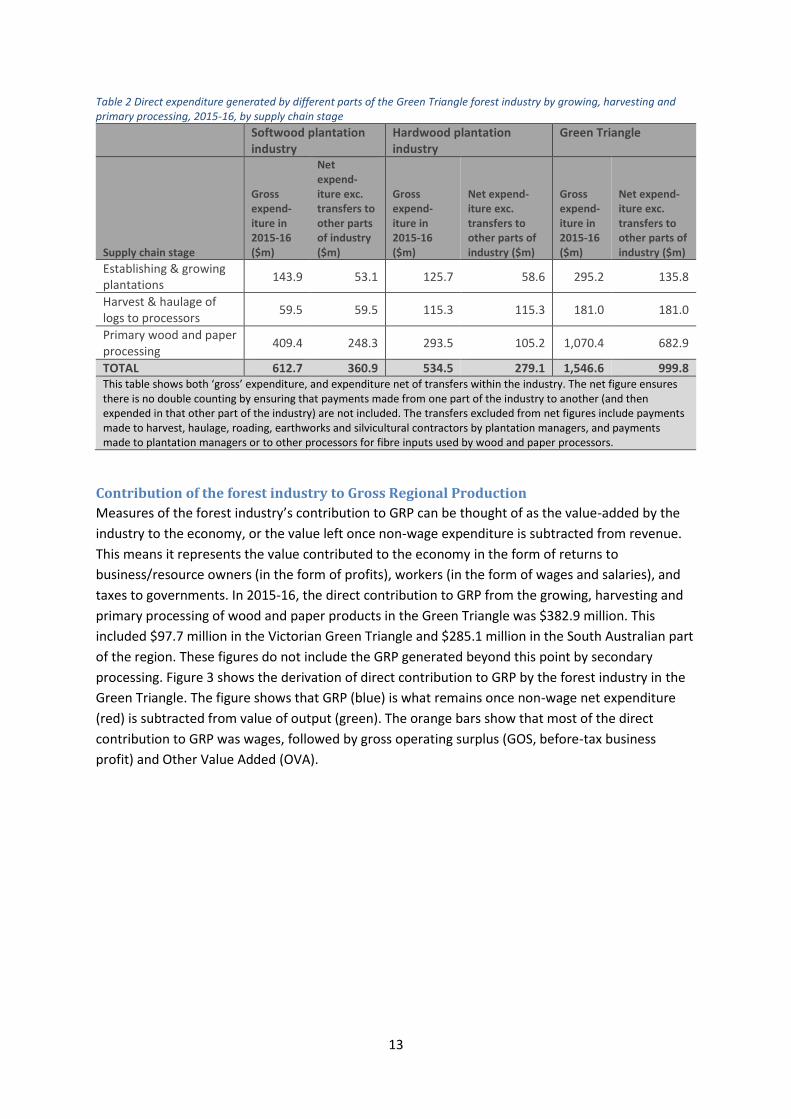
Table 2 Direct expenditure generated by different parts of the Green Triangle forest industry by growing, harvesting and primary processing, 2015-16, by supply chain stage
Softwood plantation industry
Hardwood plantation industry
Green Triangle
Supply chain stage
Gross expend-iture in 2015-16 ($m)
Net expend-iture exc. transfers to other parts of industry ($m)
Gross expend-iture in 2015-16 ($m)
Net expend-iture exc. transfers to other parts of industry ($m)
Gross expend-iture in 2015-16 ($m)
Net expend-iture exc. transfers to other parts of industry ($m)
Establishing & growing plantations
143.9 53.1 125.7 58.6 295.2 135.8
Harvest & haulage of logs to processors
59.5 59.5 115.3 115.3 181.0 181.0
Primary wood and paper processing
409.4 248.3 293.5 105.2 1,070.4 682.9
TOTAL 612.7 360.9 534.5 279.1 1,546.6 999.8 This table shows both ‘gross’ expenditure, and expenditure net of transfers within the industry. The net figure ensures there is no double counting by ensuring that payments made from one part of the industry to another (and then expended in that other part of the industry) are not included. The transfers excluded from net figures include payments made to harvest, haulage, roading, earthworks and silvicultural contractors by plantation managers, and payments made to plantation managers or to other processors for fibre inputs used by wood and paper processors.
Contribution of the forest industry to Gross Regional Production
Measures of the forest industry’s contribution to GRP can be thought of as the value-added by the
industry to the economy, or the value left once non-wage expenditure is subtracted from revenue.
This means it represents the value contributed to the economy in the form of returns to
business/resource owners (in the form of profits), workers (in the form of wages and salaries), and
taxes to governments. In 2015-16, the direct contribution to GRP from the growing, harvesting and
primary processing of wood and paper products in the Green Triangle was $382.9 million. This
included $97.7 million in the Victorian Green Triangle and $285.1 million in the South Australian part
of the region. These figures do not include the GRP generated beyond this point by secondary
processing. Figure 3 shows the derivation of direct contribution to GRP by the forest industry in the
Green Triangle. The figure shows that GRP (blue) is what remains once non-wage net expenditure
(red) is subtracted from value of output (green). The orange bars show that most of the direct
contribution to GRP was wages, followed by gross operating surplus (GOS, before-tax business
profit) and Other Value Added (OVA).
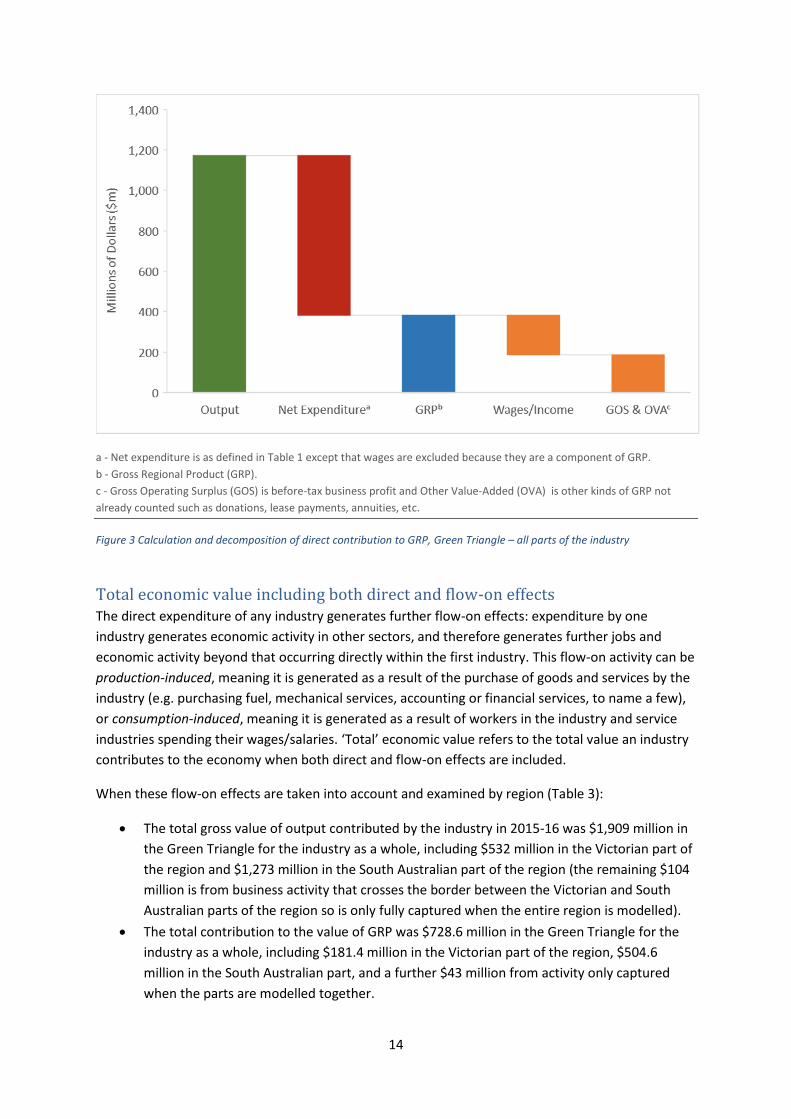
14
a - Net expenditure is as defined in Table 1 except that wages are excluded because they are a component of GRP.
b - Gross Regional Product (GRP).
c - Gross Operating Surplus (GOS) is before-tax business profit and Other Value-Added (OVA) is other kinds of GRP not
already counted such as donations, lease payments, annuities, etc.
Figure 3 Calculation and decomposition of direct contribution to GRP, Green Triangle – all parts of the industry
Total economic value including both direct and flow-on effects The direct expenditure of any industry generates further flow-on effects: expenditure by one
industry generates economic activity in other sectors, and therefore generates further jobs and
economic activity beyond that occurring directly within the first industry. This flow-on activity can be
production-induced, meaning it is generated as a result of the purchase of goods and services by the
industry (e.g. purchasing fuel, mechanical services, accounting or financial services, to name a few),
or consumption-induced, meaning it is generated as a result of workers in the industry and service
industries spending their wages/salaries. ‘Total’ economic value refers to the total value an industry
contributes to the economy when both direct and flow-on effects are included.
When these flow-on effects are taken into account and examined by region (Table 3):
• The total gross value of output contributed by the industry in 2015-16 was $1,909 million in
the Green Triangle for the industry as a whole, including $532 million in the Victorian part of
the region and $1,273 million in the South Australian part of the region (the remaining $104
million is from business activity that crosses the border between the Victorian and South
Australian parts of the region so is only fully captured when the entire region is modelled).
• The total contribution to the value of GRP was $728.6 million in the Green Triangle for the
industry as a whole, including $181.4 million in the Victorian part of the region, $504.6
million in the South Australian part, and a further $43 million from activity only captured
when the parts are modelled together.
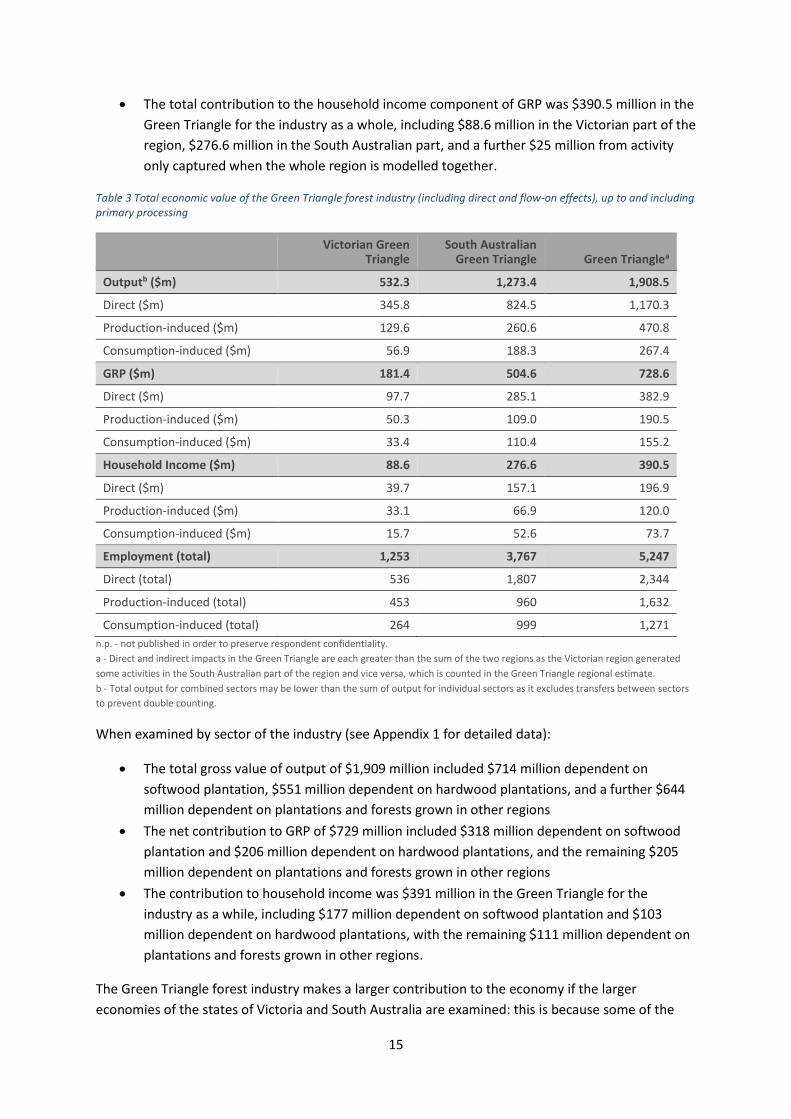
15
• The total contribution to the household income component of GRP was $390.5 million in the
Green Triangle for the industry as a whole, including $88.6 million in the Victorian part of the
region, $276.6 million in the South Australian part, and a further $25 million from activity
only captured when the whole region is modelled together.
Table 3 Total economic value of the Green Triangle forest industry (including direct and flow-on effects), up to and including primary processing
Victorian Green
Triangle South Australian
Green Triangle Green Trianglea
Outputb ($m) 532.3 1,273.4 1,908.5
Direct ($m) 345.8 824.5 1,170.3
Production-induced ($m) 129.6 260.6 470.8
Consumption-induced ($m) 56.9 188.3 267.4
GRP ($m) 181.4 504.6 728.6
Direct ($m) 97.7 285.1 382.9
Production-induced ($m) 50.3 109.0 190.5
Consumption-induced ($m) 33.4 110.4 155.2
Household Income ($m) 88.6 276.6 390.5
Direct ($m) 39.7 157.1 196.9
Production-induced ($m) 33.1 66.9 120.0
Consumption-induced ($m) 15.7 52.6 73.7
Employment (total) 1,253 3,767 5,247
Direct (total) 536 1,807 2,344
Production-induced (total) 453 960 1,632
Consumption-induced (total) 264 999 1,271
n.p. - not published in order to preserve respondent confidentiality.
a - Direct and indirect impacts in the Green Triangle are each greater than the sum of the two regions as the Victorian region generated
some activities in the South Australian part of the region and vice versa, which is counted in the Green Triangle regional estimate.
b - Total output for combined sectors may be lower than the sum of output for individual sectors as it excludes transfers between sectors
to prevent double counting.
When examined by sector of the industry (see Appendix 1 for detailed data):
• The total gross value of output of $1,909 million included $714 million dependent on
softwood plantation, $551 million dependent on hardwood plantations, and a further $644
million dependent on plantations and forests grown in other regions
• The net contribution to GRP of $729 million included $318 million dependent on softwood
plantation and $206 million dependent on hardwood plantations, and the remaining $205
million dependent on plantations and forests grown in other regions
• The contribution to household income was $391 million in the Green Triangle for the
industry as a while, including $177 million dependent on softwood plantation and $103
million dependent on hardwood plantations, with the remaining $111 million dependent on
plantations and forests grown in other regions.
The Green Triangle forest industry makes a larger contribution to the economy if the larger
economies of the states of Victoria and South Australia are examined: this is because some of the
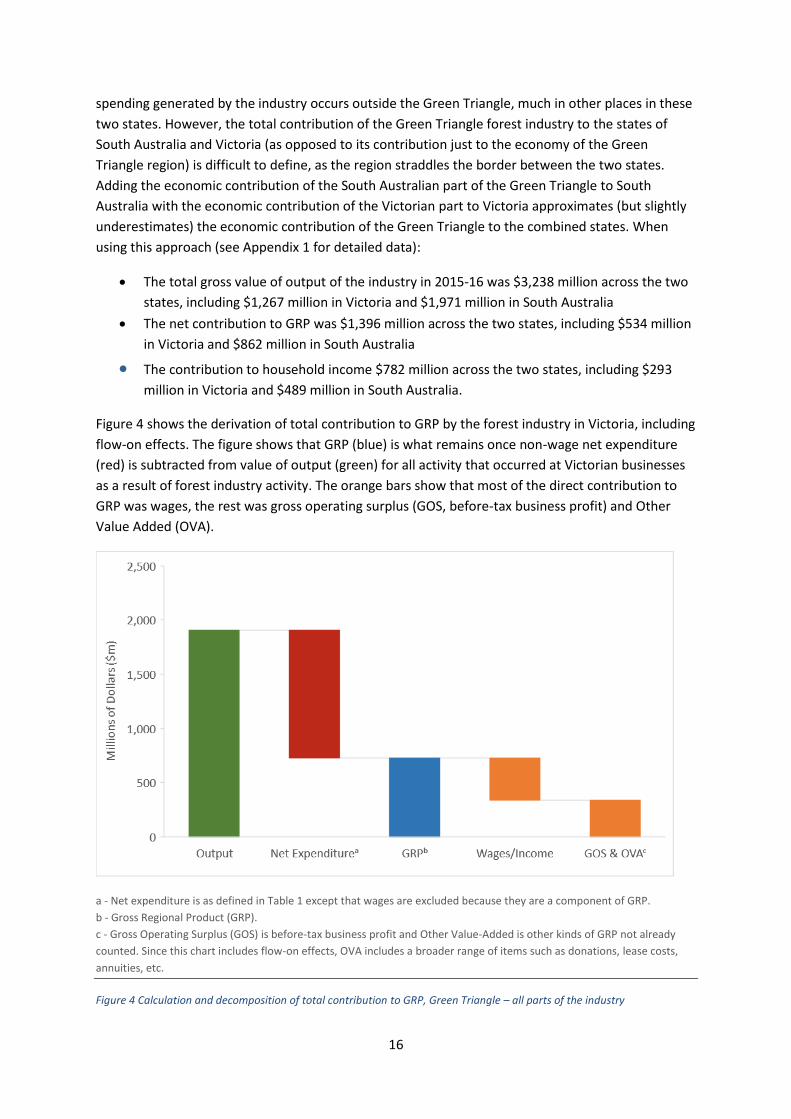
16
spending generated by the industry occurs outside the Green Triangle, much in other places in these
two states. However, the total contribution of the Green Triangle forest industry to the states of
South Australia and Victoria (as opposed to its contribution just to the economy of the Green
Triangle region) is difficult to define, as the region straddles the border between the two states.
Adding the economic contribution of the South Australian part of the Green Triangle to South
Australia with the economic contribution of the Victorian part to Victoria approximates (but slightly
underestimates) the economic contribution of the Green Triangle to the combined states. When
using this approach (see Appendix 1 for detailed data):
• The total gross value of output of the industry in 2015-16 was $3,238 million across the two
states, including $1,267 million in Victoria and $1,971 million in South Australia
• The net contribution to GRP was $1,396 million across the two states, including $534 million
in Victoria and $862 million in South Australia
• The contribution to household income $782 million across the two states, including $293
million in Victoria and $489 million in South Australia.
Figure 4 shows the derivation of total contribution to GRP by the forest industry in Victoria, including
flow-on effects. The figure shows that GRP (blue) is what remains once non-wage net expenditure
(red) is subtracted from value of output (green) for all activity that occurred at Victorian businesses
as a result of forest industry activity. The orange bars show that most of the direct contribution to
GRP was wages, the rest was gross operating surplus (GOS, before-tax business profit) and Other
Value Added (OVA).
a - Net expenditure is as defined in Table 1 except that wages are excluded because they are a component of GRP.
b - Gross Regional Product (GRP).
c - Gross Operating Surplus (GOS) is before-tax business profit and Other Value-Added is other kinds of GRP not already
counted. Since this chart includes flow-on effects, OVA includes a broader range of items such as donations, lease costs,
annuities, etc.
Figure 4 Calculation and decomposition of total contribution to GRP, Green Triangle – all parts of the industry
17
Employment The forest industry in the Green Triangle generates a total of 2,344 direct jobs up to the point of
primary processing. The estimated flow-on employment generated by this activity is an additional
2,903 jobs, meaning the industry contributes a total of 5,247 jobs in the economy up to and
including primary processing once flow-on jobs are included. In addition, a further estimated 250
direct jobs are generated in secondary processing1.
Direct employment As shown in Tables 4 and 5, the forest industry in the Green Triangle generated 2,344 direct jobs up
to the point of primary processing in the first half of 20172, and 2,594 when secondary processing
jobs are included. ‘Direct’ jobs include jobs that depend on the presence of the industry, in
nurseries, silvicultural contracting, harvest and haulage of logs to processors, and processing of logs
and residues into wood and paper products. They do not include jobs generated in mechanical
services, fuel supply, or supply of other goods and services to the industry, which are included in
flow-on employment. The majority of jobs up to the point of primary processing – 53% – are
generated in the processing of wood and paper products, while 31% are generated by harvest and
haulage. This is different to other regions, with a relatively higher proportion of jobs generated by
harvest and haulage compare to others. This reflects the increase in harvest and haulage jobs
associated with harvest of the first rotation of hardwood plantations in the region; as these
plantations are often woodchipped on site using in-field chipping, harvest and haulage employment
includes employment generated by in-field chipping. As there is no employment generated in
primary processing of hardwood plantations beyond woodchip production and export, the increase
in harvest of these plantations has increased the proportion of harvest and haulage contractors
without a substantial increase in primary processing employment.
When direct jobs up to the point of primary processing are compared, the majority (69%) are
generated by softwood plantations, including 1260 jobs that depend on softwood plantations grown
in the region and a further 363 jobs that rely on softwood plantations grown in other regions. A
further 29% are generated by hardwood plantations, the majority of which depend on hardwood
plantations grown within the Green Triangle (670 jobs compared to 15 dependent on hardwood
plantations grown in other regions). A small amount of jobs (36) are generated by native forest and
unidentified plantations (for example, a small amount of contracts living in the region work
harvesting native forest in parts of Central Victoria). There is regional variation as well, with 23% of
all jobs generated being based in the Victorian part of the region, and 77% in the South Australian
part.
1 See Appendix 2 for a detailed description of how jobs were classified into primary versus secondary processing. 2 This figure includes some jobs in manufacturing of wood and paper products that depend on raw materials (logs, pulp) imported from other regions.
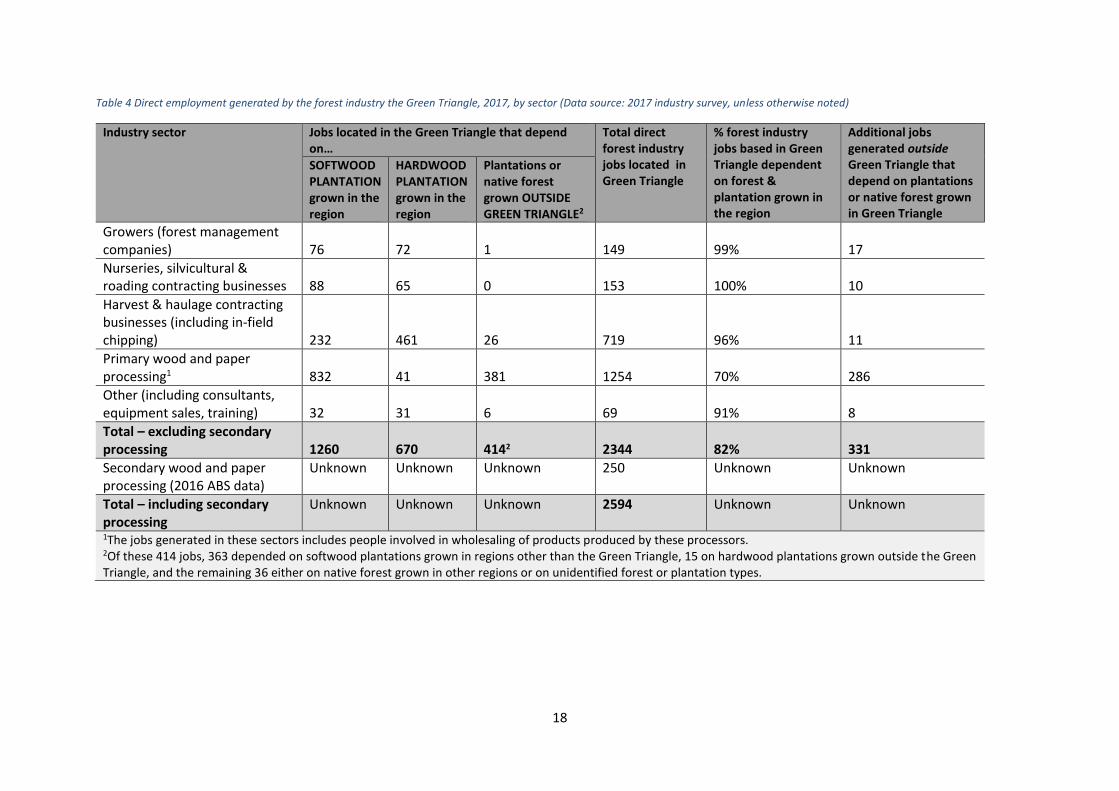
18
Table 4 Direct employment generated by the forest industry the Green Triangle, 2017, by sector (Data source: 2017 industry survey, unless otherwise noted)
Industry sector Jobs located in the Green Triangle that depend on…
Total direct forest industry jobs located in Green Triangle
% forest industry jobs based in Green Triangle dependent on forest & plantation grown in the region
Additional jobs generated outside Green Triangle that depend on plantations or native forest grown in Green Triangle
SOFTWOOD PLANTATION grown in the region
HARDWOOD PLANTATION grown in the region
Plantations or native forest grown OUTSIDE GREEN TRIANGLE2
Growers (forest management companies) 76 72 1 149 99% 17
Nurseries, silvicultural & roading contracting businesses 88 65 0 153 100% 10
Harvest & haulage contracting businesses (including in-field chipping) 232 461 26 719 96% 11
Primary wood and paper processing1 832 41 381 1254 70% 286
Other (including consultants, equipment sales, training) 32 31 6 69 91% 8
Total – excluding secondary processing 1260 670 4142 2344 82% 331
Secondary wood and paper processing (2016 ABS data)
Unknown
Unknown
Unknown
250 Unknown
Unknown
Total – including secondary processing
Unknown
Unknown
Unknown
2594 Unknown
Unknown
1The jobs generated in these sectors includes people involved in wholesaling of products produced by these processors. 2Of these 414 jobs, 363 depended on softwood plantations grown in regions other than the Green Triangle, 15 on hardwood plantations grown outside the Green Triangle, and the remaining 36 either on native forest grown in other regions or on unidentified forest or plantation types.
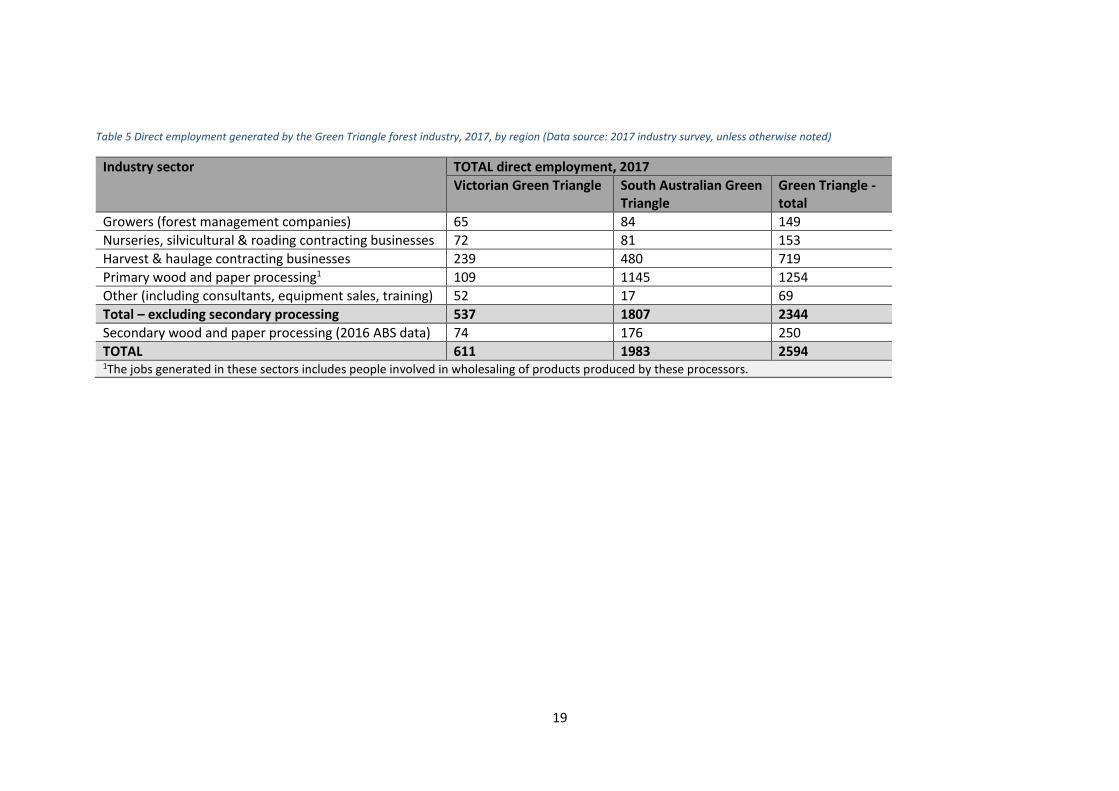
19
Table 5 Direct employment generated by the Green Triangle forest industry, 2017, by region (Data source: 2017 industry survey, unless otherwise noted)
Industry sector TOTAL direct employment, 2017
Victorian Green Triangle South Australian Green Triangle
Green Triangle - total
Growers (forest management companies) 65 84 149
Nurseries, silvicultural & roading contracting businesses 72 81 153
Harvest & haulage contracting businesses 239 480 719
Primary wood and paper processing1 109 1145 1254
Other (including consultants, equipment sales, training) 52 17 69
Total – excluding secondary processing 537 1807 2344
Secondary wood and paper processing (2016 ABS data) 74 176 250
TOTAL 611 1983 2594 1The jobs generated in these sectors includes people involved in wholesaling of products produced by these processors.
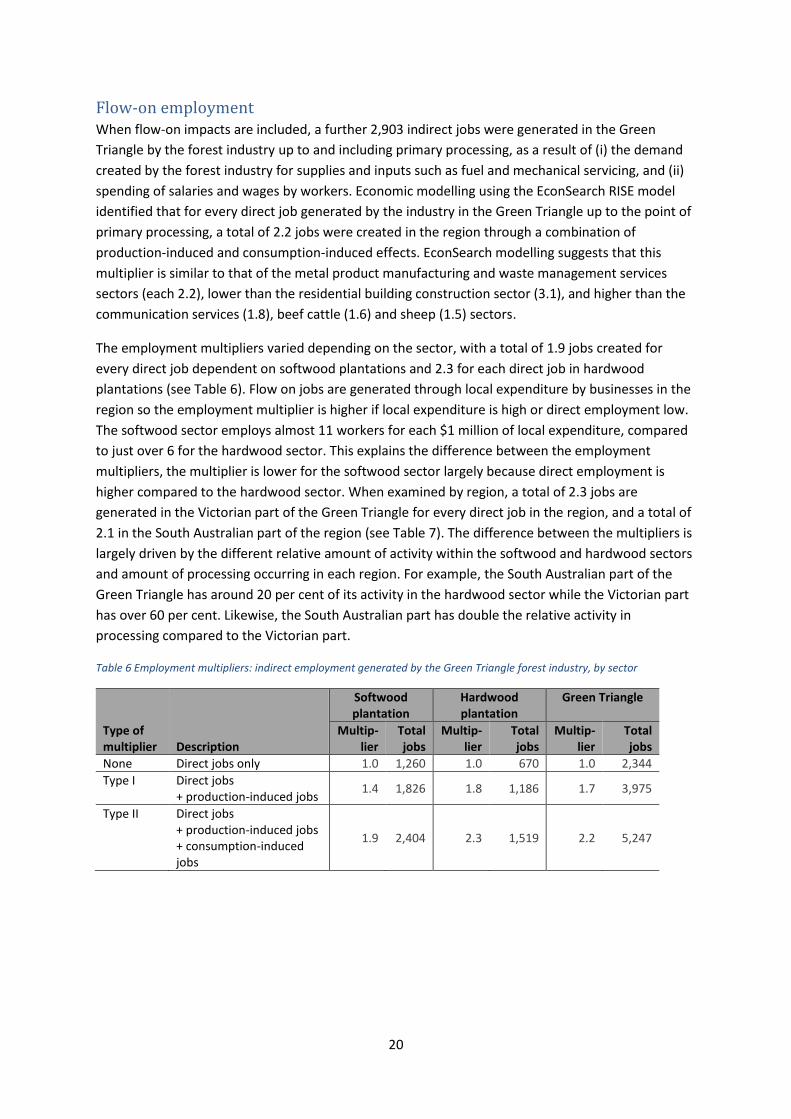
20
Flow-on employment When flow-on impacts are included, a further 2,903 indirect jobs were generated in the Green
Triangle by the forest industry up to and including primary processing, as a result of (i) the demand
created by the forest industry for supplies and inputs such as fuel and mechanical servicing, and (ii)
spending of salaries and wages by workers. Economic modelling using the EconSearch RISE model
identified that for every direct job generated by the industry in the Green Triangle up to the point of
primary processing, a total of 2.2 jobs were created in the region through a combination of
production-induced and consumption-induced effects. EconSearch modelling suggests that this
multiplier is similar to that of the metal product manufacturing and waste management services
sectors (each 2.2), lower than the residential building construction sector (3.1), and higher than the
communication services (1.8), beef cattle (1.6) and sheep (1.5) sectors.
The employment multipliers varied depending on the sector, with a total of 1.9 jobs created for
every direct job dependent on softwood plantations and 2.3 for each direct job in hardwood
plantations (see Table 6). Flow on jobs are generated through local expenditure by businesses in the
region so the employment multiplier is higher if local expenditure is high or direct employment low.
The softwood sector employs almost 11 workers for each $1 million of local expenditure, compared
to just over 6 for the hardwood sector. This explains the difference between the employment
multipliers, the multiplier is lower for the softwood sector largely because direct employment is
higher compared to the hardwood sector. When examined by region, a total of 2.3 jobs are
generated in the Victorian part of the Green Triangle for every direct job in the region, and a total of
2.1 in the South Australian part of the region (see Table 7). The difference between the multipliers is
largely driven by the different relative amount of activity within the softwood and hardwood sectors
and amount of processing occurring in each region. For example, the South Australian part of the
Green Triangle has around 20 per cent of its activity in the hardwood sector while the Victorian part
has over 60 per cent. Likewise, the South Australian part has double the relative activity in
processing compared to the Victorian part.
Table 6 Employment multipliers: indirect employment generated by the Green Triangle forest industry, by sector
Type of multiplier Description
Softwood plantation
Hardwood plantation
Green Triangle
Multip-lier
Total jobs
Multip-lier
Total jobs
Multip-lier
Total jobs
None Direct jobs only 1.0 1,260 1.0 670 1.0 2,344
Type I Direct jobs + production-induced jobs
1.4 1,826 1.8 1,186 1.7 3,975
Type II Direct jobs + production-induced jobs + consumption-induced jobs
1.9 2,404 2.3 1,519 2.2 5,247
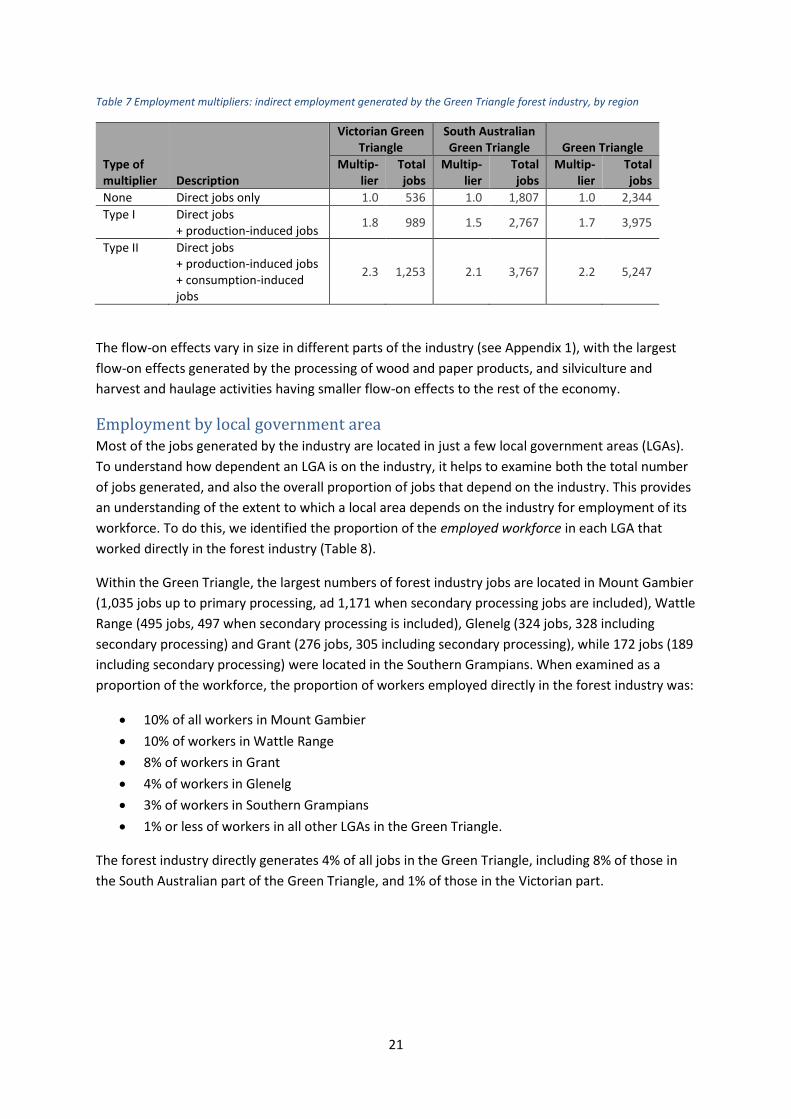
21
Table 7 Employment multipliers: indirect employment generated by the Green Triangle forest industry, by region
Type of multiplier Description
Victorian Green Triangle
South Australian Green Triangle Green Triangle
Multip-lier
Total jobs
Multip-lier
Total jobs
Multip-lier
Total jobs
None Direct jobs only 1.0 536 1.0 1,807 1.0 2,344
Type I Direct jobs + production-induced jobs
1.8 989 1.5 2,767 1.7 3,975
Type II Direct jobs + production-induced jobs + consumption-induced jobs
2.3 1,253 2.1 3,767 2.2 5,247
The flow-on effects vary in size in different parts of the industry (see Appendix 1), with the largest
flow-on effects generated by the processing of wood and paper products, and silviculture and
harvest and haulage activities having smaller flow-on effects to the rest of the economy.
Employment by local government area Most of the jobs generated by the industry are located in just a few local government areas (LGAs).
To understand how dependent an LGA is on the industry, it helps to examine both the total number
of jobs generated, and also the overall proportion of jobs that depend on the industry. This provides
an understanding of the extent to which a local area depends on the industry for employment of its
workforce. To do this, we identified the proportion of the employed workforce in each LGA that
worked directly in the forest industry (Table 8).
Within the Green Triangle, the largest numbers of forest industry jobs are located in Mount Gambier
(1,035 jobs up to primary processing, ad 1,171 when secondary processing jobs are included), Wattle
Range (495 jobs, 497 when secondary processing is included), Glenelg (324 jobs, 328 including
secondary processing) and Grant (276 jobs, 305 including secondary processing), while 172 jobs (189
including secondary processing) were located in the Southern Grampians. When examined as a
proportion of the workforce, the proportion of workers employed directly in the forest industry was:
• 10% of all workers in Mount Gambier
• 10% of workers in Wattle Range
• 8% of workers in Grant
• 4% of workers in Glenelg
• 3% of workers in Southern Grampians
• 1% or less of workers in all other LGAs in the Green Triangle.
The forest industry directly generates 4% of all jobs in the Green Triangle, including 8% of those in
the South Australian part of the Green Triangle, and 1% of those in the Victorian part.
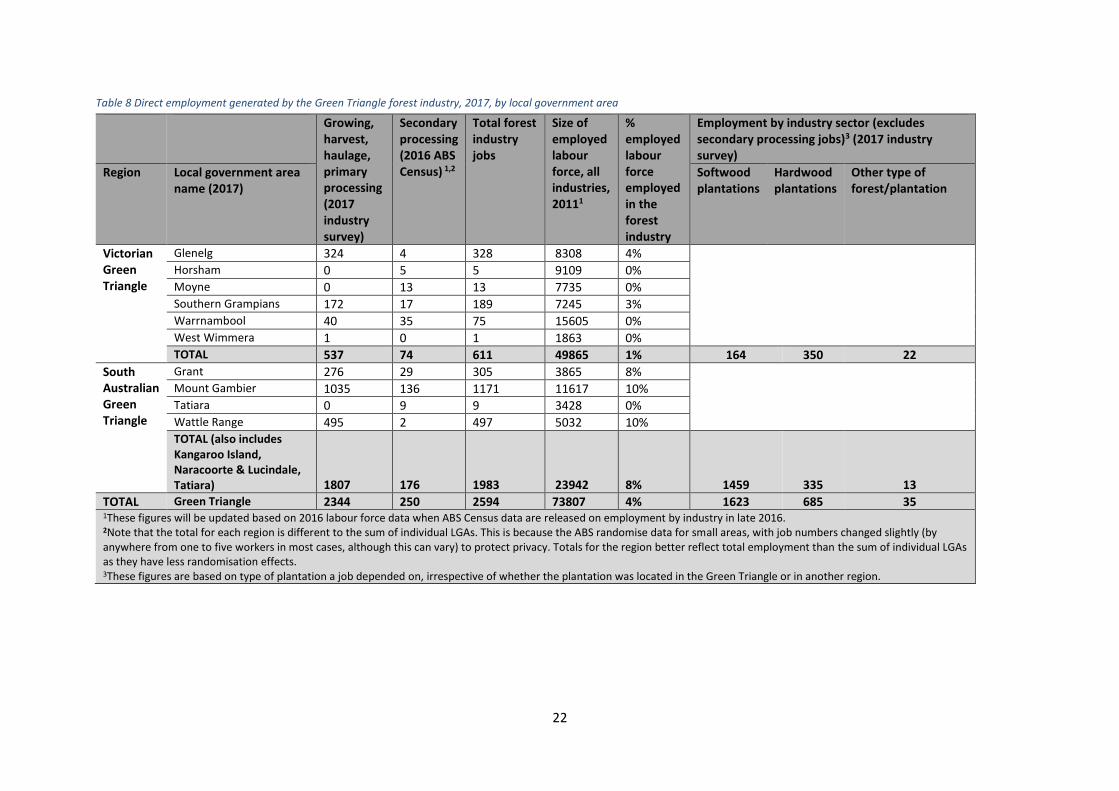
22
Table 8 Direct employment generated by the Green Triangle forest industry, 2017, by local government area
Growing, harvest, haulage, primary processing (2017 industry survey)
Secondary processing (2016 ABS Census) 1,2
Total forest industry jobs
Size of employed labour force, all industries, 20111
% employed labour force employed in the forest industry
Employment by industry sector (excludes secondary processing jobs)3 (2017 industry survey)
Region Local government area name (2017)
Softwood plantations
Hardwood plantations
Other type of forest/plantation
Victorian Green Triangle
Glenelg 324 4 328 8308 4%
Horsham 0 5 5 9109 0% Moyne 0 13 13 7735 0% Southern Grampians 172 17 189 7245 3% Warrnambool 40 35 75 15605 0% West Wimmera 1 0 1 1863 0% TOTAL 537 74 611 49865 1% 164 350 22
South Australian Green Triangle
Grant 276 29 305 3865 8%
Mount Gambier 1035 136 1171 11617 10% Tatiara 0 9 9 3428 0% Wattle Range 495 2 497 5032 10% TOTAL (also includes Kangaroo Island, Naracoorte & Lucindale, Tatiara) 1807 176 1983 23942 8% 1459 335 13
TOTAL Green Triangle 2344 250 2594 73807 4% 1623 685 35 1These figures will be updated based on 2016 labour force data when ABS Census data are released on employment by industry in late 2016. 2Note that the total for each region is different to the sum of individual LGAs. This is because the ABS randomise data for small areas, with job numbers changed slightly (by anywhere from one to five workers in most cases, although this can vary) to protect privacy. Totals for the region better reflect total employment than the sum of individual LGAs as they have less randomisation effects. 3These figures are based on type of plantation a job depended on, irrespective of whether the plantation was located in the Green Triangle or in another region.
23
Comparing employment estimates There are relatively few sources of information available on employment in the forest industry.
Other than specific surveys of businesses operating in the industry, the only regularly collected data
on employment comes from two types of data produced by the Australian Bureau of Statistics (ABS):
the Census of Population and Housing (Census), and the Labour Force Survey (LFS). In both cases,
people who are employed are asked to describe the type of work they do. This information is then
coded to identify each person’s industry of employment, using the Australian and New Zealand
Standard Industrial Classification (ANZSIC) (ABS/SNZ 2013).
The Census is conducted once every five years, and is a complete Census of the population, meaning
it captures all Australians except the small proportion (<5%) who do not participate in this
compulsory survey. Data produced from the Census has the highest reliability of any dataset on
employment, because it is a comprehensive Census. However, it is only available every five years
(data from the 2016 Census on industry of employment were released in November 2017). The LFS is
based on data collected monthly from a sample of 26,000 Australian households representing
around 0.32% of Australia’s population (ABS 2017). In terms of the forest industry, this means that if
the industry employed around 50,000 people nationally, the survey would include only a relatively
small number of people from the industry (around 160). This means that any estimates of
employment in the forest industry generated from the LFS are subject to high rates of sampling
error, as a change of 5-10 people in the number sampled in the survey will be extrapolated to be a
large change in total industry employment. Past reviews of the robustness of LFS survey for
estimating employment in the forest, wood and paper industries have identified that the sampling
error is too large to enable any accurate estimation of trends in industry employment, or of total
employment levels, using LFS data (Schirmer et al. 2013). This means that the only robust source of
data to which our survey data can be compared is data from the Census.
Both the Census and the LFS classify employment into several ‘industry classifications’ that form part
of the forest industry, specifically in Forestry, Logging, Services to Forestry, Wood Product
Manufacturing and Paper Product Manufacturing. However, some jobs directly dependent on the
forest industry are classified into other industries. In particular, many log haulage workers are
classified as being part of the transport industry. This means that Census data typically
underestimate the total number of people employed in the industry, particularly in regions where
there is substantial employment in harvest and haulage of logs. Additionally, Census data do not
identify whether workers are based in softwood plantation or hardwood plantation jobs. ABS data
do, however, capture employment in secondary processing, something difficult to do in direct
surveys of the industry.
Table 9 compares estimates of employment generated up to the point of primary processing by our
survey (data collected in late 2016 and the first half of 2017), and in the 2016 Census (data collected
in August 2016). The ABS uses processes of data randomisation to protect privacy, which means that
in any local government area, total numbers of workers may have been randomly changed by a
small amount to protect privacy. This means that very small differences (of, for example, less than
10 workers) are unlikely to represent meaningful differences between the two datasets.
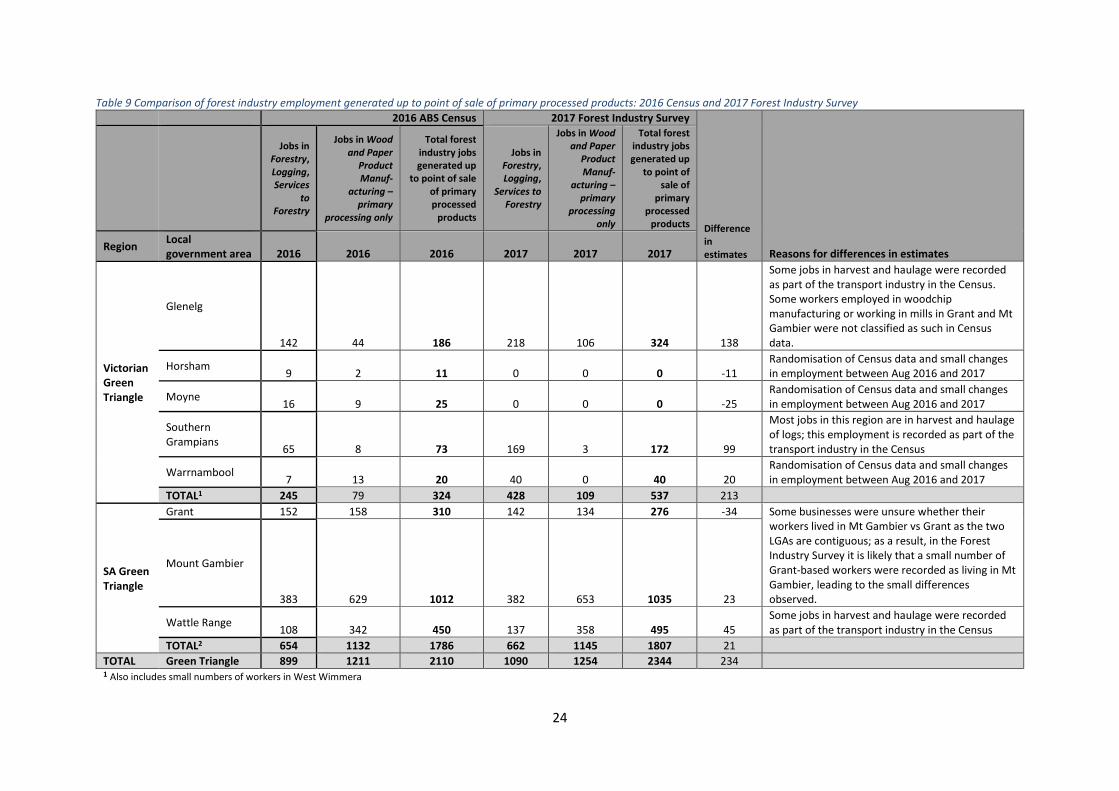
24
Table 9 Comparison of forest industry employment generated up to point of sale of primary processed products: 2016 Census and 2017 Forest Industry Survey
2016 ABS Census 2017 Forest Industry Survey
Difference in estimates Reasons for differences in estimates
Jobs in Forestry, Logging, Services
to Forestry
Jobs in Wood and Paper
Product Manuf-
acturing – primary
processing only
Total forest industry jobs generated up
to point of sale of primary processed
products
Jobs in Forestry, Logging,
Services to Forestry
Jobs in Wood and Paper
Product Manuf-
acturing – primary
processing only
Total forest industry jobs generated up
to point of sale of
primary processed
products
Region Local government area 2016 2016 2016 2017 2017 2017
Victorian Green Triangle
Glenelg
142 44 186 218 106 324 138
Some jobs in harvest and haulage were recorded as part of the transport industry in the Census. Some workers employed in woodchip manufacturing or working in mills in Grant and Mt Gambier were not classified as such in Census data.
Horsham 9 2 11 0 0 0 -11
Randomisation of Census data and small changes in employment between Aug 2016 and 2017
Moyne 16 9 25 0 0 0 -25
Randomisation of Census data and small changes in employment between Aug 2016 and 2017
Southern Grampians
65 8 73 169 3 172 99
Most jobs in this region are in harvest and haulage of logs; this employment is recorded as part of the transport industry in the Census
Warrnambool 7 13 20 40 0 40 20
Randomisation of Census data and small changes in employment between Aug 2016 and 2017
TOTAL1 245 79 324 428 109 537 213
SA Green Triangle
Grant 152 158 310 142 134 276 -34 Some businesses were unsure whether their workers lived in Mt Gambier vs Grant as the two LGAs are contiguous; as a result, in the Forest Industry Survey it is likely that a small number of Grant-based workers were recorded as living in Mt Gambier, leading to the small differences observed.
Mount Gambier
383 629 1012 382 653 1035 23
Wattle Range 108 342 450 137 358 495 45
Some jobs in harvest and haulage were recorded as part of the transport industry in the Census
TOTAL2 654 1132 1786 662 1145 1807 21
TOTAL Green Triangle 899 1211 2110 1090 1254 2344 234 1 Also includes small numbers of workers in West Wimmera
25
2 Also includes small numbers of workers in Narracoorte & Lucindale, Kangaroo Island, Tatiara
26
The 2016 Census recorded substantially fewer forest industry workers in key Victorian parts of the
Green Triangle than our survey. This is predominantly because the Census data record a large
number of harvest and haulage workers as being employed in the transport industry, rather than
recording them as a part of the forest industry. In Victoria, there has been rapid growth in harvest
and haulage employment related to harvesting of hardwood plantations in recent years, and while
Census data captures some of this growth, it does not capture all of it due to the limitation of log
haulage workers being classified as belonging to the transport industry, rather than to an industry
category that is specific to the forest industry. On the South Australian side of the Green Triangle,
our survey data recorded very similar numbers of workers to the 2016 Census, but there were again
some differences related to employment in the log haulage industry.
Overall, all differences in estimates were a result of three factors:
(i) classification of some log haulage workers into the transport industry in the Census, who
are recorded as part of the forest industry in the survey data, which in some LGAs led to
large differences between Census data and Forest Industry Survey data
(ii) randomisation of Census data, which led to small differences
(iii) small changes in employment are likely to have occurred between the time of Census
data collection (August 2016) and the time at which the Forest Industry Survey data
were collected (late 2016 and the first part of 2017). This will also contribute to some of
the differences observed.
Once these differences are accounted for, Census and Forest Industry Survey data are reasonably
consistent. The one area of discrepancy was a number of workers based in Glenelg identified as
working in wood product manufacturing. This may reflect differences in classification of workers
employed in the processing and export of woodchips: it is possible that Census data classified these
workers as being involved in wholesaling or export, rather than in manufacturing work.
Employment over time There is little information on how employment is changing in the forest industry over time. The few
studies that have estimated the employment generated by the industry in the Green Triangle have
used a range of definitions of the forest industry, and drawn data from different sources, meanings
that their figures are not always comparable. As a result, the only sources of data available that
enable comparison of employment over time in the forest industry are (i) the ABS Census and (ii)
surveys of the Victorian forest industry up to the point of primary processing undertaken in 2009
and 2012, which did not include the South Australian part of the Green Triangle (Forest Industry
Survey).
Census data therefore provide the most robust insight into how employment in the industry is
changing over time. As shown in Table 10, the number of workers employed in the forest, wood and
paper industries recorded in the Australian Bureau of Statistics Census of Population and Housing fell
by 16% between 2006 and 2011, and by a further 5% between 2011 and 2016. This overall trend
masked very different types of change occurring in different parts of the industry. Between 2011 and
2016, employment grew substantially in primary production, with 73% growth in jobs in the growing,
harvest and haulage of plantations; at the same time, employment in wood and paper product
manufacturing declined by 25% between 2011 and 2016. While Forest Industry Surveys (FIS) were
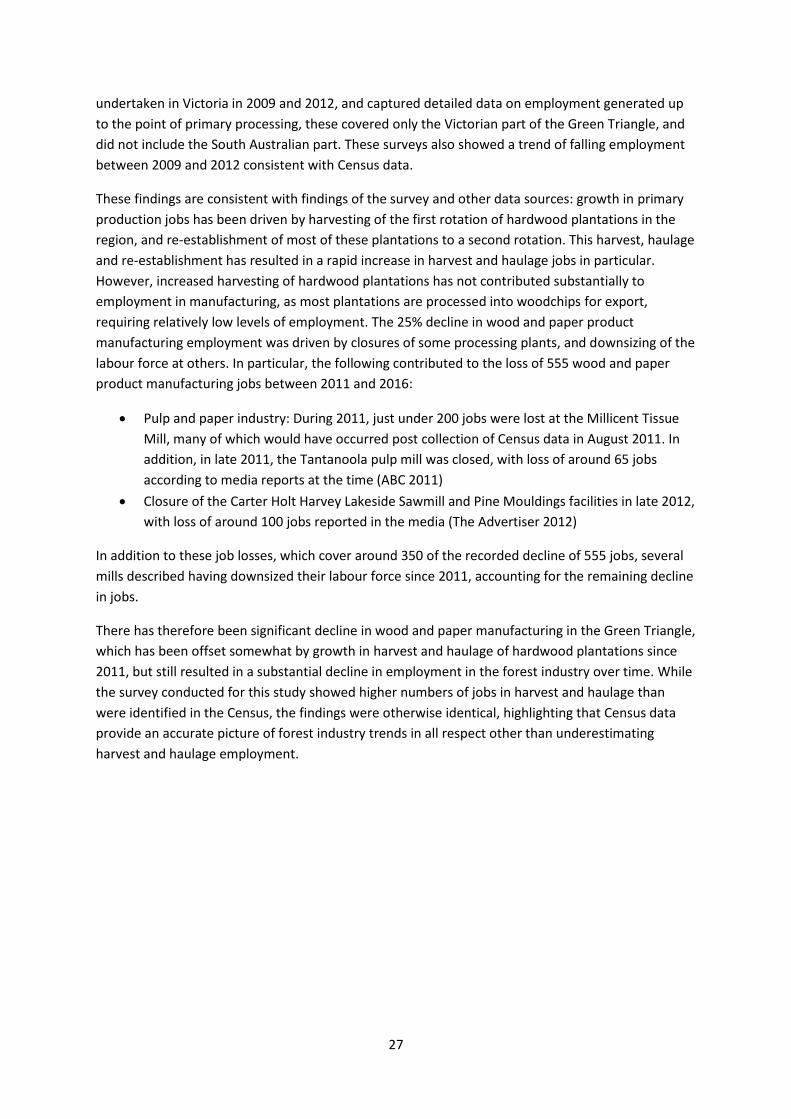
27
undertaken in Victoria in 2009 and 2012, and captured detailed data on employment generated up
to the point of primary processing, these covered only the Victorian part of the Green Triangle, and
did not include the South Australian part. These surveys also showed a trend of falling employment
between 2009 and 2012 consistent with Census data.
These findings are consistent with findings of the survey and other data sources: growth in primary
production jobs has been driven by harvesting of the first rotation of hardwood plantations in the
region, and re-establishment of most of these plantations to a second rotation. This harvest, haulage
and re-establishment has resulted in a rapid increase in harvest and haulage jobs in particular.
However, increased harvesting of hardwood plantations has not contributed substantially to
employment in manufacturing, as most plantations are processed into woodchips for export,
requiring relatively low levels of employment. The 25% decline in wood and paper product
manufacturing employment was driven by closures of some processing plants, and downsizing of the
labour force at others. In particular, the following contributed to the loss of 555 wood and paper
product manufacturing jobs between 2011 and 2016:
• Pulp and paper industry: During 2011, just under 200 jobs were lost at the Millicent Tissue
Mill, many of which would have occurred post collection of Census data in August 2011. In
addition, in late 2011, the Tantanoola pulp mill was closed, with loss of around 65 jobs
according to media reports at the time (ABC 2011)
• Closure of the Carter Holt Harvey Lakeside Sawmill and Pine Mouldings facilities in late 2012,
with loss of around 100 jobs reported in the media (The Advertiser 2012)
In addition to these job losses, which cover around 350 of the recorded decline of 555 jobs, several
mills described having downsized their labour force since 2011, accounting for the remaining decline
in jobs.
There has therefore been significant decline in wood and paper manufacturing in the Green Triangle,
which has been offset somewhat by growth in harvest and haulage of hardwood plantations since
2011, but still resulted in a substantial decline in employment in the forest industry over time. While
the survey conducted for this study showed higher numbers of jobs in harvest and haulage than
were identified in the Census, the findings were otherwise identical, highlighting that Census data
provide an accurate picture of forest industry trends in all respect other than underestimating
harvest and haulage employment.
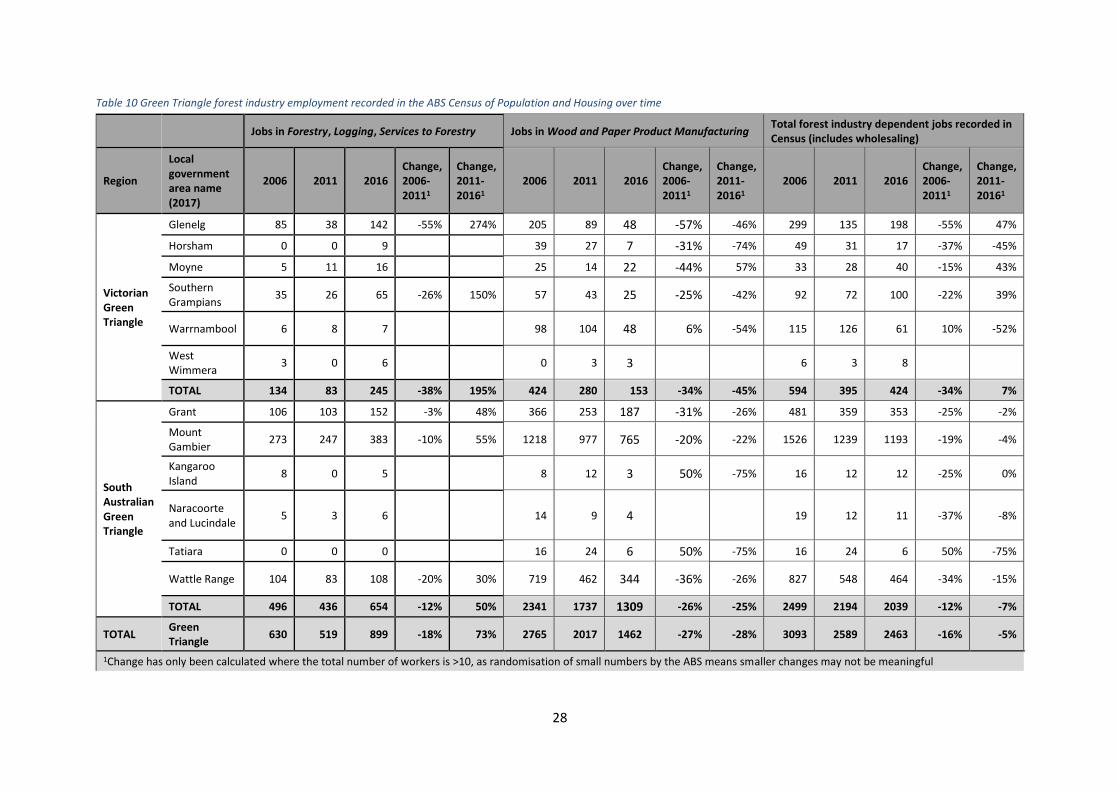
28
Table 10 Green Triangle forest industry employment recorded in the ABS Census of Population and Housing over time
Jobs in Forestry, Logging, Services to Forestry Jobs in Wood and Paper Product Manufacturing Total forest industry dependent jobs recorded in Census (includes wholesaling)
Region
Local government area name (2017)
2006 2011 2016 Change, 2006-20111
Change, 2011-20161
2006 2011 2016 Change, 2006-20111
Change, 2011-20161
2006 2011 2016 Change, 2006-20111
Change, 2011-20161
Victorian Green Triangle
Glenelg 85 38 142 -55% 274% 205 89 48 -57% -46% 299 135 198 -55% 47%
Horsham 0 0 9 39 27 7 -31% -74% 49 31 17 -37% -45%
Moyne 5 11 16 25 14 22 -44% 57% 33 28 40 -15% 43%
Southern Grampians
35 26 65 -26% 150% 57 43 25 -25% -42% 92 72 100 -22% 39%
Warrnambool 6 8 7 98 104 48 6% -54% 115 126 61 10% -52%
West Wimmera
3 0 6 0 3 3 6 3 8
TOTAL 134 83 245 -38% 195% 424 280 153 -34% -45% 594 395 424 -34% 7%
South Australian Green Triangle
Grant 106 103 152 -3% 48% 366 253 187 -31% -26% 481 359 353 -25% -2%
Mount Gambier
273 247 383 -10% 55% 1218 977 765 -20% -22% 1526 1239 1193 -19% -4%
Kangaroo Island
8 0 5 8 12 3 50% -75% 16 12 12 -25% 0%
Naracoorte and Lucindale
5 3 6 14 9 4 19 12 11 -37% -8%
Tatiara 0 0 0 16 24 6 50% -75% 16 24 6 50% -75%
Wattle Range 104 83 108 -20% 30% 719 462 344 -36% -26% 827 548 464 -34% -15%
TOTAL 496 436 654 -12% 50% 2341 1737 1309 -26% -25% 2499 2194 2039 -12% -7%
TOTAL Green Triangle
630 519 899 -18% 73% 2765 2017 1462 -27% -28% 3093 2589 2463 -16% -5%
1Change has only been calculated where the total number of workers is >10, as randomisation of small numbers by the ABS means smaller changes may not be meaningful
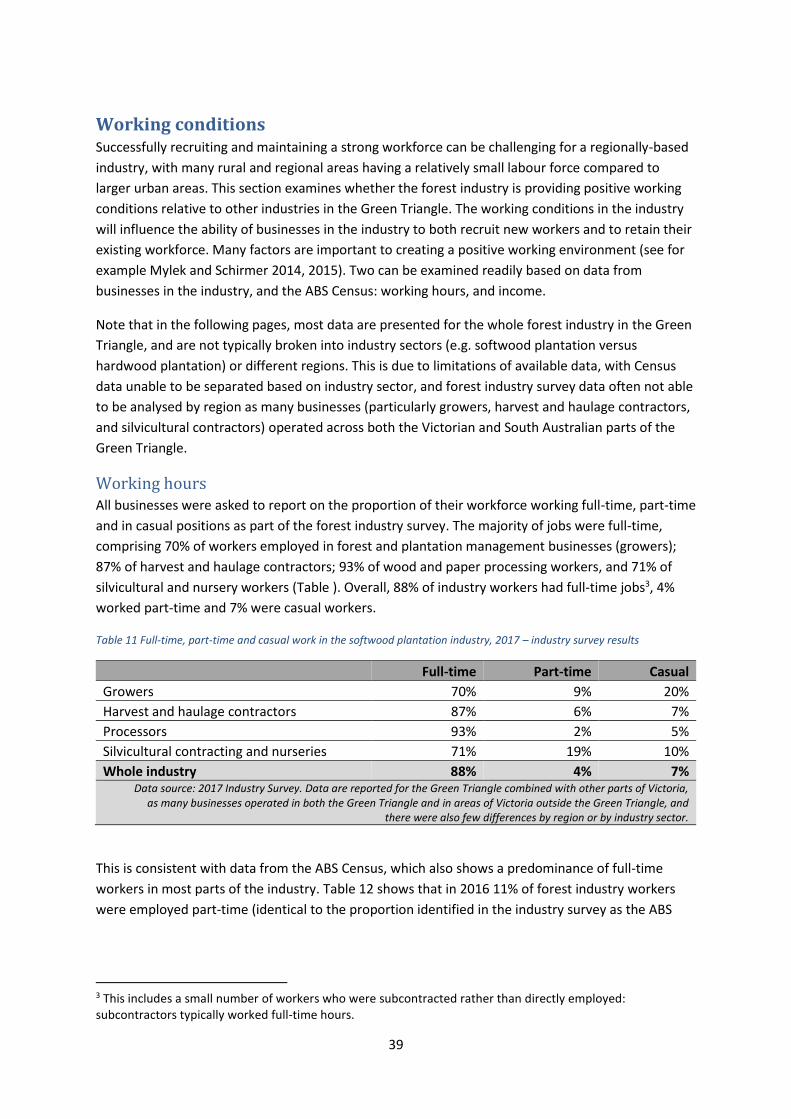
39
Working conditions Successfully recruiting and maintaining a strong workforce can be challenging for a regionally-based
industry, with many rural and regional areas having a relatively small labour force compared to
larger urban areas. This section examines whether the forest industry is providing positive working
conditions relative to other industries in the Green Triangle. The working conditions in the industry
will influence the ability of businesses in the industry to both recruit new workers and to retain their
existing workforce. Many factors are important to creating a positive working environment (see for
example Mylek and Schirmer 2014, 2015). Two can be examined readily based on data from
businesses in the industry, and the ABS Census: working hours, and income.
Note that in the following pages, most data are presented for the whole forest industry in the Green
Triangle, and are not typically broken into industry sectors (e.g. softwood plantation versus
hardwood plantation) or different regions. This is due to limitations of available data, with Census
data unable to be separated based on industry sector, and forest industry survey data often not able
to be analysed by region as many businesses (particularly growers, harvest and haulage contractors,
and silvicultural contractors) operated across both the Victorian and South Australian parts of the
Green Triangle.
Working hours All businesses were asked to report on the proportion of their workforce working full-time, part-time
and in casual positions as part of the forest industry survey. The majority of jobs were full-time,
comprising 70% of workers employed in forest and plantation management businesses (growers);
87% of harvest and haulage contractors; 93% of wood and paper processing workers, and 71% of
silvicultural and nursery workers (Table ). Overall, 88% of industry workers had full-time jobs3, 4%
worked part-time and 7% were casual workers.
Table 11 Full-time, part-time and casual work in the softwood plantation industry, 2017 – industry survey results
Full-time Part-time Casual
Growers 70% 9% 20%
Harvest and haulage contractors 87% 6% 7%
Processors 93% 2% 5%
Silvicultural contracting and nurseries 71% 19% 10%
Whole industry 88% 4% 7% Data source: 2017 Industry Survey. Data are reported for the Green Triangle combined with other parts of Victoria,
as many businesses operated in both the Green Triangle and in areas of Victoria outside the Green Triangle, and there were also few differences by region or by industry sector.
This is consistent with data from the ABS Census, which also shows a predominance of full-time
workers in most parts of the industry. Table 12 shows that in 2016 11% of forest industry workers
were employed part-time (identical to the proportion identified in the industry survey as the ABS
3 This includes a small number of workers who were subcontracted rather than directly employed: subcontractors typically worked full-time hours.
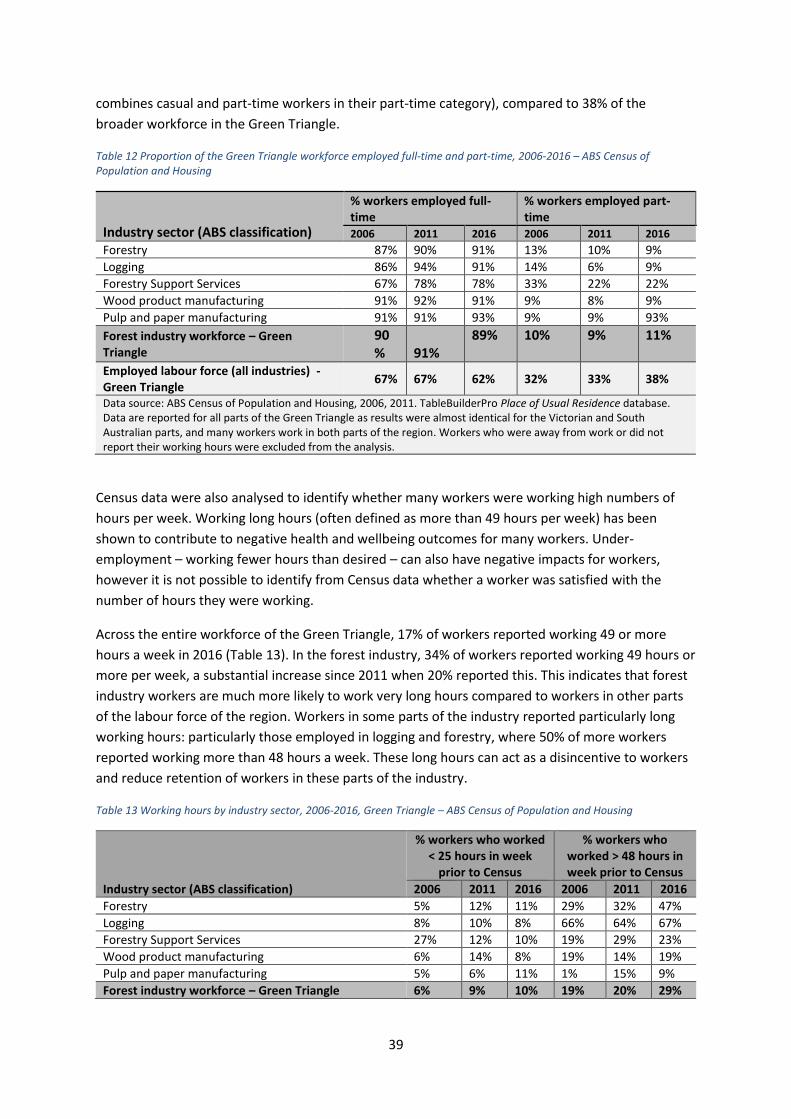
39
combines casual and part-time workers in their part-time category), compared to 38% of the
broader workforce in the Green Triangle.
Table 12 Proportion of the Green Triangle workforce employed full-time and part-time, 2006-2016 – ABS Census of Population and Housing
Industry sector (ABS classification)
% workers employed full-time
% workers employed part-time
2006 2011 2016 2006 2011 2016
Forestry 87% 90% 91% 13% 10% 9%
Logging 86% 94% 91% 14% 6% 9%
Forestry Support Services 67% 78% 78% 33% 22% 22%
Wood product manufacturing 91% 92% 91% 9% 8% 9%
Pulp and paper manufacturing 91% 91% 93% 9% 9% 93%
Forest industry workforce – Green Triangle
90% 91%
89% 10% 9% 11%
Employed labour force (all industries) - Green Triangle
67% 67% 62% 32% 33% 38%
Data source: ABS Census of Population and Housing, 2006, 2011. TableBuilderPro Place of Usual Residence database. Data are reported for all parts of the Green Triangle as results were almost identical for the Victorian and South Australian parts, and many workers work in both parts of the region. Workers who were away from work or did not report their working hours were excluded from the analysis.
Census data were also analysed to identify whether many workers were working high numbers of
hours per week. Working long hours (often defined as more than 49 hours per week) has been
shown to contribute to negative health and wellbeing outcomes for many workers. Under-
employment – working fewer hours than desired – can also have negative impacts for workers,
however it is not possible to identify from Census data whether a worker was satisfied with the
number of hours they were working.
Across the entire workforce of the Green Triangle, 17% of workers reported working 49 or more
hours a week in 2016 (Table 13). In the forest industry, 34% of workers reported working 49 hours or
more per week, a substantial increase since 2011 when 20% reported this. This indicates that forest
industry workers are much more likely to work very long hours compared to workers in other parts
of the labour force of the region. Workers in some parts of the industry reported particularly long
working hours: particularly those employed in logging and forestry, where 50% of more workers
reported working more than 48 hours a week. These long hours can act as a disincentive to workers
and reduce retention of workers in these parts of the industry.
Table 13 Working hours by industry sector, 2006-2016, Green Triangle – ABS Census of Population and Housing
Industry sector (ABS classification)
% workers who worked < 25 hours in week
prior to Census
% workers who worked > 48 hours in week prior to Census
2006 2011 2016 2006 2011 2016
Forestry 5% 12% 11% 29% 32% 47%
Logging 8% 10% 8% 66% 64% 67%
Forestry Support Services 27% 12% 10% 19% 29% 23%
Wood product manufacturing 6% 14% 8% 19% 14% 19%
Pulp and paper manufacturing 5% 6% 11% 1% 15% 9%
Forest industry workforce – Green Triangle 6% 9% 10% 19% 20% 29%
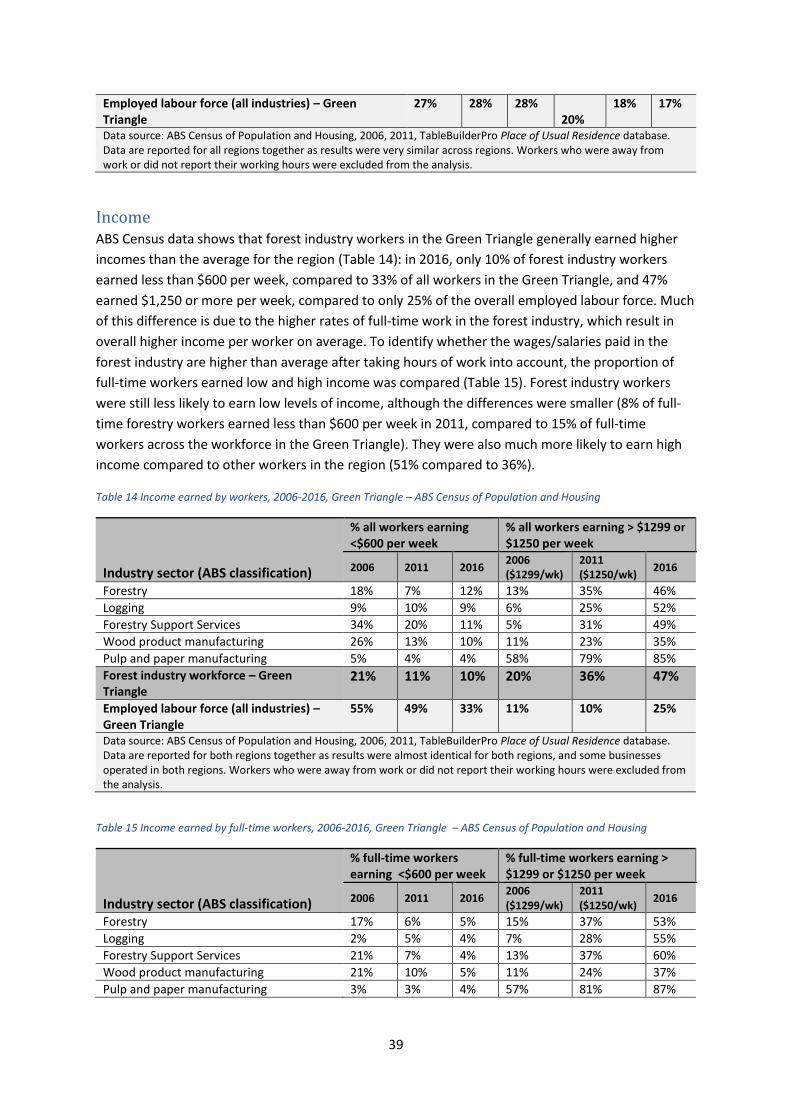
39
Employed labour force (all industries) – Green Triangle
27% 28% 28% 20%
18% 17%
Data source: ABS Census of Population and Housing, 2006, 2011, TableBuilderPro Place of Usual Residence database. Data are reported for all regions together as results were very similar across regions. Workers who were away from work or did not report their working hours were excluded from the analysis.
Income ABS Census data shows that forest industry workers in the Green Triangle generally earned higher
incomes than the average for the region (Table 14): in 2016, only 10% of forest industry workers
earned less than $600 per week, compared to 33% of all workers in the Green Triangle, and 47%
earned $1,250 or more per week, compared to only 25% of the overall employed labour force. Much
of this difference is due to the higher rates of full-time work in the forest industry, which result in
overall higher income per worker on average. To identify whether the wages/salaries paid in the
forest industry are higher than average after taking hours of work into account, the proportion of
full-time workers earned low and high income was compared (Table 15). Forest industry workers
were still less likely to earn low levels of income, although the differences were smaller (8% of full-
time forestry workers earned less than $600 per week in 2011, compared to 15% of full-time
workers across the workforce in the Green Triangle). They were also much more likely to earn high
income compared to other workers in the region (51% compared to 36%).
Table 14 Income earned by workers, 2006-2016, Green Triangle – ABS Census of Population and Housing
Industry sector (ABS classification)
% all workers earning <$600 per week
% all workers earning > $1299 or $1250 per week
2006 2011 2016 2006 ($1299/wk)
2011 ($1250/wk)
2016
Forestry 18% 7% 12% 13% 35% 46%
Logging 9% 10% 9% 6% 25% 52%
Forestry Support Services 34% 20% 11% 5% 31% 49%
Wood product manufacturing 26% 13% 10% 11% 23% 35%
Pulp and paper manufacturing 5% 4% 4% 58% 79% 85%
Forest industry workforce – Green Triangle
21% 11% 10% 20% 36% 47%
Employed labour force (all industries) – Green Triangle
55% 49% 33% 11% 10% 25%
Data source: ABS Census of Population and Housing, 2006, 2011, TableBuilderPro Place of Usual Residence database. Data are reported for both regions together as results were almost identical for both regions, and some businesses operated in both regions. Workers who were away from work or did not report their working hours were excluded from the analysis.
Table 15 Income earned by full-time workers, 2006-2016, Green Triangle – ABS Census of Population and Housing
Industry sector (ABS classification)
% full-time workers earning <$600 per week
% full-time workers earning > $1299 or $1250 per week
2006 2011 2016 2006 ($1299/wk)
2011 ($1250/wk)
2016
Forestry 17% 6% 5% 15% 37% 53%
Logging 2% 5% 4% 7% 28% 55%
Forestry Support Services 21% 7% 4% 13% 37% 60%
Wood product manufacturing 21% 10% 5% 11% 24% 37%
Pulp and paper manufacturing 3% 3% 4% 57% 81% 87%
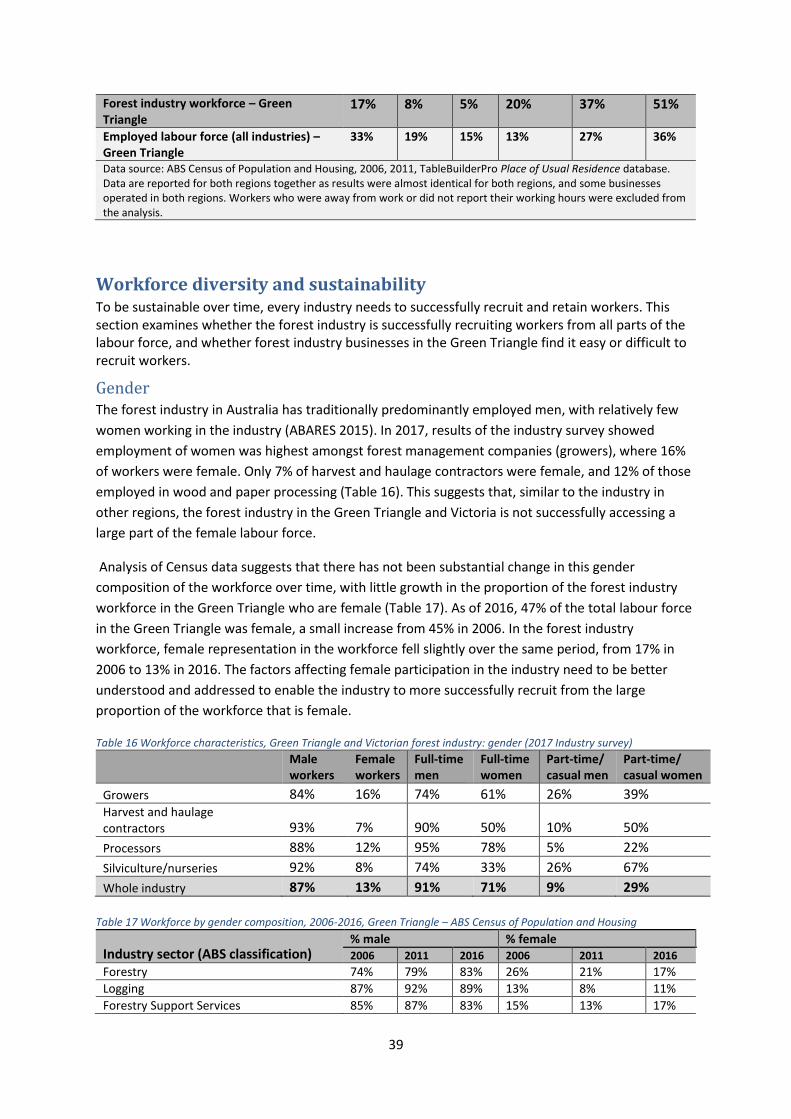
39
Forest industry workforce – Green Triangle
17% 8% 5% 20% 37% 51%
Employed labour force (all industries) – Green Triangle
33% 19% 15% 13% 27% 36%
Data source: ABS Census of Population and Housing, 2006, 2011, TableBuilderPro Place of Usual Residence database. Data are reported for both regions together as results were almost identical for both regions, and some businesses operated in both regions. Workers who were away from work or did not report their working hours were excluded from the analysis.
Workforce diversity and sustainability To be sustainable over time, every industry needs to successfully recruit and retain workers. This section examines whether the forest industry is successfully recruiting workers from all parts of the labour force, and whether forest industry businesses in the Green Triangle find it easy or difficult to recruit workers.
Gender The forest industry in Australia has traditionally predominantly employed men, with relatively few
women working in the industry (ABARES 2015). In 2017, results of the industry survey showed
employment of women was highest amongst forest management companies (growers), where 16%
of workers were female. Only 7% of harvest and haulage contractors were female, and 12% of those
employed in wood and paper processing (Table 16). This suggests that, similar to the industry in
other regions, the forest industry in the Green Triangle and Victoria is not successfully accessing a
large part of the female labour force.
Analysis of Census data suggests that there has not been substantial change in this gender
composition of the workforce over time, with little growth in the proportion of the forest industry
workforce in the Green Triangle who are female (Table 17). As of 2016, 47% of the total labour force
in the Green Triangle was female, a small increase from 45% in 2006. In the forest industry
workforce, female representation in the workforce fell slightly over the same period, from 17% in
2006 to 13% in 2016. The factors affecting female participation in the industry need to be better
understood and addressed to enable the industry to more successfully recruit from the large
proportion of the workforce that is female.
Table 16 Workforce characteristics, Green Triangle and Victorian forest industry: gender (2017 Industry survey)
Male workers
Female workers
Full-time men
Full-time women
Part-time/ casual men
Part-time/ casual women
Growers 84% 16% 74% 61% 26% 39%
Harvest and haulage contractors 93% 7% 90% 50% 10% 50%
Processors 88% 12% 95% 78% 5% 22%
Silviculture/nurseries 92% 8% 74% 33% 26% 67%
Whole industry 87% 13% 91% 71% 9% 29%
Table 17 Workforce by gender composition, 2006-2016, Green Triangle – ABS Census of Population and Housing
Industry sector (ABS classification) % male % female 2006 2011 2016 2006 2011 2016
Forestry 74% 79% 83% 26% 21% 17%
Logging 87% 92% 89% 13% 8% 11%
Forestry Support Services 85% 87% 83% 15% 13% 17%
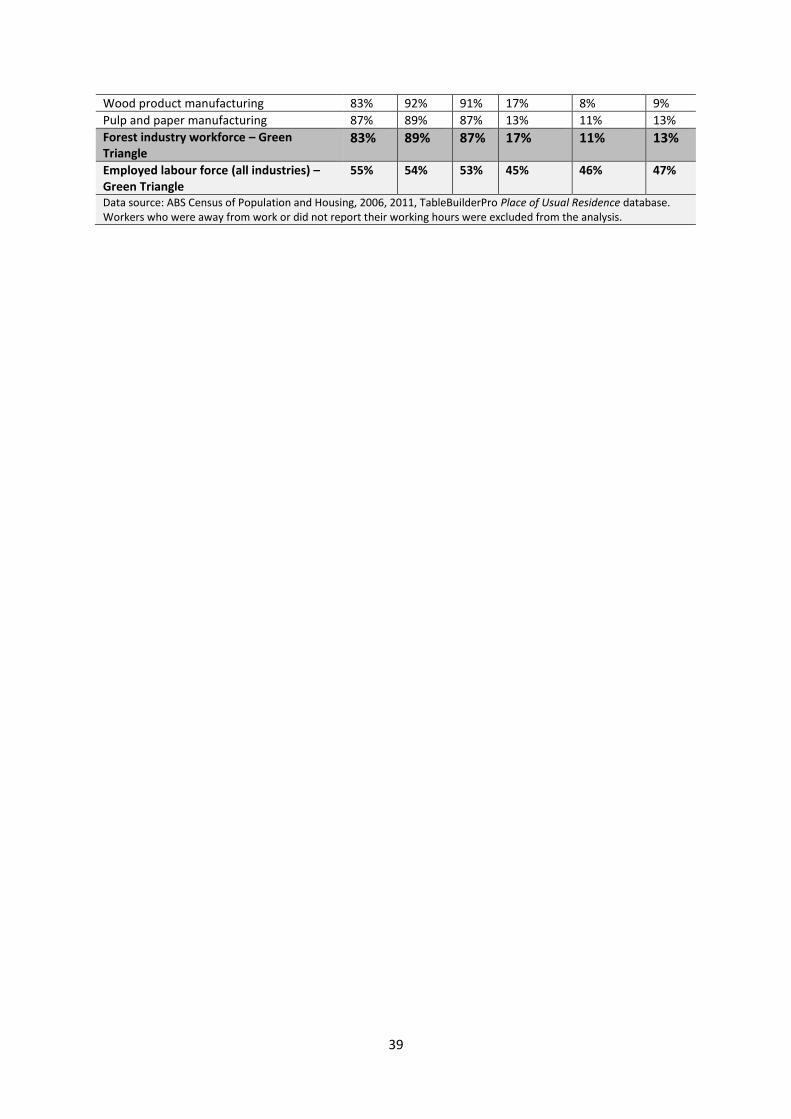
39
Wood product manufacturing 83% 92% 91% 17% 8% 9%
Pulp and paper manufacturing 87% 89% 87% 13% 11% 13%
Forest industry workforce – Green Triangle
83% 89% 87% 17% 11% 13%
Employed labour force (all industries) – Green Triangle
55% 54% 53% 45% 46% 47%
Data source: ABS Census of Population and Housing, 2006, 2011, TableBuilderPro Place of Usual Residence database. Workers who were away from work or did not report their working hours were excluded from the analysis.
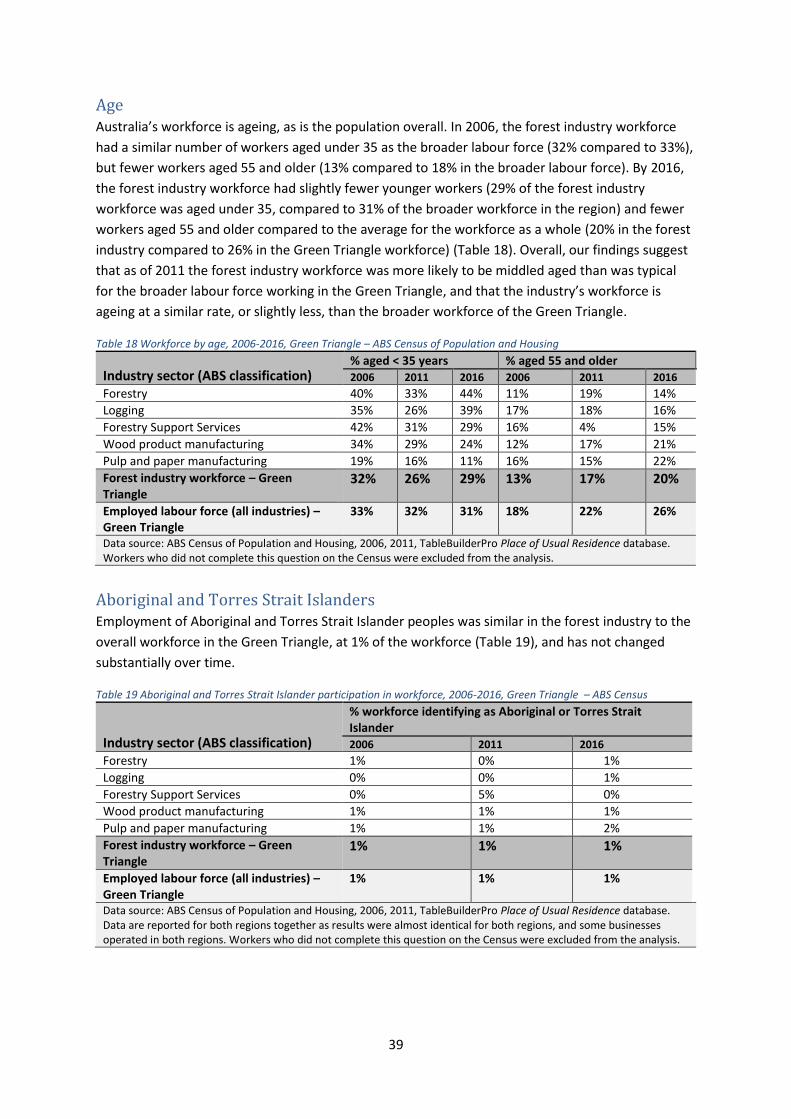
39
Age Australia’s workforce is ageing, as is the population overall. In 2006, the forest industry workforce
had a similar number of workers aged under 35 as the broader labour force (32% compared to 33%),
but fewer workers aged 55 and older (13% compared to 18% in the broader labour force). By 2016,
the forest industry workforce had slightly fewer younger workers (29% of the forest industry
workforce was aged under 35, compared to 31% of the broader workforce in the region) and fewer
workers aged 55 and older compared to the average for the workforce as a whole (20% in the forest
industry compared to 26% in the Green Triangle workforce) (Table 18). Overall, our findings suggest
that as of 2011 the forest industry workforce was more likely to be middled aged than was typical
for the broader labour force working in the Green Triangle, and that the industry’s workforce is
ageing at a similar rate, or slightly less, than the broader workforce of the Green Triangle.
Table 18 Workforce by age, 2006-2016, Green Triangle – ABS Census of Population and Housing
Industry sector (ABS classification) % aged < 35 years % aged 55 and older 2006 2011 2016 2006 2011 2016
Forestry 40% 33% 44% 11% 19% 14%
Logging 35% 26% 39% 17% 18% 16%
Forestry Support Services 42% 31% 29% 16% 4% 15%
Wood product manufacturing 34% 29% 24% 12% 17% 21%
Pulp and paper manufacturing 19% 16% 11% 16% 15% 22%
Forest industry workforce – Green Triangle
32% 26% 29% 13% 17% 20%
Employed labour force (all industries) – Green Triangle
33% 32% 31% 18% 22% 26%
Data source: ABS Census of Population and Housing, 2006, 2011, TableBuilderPro Place of Usual Residence database. Workers who did not complete this question on the Census were excluded from the analysis.
Aboriginal and Torres Strait Islanders Employment of Aboriginal and Torres Strait Islander peoples was similar in the forest industry to the
overall workforce in the Green Triangle, at 1% of the workforce (Table 19), and has not changed
substantially over time.
Table 19 Aboriginal and Torres Strait Islander participation in workforce, 2006-2016, Green Triangle – ABS Census
Industry sector (ABS classification)
% workforce identifying as Aboriginal or Torres Strait Islander 2006 2011 2016
Forestry 1% 0% 1%
Logging 0% 0% 1%
Forestry Support Services 0% 5% 0%
Wood product manufacturing 1% 1% 1%
Pulp and paper manufacturing 1% 1% 2%
Forest industry workforce – Green Triangle
1% 1% 1%
Employed labour force (all industries) – Green Triangle
1% 1% 1%
Data source: ABS Census of Population and Housing, 2006, 2011, TableBuilderPro Place of Usual Residence database. Data are reported for both regions together as results were almost identical for both regions, and some businesses operated in both regions. Workers who did not complete this question on the Census were excluded from the analysis.
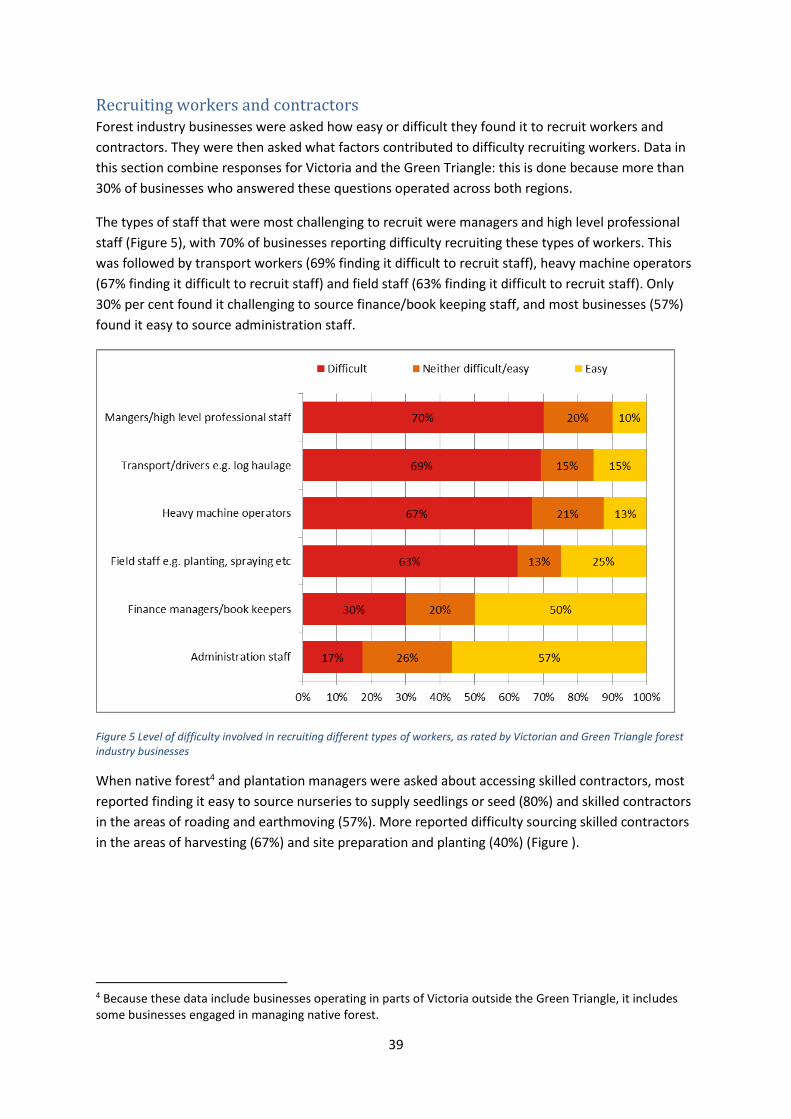
39
Recruiting workers and contractors Forest industry businesses were asked how easy or difficult they found it to recruit workers and
contractors. They were then asked what factors contributed to difficulty recruiting workers. Data in
this section combine responses for Victoria and the Green Triangle: this is done because more than
30% of businesses who answered these questions operated across both regions.
The types of staff that were most challenging to recruit were managers and high level professional
staff (Figure 5), with 70% of businesses reporting difficulty recruiting these types of workers. This
was followed by transport workers (69% finding it difficult to recruit staff), heavy machine operators
(67% finding it difficult to recruit staff) and field staff (63% finding it difficult to recruit staff). Only
30% per cent found it challenging to source finance/book keeping staff, and most businesses (57%)
found it easy to source administration staff.
Figure 5 Level of difficulty involved in recruiting different types of workers, as rated by Victorian and Green Triangle forest industry businesses
When native forest4 and plantation managers were asked about accessing skilled contractors, most
reported finding it easy to source nurseries to supply seedlings or seed (80%) and skilled contractors
in the areas of roading and earthmoving (57%). More reported difficulty sourcing skilled contractors
in the areas of harvesting (67%) and site preparation and planting (40%) (Figure ).
4 Because these data include businesses operating in parts of Victoria outside the Green Triangle, it includes some businesses engaged in managing native forest.
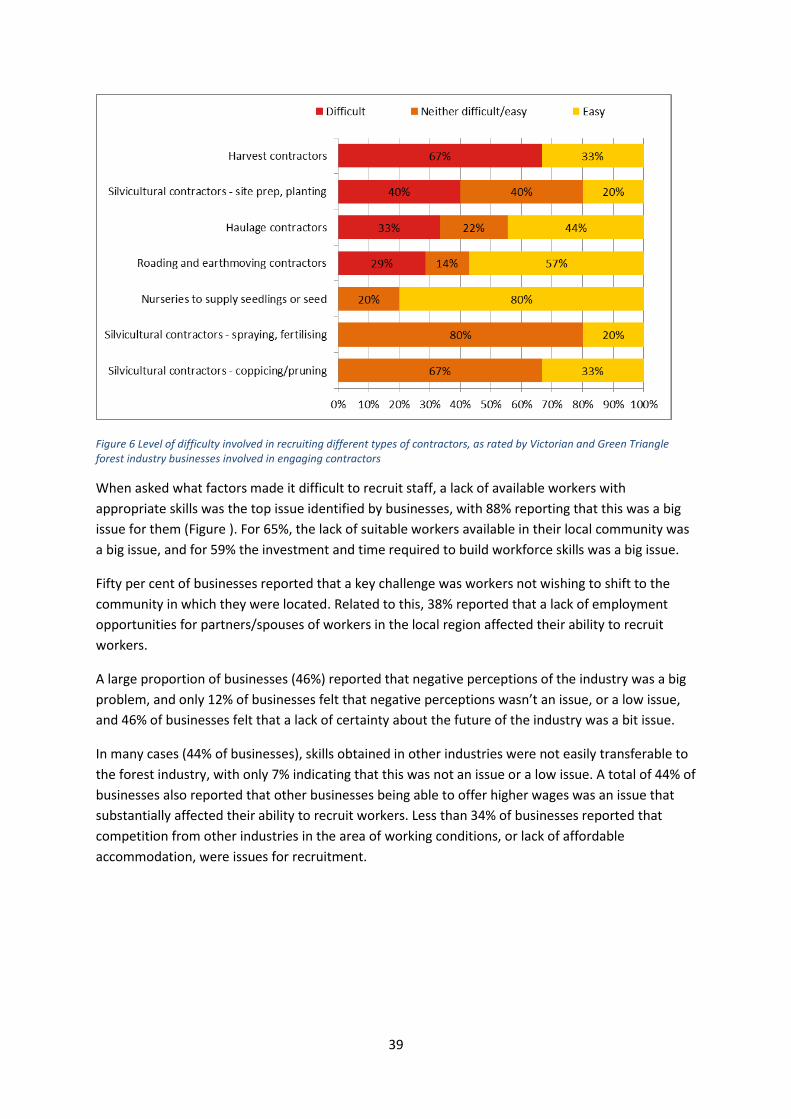
39
Figure 6 Level of difficulty involved in recruiting different types of contractors, as rated by Victorian and Green Triangle forest industry businesses involved in engaging contractors
When asked what factors made it difficult to recruit staff, a lack of available workers with
appropriate skills was the top issue identified by businesses, with 88% reporting that this was a big
issue for them (Figure ). For 65%, the lack of suitable workers available in their local community was
a big issue, and for 59% the investment and time required to build workforce skills was a big issue.
Fifty per cent of businesses reported that a key challenge was workers not wishing to shift to the
community in which they were located. Related to this, 38% reported that a lack of employment
opportunities for partners/spouses of workers in the local region affected their ability to recruit
workers.
A large proportion of businesses (46%) reported that negative perceptions of the industry was a big
problem, and only 12% of businesses felt that negative perceptions wasn’t an issue, or a low issue,
and 46% of businesses felt that a lack of certainty about the future of the industry was a bit issue.
In many cases (44% of businesses), skills obtained in other industries were not easily transferable to
the forest industry, with only 7% indicating that this was not an issue or a low issue. A total of 44% of
businesses also reported that other businesses being able to offer higher wages was an issue that
substantially affected their ability to recruit workers. Less than 34% of businesses reported that
competition from other industries in the area of working conditions, or lack of affordable
accommodation, were issues for recruitment.
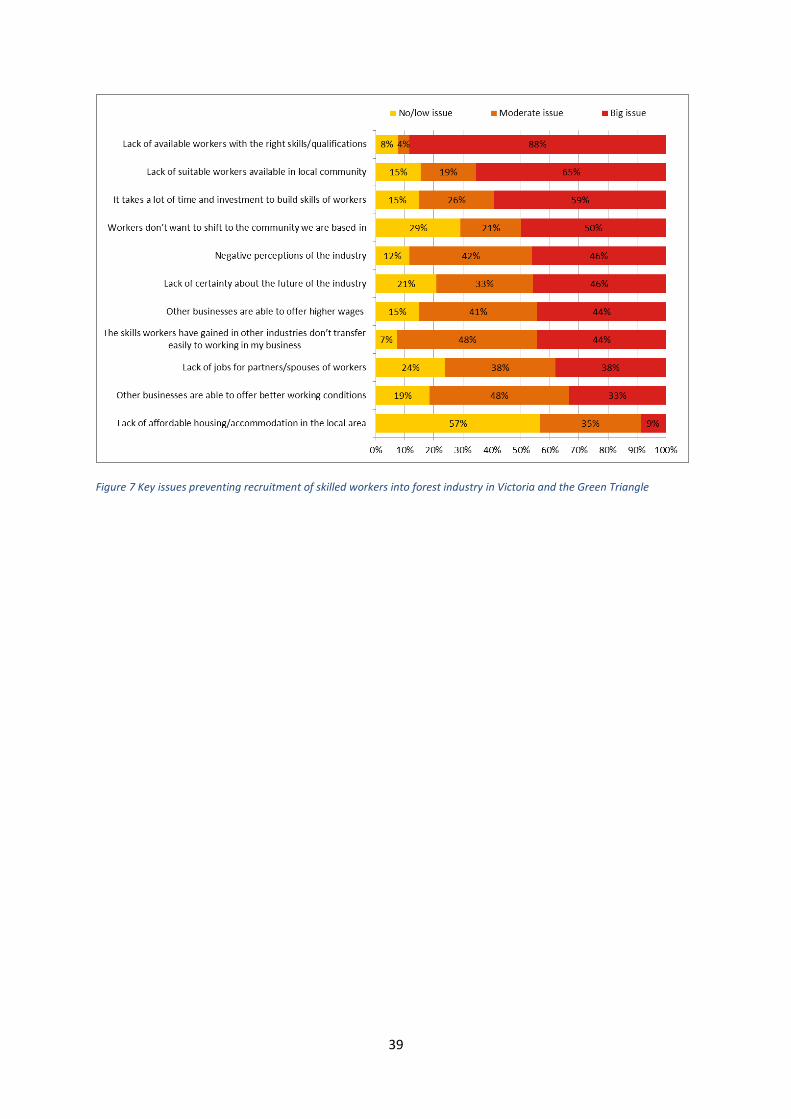
39
Figure 7 Key issues preventing recruitment of skilled workers into forest industry in Victoria and the Green Triangle
39
Industry skills and training needs This section examines the skills and training needs of the forest industry in the Victorian and Green
Triangle regions5. The forest industry needs workers with a diverse range of skills, which are evolving
over time as the technologies used in the industry evolve.
Forest industry businesses were asked what types of skills were needed by their workforce, whether
they required workers to have formal accreditation in these skills, and how they currently provided
training. forest ecology and silviculture compared to growers and processors. A total of 75% of
growers required skills in marketing/sales, however none indicated a need for formal accreditation
in this area, while 78% of processors required skills in marketing/sales and 50% reported needing
accreditation.
Businesses were also asked to identify whether they delivered skills training in different competency
areas via in-house training by other staff, in-house training by an expert, or training via a registered
training organisation (RTO). They were able to select more than one of these (Table 21):
• RTOs were most commonly used to provide training in forest ecology and silviculture, hand-held
machinery operation, road transport and driver training and heavy machinery operation; in
some cases this was supplemented by in-house training
• RTOs were also the most common methods for training in occupational health and safety
training, business and financial management, and fire-fighting, although less than 70% of
businesses used RTOs and many businesses opted for in-house training by other staff
• Compliance training was delivered through an RTO for just over half of all businesses, and in-
house training by other staff or experts for most remaining businesses was almost half,
suggesting opportunities for additional provision of training in this area through more formal
mechanisms
• In-house training was more common than use of a RTO for marketing/sales, IT/software training,
and community relations/engagement.
5 Both regions are combined due to the large proportion of businesses who operated across both regions and did not differentiate skills and training needs by region.
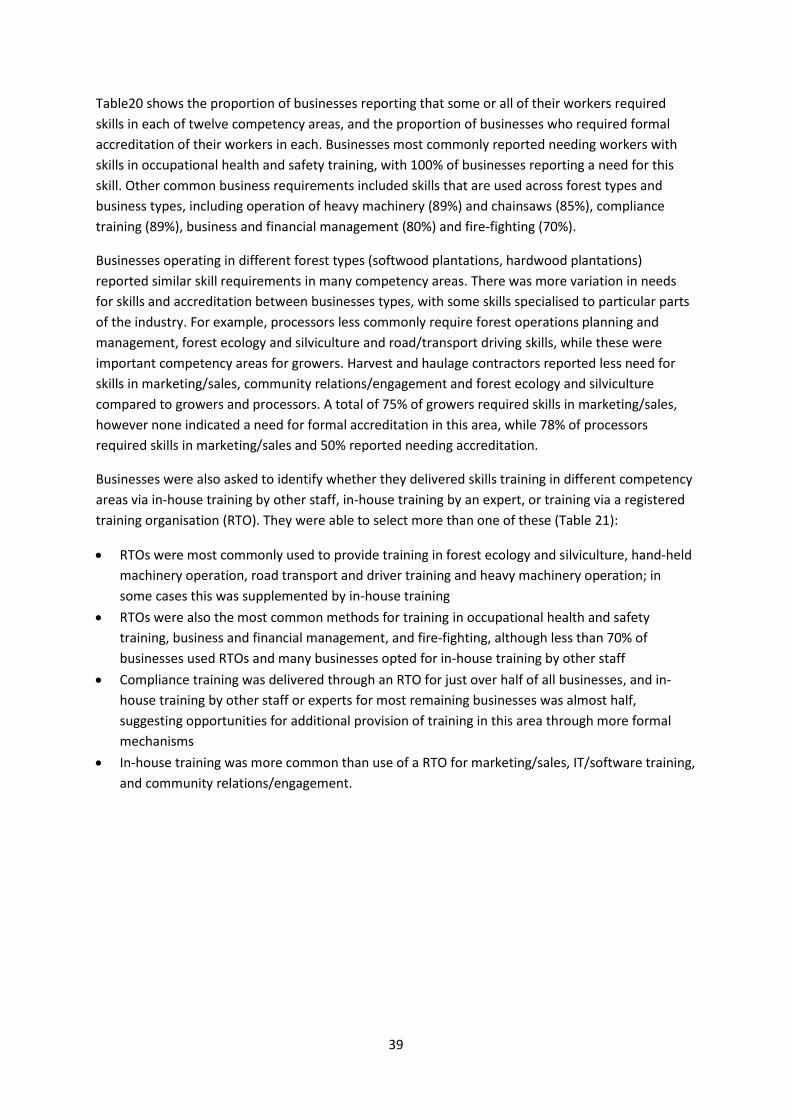
39
Table20 shows the proportion of businesses reporting that some or all of their workers required
skills in each of twelve competency areas, and the proportion of businesses who required formal
accreditation of their workers in each. Businesses most commonly reported needing workers with
skills in occupational health and safety training, with 100% of businesses reporting a need for this
skill. Other common business requirements included skills that are used across forest types and
business types, including operation of heavy machinery (89%) and chainsaws (85%), compliance
training (89%), business and financial management (80%) and fire-fighting (70%).
Businesses operating in different forest types (softwood plantations, hardwood plantations)
reported similar skill requirements in many competency areas. There was more variation in needs
for skills and accreditation between businesses types, with some skills specialised to particular parts
of the industry. For example, processors less commonly require forest operations planning and
management, forest ecology and silviculture and road/transport driving skills, while these were
important competency areas for growers. Harvest and haulage contractors reported less need for
skills in marketing/sales, community relations/engagement and forest ecology and silviculture
compared to growers and processors. A total of 75% of growers required skills in marketing/sales,
however none indicated a need for formal accreditation in this area, while 78% of processors
required skills in marketing/sales and 50% reported needing accreditation.
Businesses were also asked to identify whether they delivered skills training in different competency
areas via in-house training by other staff, in-house training by an expert, or training via a registered
training organisation (RTO). They were able to select more than one of these (Table 21):
• RTOs were most commonly used to provide training in forest ecology and silviculture, hand-held
machinery operation, road transport and driver training and heavy machinery operation; in
some cases this was supplemented by in-house training
• RTOs were also the most common methods for training in occupational health and safety
training, business and financial management, and fire-fighting, although less than 70% of
businesses used RTOs and many businesses opted for in-house training by other staff
• Compliance training was delivered through an RTO for just over half of all businesses, and in-
house training by other staff or experts for most remaining businesses was almost half,
suggesting opportunities for additional provision of training in this area through more formal
mechanisms
• In-house training was more common than use of a RTO for marketing/sales, IT/software training,
and community relations/engagement.
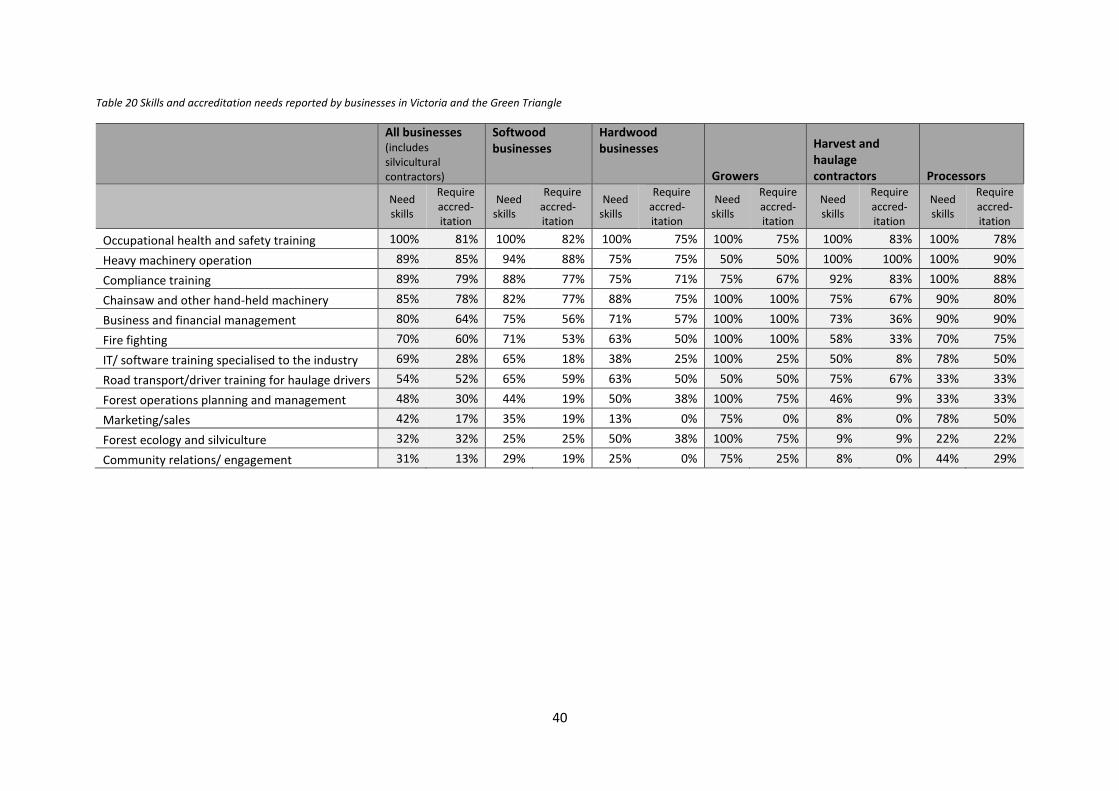
40
Table 20 Skills and accreditation needs reported by businesses in Victoria and the Green Triangle
All businesses (includes silvicultural contractors)
Softwood businesses
Hardwood businesses
Growers
Harvest and haulage contractors Processors
Need skills
Require accred-itation
Need skills
Require accred-itation
Need skills
Require accred-itation
Need skills
Require accred-itation
Need skills
Require accred-itation
Need skills
Require accred-itation
Occupational health and safety training 100% 81% 100% 82% 100% 75% 100% 75% 100% 83% 100% 78%
Heavy machinery operation 89% 85% 94% 88% 75% 75% 50% 50% 100% 100% 100% 90%
Compliance training 89% 79% 88% 77% 75% 71% 75% 67% 92% 83% 100% 88%
Chainsaw and other hand-held machinery 85% 78% 82% 77% 88% 75% 100% 100% 75% 67% 90% 80%
Business and financial management 80% 64% 75% 56% 71% 57% 100% 100% 73% 36% 90% 90%
Fire fighting 70% 60% 71% 53% 63% 50% 100% 100% 58% 33% 70% 75%
IT/ software training specialised to the industry 69% 28% 65% 18% 38% 25% 100% 25% 50% 8% 78% 50%
Road transport/driver training for haulage drivers 54% 52% 65% 59% 63% 50% 50% 50% 75% 67% 33% 33%
Forest operations planning and management 48% 30% 44% 19% 50% 38% 100% 75% 46% 9% 33% 33%
Marketing/sales 42% 17% 35% 19% 13% 0% 75% 0% 8% 0% 78% 50%
Forest ecology and silviculture 32% 32% 25% 25% 50% 38% 100% 75% 9% 9% 22% 22%
Community relations/ engagement 31% 13% 29% 19% 25% 0% 75% 25% 8% 0% 44% 29%
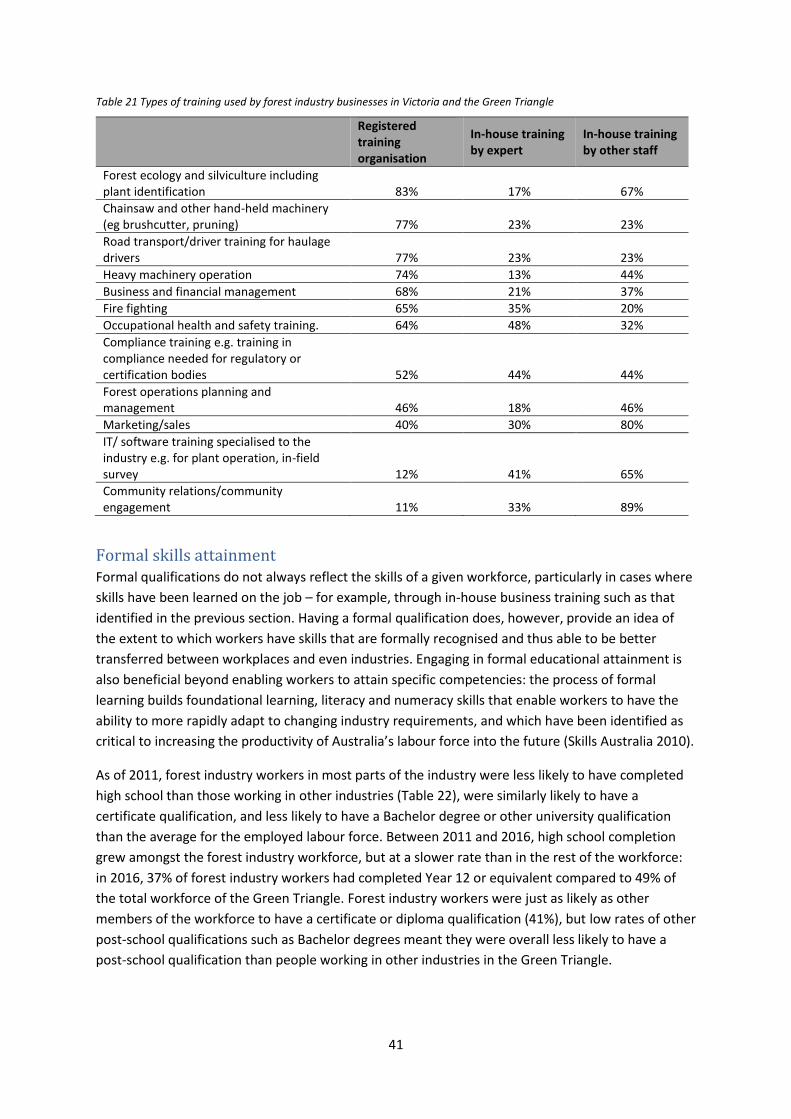
41
Table 21 Types of training used by forest industry businesses in Victoria and the Green Triangle
Registered training organisation
In-house training by expert
In-house training by other staff
Forest ecology and silviculture including plant identification 83% 17% 67%
Chainsaw and other hand-held machinery (eg brushcutter, pruning) 77% 23% 23%
Road transport/driver training for haulage drivers 77% 23% 23%
Heavy machinery operation 74% 13% 44%
Business and financial management 68% 21% 37%
Fire fighting 65% 35% 20%
Occupational health and safety training. 64% 48% 32%
Compliance training e.g. training in compliance needed for regulatory or certification bodies 52% 44% 44%
Forest operations planning and management 46% 18% 46%
Marketing/sales 40% 30% 80%
IT/ software training specialised to the industry e.g. for plant operation, in-field survey 12% 41% 65%
Community relations/community engagement 11% 33% 89%
Formal skills attainment Formal qualifications do not always reflect the skills of a given workforce, particularly in cases where
skills have been learned on the job – for example, through in-house business training such as that
identified in the previous section. Having a formal qualification does, however, provide an idea of
the extent to which workers have skills that are formally recognised and thus able to be better
transferred between workplaces and even industries. Engaging in formal educational attainment is
also beneficial beyond enabling workers to attain specific competencies: the process of formal
learning builds foundational learning, literacy and numeracy skills that enable workers to have the
ability to more rapidly adapt to changing industry requirements, and which have been identified as
critical to increasing the productivity of Australia’s labour force into the future (Skills Australia 2010).
As of 2011, forest industry workers in most parts of the industry were less likely to have completed
high school than those working in other industries (Table 22), were similarly likely to have a
certificate qualification, and less likely to have a Bachelor degree or other university qualification
than the average for the employed labour force. Between 2011 and 2016, high school completion
grew amongst the forest industry workforce, but at a slower rate than in the rest of the workforce:
in 2016, 37% of forest industry workers had completed Year 12 or equivalent compared to 49% of
the total workforce of the Green Triangle. Forest industry workers were just as likely as other
members of the workforce to have a certificate or diploma qualification (41%), but low rates of other
post-school qualifications such as Bachelor degrees meant they were overall less likely to have a
post-school qualification than people working in other industries in the Green Triangle.
42
Table 22 Formal educational attainment: rates of attainment of high school and post-school qualifications in the Green Triangle forest industry, 2006 to 2016
% completed high school (Year 12 or equivalent)
% with no post-school qualification
% with Certificate or Diploma qualification
% with Graduate Diploma, Bachelor or postgraduate degree
Industry sector (ABS classification) 2006 2011 2016 2006 2011 2016 2006 2011 2016 2006 2011 2016
Forestry 41% 35% 38% 57% 48% 46% 25% 37% 42% 18% 15% 11%
Logging 17% 16% 28% 62% 71% 57% 31% 29% 40% 0% 0% 2%
Forestry Support Services 34% 33% 55% 70% 54% 35% 21% 31% 41% 10% 15% 27%
Wood product manufacturing 29% 45% 34% 64% 59% 53% 32% 37% 43% 4% 4% 4%
Pulp & paper manufacturing 35% 31% 46% 56% 51% 49% 35% 37% 38% 10% 12% 13%
Forest industry workforce – Green Triangle
31% 34% 37% 62% 57% 51% 32% 36% 41% 7% 7% 8%
Employed labour force (all industries) – Green Triangle
39% 44% 49% 54% 48% 42% 33% 37% 41% 13% 15% 17%
Data source: ABS Census of Population and Housing, 2006, 2011, TableBuilderPro Place of Usual Residence database. Data are reported for the Victorian and South Australian parts of the Green Triangle together as results were almost identical for both regions. Workers who did not complete this question on the Census were excluded from the analysis.
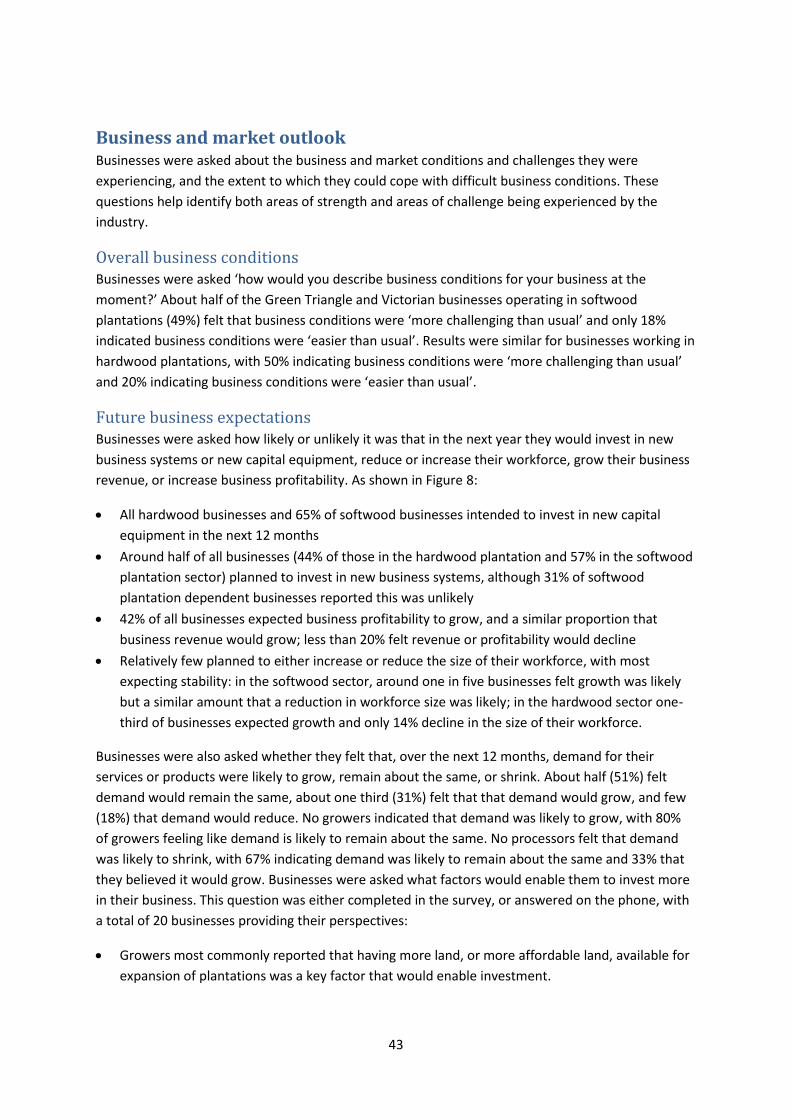
43
Business and market outlook Businesses were asked about the business and market conditions and challenges they were
experiencing, and the extent to which they could cope with difficult business conditions. These
questions help identify both areas of strength and areas of challenge being experienced by the
industry.
Overall business conditions Businesses were asked ‘how would you describe business conditions for your business at the
moment?’ About half of the Green Triangle and Victorian businesses operating in softwood
plantations (49%) felt that business conditions were ‘more challenging than usual’ and only 18%
indicated business conditions were ‘easier than usual’. Results were similar for businesses working in
hardwood plantations, with 50% indicating business conditions were ‘more challenging than usual’
and 20% indicating business conditions were ‘easier than usual’.
Future business expectations Businesses were asked how likely or unlikely it was that in the next year they would invest in new
business systems or new capital equipment, reduce or increase their workforce, grow their business
revenue, or increase business profitability. As shown in Figure 8:
• All hardwood businesses and 65% of softwood businesses intended to invest in new capital
equipment in the next 12 months
• Around half of all businesses (44% of those in the hardwood plantation and 57% in the softwood
plantation sector) planned to invest in new business systems, although 31% of softwood
plantation dependent businesses reported this was unlikely
• 42% of all businesses expected business profitability to grow, and a similar proportion that
business revenue would grow; less than 20% felt revenue or profitability would decline
• Relatively few planned to either increase or reduce the size of their workforce, with most
expecting stability: in the softwood sector, around one in five businesses felt growth was likely
but a similar amount that a reduction in workforce size was likely; in the hardwood sector one-
third of businesses expected growth and only 14% decline in the size of their workforce.
Businesses were also asked whether they felt that, over the next 12 months, demand for their
services or products were likely to grow, remain about the same, or shrink. About half (51%) felt
demand would remain the same, about one third (31%) felt that that demand would grow, and few
(18%) that demand would reduce. No growers indicated that demand was likely to grow, with 80%
of growers feeling like demand is likely to remain about the same. No processors felt that demand
was likely to shrink, with 67% indicating demand was likely to remain about the same and 33% that
they believed it would grow. Businesses were asked what factors would enable them to invest more
in their business. This question was either completed in the survey, or answered on the phone, with
a total of 20 businesses providing their perspectives:
• Growers most commonly reported that having more land, or more affordable land, available for
expansion of plantations was a key factor that would enable investment.
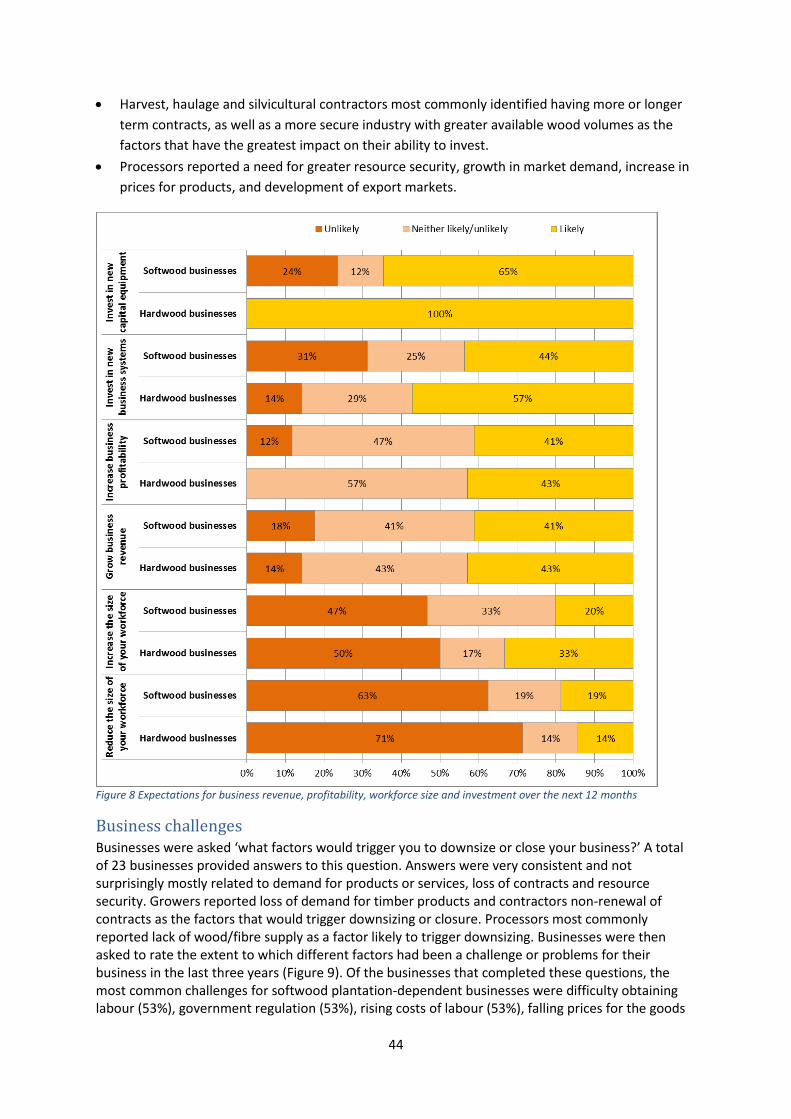
44
• Harvest, haulage and silvicultural contractors most commonly identified having more or longer
term contracts, as well as a more secure industry with greater available wood volumes as the
factors that have the greatest impact on their ability to invest.
• Processors reported a need for greater resource security, growth in market demand, increase in
prices for products, and development of export markets.
Figure 8 Expectations for business revenue, profitability, workforce size and investment over the next 12 months
Business challenges Businesses were asked ‘what factors would trigger you to downsize or close your business?’ A total of 23 businesses provided answers to this question. Answers were very consistent and not surprisingly mostly related to demand for products or services, loss of contracts and resource security. Growers reported loss of demand for timber products and contractors non-renewal of contracts as the factors that would trigger downsizing or closure. Processors most commonly reported lack of wood/fibre supply as a factor likely to trigger downsizing. Businesses were then asked to rate the extent to which different factors had been a challenge or problems for their business in the last three years (Figure 9). Of the businesses that completed these questions, the most common challenges for softwood plantation-dependent businesses were difficulty obtaining labour (53%), government regulation (53%), rising costs of labour (53%), falling prices for the goods
45
they produced (41%) and rising input costs (35%). For hardwood plantation-dependent businesses, the most common challenges were difficulty obtaining labour (75%), rising costs of labour (50%), lack of investment in the industry as a whole (50%), government regulation (38%), and rising input costs (38%).
Figure 9 Challenges experienced by Green Triangle forest industry businesses
46
Community perceptions of the social, economic, service and
infrastructure effects of the forest industry To further evaluate the socio-economic effects of the forest industry in the communities in which it
operates, residents living in communities across Australia, including the Green Triangle regions of
Victoria and South Australia, were asked about (i) their overall views about quality of life and
liveability of their community, and (ii) the extent to which they felt the different industries that
operated in their region affected different social and economic aspects of their lives.
These questions were asked as part of the 2016 Regional Wellbeing Survey, a large-scale survey of
13,000 people living in rural and regional areas of Australia. Schirmer et al. (2017) provide a detailed
description of the survey methods and data collection process.
Quality of life and liveability Quality of life and liveability of local regions was examined by analysing responses to survey
questions which asked residents of these regions how they viewed the overall liveability, economy,
roads, friendliness, safety, landscape and environmental health of their local community. To identify
whether the forest industry may be contributing to differences in these experiences, the following
groups were compared:
• Rural and regional South Australia: a total of around 1,480 people from rural and regional South
Australia participated in the survey, including a small number of Adelaide residents of whom
most lived on the urban fringe of Adelaide6
• Rural and regional Victoria: a total of around 3,630 people from rural and regional Victoria
participated in the survey, including Melbourne residents living on the urban fringe of the city
(for example, in parts of the Yarra Ranges local government area and Mornington Peninsula that
are on the fringe of the suburban area)3
• High forest industry dependence: people living in local government areas (LGAs) in which more
than 3% of employment was directly dependent on the forest industry, or in which there were
large areas of plantations or harvesting of native forests. This was examined by region within the
Green Triangle:
o South Australian Green Triangle: residents of the three LGAs of Grant, Mount
Gambier and Wattle Range had high forest industry dependence. A total of around
153 residents from these LGAs participated in the survey.
o Victorian Green Triangle: residents of the LGAs of Glenelg and Southern Grampians
had high forest industry dependence. A total of around 188 residents from these
two LGAs participated in the survey.
• Low forest industry dependence: people living in LGAs with less than 3% of jobs directly
dependent on the forest industry, or with relatively smaller amounts of plantation of forest
harvesting:
o South Australian Green Triangle: residents of Kangaroo Island, Naracoorte and
Lucindale and Tatiara, with a total of around 77 survey respondents.
o Victorian Green Triangle: residents of Horsham, Moyne, Warnambool and West
Wimmera, with a total of around 210 survey respondents.
6 Not all answered every question, and as such the ‘n’ changes slightly for different results presented below.
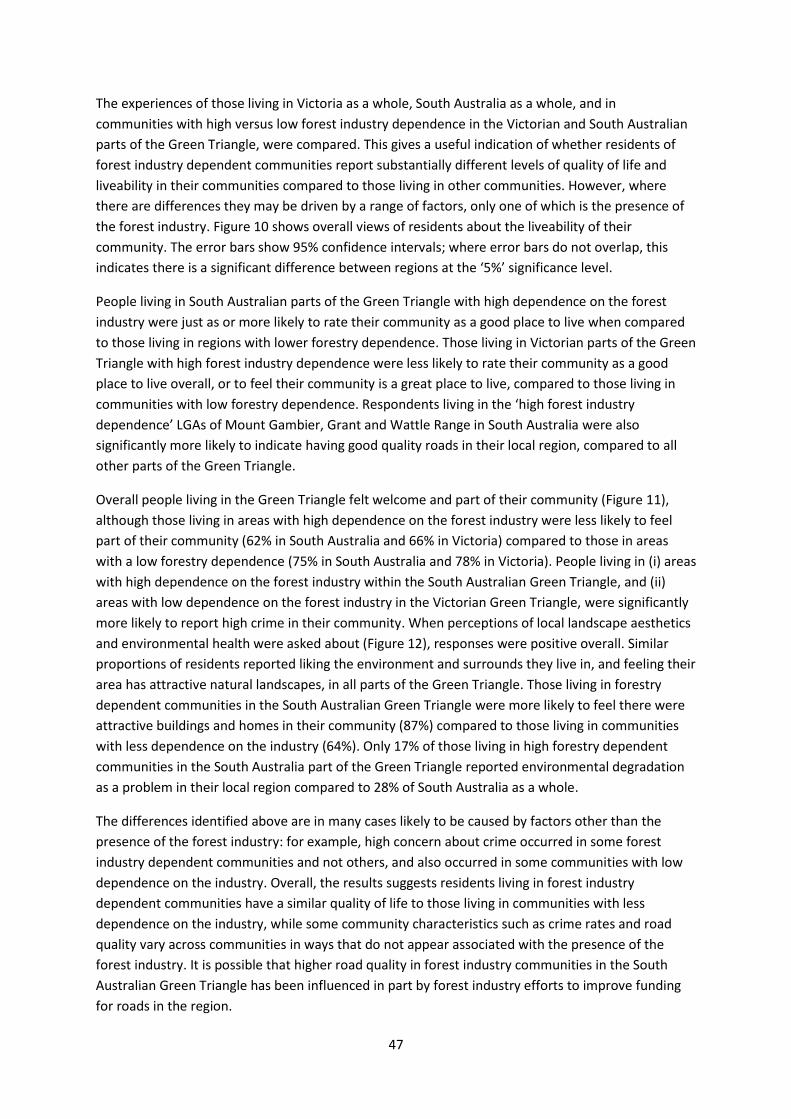
47
The experiences of those living in Victoria as a whole, South Australia as a whole, and in
communities with high versus low forest industry dependence in the Victorian and South Australian
parts of the Green Triangle, were compared. This gives a useful indication of whether residents of
forest industry dependent communities report substantially different levels of quality of life and
liveability in their communities compared to those living in other communities. However, where
there are differences they may be driven by a range of factors, only one of which is the presence of
the forest industry. Figure 10 shows overall views of residents about the liveability of their
community. The error bars show 95% confidence intervals; where error bars do not overlap, this
indicates there is a significant difference between regions at the ‘5%’ significance level.
People living in South Australian parts of the Green Triangle with high dependence on the forest
industry were just as or more likely to rate their community as a good place to live when compared
to those living in regions with lower forestry dependence. Those living in Victorian parts of the Green
Triangle with high forest industry dependence were less likely to rate their community as a good
place to live overall, or to feel their community is a great place to live, compared to those living in
communities with low forestry dependence. Respondents living in the ‘high forest industry
dependence’ LGAs of Mount Gambier, Grant and Wattle Range in South Australia were also
significantly more likely to indicate having good quality roads in their local region, compared to all
other parts of the Green Triangle.
Overall people living in the Green Triangle felt welcome and part of their community (Figure 11),
although those living in areas with high dependence on the forest industry were less likely to feel
part of their community (62% in South Australia and 66% in Victoria) compared to those in areas
with a low forestry dependence (75% in South Australia and 78% in Victoria). People living in (i) areas
with high dependence on the forest industry within the South Australian Green Triangle, and (ii)
areas with low dependence on the forest industry in the Victorian Green Triangle, were significantly
more likely to report high crime in their community. When perceptions of local landscape aesthetics
and environmental health were asked about (Figure 12), responses were positive overall. Similar
proportions of residents reported liking the environment and surrounds they live in, and feeling their
area has attractive natural landscapes, in all parts of the Green Triangle. Those living in forestry
dependent communities in the South Australian Green Triangle were more likely to feel there were
attractive buildings and homes in their community (87%) compared to those living in communities
with less dependence on the industry (64%). Only 17% of those living in high forestry dependent
communities in the South Australia part of the Green Triangle reported environmental degradation
as a problem in their local region compared to 28% of South Australia as a whole.
The differences identified above are in many cases likely to be caused by factors other than the
presence of the forest industry: for example, high concern about crime occurred in some forest
industry dependent communities and not others, and also occurred in some communities with low
dependence on the industry. Overall, the results suggests residents living in forest industry
dependent communities have a similar quality of life to those living in communities with less
dependence on the industry, while some community characteristics such as crime rates and road
quality vary across communities in ways that do not appear associated with the presence of the
forest industry. It is possible that higher road quality in forest industry communities in the South
Australian Green Triangle has been influenced in part by forest industry efforts to improve funding
for roads in the region.
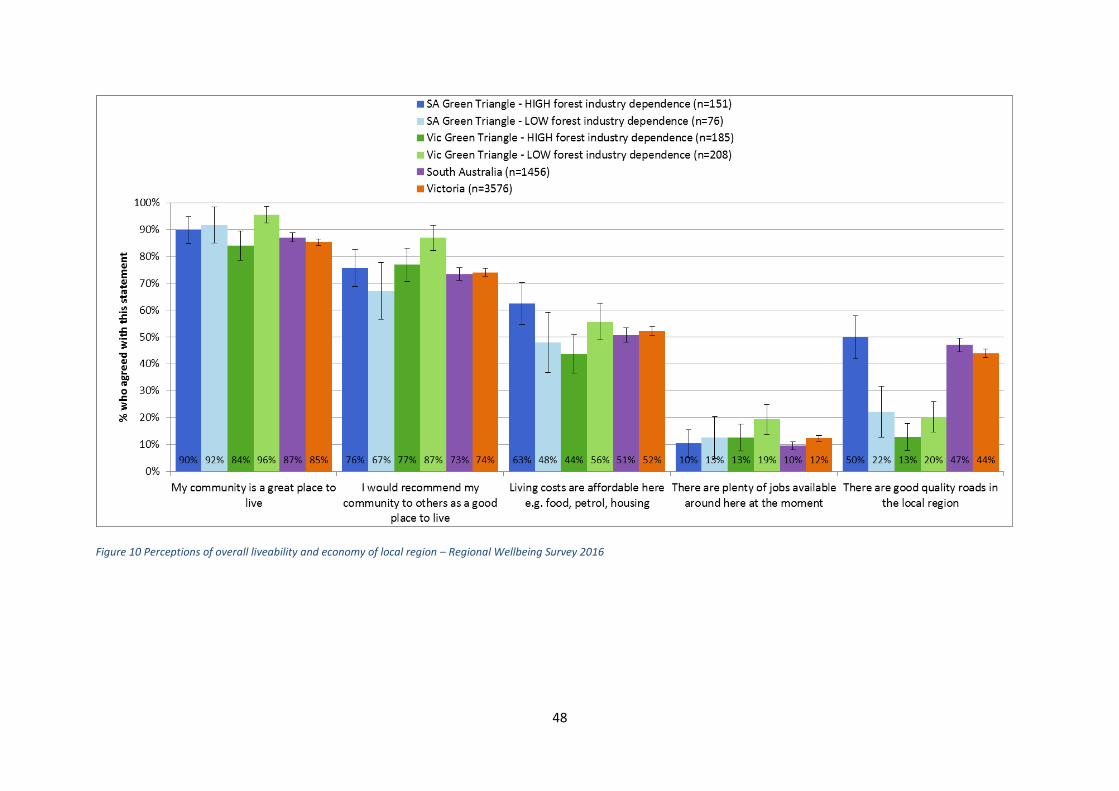
48
Figure 10 Perceptions of overall liveability and economy of local region – Regional Wellbeing Survey 2016
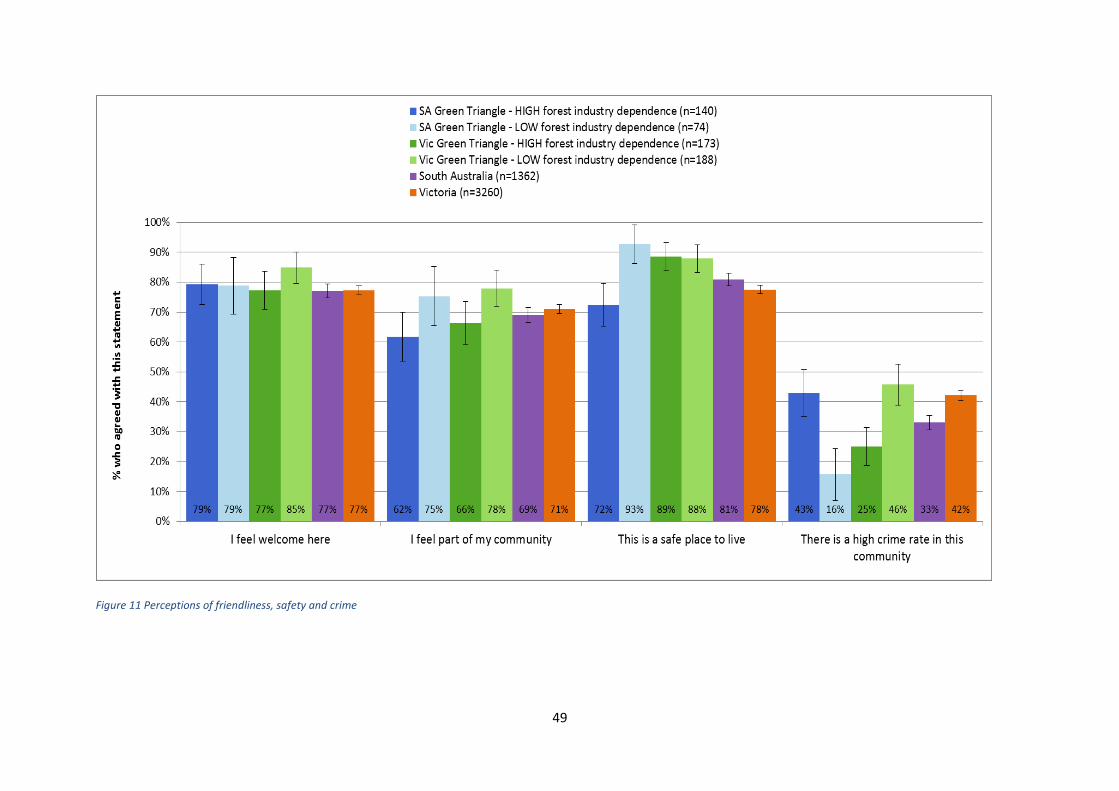
49
Figure 11 Perceptions of friendliness, safety and crime
50
Figure 12 Perceptions of landscape aesthetics and environmental health
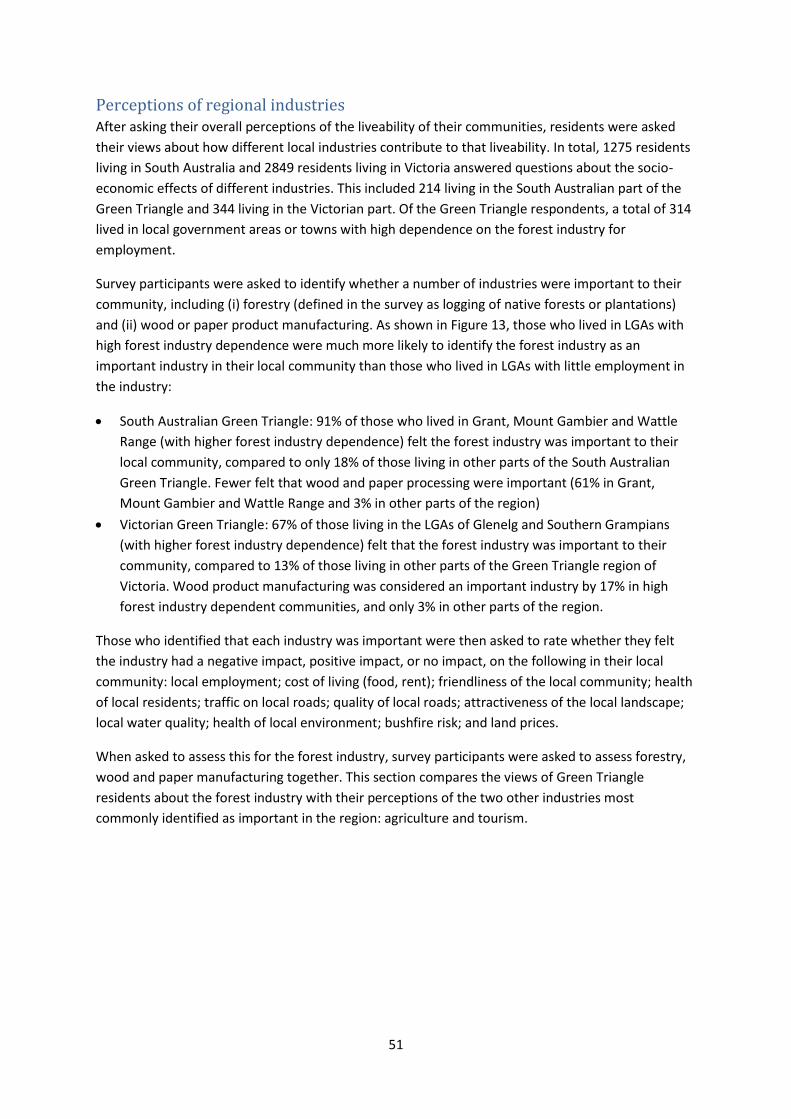
51
Perceptions of regional industries After asking their overall perceptions of the liveability of their communities, residents were asked
their views about how different local industries contribute to that liveability. In total, 1275 residents
living in South Australia and 2849 residents living in Victoria answered questions about the socio-
economic effects of different industries. This included 214 living in the South Australian part of the
Green Triangle and 344 living in the Victorian part. Of the Green Triangle respondents, a total of 314
lived in local government areas or towns with high dependence on the forest industry for
employment.
Survey participants were asked to identify whether a number of industries were important to their
community, including (i) forestry (defined in the survey as logging of native forests or plantations)
and (ii) wood or paper product manufacturing. As shown in Figure 13, those who lived in LGAs with
high forest industry dependence were much more likely to identify the forest industry as an
important industry in their local community than those who lived in LGAs with little employment in
the industry:
• South Australian Green Triangle: 91% of those who lived in Grant, Mount Gambier and Wattle
Range (with higher forest industry dependence) felt the forest industry was important to their
local community, compared to only 18% of those living in other parts of the South Australian
Green Triangle. Fewer felt that wood and paper processing were important (61% in Grant,
Mount Gambier and Wattle Range and 3% in other parts of the region)
• Victorian Green Triangle: 67% of those living in the LGAs of Glenelg and Southern Grampians
(with higher forest industry dependence) felt that the forest industry was important to their
community, compared to 13% of those living in other parts of the Green Triangle region of
Victoria. Wood product manufacturing was considered an important industry by 17% in high
forest industry dependent communities, and only 3% in other parts of the region.
Those who identified that each industry was important were then asked to rate whether they felt
the industry had a negative impact, positive impact, or no impact, on the following in their local
community: local employment; cost of living (food, rent); friendliness of the local community; health
of local residents; traffic on local roads; quality of local roads; attractiveness of the local landscape;
local water quality; health of local environment; bushfire risk; and land prices.
When asked to assess this for the forest industry, survey participants were asked to assess forestry,
wood and paper manufacturing together. This section compares the views of Green Triangle
residents about the forest industry with their perceptions of the two other industries most
commonly identified as important in the region: agriculture and tourism.
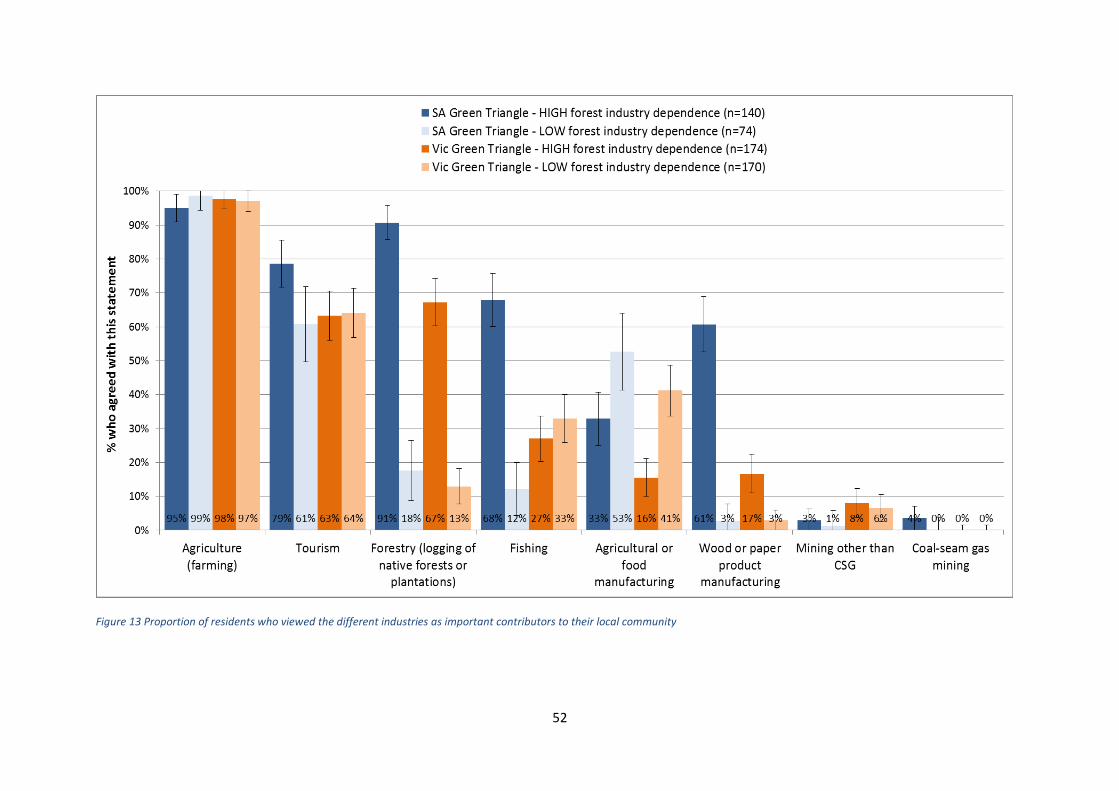
52
Figure 13 Proportion of residents who viewed the different industries as important contributors to their local community
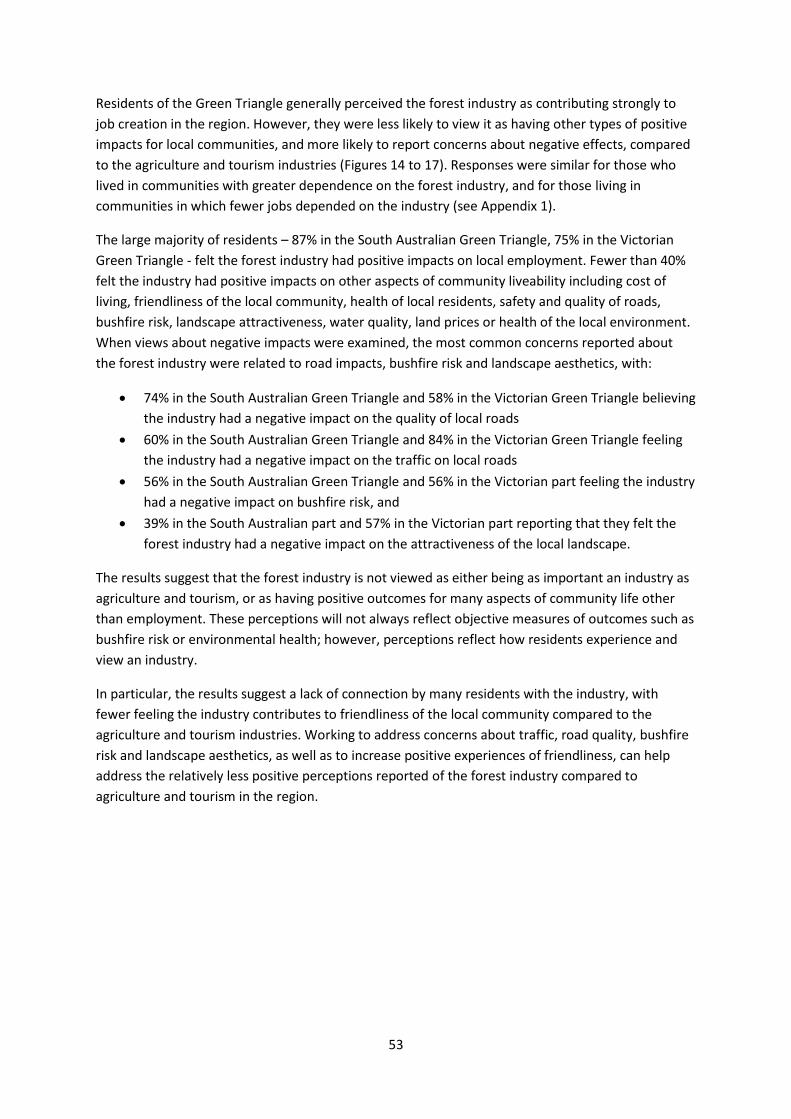
53
Residents of the Green Triangle generally perceived the forest industry as contributing strongly to
job creation in the region. However, they were less likely to view it as having other types of positive
impacts for local communities, and more likely to report concerns about negative effects, compared
to the agriculture and tourism industries (Figures 14 to 17). Responses were similar for those who
lived in communities with greater dependence on the forest industry, and for those living in
communities in which fewer jobs depended on the industry (see Appendix 1).
The large majority of residents – 87% in the South Australian Green Triangle, 75% in the Victorian
Green Triangle - felt the forest industry had positive impacts on local employment. Fewer than 40%
felt the industry had positive impacts on other aspects of community liveability including cost of
living, friendliness of the local community, health of local residents, safety and quality of roads,
bushfire risk, landscape attractiveness, water quality, land prices or health of the local environment.
When views about negative impacts were examined, the most common concerns reported about
the forest industry were related to road impacts, bushfire risk and landscape aesthetics, with:
• 74% in the South Australian Green Triangle and 58% in the Victorian Green Triangle believing
the industry had a negative impact on the quality of local roads
• 60% in the South Australian Green Triangle and 84% in the Victorian Green Triangle feeling
the industry had a negative impact on the traffic on local roads
• 56% in the South Australian Green Triangle and 56% in the Victorian part feeling the industry
had a negative impact on bushfire risk, and
• 39% in the South Australian part and 57% in the Victorian part reporting that they felt the
forest industry had a negative impact on the attractiveness of the local landscape.
The results suggest that the forest industry is not viewed as either being as important an industry as
agriculture and tourism, or as having positive outcomes for many aspects of community life other
than employment. These perceptions will not always reflect objective measures of outcomes such as
bushfire risk or environmental health; however, perceptions reflect how residents experience and
view an industry.
In particular, the results suggest a lack of connection by many residents with the industry, with
fewer feeling the industry contributes to friendliness of the local community compared to the
agriculture and tourism industries. Working to address concerns about traffic, road quality, bushfire
risk and landscape aesthetics, as well as to increase positive experiences of friendliness, can help
address the relatively less positive perceptions reported of the forest industry compared to
agriculture and tourism in the region.
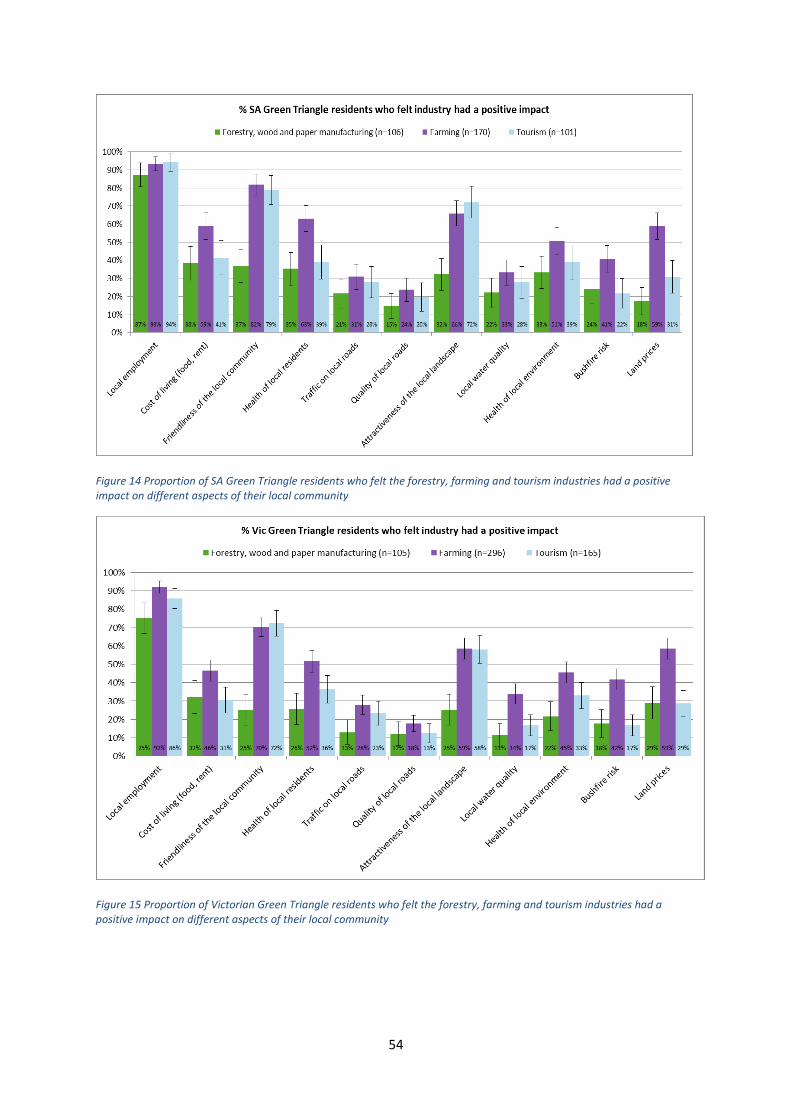
54
Figure 14 Proportion of SA Green Triangle residents who felt the forestry, farming and tourism industries had a positive impact on different aspects of their local community
Figure 15 Proportion of Victorian Green Triangle residents who felt the forestry, farming and tourism industries had a positive impact on different aspects of their local community
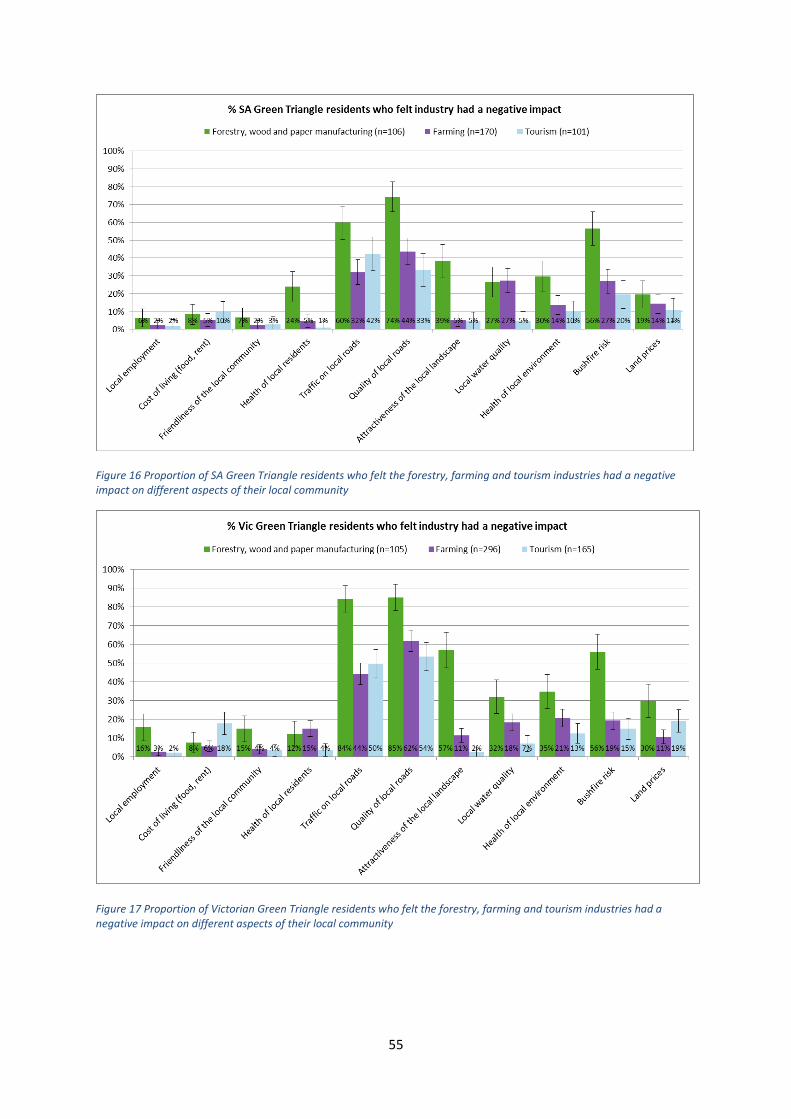
55
Figure 16 Proportion of SA Green Triangle residents who felt the forestry, farming and tourism industries had a negative impact on different aspects of their local community
Figure 17 Proportion of Victorian Green Triangle residents who felt the forestry, farming and tourism industries had a negative impact on different aspects of their local community
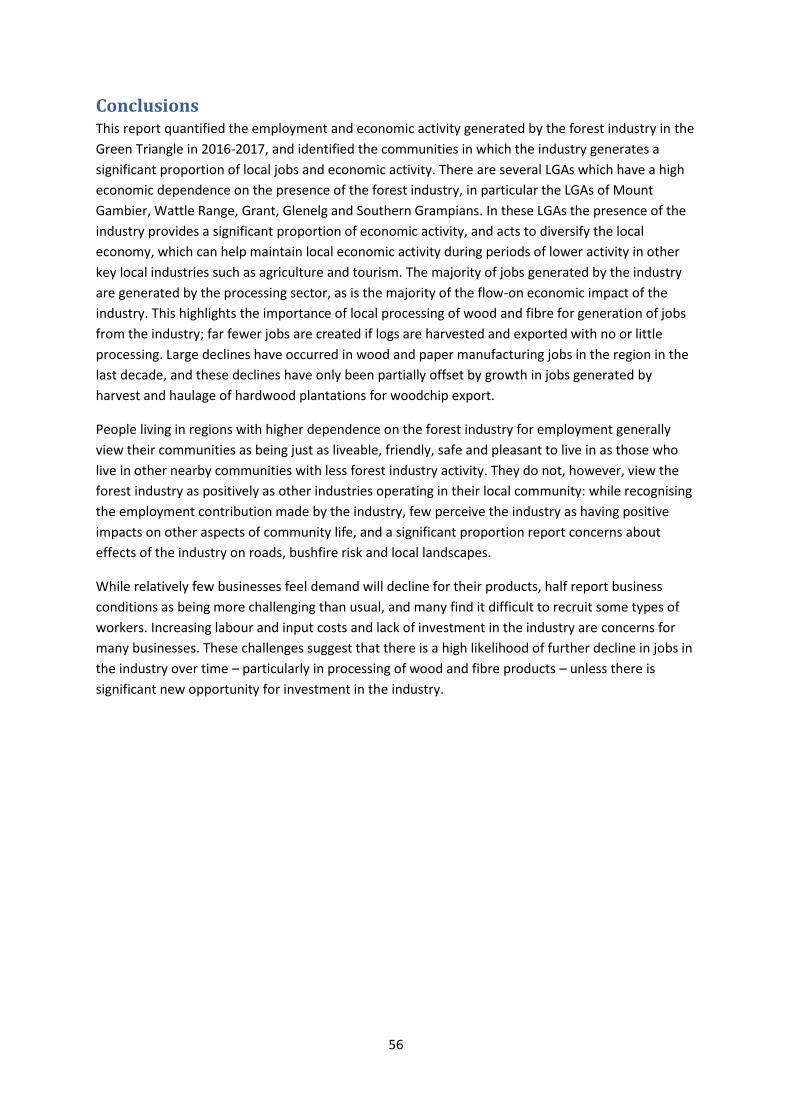
56
Conclusions This report quantified the employment and economic activity generated by the forest industry in the
Green Triangle in 2016-2017, and identified the communities in which the industry generates a
significant proportion of local jobs and economic activity. There are several LGAs which have a high
economic dependence on the presence of the forest industry, in particular the LGAs of Mount
Gambier, Wattle Range, Grant, Glenelg and Southern Grampians. In these LGAs the presence of the
industry provides a significant proportion of economic activity, and acts to diversify the local
economy, which can help maintain local economic activity during periods of lower activity in other
key local industries such as agriculture and tourism. The majority of jobs generated by the industry
are generated by the processing sector, as is the majority of the flow-on economic impact of the
industry. This highlights the importance of local processing of wood and fibre for generation of jobs
from the industry; far fewer jobs are created if logs are harvested and exported with no or little
processing. Large declines have occurred in wood and paper manufacturing jobs in the region in the
last decade, and these declines have only been partially offset by growth in jobs generated by
harvest and haulage of hardwood plantations for woodchip export.
People living in regions with higher dependence on the forest industry for employment generally
view their communities as being just as liveable, friendly, safe and pleasant to live in as those who
live in other nearby communities with less forest industry activity. They do not, however, view the
forest industry as positively as other industries operating in their local community: while recognising
the employment contribution made by the industry, few perceive the industry as having positive
impacts on other aspects of community life, and a significant proportion report concerns about
effects of the industry on roads, bushfire risk and local landscapes.
While relatively few businesses feel demand will decline for their products, half report business
conditions as being more challenging than usual, and many find it difficult to recruit some types of
workers. Increasing labour and input costs and lack of investment in the industry are concerns for
many businesses. These challenges suggest that there is a high likelihood of further decline in jobs in
the industry over time – particularly in processing of wood and fibre products – unless there is
significant new opportunity for investment in the industry.
57
References ABARES 2015. Diversity in Australia’s forest industry workforce. Australian Bureau of Agricultural and
Resource Economics and Sciences, Canberra. URL:
http://www.agriculture.gov.au/abares/forestsaustralia/Documents/DvrstyInAustFrstyWrkfrc201502
20v1.0.0.pdf Accessed 19 March 2017
ABARES 2016. Australian plantation statistics 2016, Australian Bureau of Agricultural and Resource
Economics and Sciences, Canberra, August
ABARES. 2013. Australian forest and wood product statistics September and December quarters
2012. ABARES, Canberra.
ABS. 1973. Year Book Australia 1973. Catalogue No. 1301.0. Australian Bureau of Statistics,
Canberra.
ABS. 2016. Australian Industry, 2014-15. Catalogue Number 8155.0. ABS, Canberra.
ABS/SNZ. 2013. Australian and New Zealand Standard Industrial Classification (ANZSIC), Revision 2.0.
Catalogue Number 1292.0. Australian Bureau of Statistics, Canberra.
ABC. 2011. Tantanoola pulp mill closure confirmed. September 19, 2011. URL:
http://www.abc.net.au/news/2011-09-16/tantanoola-pulp-mill-closure/2902276 Accessed 24
November 2017.
AFPA. 2016. Plantations – the Missing Piece of the Puzzle. Australian Forest Products Association,
Canberra.
CIE (Centre for International Economics). 2005. Plantations, jobs and investment in regional NSW: A
socio-economic analysis of private forestry in the Bombala region. Centre for International
Economics, Canberra.
Commonwealth of Australia. 2015. Meeting market demand: Australia’s forest products and forest
industry. Forest Industry Advisory Council. Department of Agriculture, Canberra.
Dargavel, J. 1995. Fashioning Australia’s forests. Oxford University Press, Oxford.
Margules Groome Pöyry Pty Ltd. 1995. Economic impact of the NSW Timber industry. Margules
Groome Pöyry Pty Ltd, State Forests of NSW, Sydney.
Mylek, M. and Schirmer, J. 2014. Wellbeing of workers in Australian forest, wood and paper
products businesses. Summary report, June 2014. University of Canberra, Canberra.
Mylek, M. R., & Schirmer, J. 2015. Beyond physical health and safety: supporting the wellbeing of
workers employed in the forest industry. Forestry, 88(4), 391-406.
Schirmer, J., & Kanowski, P. (2005). A Mixed Economy Commonwealth of States: Australia.
In Plantations, Privatization, Poverty and Power: Changing Ownership and Management of State
Forests. Earthscan Publications Ltd.
58
Schirmer, J., Binks, B., Kancans, R. and Stenekes, N. 2013. Social indicators for Australia’s forest and
wood products industries: discussion paper. Australian Bureau of Agricultural and Resource
Economics and Sciences, Canberra.
Schirmer, J., Parsons, M., Charalambou, C. and Gavran, M. 2005. Socio-economic impacts of
plantation forestry in the South West Slopes of NSW, 1991 to 2004. Report produced for FWPRDC
Project PN04.4007. Bureau of Rural Sciences, Canberra.
Schirmer, J., Magnusson, A., Mylek, M. and Morison, J. 2017. Forestry in Australia: Methods for
understanding the social and economic impacts of the forest industry. Report produced for Forest
and Wood Products Australia. University of Canberra and EconSearch.
The Advertiser. 2012. 100 jobs to go from South East Wood products company Carter Holt Harvey at
Mt Gambier. 21 November 2012. URL: http://www.adelaidenow.com.au/news/south-australia/jobs-
to-go-from-south-east-wood-products-company-carter-holt-harvey-at-mt-gambier/news-
story/cab960a7e49c86aa84f42abcc18b7c03?sv=937ae65c94cf4062e376dff20ecaf9e3 Accessed 24
November 2017.
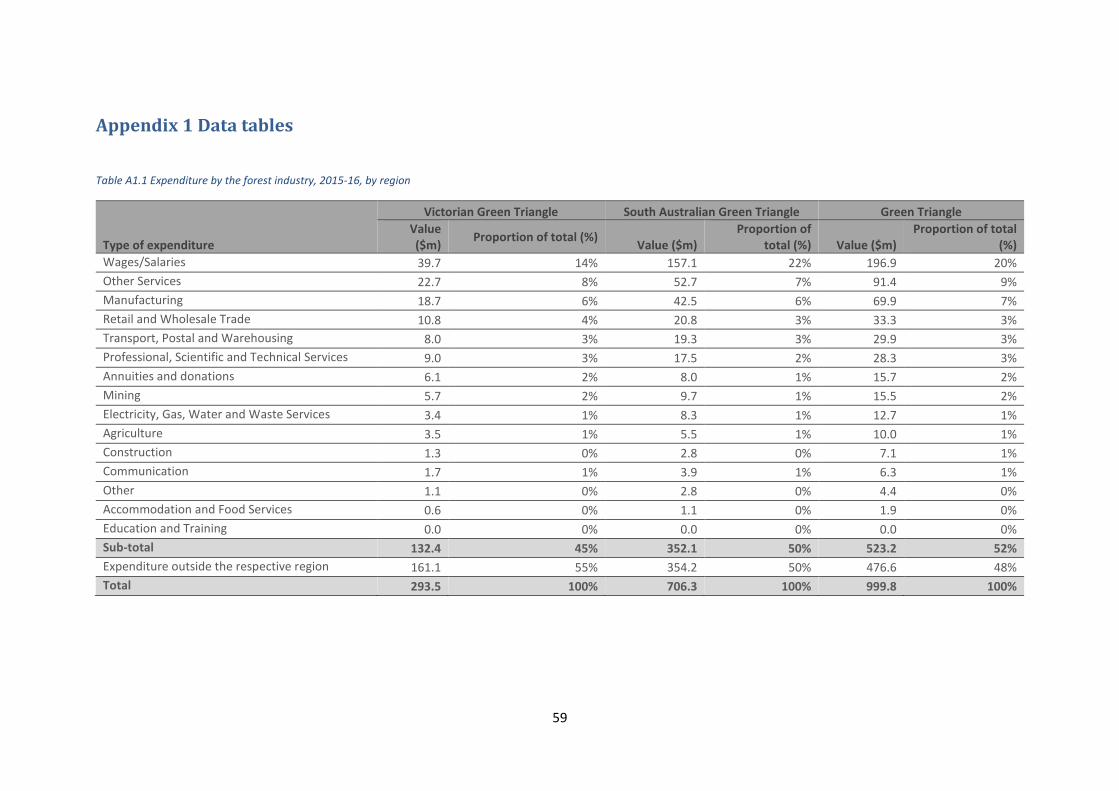
59
Appendix 1 Data tables
Table A1.1 Expenditure by the forest industry, 2015-16, by region
Type of expenditure
Victorian Green Triangle South Australian Green Triangle Green Triangle
Value ($m)
Proportion of total (%) Value ($m)
Proportion of total (%) Value ($m)
Proportion of total (%)
Wages/Salaries 39.7 14% 157.1 22% 196.9 20%
Other Services 22.7 8% 52.7 7% 91.4 9%
Manufacturing 18.7 6% 42.5 6% 69.9 7%
Retail and Wholesale Trade 10.8 4% 20.8 3% 33.3 3%
Transport, Postal and Warehousing 8.0 3% 19.3 3% 29.9 3%
Professional, Scientific and Technical Services 9.0 3% 17.5 2% 28.3 3%
Annuities and donations 6.1 2% 8.0 1% 15.7 2%
Mining 5.7 2% 9.7 1% 15.5 2%
Electricity, Gas, Water and Waste Services 3.4 1% 8.3 1% 12.7 1%
Agriculture 3.5 1% 5.5 1% 10.0 1%
Construction 1.3 0% 2.8 0% 7.1 1%
Communication 1.7 1% 3.9 1% 6.3 1%
Other 1.1 0% 2.8 0% 4.4 0%
Accommodation and Food Services 0.6 0% 1.1 0% 1.9 0%
Education and Training 0.0 0% 0.0 0% 0.0 0%
Sub-total 132.4 45% 352.1 50% 523.2 52%
Expenditure outside the respective region 161.1 55% 354.2 50% 476.6 48%
Total 293.5 100% 706.3 100% 999.8 100%
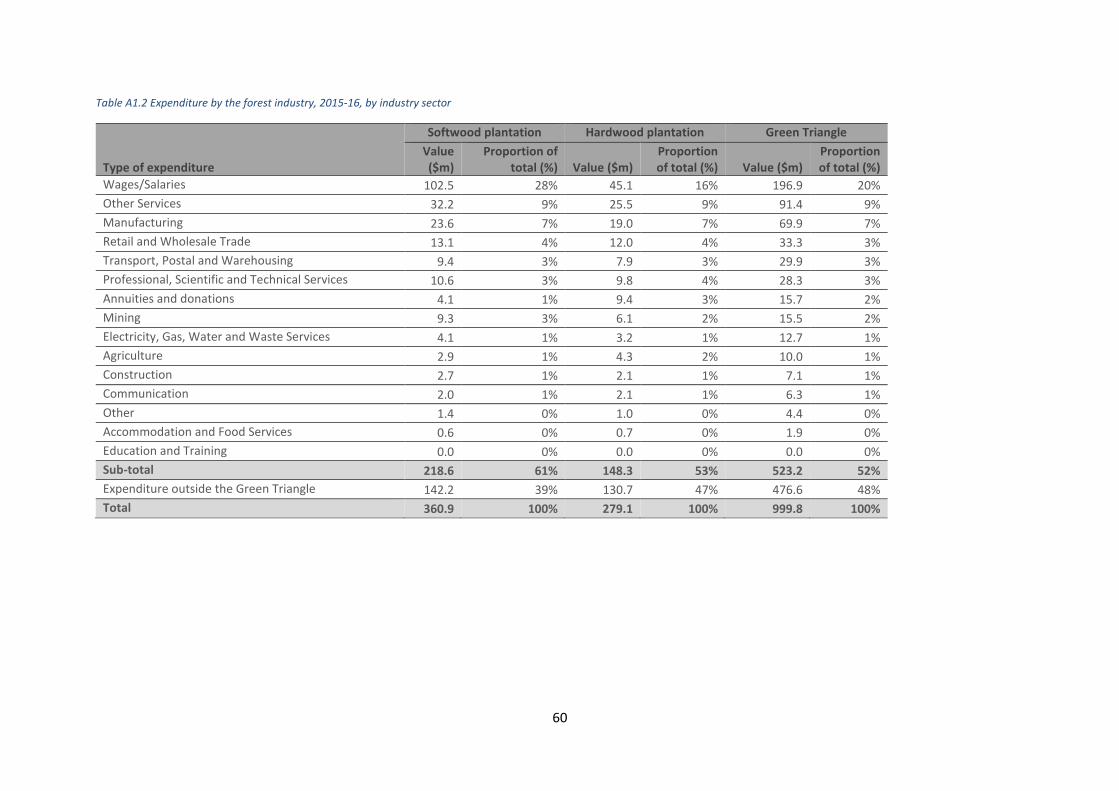
60
Table A1.2 Expenditure by the forest industry, 2015-16, by industry sector
Type of expenditure
Softwood plantation Hardwood plantation Green Triangle
Value ($m)
Proportion of total (%) Value ($m)
Proportion of total (%) Value ($m)
Proportion of total (%)
Wages/Salaries 102.5 28% 45.1 16% 196.9 20%
Other Services 32.2 9% 25.5 9% 91.4 9%
Manufacturing 23.6 7% 19.0 7% 69.9 7%
Retail and Wholesale Trade 13.1 4% 12.0 4% 33.3 3%
Transport, Postal and Warehousing 9.4 3% 7.9 3% 29.9 3%
Professional, Scientific and Technical Services 10.6 3% 9.8 4% 28.3 3%
Annuities and donations 4.1 1% 9.4 3% 15.7 2%
Mining 9.3 3% 6.1 2% 15.5 2%
Electricity, Gas, Water and Waste Services 4.1 1% 3.2 1% 12.7 1%
Agriculture 2.9 1% 4.3 2% 10.0 1%
Construction 2.7 1% 2.1 1% 7.1 1%
Communication 2.0 1% 2.1 1% 6.3 1%
Other 1.4 0% 1.0 0% 4.4 0%
Accommodation and Food Services 0.6 0% 0.7 0% 1.9 0%
Education and Training 0.0 0% 0.0 0% 0.0 0%
Sub-total 218.6 61% 148.3 53% 523.2 52%
Expenditure outside the Green Triangle 142.2 39% 130.7 47% 476.6 48%
Total 360.9 100% 279.1 100% 999.8 100%
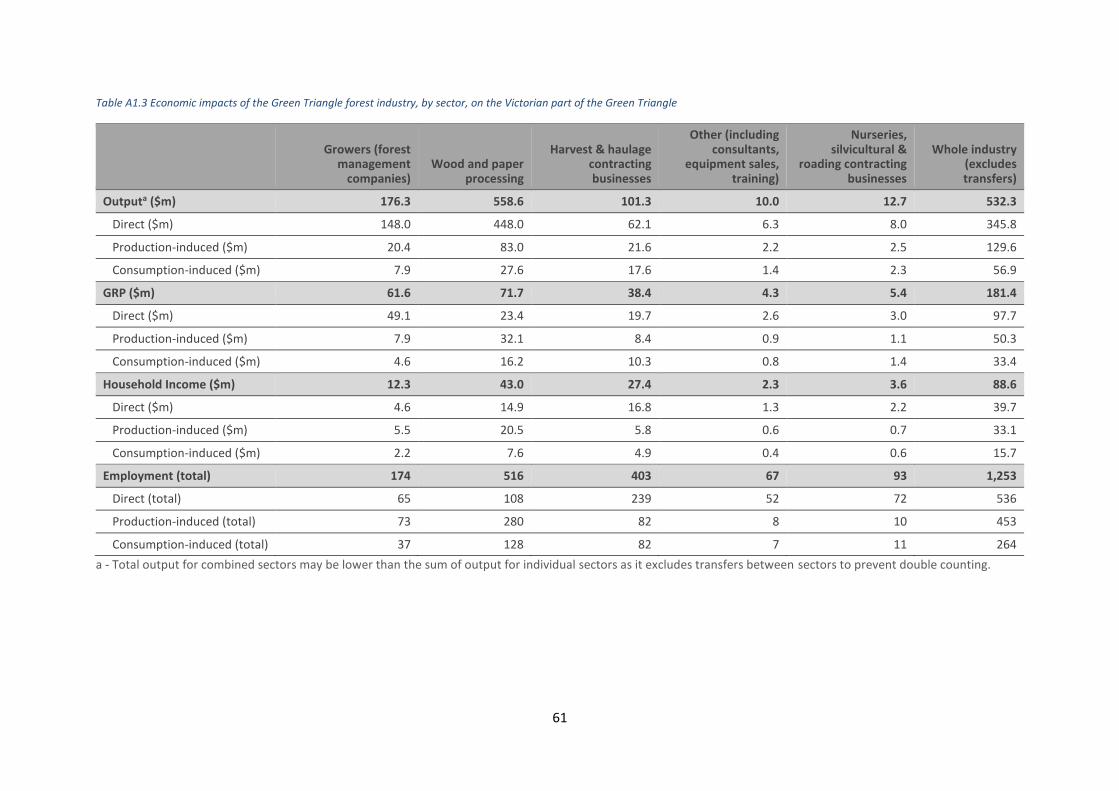
61
Table A1.3 Economic impacts of the Green Triangle forest industry, by sector, on the Victorian part of the Green Triangle
Growers (forest management
companies) Wood and paper
processing
Harvest & haulage contracting businesses
Other (including consultants,
equipment sales, training)
Nurseries, silvicultural &
roading contracting businesses
Whole industry (excludes transfers)
Outputa ($m) 176.3 558.6 101.3 10.0 12.7 532.3
Direct ($m) 148.0 448.0 62.1 6.3 8.0 345.8
Production-induced ($m) 20.4 83.0 21.6 2.2 2.5 129.6
Consumption-induced ($m) 7.9 27.6 17.6 1.4 2.3 56.9
GRP ($m) 61.6 71.7 38.4 4.3 5.4 181.4
Direct ($m) 49.1 23.4 19.7 2.6 3.0 97.7
Production-induced ($m) 7.9 32.1 8.4 0.9 1.1 50.3
Consumption-induced ($m) 4.6 16.2 10.3 0.8 1.4 33.4
Household Income ($m) 12.3 43.0 27.4 2.3 3.6 88.6
Direct ($m) 4.6 14.9 16.8 1.3 2.2 39.7
Production-induced ($m) 5.5 20.5 5.8 0.6 0.7 33.1
Consumption-induced ($m) 2.2 7.6 4.9 0.4 0.6 15.7
Employment (total) 174 516 403 67 93 1,253
Direct (total) 65 108 239 52 72 536
Production-induced (total) 73 280 82 8 10 453
Consumption-induced (total) 37 128 82 7 11 264
a - Total output for combined sectors may be lower than the sum of output for individual sectors as it excludes transfers between sectors to prevent double counting.
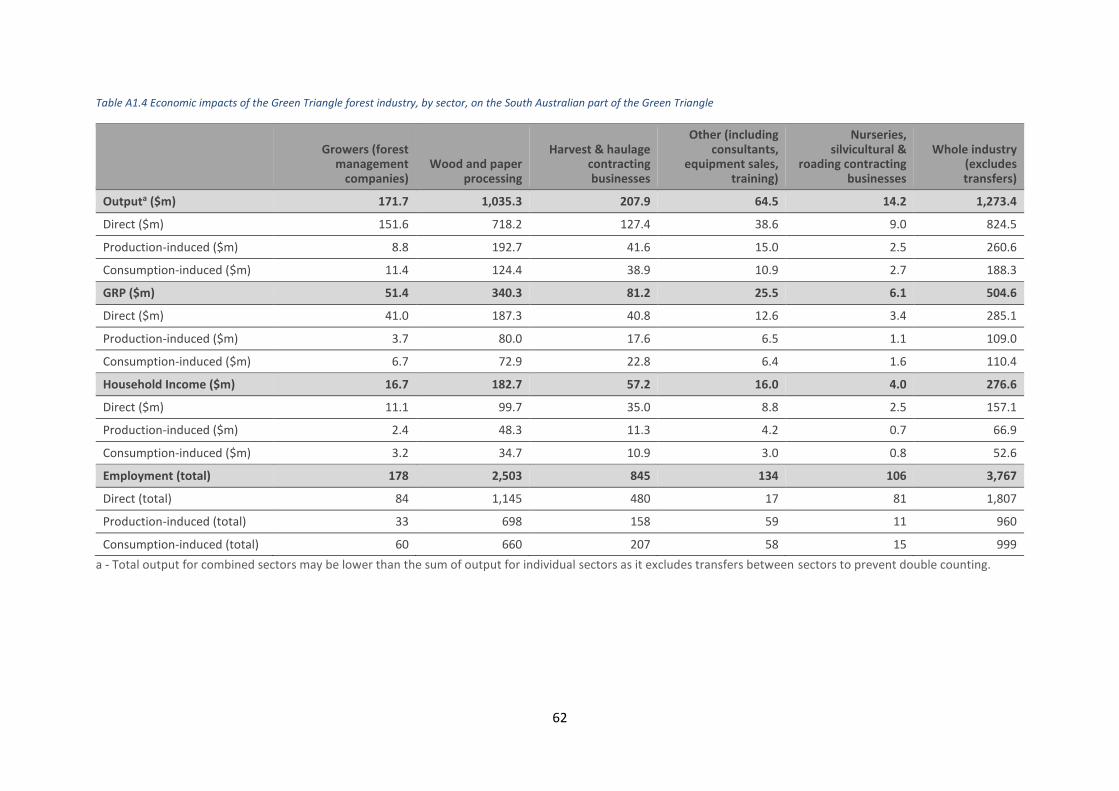
62
Table A1.4 Economic impacts of the Green Triangle forest industry, by sector, on the South Australian part of the Green Triangle
Growers (forest management
companies) Wood and paper
processing
Harvest & haulage contracting businesses
Other (including consultants,
equipment sales, training)
Nurseries, silvicultural &
roading contracting businesses
Whole industry (excludes transfers)
Outputa ($m) 171.7 1,035.3 207.9 64.5 14.2 1,273.4
Direct ($m) 151.6 718.2 127.4 38.6 9.0 824.5
Production-induced ($m) 8.8 192.7 41.6 15.0 2.5 260.6
Consumption-induced ($m) 11.4 124.4 38.9 10.9 2.7 188.3
GRP ($m) 51.4 340.3 81.2 25.5 6.1 504.6
Direct ($m) 41.0 187.3 40.8 12.6 3.4 285.1
Production-induced ($m) 3.7 80.0 17.6 6.5 1.1 109.0
Consumption-induced ($m) 6.7 72.9 22.8 6.4 1.6 110.4
Household Income ($m) 16.7 182.7 57.2 16.0 4.0 276.6
Direct ($m) 11.1 99.7 35.0 8.8 2.5 157.1
Production-induced ($m) 2.4 48.3 11.3 4.2 0.7 66.9
Consumption-induced ($m) 3.2 34.7 10.9 3.0 0.8 52.6
Employment (total) 178 2,503 845 134 106 3,767
Direct (total) 84 1,145 480 17 81 1,807
Production-induced (total) 33 698 158 59 11 960
Consumption-induced (total) 60 660 207 58 15 999
a - Total output for combined sectors may be lower than the sum of output for individual sectors as it excludes transfers between sectors to prevent double counting.

63
Table A1.5 Economic impacts of the Green Triangle hardwood plantation industry on the Green Triangle region
Growers (forest management
companies) Wood and paper
processing
Harvest & haulage contracting businesses
Other (including consultants,
equipment sales, training)
Nurseries, silvicultural &
roading contracting businesses
Whole industry (excludes transfers)
Outputa ($m) 197.8 379.1 211.9 4.9 12.4 550.7
Direct ($m) 160.3 297.5 121.4 3.0 7.2 334.0
Production-induced ($m) 27.3 63.6 51.6 1.1 2.9 146.5
Consumption-induced ($m) 10.2 18.0 38.8 0.8 2.4 70.2
GRP ($m) 71.0 45.6 82.1 2.2 5.4 206.2
Direct ($m) 54.2 9.3 38.7 1.3 2.7 106.2
Production-induced ($m) 10.9 25.8 20.8 0.5 1.3 59.3
Consumption-induced ($m) 5.9 10.4 22.5 0.5 1.4 40.7
Household Income ($m) 14.9 26.3 56.7 1.1 3.5 102.5
Direct ($m) 4.8 5.3 32.4 0.6 2.0 45.1
Production-induced ($m) 7.3 16.0 13.6 0.3 0.8 38.0
Consumption-induced ($m) 2.8 5.0 10.7 0.2 0.7 19.3
Employment (total) 216 346 832 39 88 1,519
Direct (total) 72 41 461 31 65 670
Production-induced (total) 95 219 186 4 11 515
Consumption-induced (total) 49 86 184 4 11 334
n.p. - not published in order to preserve respondent confidentiality.
a - Total output for combined sectors may be lower than the sum of output for individual sectors as it excludes transfers between sectors to prevent double counting.
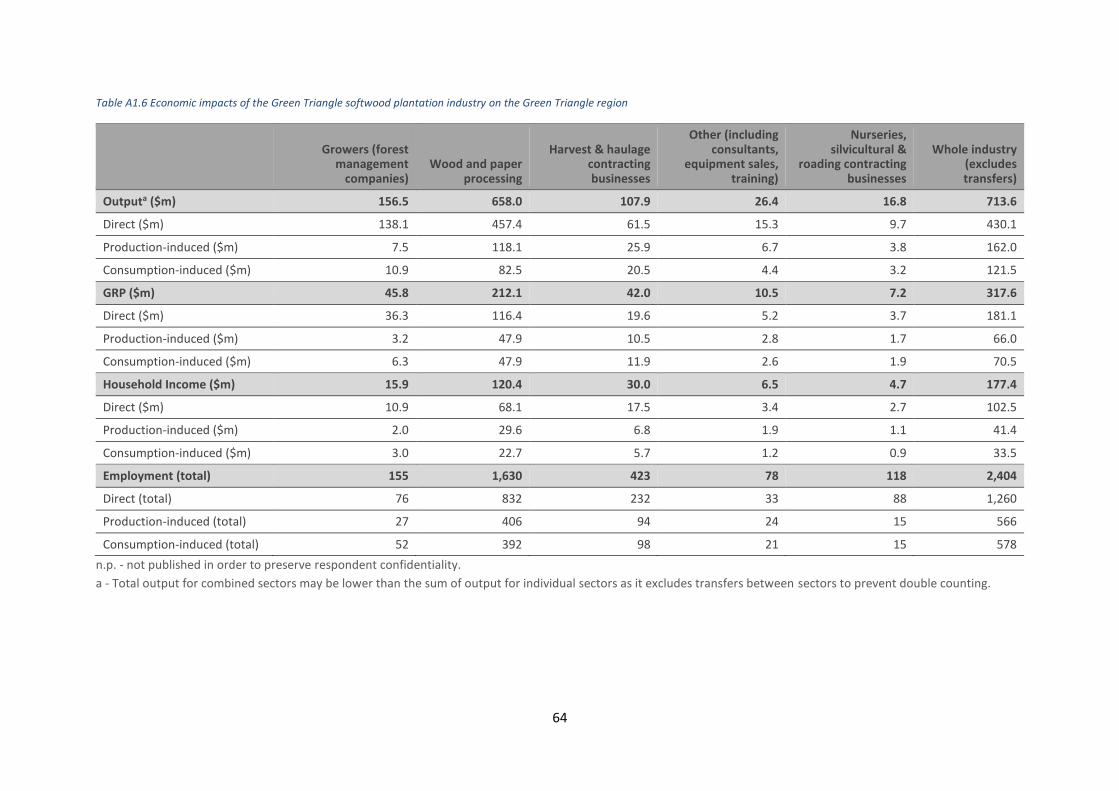
64
Table A1.6 Economic impacts of the Green Triangle softwood plantation industry on the Green Triangle region
Growers (forest management
companies) Wood and paper
processing
Harvest & haulage contracting businesses
Other (including consultants,
equipment sales, training)
Nurseries, silvicultural &
roading contracting businesses
Whole industry (excludes transfers)
Outputa ($m) 156.5 658.0 107.9 26.4 16.8 713.6
Direct ($m) 138.1 457.4 61.5 15.3 9.7 430.1
Production-induced ($m) 7.5 118.1 25.9 6.7 3.8 162.0
Consumption-induced ($m) 10.9 82.5 20.5 4.4 3.2 121.5
GRP ($m) 45.8 212.1 42.0 10.5 7.2 317.6
Direct ($m) 36.3 116.4 19.6 5.2 3.7 181.1
Production-induced ($m) 3.2 47.9 10.5 2.8 1.7 66.0
Consumption-induced ($m) 6.3 47.9 11.9 2.6 1.9 70.5
Household Income ($m) 15.9 120.4 30.0 6.5 4.7 177.4
Direct ($m) 10.9 68.1 17.5 3.4 2.7 102.5
Production-induced ($m) 2.0 29.6 6.8 1.9 1.1 41.4
Consumption-induced ($m) 3.0 22.7 5.7 1.2 0.9 33.5
Employment (total) 155 1,630 423 78 118 2,404
Direct (total) 76 832 232 33 88 1,260
Production-induced (total) 27 406 94 24 15 566
Consumption-induced (total) 52 392 98 21 15 578
n.p. - not published in order to preserve respondent confidentiality.
a - Total output for combined sectors may be lower than the sum of output for individual sectors as it excludes transfers between sectors to prevent double counting.
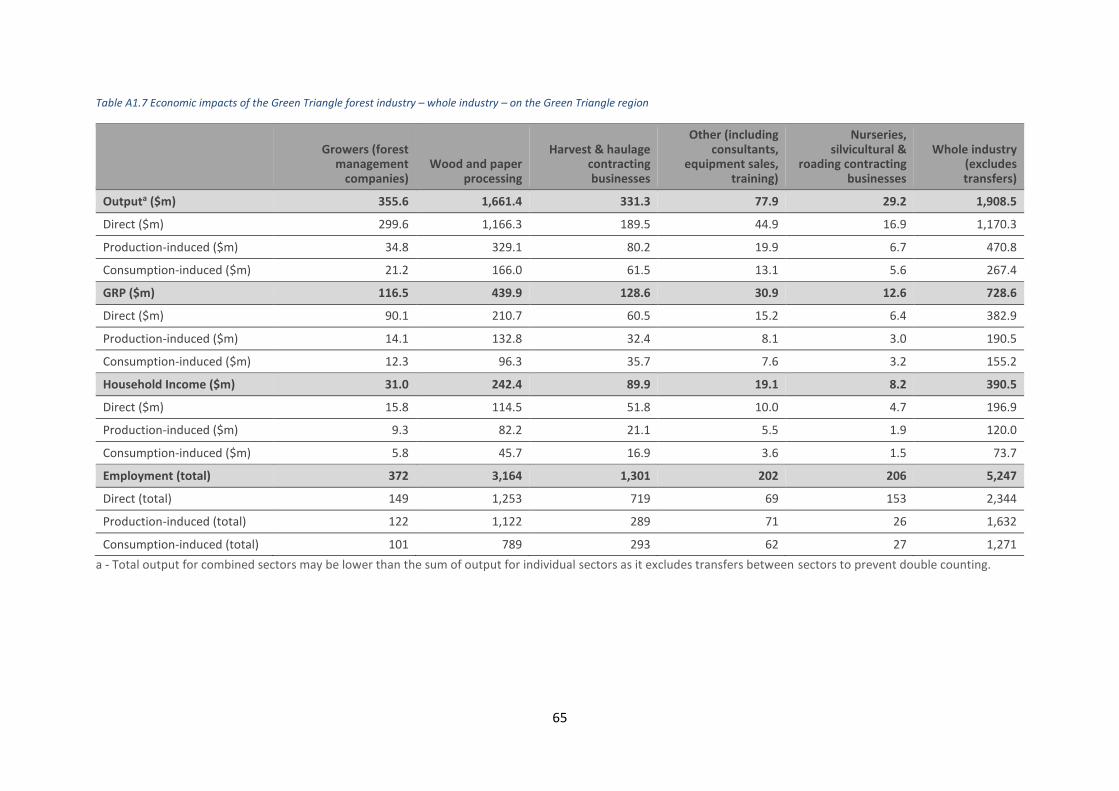
65
Table A1.7 Economic impacts of the Green Triangle forest industry – whole industry – on the Green Triangle region
Growers (forest management
companies) Wood and paper
processing
Harvest & haulage contracting businesses
Other (including consultants,
equipment sales, training)
Nurseries, silvicultural &
roading contracting businesses
Whole industry (excludes transfers)
Outputa ($m) 355.6 1,661.4 331.3 77.9 29.2 1,908.5
Direct ($m) 299.6 1,166.3 189.5 44.9 16.9 1,170.3
Production-induced ($m) 34.8 329.1 80.2 19.9 6.7 470.8
Consumption-induced ($m) 21.2 166.0 61.5 13.1 5.6 267.4
GRP ($m) 116.5 439.9 128.6 30.9 12.6 728.6
Direct ($m) 90.1 210.7 60.5 15.2 6.4 382.9
Production-induced ($m) 14.1 132.8 32.4 8.1 3.0 190.5
Consumption-induced ($m) 12.3 96.3 35.7 7.6 3.2 155.2
Household Income ($m) 31.0 242.4 89.9 19.1 8.2 390.5
Direct ($m) 15.8 114.5 51.8 10.0 4.7 196.9
Production-induced ($m) 9.3 82.2 21.1 5.5 1.9 120.0
Consumption-induced ($m) 5.8 45.7 16.9 3.6 1.5 73.7
Employment (total) 372 3,164 1,301 202 206 5,247
Direct (total) 149 1,253 719 69 153 2,344
Production-induced (total) 122 1,122 289 71 26 1,632
Consumption-induced (total) 101 789 293 62 27 1,271
a - Total output for combined sectors may be lower than the sum of output for individual sectors as it excludes transfers between sectors to prevent double counting.
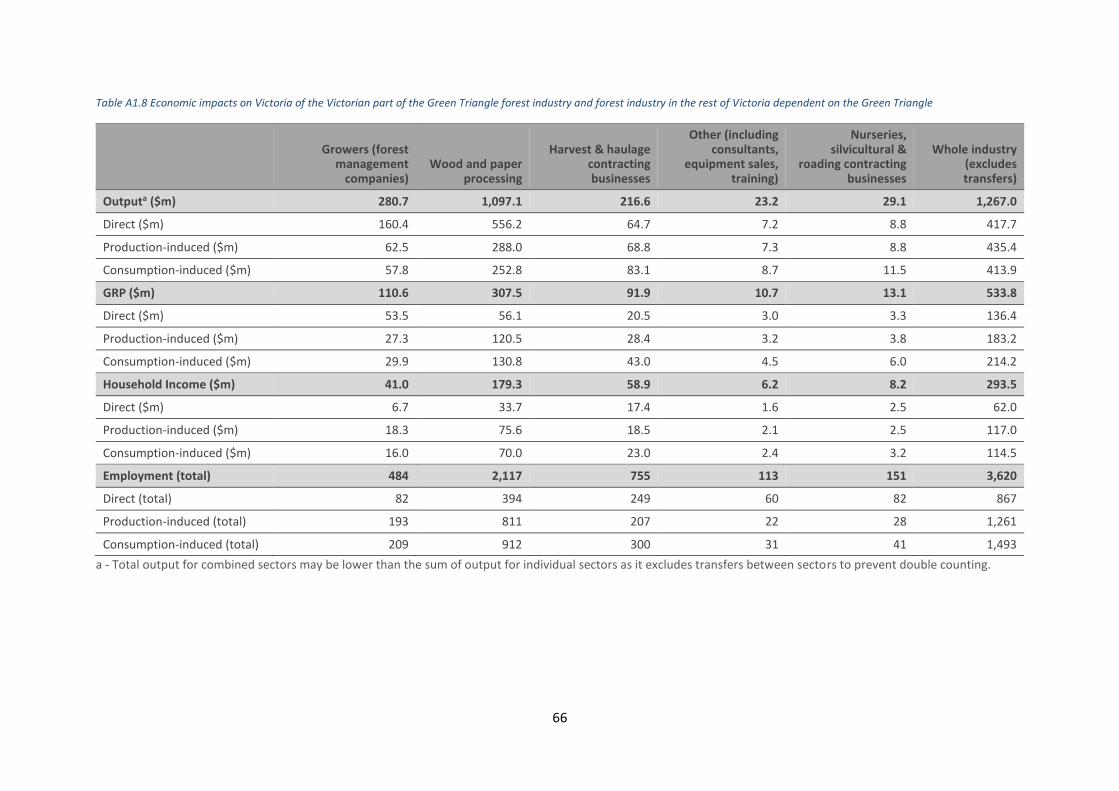
66
Table A1.8 Economic impacts on Victoria of the Victorian part of the Green Triangle forest industry and forest industry in the rest of Victoria dependent on the Green Triangle
Growers (forest management
companies) Wood and paper
processing
Harvest & haulage contracting businesses
Other (including consultants,
equipment sales, training)
Nurseries, silvicultural &
roading contracting businesses
Whole industry (excludes transfers)
Outputa ($m) 280.7 1,097.1 216.6 23.2 29.1 1,267.0
Direct ($m) 160.4 556.2 64.7 7.2 8.8 417.7
Production-induced ($m) 62.5 288.0 68.8 7.3 8.8 435.4
Consumption-induced ($m) 57.8 252.8 83.1 8.7 11.5 413.9
GRP ($m) 110.6 307.5 91.9 10.7 13.1 533.8
Direct ($m) 53.5 56.1 20.5 3.0 3.3 136.4
Production-induced ($m) 27.3 120.5 28.4 3.2 3.8 183.2
Consumption-induced ($m) 29.9 130.8 43.0 4.5 6.0 214.2
Household Income ($m) 41.0 179.3 58.9 6.2 8.2 293.5
Direct ($m) 6.7 33.7 17.4 1.6 2.5 62.0
Production-induced ($m) 18.3 75.6 18.5 2.1 2.5 117.0
Consumption-induced ($m) 16.0 70.0 23.0 2.4 3.2 114.5
Employment (total) 484 2,117 755 113 151 3,620
Direct (total) 82 394 249 60 82 867
Production-induced (total) 193 811 207 22 28 1,261
Consumption-induced (total) 209 912 300 31 41 1,493
a - Total output for combined sectors may be lower than the sum of output for individual sectors as it excludes transfers between sectors to prevent double counting.

67
Table A1.9 Economic impacts on South Australia of the South Australian part of the Green Triangle forest industry
Growers (forest management
companies) Wood and paper
processing
Harvest & haulage contracting businesses
Other (including consultants,
equipment sales, training)
Nurseries, silvicultural &
roading contracting businesses
Whole industry (excludes transfers)
Outputa ($m) 196.8 1,551.0 322.9 97.9 22.3 1,970.6
Direct ($m) 151.6 718.2 127.4 38.6 9.0 824.5
Production-induced ($m) 20.1 488.2 99.9 32.0 6.6 646.8
Consumption-induced ($m) 25.0 344.6 95.6 27.2 6.7 499.2
GRP ($m) 64.6 604.0 140.1 43.1 10.3 862.1
Direct ($m) 41.0 187.3 40.8 12.6 3.4 285.1
Production-induced ($m) 9.4 221.7 45.2 15.1 3.1 294.6
Consumption-induced ($m) 14.2 195.0 54.1 15.4 3.8 282.4
Household Income ($m) 24.5 337.3 93.6 26.6 6.6 488.6
Direct ($m) 11.1 99.7 35.0 8.8 2.5 157.1
Production-induced ($m) 6.2 139.0 31.2 10.1 2.1 188.6
Consumption-induced ($m) 7.2 98.6 27.4 7.8 1.9 142.8
Employment (total) 261 4,331 1,258 250 135 6,236
Direct (total) 84 1,145 480 17 81 1,807
Production-induced (total) 77 1,809 396 124 28 2,434
Consumption-induced (total) 100 1,377 382 109 27 1,995
a - Total output for combined sectors may be lower than the sum of output for individual sectors as it excludes transfers between sectors to prevent double counting.
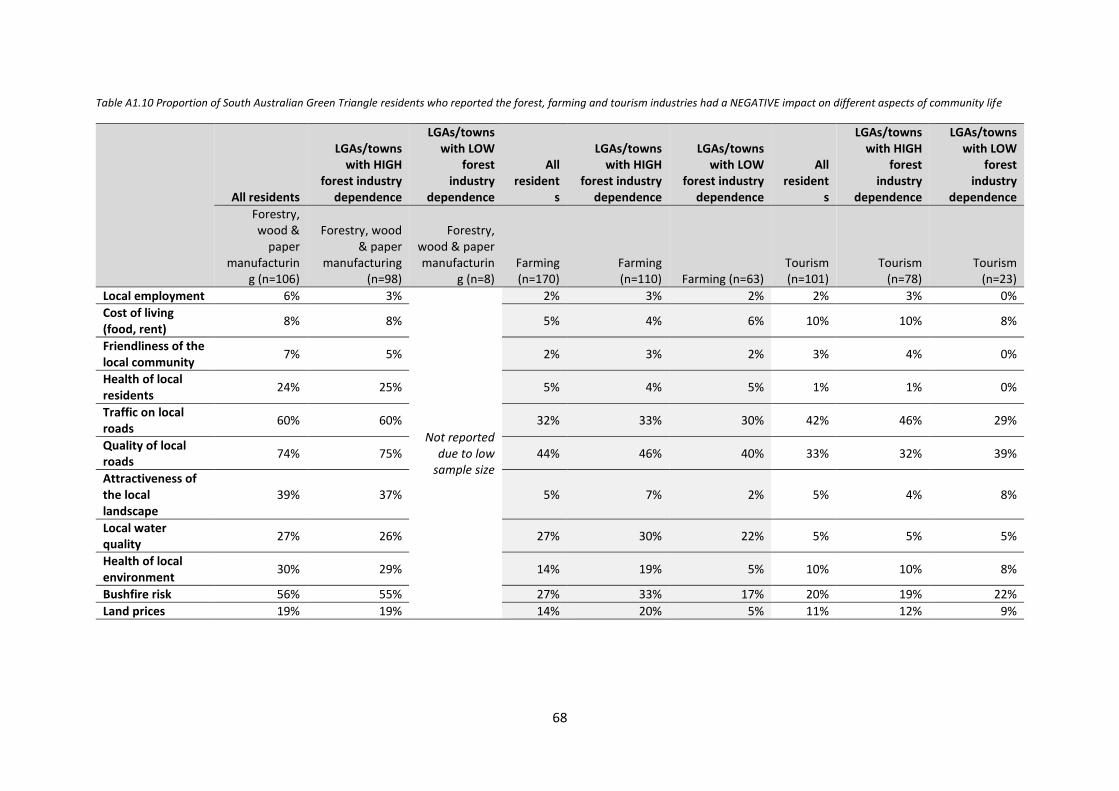
68
Table A1.10 Proportion of South Australian Green Triangle residents who reported the forest, farming and tourism industries had a NEGATIVE impact on different aspects of community life
All residents
LGAs/towns with HIGH
forest industry dependence
LGAs/towns with LOW
forest industry
dependence
All resident
s
LGAs/towns with HIGH
forest industry dependence
LGAs/towns with LOW
forest industry dependence
All resident
s
LGAs/towns with HIGH
forest industry
dependence
LGAs/towns with LOW
forest industry
dependence
Forestry, wood &
paper manufacturin
g (n=106)
Forestry, wood & paper
manufacturing (n=98)
Forestry, wood & paper manufacturin
g (n=8) Farming (n=170)
Farming (n=110) Farming (n=63)
Tourism (n=101)
Tourism (n=78)
Tourism (n=23)
Local employment 6% 3%
Not reported due to low
sample size
2% 3% 2% 2% 3% 0%
Cost of living (food, rent)
8% 8% 5% 4% 6% 10% 10% 8%
Friendliness of the local community
7% 5% 2% 3% 2% 3% 4% 0%
Health of local residents
24% 25% 5% 4% 5% 1% 1% 0%
Traffic on local roads
60% 60% 32% 33% 30% 42% 46% 29%
Quality of local roads
74% 75% 44% 46% 40% 33% 32% 39%
Attractiveness of the local landscape
39% 37% 5% 7% 2% 5% 4% 8%
Local water quality
27% 26% 27% 30% 22% 5% 5% 5%
Health of local environment
30% 29% 14% 19% 5% 10% 10% 8%
Bushfire risk 56% 55% 27% 33% 17% 20% 19% 22%
Land prices 19% 19% 14% 20% 5% 11% 12% 9%
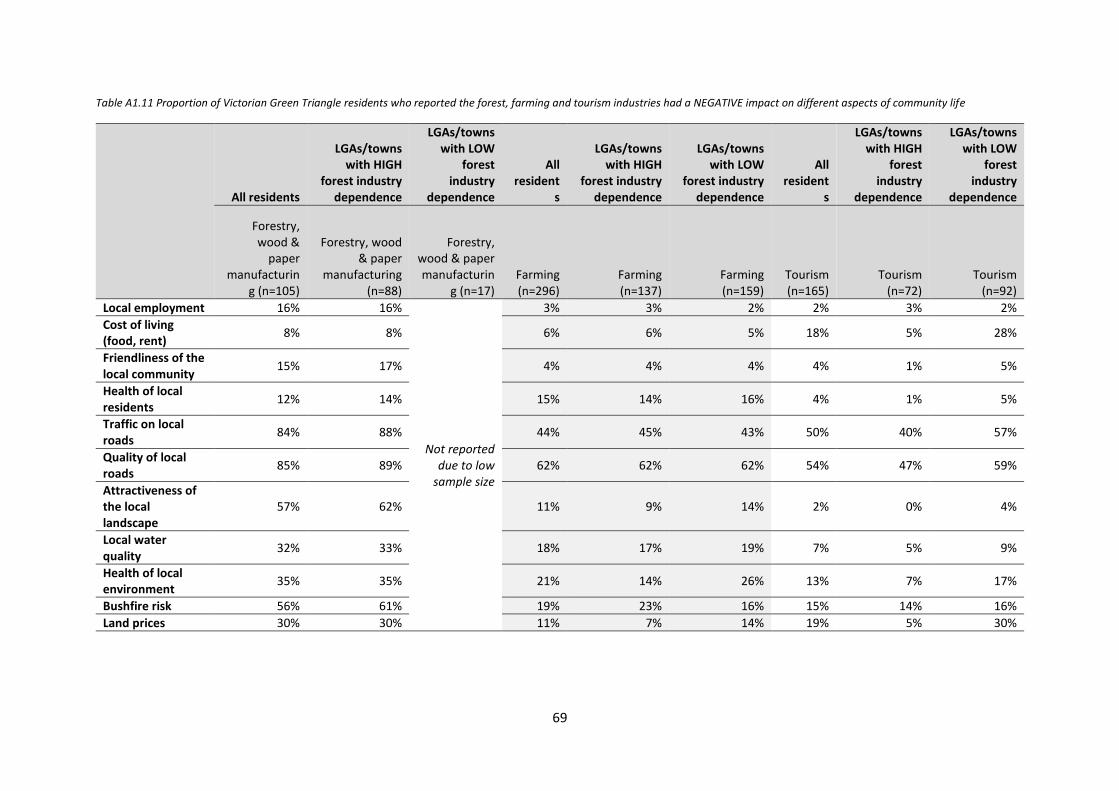
69
Table A1.11 Proportion of Victorian Green Triangle residents who reported the forest, farming and tourism industries had a NEGATIVE impact on different aspects of community life
All residents
LGAs/towns with HIGH
forest industry dependence
LGAs/towns with LOW
forest industry
dependence
All resident
s
LGAs/towns with HIGH
forest industry dependence
LGAs/towns with LOW
forest industry dependence
All resident
s
LGAs/towns with HIGH
forest industry
dependence
LGAs/towns with LOW
forest industry
dependence
Forestry, wood &
paper manufacturin
g (n=105)
Forestry, wood & paper
manufacturing (n=88)
Forestry, wood & paper manufacturin
g (n=17) Farming (n=296)
Farming (n=137)
Farming (n=159)
Tourism (n=165)
Tourism (n=72)
Tourism (n=92)
Local employment 16% 16%
Not reported due to low
sample size
3% 3% 2% 2% 3% 2%
Cost of living (food, rent)
8% 8% 6% 6% 5% 18% 5% 28%
Friendliness of the local community
15% 17% 4% 4% 4% 4% 1% 5%
Health of local residents
12% 14% 15% 14% 16% 4% 1% 5%
Traffic on local roads
84% 88% 44% 45% 43% 50% 40% 57%
Quality of local roads
85% 89% 62% 62% 62% 54% 47% 59%
Attractiveness of the local landscape
57% 62% 11% 9% 14% 2% 0% 4%
Local water quality
32% 33% 18% 17% 19% 7% 5% 9%
Health of local environment
35% 35% 21% 14% 26% 13% 7% 17%
Bushfire risk 56% 61% 19% 23% 16% 15% 14% 16%
Land prices 30% 30% 11% 7% 14% 19% 5% 30%
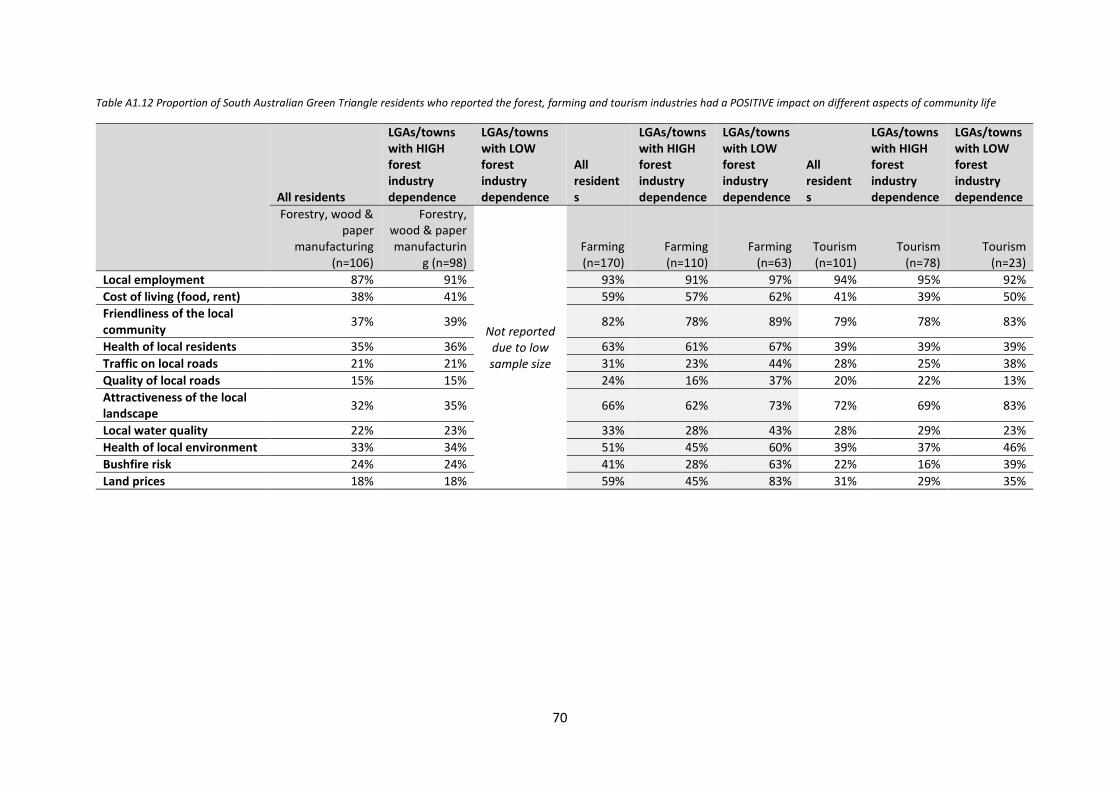
70
Table A1.12 Proportion of South Australian Green Triangle residents who reported the forest, farming and tourism industries had a POSITIVE impact on different aspects of community life
All residents
LGAs/towns with HIGH forest industry dependence
LGAs/towns with LOW forest industry dependence
All residents
LGAs/towns with HIGH forest industry dependence
LGAs/towns with LOW forest industry dependence
All residents
LGAs/towns with HIGH forest industry dependence
LGAs/towns with LOW forest industry dependence
Forestry, wood & paper
manufacturing (n=106)
Forestry, wood & paper manufacturin
g (n=98)
Not reported due to low sample size
Farming (n=170)
Farming (n=110)
Farming (n=63)
Tourism (n=101)
Tourism (n=78)
Tourism (n=23)
Local employment 87% 91% 93% 91% 97% 94% 95% 92%
Cost of living (food, rent) 38% 41% 59% 57% 62% 41% 39% 50%
Friendliness of the local community
37% 39% 82% 78% 89% 79% 78% 83%
Health of local residents 35% 36% 63% 61% 67% 39% 39% 39%
Traffic on local roads 21% 21% 31% 23% 44% 28% 25% 38%
Quality of local roads 15% 15% 24% 16% 37% 20% 22% 13%
Attractiveness of the local landscape
32% 35% 66% 62% 73% 72% 69% 83%
Local water quality 22% 23% 33% 28% 43% 28% 29% 23%
Health of local environment 33% 34% 51% 45% 60% 39% 37% 46%
Bushfire risk 24% 24% 41% 28% 63% 22% 16% 39%
Land prices 18% 18% 59% 45% 83% 31% 29% 35%
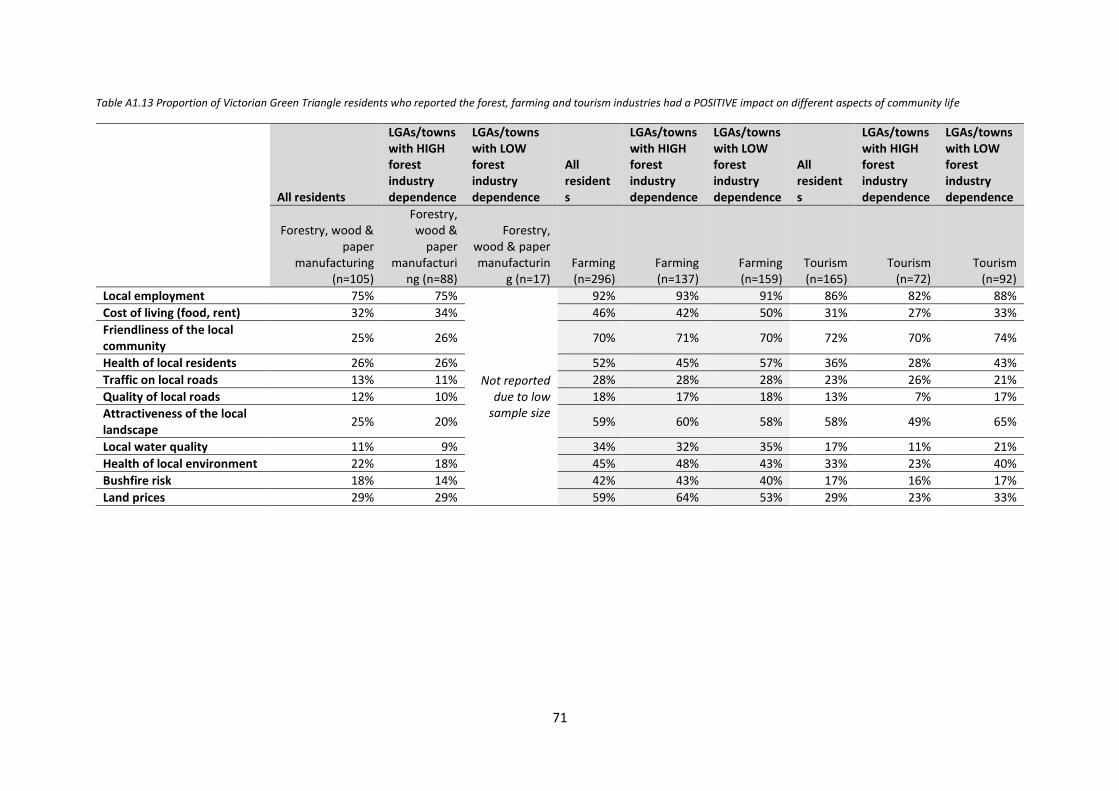
71
Table A1.13 Proportion of Victorian Green Triangle residents who reported the forest, farming and tourism industries had a POSITIVE impact on different aspects of community life
All residents
LGAs/towns with HIGH forest industry dependence
LGAs/towns with LOW forest industry dependence
All residents
LGAs/towns with HIGH forest industry dependence
LGAs/towns with LOW forest industry dependence
All residents
LGAs/towns with HIGH forest industry dependence
LGAs/towns with LOW forest industry dependence
Forestry, wood & paper
manufacturing (n=105)
Forestry, wood &
paper manufacturi
ng (n=88)
Forestry, wood & paper manufacturin
g (n=17) Farming (n=296)
Farming (n=137)
Farming (n=159)
Tourism (n=165)
Tourism (n=72)
Tourism (n=92)
Local employment 75% 75%
Not reported due to low
sample size
92% 93% 91% 86% 82% 88%
Cost of living (food, rent) 32% 34% 46% 42% 50% 31% 27% 33%
Friendliness of the local community
25% 26% 70% 71% 70% 72% 70% 74%
Health of local residents 26% 26% 52% 45% 57% 36% 28% 43%
Traffic on local roads 13% 11% 28% 28% 28% 23% 26% 21%
Quality of local roads 12% 10% 18% 17% 18% 13% 7% 17%
Attractiveness of the local landscape
25% 20% 59% 60% 58% 58% 49% 65%
Local water quality 11% 9% 34% 32% 35% 17% 11% 21%
Health of local environment 22% 18% 45% 48% 43% 33% 23% 40%
Bushfire risk 18% 14% 42% 43% 40% 17% 16% 17%
Land prices 29% 29% 59% 64% 53% 29% 23% 33%
72
Appendix 2 Using ABS Census data to identify employment in
secondary processing Data from the ABS Census were used to estimate the number of jobs generated in ‘secondary
processing’, defined as processing in which already processed wood and paper products are further
processed. As described in the main body of this report, primary processing was defined as the jobs
generated at processing plants which take in roundwood products and transform roundwood into
initial wood and paper products. In some cases, sites that take in roundwood further process initial
wood and fibre products into secondary processed products. For simplicity, all the employment at
these sites was counted as ‘primary processing’.
Our definition of primary processing employment is therefore that it is the employment generated
at sites that process wood and fibre products from roundwood. Secondary processing occurs at sites
that take in already processed wood and fibre products and further process these.
When using ABS Census data, a two-step process was used to identify employment in primary
processing versus secondary processing. First, jobs were classified into ‘primary’ and ‘secondary’
processing based on the industry categories defined in ANZ-SNZ (2016), as follows:
• Primary processing: The following four digit ANZSIC categories were considered to be
predominantly composed of primary processing activities:
o Log Sawmilling and Timber Dressing, not further defined
o Log Sawmilling
o Wood Chipping
o Timber Resawing and Dressing
o Other Wood Product Manufacturing, not further defined
o Reconstituted Wood Product Manufacturing
o Veneer and Plywood Manufacturing
o Pulp, Paper and Converted Paper Product Manufacturing, not further defined
o Pulp, Paper and Paperboard Manufacturing.
• Secondary processing: The following four digit ANZSIC categories were considered to be
predominantly composed of secondary processing activities:
o Wood Product Manufacturing, not further defined.
o Prefabricated Wooden Building Manufacturing
o Wood Structural Fitting and Component Manufacturing
o Other Wood Product Manufacturing not elsewhere classified
o Converted Paper Product Manufacturing, not further defined
o Corrugated Paperboard and Paperboard Container Manufacturing
o Paper Bag Manufacturing
o Paper Stationery Manufacturing
o Sanitary Paper Product Manufacturing
o Other Converted Paper Product Manufacturing.
However, there are cases in which either (i) Census data are mis-classified, with workers at a given
facility classified into an incorrect industry category, or in which (ii) while correctly classified

73
according to the industry definitions used by the ABS, a wood or paper processing facility classified
as primary processing does not utilise roundwood as an input and is in fact a secondary processor.
Therefore, the second step in analysis was to compare known data from our industry survey to ABS
data, and identify areas in which data did not match. Where there was a mismatch, the businesses
involved were then identified and contacted to confirm whether or not they were a primary
processor or secondary processor. The only adjustment made as part of this process was a
classification of some paper product manufacturing workers as ‘primary processing’ workers, due to
a historical reliance on pulp produced in the Green Triangle that only changed in recent years.
ABS Census data used in this report have been randomised. This means that numbers have been
randomly adjusted by small amounts when produced by the ABS TableBuilderPro product. Because
of this randomisation, the ABS Census data we present will vary by small amounts (usually less than
20-30 workers in any given region) from other analyses.