socio-economic driving forces of arable land conversion: a...
TRANSCRIPT

ARTICLE IN PRESS
0959-3780/$ - se
doi:10.1016/j.gl
�Correspond
Education, Eas
USA. Tel.: +1
E-mail addr
URL: http:/
Global Environmental Change 15 (2005) 238–252
www.elsevier.com/locate/gloenvcha
Socio-economic driving forces of arable land conversion:A case study of Wuxian City, China
Yichun Xiea,b,�, Yu Meib, Tian Guangjinc, Xing Xuerongb
aInstitute for Geospatial Research & Education, Eastern Michigan University, Ypsilanti, Michigan 48197, USAbCenter for Ecological Research, Institute of Botany, Chinese Academy of Sciences, Beijing, China
cInstitute of Geographical Sciences and Natural Resources Research, Chinese Academy of Sciences, Beijing, China
Received 9 June 2004; received in revised form 18 September 2004; accepted 25 March 2005
Abstract
This research examines the impact of the farmland protection policy institutionalized for China’s paddy field conversion in the
mid-1990s. This paper demonstrates an integrated research method for studying land use-cover changes from the perspective of the
interactions between policy changes and socioeconomic factors. The integrated method deploys remote sensing to obtain accurate
measures of paddy field changes and applies multiple regression analysis to explore the interactions between paddy field change and
socioeconomic factors. It constructs a policy-determined categorical regression analysis to investigate whether the policy change
impacts paddy field conversion and how the policy interacts with other socioeconomic factors in affecting paddy field losses. A
geographic information system is deployed to interpret the spatial patterns of the interactions. The case study in Wuxian City
(Jiangsu Province) concludes that there is a distinct policy shift between 1990–1995 and 1995–2000. The policy of regulating
farmland losses practiced in the mid-1990s has a significant role of slowing down paddy field conversion. But the success has been
partial and was largely compromised in the rural areas due to the compounding forces of policies to promote rapid economic growth
and better living standards. Moreover, continued rural to urban migration, rural economic development and rapid urban expansion
represent the primary forces that lead to the conversion of paddy fields into non-agricultural uses.
r 2005 Elsevier Ltd. All rights reserved.
Keywords: Paddy field conversion; Farmland protection; Integrated environmental change studies; Categorical regression method in policy studies;
Land use-cover change
1. Introduction
Land is an important and finite resource for mosthuman activities such as settlement, agriculture, for-estry, animal husbandry, industry, transportation andrecreation. It has been tightly coupled with economicgrowth (Richards, 1990). One of the six possible forcesdriving land-use and land-cover changes is populationincrease and its level of affluence, technology, political
e front matter r 2005 Elsevier Ltd. All rights reserved.
oenvcha.2005.03.002
ing author. Institute for Geospatial Research &
tern Michigan University, Ypsilanti, Michigan 48197,
734 487 7588; fax: +1 734 487 5394.
ess: [email protected] (Y. Xie).
/igre.emich.edu.
economy, political structure, and attitudes and values(Turner and Meyer, 1991; Stern et al., 1992). Populationincrease arises a sequence of immediate life sustainingneeds such as residence space, food and fiber (Engelmanand LeRoy, 1995; Doos, 2002; Uusivuori et al., 2002).However, due to the finite amount of available land, fasteconomic development and population growth lead todeforestation and loss of arable land and biodiversity(Turner, 1989; Hobbs et al., 1991; Fearnside, 2001;Gardner, 2001), and reduction of environmental services(Lambin et al., 2001; Peterson et al., 2001).
Recent institutional changes, marketization, andglobalization have combined to bring about rapideconomic growth in contemporary China (Zhou andMa, 2000; Logan, 2002; Ma, 2002; Pannell, 2002). The

ARTICLE IN PRESSY. Xie et al. / Global Environmental Change 15 (2005) 238–252 239
latest Chinese national population census conducted in2000—the fifth of this kind ever conducted since 1949—revealed an accelerated process of urbanization char-acterized, not only by its sheer scale, but also by therapidity of changes that has no parallel anywhere else inthe world. The census disclosed that China housed theworld’s largest population of 1.265 billion people, ofwhich 455.94 million, or 36%, lived in cities and towns(China State Council, 2001). China has more peopleliving in cities and towns than any other country in theworld. The census also identified clearly a pattern ofaccelerated urbanization for the nation in recentdecades. The share of urban population rose from20% in 1982 to 36% in 2000, a net gain of 16% in lessthan two decades. This stood in sharp contrast with thepre-reform era when the share of urban populationshowed a marginal increase from 10.6% to 17.9% overthe thirty years from 1949–78 (Ma and Cui, 1987; Chan,1994; Zhang and Zhao, 1998). The existing 455.94million of urban population has yet to claim itsdominance in the nation. Chinese authorities anticipatedthat the nation would have half of its population livingin cities and towns by 2015. This would involve anincrease of at least another 250 million urban people inthe next decade and a half. Given China’s enormouspopulation size and its growing interaction with theworld economy, there are good reasons to believe thatthe processes of accelerated urbanization unfoldingthere will have far-reaching economic, social, andenvironmental implications, not only for the largestdeveloping nation, but also for the globalizing world.
One of immediate consequences of rapid urbanizationand population growth is the loss of agriculture land.Exactly how much land China uses for agriculture isunclear. Before the Census of Agriculture, whichreported farm household data before 1996, officialstatistics showed the amount of cultivated land in Chinawas below 100 million hectares and falling, from 95.67million hectares in 1990 to 94.97 million hectares in1995. The 1997 Census of Agriculture, however,revealed that cultivated area was 130.04 million hectaresin 1996 (Lohmar, 2001). China lost 2.53 million hectaresof arable land in 2003, according to statistics providedby the Ministry of Land and Resources (Xinhua, 2004).China’s arable land has been reduced to about 123million hectares in 2003 since 1996, or 12.8% of its totalland area. Though there are no systematic data aboutChina’s arable land, reports on continued and rapid lossof arable land to urban expansion and economicdevelopment have been consistent in recent years (Li,1997; Lohmar, 2001; Xinhua, 2004). China’s agricultur-al economy faces a scarcity of land.
More alarmingly, above 90% of the population and80% of the arable land are concentrated in the easternpart of China (Gale, 2002). Fertile and productivearable land is in particular located in the eastern plains
and river basins (Dutt and Xie, 1992). Paddy fields, dueto rich water and climate resources and fertile soils, arethe main form of arable land in these regions. Forinstance, the south costal and south central regions (theYangtze River Basin and the Pearl River Basin) produce87% of the rice in China (Gale, 2002). The highconcentration of population and hot economic devel-opment compete or threaten the fertile paddy fields inthese regions. This is a critical issue for Chinesegovernments and the international community tohave a better understanding of paddy field changingdynamics.
Moreover, the Yangtze River and the Pearl Riverbasins have a long history of development (Xie andCosta, 1991). The original physical and ecologicalenvironments have been totally altered and replacedwith intensive human-transformed agricultural systems,along with highly concentrated population and socio-economic activities. There are many comparable in-stances across the world, e.g., the Nile River Basin inEgypt, and the Hindi River Basin in India. Therefore itis an imperative task to study these human-transformedenvironments, which are integral part of the globalenvironmental change research.
The goal of this paper is to study the interrelationsbetween economic growth and paddy field reduction andhow the adoption of farmland protection policy affectsthe conversion rates of paddy field in China. The paperalso develops an integrated method derived fromstatistics and informatics to examine the impact ofpolicy change on paddy field conversion. An overview ofenvironmental change research methods is presented inSection 2.1. The integrated method for policy analysis ofpaddy field conversion is developed in Section 2.2 with afocus on how the regression analysis is applied in policystudies. The policy analysis, case study (in Wuxian City,Jiangsu Province), and socioeconomic data preproces-sing are explained in Section 2.3. The detection of paddyfield conversion from remote sensed data is described inSection 2.4. Section 3 presents the findings of the casestudy and the analyses of the policy impact andsocioeconomic influence on paddy fields conversion.Section 4 concludes the paper with discussions of thestrengths, limitations and future improvements of theintegrated method for studying the policy dimension ofenvironmental changes.
2. The integrated policy analysis from statistics and
informatics
2.1. Overview of environmental change research
methodology
Many useful techniques have been developed andapplied to quantify land use and cover changes (LUCC)
ARTICLE IN PRESSY. Xie et al. / Global Environmental Change 15 (2005) 238–252240
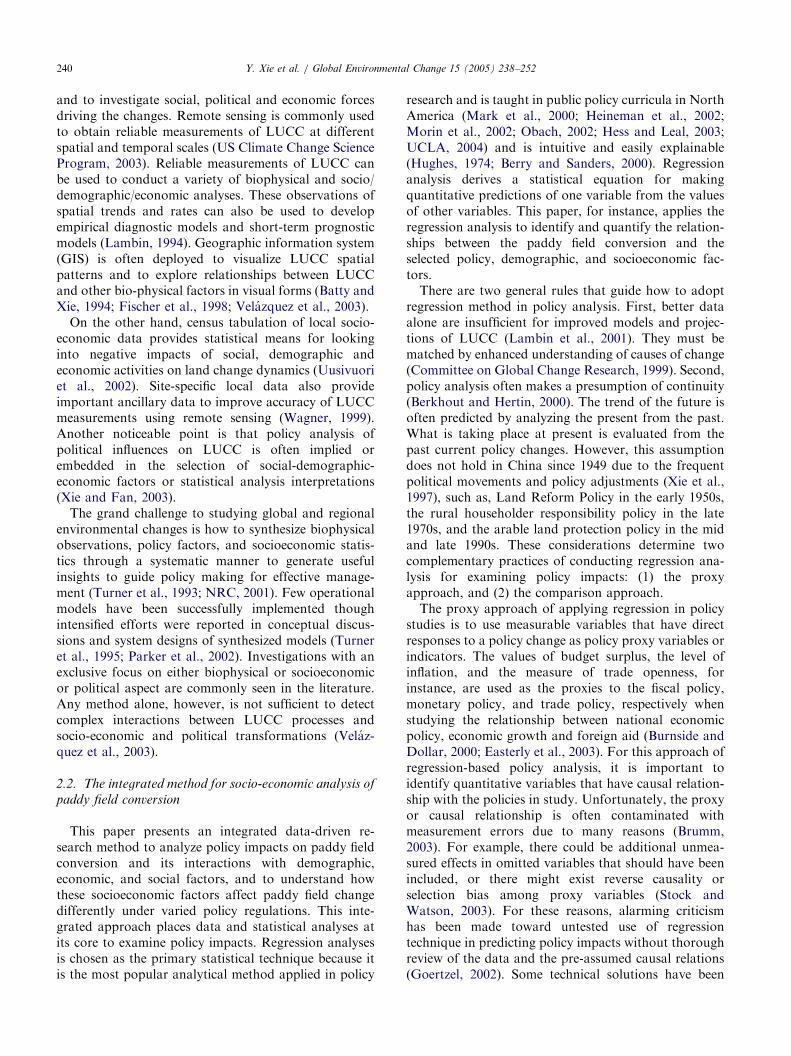
and to investigate social, political and economic forcesdriving the changes. Remote sensing is commonly usedto obtain reliable measurements of LUCC at differentspatial and temporal scales (US Climate Change ScienceProgram, 2003). Reliable measurements of LUCC canbe used to conduct a variety of biophysical and socio/demographic/economic analyses. These observations ofspatial trends and rates can also be used to developempirical diagnostic models and short-term prognosticmodels (Lambin, 1994). Geographic information system(GIS) is often deployed to visualize LUCC spatialpatterns and to explore relationships between LUCCand other bio-physical factors in visual forms (Batty andXie, 1994; Fischer et al., 1998; Velazquez et al., 2003).
On the other hand, census tabulation of local socio-economic data provides statistical means for lookinginto negative impacts of social, demographic andeconomic activities on land change dynamics (Uusivuoriet al., 2002). Site-specific local data also provideimportant ancillary data to improve accuracy of LUCCmeasurements using remote sensing (Wagner, 1999).Another noticeable point is that policy analysis ofpolitical influences on LUCC is often implied orembedded in the selection of social-demographic-economic factors or statistical analysis interpretations(Xie and Fan, 2003).
The grand challenge to studying global and regionalenvironmental changes is how to synthesize biophysicalobservations, policy factors, and socioeconomic statis-tics through a systematic manner to generate usefulinsights to guide policy making for effective manage-ment (Turner et al., 1993; NRC, 2001). Few operationalmodels have been successfully implemented thoughintensified efforts were reported in conceptual discus-sions and system designs of synthesized models (Turneret al., 1995; Parker et al., 2002). Investigations with anexclusive focus on either biophysical or socioeconomicor political aspect are commonly seen in the literature.Any method alone, however, is not sufficient to detectcomplex interactions between LUCC processes andsocio-economic and political transformations (Velaz-quez et al., 2003).
2.2. The integrated method for socio-economic analysis of
paddy field conversion
This paper presents an integrated data-driven re-search method to analyze policy impacts on paddy fieldconversion and its interactions with demographic,economic, and social factors, and to understand howthese socioeconomic factors affect paddy field changedifferently under varied policy regulations. This inte-grated approach places data and statistical analyses atits core to examine policy impacts. Regression analysesis chosen as the primary statistical technique because itis the most popular analytical method applied in policy
research and is taught in public policy curricula in NorthAmerica (Mark et al., 2000; Heineman et al., 2002;Morin et al., 2002; Obach, 2002; Hess and Leal, 2003;UCLA, 2004) and is intuitive and easily explainable(Hughes, 1974; Berry and Sanders, 2000). Regressionanalysis derives a statistical equation for makingquantitative predictions of one variable from the valuesof other variables. This paper, for instance, applies theregression analysis to identify and quantify the relation-ships between the paddy field conversion and theselected policy, demographic, and socioeconomic fac-tors.
There are two general rules that guide how to adoptregression method in policy analysis. First, better dataalone are insufficient for improved models and projec-tions of LUCC (Lambin et al., 2001). They must bematched by enhanced understanding of causes of change(Committee on Global Change Research, 1999). Second,policy analysis often makes a presumption of continuity(Berkhout and Hertin, 2000). The trend of the future isoften predicted by analyzing the present from the past.What is taking place at present is evaluated from thepast current policy changes. However, this assumptiondoes not hold in China since 1949 due to the frequentpolitical movements and policy adjustments (Xie et al.,1997), such as, Land Reform Policy in the early 1950s,the rural householder responsibility policy in the late1970s, and the arable land protection policy in the midand late 1990s. These considerations determine twocomplementary practices of conducting regression ana-lysis for examining policy impacts: (1) the proxyapproach, and (2) the comparison approach.
The proxy approach of applying regression in policystudies is to use measurable variables that have directresponses to a policy change as policy proxy variables orindicators. The values of budget surplus, the level ofinflation, and the measure of trade openness, forinstance, are used as the proxies to the fiscal policy,monetary policy, and trade policy, respectively whenstudying the relationship between national economicpolicy, economic growth and foreign aid (Burnside andDollar, 2000; Easterly et al., 2003). For this approach ofregression-based policy analysis, it is important toidentify quantitative variables that have causal relation-ship with the policies in study. Unfortunately, the proxyor causal relationship is often contaminated withmeasurement errors due to many reasons (Brumm,2003). For example, there could be additional unmea-sured effects in omitted variables that should have beenincluded, or there might exist reverse causality orselection bias among proxy variables (Stock andWatson, 2003). For these reasons, alarming criticismhas been made toward untested use of regressiontechnique in predicting policy impacts without thoroughreview of the data and the pre-assumed causal relations(Goertzel, 2002). Some technical solutions have been

ARTICLE IN PRESSY. Xie et al. / Global Environmental Change 15 (2005) 238–252 241
developed to handle the problem of regression measure-ment errors. The adoption of instrumental variables is apopular technique for identifying more exogenousvariables to count for unmeasured errors (Angrist andImbens, 1995; Stock and Watson, 2003). However, therestill exist serious limitations with these technicalmethods. Cautious analyses of the causes betweenpolicy proxy variables and adequate pre-processing ofpolicy indicators are often required for applyingregression analysis successfully (Brumm, 2003).
The comparison approach used in policy analysis is toapply regression method to data sets that are long-itudinal or observed during different time periods thatcorrespond to significant policy changes (Lijphart, 1971;Diggle et al., 1994). It is a common practice to constructa categorical policy variable to record different status ofa policy (Jaeger and Page, 1996). This categorical policyvariable is often re-coded as several dummy variables tobe included in a regression model, and each dummyvariable indicates the existence or non-existence of aspecific policy impact (Crown, 1998; Miles and Shevlin,2001). For instance, several dummy variables indicatingthe absence, loosened presence, and strict presence of astate legislation on abortion are constructed to study thepolicy impacts on abortion incidences (New, 2004).
The integrated policy analysis developed in this paperto study the paddy field conversion is depicted in Fig. 1.The analysis starts with a policy review to introduce the
Demo-socio-econ data,1990, 1995, 2000
Policy analysis: 1995marks important change
Landsat TM,1990, 1995, 2000
LUCC (major types)yearly conversion rates
Yearly change rates
GIS spatial patternanalysis: two periods
Composite LUCC anddemo-socio-econ data:1990-1995, 1995-2000
Step-wise regressionanalysis: Paddy Field
Conversion, 1990-1995
Step-wise regressionanalysis: Paddy Field
Conversion, 1995-2000
RemotesensingLUCC
detectionanalysis
Categorical regressionanalysis with POLICY
dummy variable
Fig. 1. Integrated method for studying interactions between environ-
mental changes and policy-socioeconomic factors.
background information and to identify importantpolicy changes in China concerning arable land protec-tion. Then the analysis conducts data mining to identifycausal relationship between paddy field losses andsocioeconomic factors during the periods (1990–1995and 1995–2000) with significant policy changes. Step-wise multiple regression analysis is adopted because itautomatically assigns relative importance to eachindependent variable by applying certain statisticalassumptions and criteria (Gotelli and Ellison, 2004).The findings of the multiple regression analyses markout the socioeconomic factors that have direct correla-tions with paddy field losses under different policydirections. Afterwards, a dummy variable, POLICY, isconstructed to represent the absence (during 1990–1995)and presence (during 1995–2000) of the farmlandprotection legislation and to run a regression analysiswith the variables that are identified through the datamining (regression analyses) during the two periods withdistinct policies. The paper further examines the outputof this new regression model to extract insights on thecorrelation between the paddy field conversion and thePOLICY change and its impacts on demographic andsocioeconomic factors. A better understanding of theimpacts of the farmland legislation on paddy field lossesand on economic growth is thus summarized. Further-more, it should be noted that an accurate account ofpaddy field conversion is obtained through the LUCCdetection analysis derived from remote sensing techni-que. The analysis of the associations between thePOLICY, paddy field conversion and socioeconomicfactors is made visual and intuitive with GIS mappingtechniques.
2.3. The farmland protection policy, case study, and
socioeconomic data
Following the visit of Mr. Deng Xiaoping to thesouthern parts of China in 1992, the rapid economic up-swing in China has resulted in a boom of townshipenterprise development, as manifested by a largedecrease in cultivated land (Fischer et al., 1998; Sun etal., 1999). When entering 1996, the problem, coupledwith an overheated economy, became very severe andthe Chinese government started taking various measuresto keep farmland losses under control (Li, 1997). Thecentral government eventually issued an administrativedecree in April 1997. The decree orders local govern-ments to reexamine all the areas of former arable landthat were occupied by non-agricultural uses during theperiod of 1991–1995, and also to freeze the conversionof additional arable land into non-agricultural uses forone year (CEI, 1997). Several comprehensive researchprojects were conducted to study the LUCC and relatedsocioeconomic transformations between 1991 and 1995(Li, 1997; Fischer et al., 1998). Therefore, the year of

ARTICLE IN PRESSY. Xie et al. / Global Environmental Change 15 (2005) 238–252242
1995 has been identified as an important turning point inChina’s policies concerning economic development andarable land management. This date is used in this paperto compile data into two periods of 1990–1995 and1996–2000 for investigating the impacts of land manage-ment policy changes on LUCC.
The case study was conducted in Wuxian City,Jiangsu Province, the immediate suburb of SuzhouCity. Southern Jiangsu (Sunan) provided one of themodels for the development of rural industries (thediversified collective enterprise run by a local munici-pality model) in the mid-1980s and early 1990s—othersbeing the Wenzhou model (household-level enterpriseand homeworking model) and the Liaoning model(heavy-industry linked model) (Tan, 1986; Xie andCosta, 1991). Here there is a demonstrable link betweenagricultural specialization, agricultural surpluses, andinvestments in non-farm enterprises (Kirkby, 2000;Marton, 2000).
The demographic and socioeconomic data came fromthe published statistical yearbooks (Wuxian City Statis-tical Bureau, 1991, 1996, 2001). The selection of dataitems took into consideration of the literature of Chinascholars (Xie and Costa, 1991; Ma and Xiang, 1998;Kirkby, 2000; Marton, 2000; Lin, 2001) and listed inTable 1. Data were compiled for townships and villages(29 in total). The yearly increase rates were computed
Table 1
List of the selected demographic and socioeconomic variables
Abbreviation Description
A-POP Agricultural population
NA-POP Non-Agricultural population
T-POP Total population
C-LAND Land area in cultivation
TAFHF Total output value of agriculture, fo
fishery.
GDPV Gross domestic product value
GPSI Gross product value of primary and
GTI Gross product value of tertiary indu
TFAI Total value of fixed assets investmen
TIRE Total income of rural economy
IAFHF Income in agriculture, forestry, anim
N-IAFHF Income in non-agriculture, non-fore
and non-fishery
TERE Total expense in rural economy
TIF Total income of the farmers
TVIA Total value of industrial assets
NVFA Net value of the fixed assets
NF The number of factories
EMPL The number of employed people at
TTAX Total tax value
SRPV Sold ratio of the product value
aIND: the individual count of all people.bMU: 1 mu ¼ 1/15 h ¼ 1/6 acre.cMY: Million Chinese Yuan.dCNT: the count of all factories.
from the observed values of the selected variablesbetween 1990–1995 and 1995–2000, based on theequation,
Ri ¼V2
V1
� �1=n
� 1, (1)
where Ri is the increase rate of the observed value of ademographic or socio-economic indicator; V1 the valueof an indicator i at the date t1; V 2 the value of theindicator i at the date t2; n the difference of yearsbetween the two dates (4 years between 1990–1995 and1995 and 2000 in this case study).
2.4. Detecting the paddy field conversion from remote
sensed images
The biophysical data of LUCC were obtainedthrough the change detection analysis of remote sensing.Three times Landsat Thematic Mapper (TM) images in1990, 1995 and 2000 were interpreted to obtain land-usevector datasets. Obtaining images at near anniversarydates is considered important for change detectionstudies (Pilon et al., 1988; Quarmby and Cushnie,1989). The geometric registration was done using thequadratic method. The specification for image to imageregistration is 0.3 pixel in both directions and this
Unit
INDa
IND
IND
MUb
restry, animal husbandry and MYc
MY
secondary industries MY
stries MY
t MY
MY
al husbandry and fishery MY
stry, non-animal husbandry MY
MY
MY
MY
MY
CNTd
the year end IND
MY
%

ARTICLE IN PRESSY. Xie et al. / Global Environmental Change 15 (2005) 238–252 243
precision requirement was met for all three years. Thecity land-use vector datasets were created by interpretingTM images assisted with the 1:50,000 topography maps.During the interpreting process, topography, geomor-phology, vegetation, precipitation and temperaturedatasets were used as the ancillary data. There aremany methods for detecting land cover changes avail-able in the literature. Several well-known ones amongthem are the image differencing (Quarmby and Cushnie,1989), the principal component transform (Wang, 1993),the tasseled cap transform (Fung, 1990), the Gramm-Schmidt transform (Collins and Woodcock, 1994) andthe image classification (Gordon, 1980). The post-classification image comparison method was adoptedin this study to extract the dynamic change vectordatasets of land-use. The TM images in 1995 were usedto interpret the dynamic change vector data bycomparing with the vector data derived from interpret-ing TM images in 1990, while the same method wasapplied for the period 1995–2000. Before interpretingthe images, field trips were conducted to train the imageanalysts. The quality control was executed by checkingup the identities and the boundaries of the land usepatches to decrease incidences of errors. According tothe check-up result, the classification accuracy of thechanges of land use-cover patches is 97.6% (Liu et al.,2002a, b). The wrong identities of land use patches wereall corrected.
Table 2
Yearly conversion rates of major land types during 1990–1995, 1995–2000
Abbreviation Major land type 1990 (h) 1995 (h) 90–95 C
(h)
P-DRY Plain dry land 2814.0 2297.3 �516.8
PADDY Plain paddy field 75335.8 71519.5 �3816.3
D-FRST Dense forest 8900.5 8745.5 �155.0
D-GRAS Dense grassland 537.0 531.0 �6.0
SHRUB Shrub forest 417.5 414.5 �3.0
ORC Orchard 4360.5 4355.8 �4.8
LAKE Lake 178334.0 178275.0 �59.0
H-PADDY Hilly paddy field 56.0 56.0 0.0
RIVER River 708.3 708.3 0.0
BARE Bare land 53.5 53.5 0.0
SHOAL Shoal 1598.5 1600.3 1.8
S-FRST Sparse forest 2178.8 2202.3 23.5
R-POND Reservoir and
pond
10645.0 10839.0 194.0
L-F-Ta Large factory and
transportation
392.0 439.3 47.3
R-CNST Rural
construction
8568.5 10104.5 1536.0
H-DRY Hilly dry land 79.8 146.3 66.5
U-CNST Urban
construction
2608.8 5300.5 2691.8
aL-F-T is combined with U-CNST in the regress analyses, because L-F
significant amount of L-F-T construction reported the data.
The conversion rate for each major land use-covertype was calculated according the following formula(FAO, 1996):
Rc ¼ 1 �S1 � S2
S1
� �1=n
� 1, (2)
where Rc is the rate of conversion process, S1 the area ofland use-cover category c at the date t1; S2 the area ofland use-cover category c at the date t2; and n thedifference of years between the two dates (4 years bet-ween 1990–1995 and 1995 and 2000 in this case study).
3. Findings and analyses
3.1. Analysis of paddy field and other types of land
conversion
The conversion rates of major land use-covercategories based on the Landsat image analysis arereported in Table 2. Plain dry land, plain paddy field,dense forest and dense grassland had the biggestnegative conversion rates from 1990–1995. Urbanconstruction, hilly dry land, rural construction andlarge factory and transportation construction had thebiggest positive rates during the same period. There arenoticeable variations of change among different land
hange 90–95 Conv.
rate
2000 (h) 95–00 Change
(h)
95–00 Conv.
rate
�0.0398 1772.3 �525.0 �0.0506
�0.0103 68021.0 �3498.5 �0.0100
�0.0035 8568.8 �176.8 �0.0041
�0.0022 485.5 �45.5 �0.0178
�0.0014 408.5 �6.0 �0.0029
�0.0002 4088.3 �267.5 �0.0126
�0.0001 178275.0 0.0 0.0000
0.0000 53.3 �2.8 �0.0100
0.0000 708.3 0.0 0.0000
0.0000 53.5 0.0 0.0000
0.0002 1406.5 �193.8 �0.0255
0.0021 2128.3 �74.0 �0.0068
0.0036 12128.5 1289.5 0.0227
0.0230 542.3 103.0 0.0430
0.0335 12574.5 2470.0 0.0447
0.1289 110.8 �35.5 �0.0541
0.1523 6263.3 962.8 0.0339
-T is closely related to urban development and only the towns with

ARTICLE IN PRESSY. Xie et al. / Global Environmental Change 15 (2005) 238–252244
types between 1995 and 2000. Hilly dry land, plain dryland, shoal, and dense grassland witnessed the biggestlosses between 1995–2000, while rural construction,large factory and transportation construction, urbanconstruction and reservoirs and ponds saw biggestincreases.
However, in terms of absolute volume of land arealoss, the plain paddy field lost 3816 hectares from 1990to 1995, or 84% of the total losses of arable and naturalland covers during this period, and suffered another lossof 3499 hectares from 1995 to 2000, or 73% of the totallosses of the same period. Urban construction, rural
Table 3
The conversion percentages of paddy field to other land types
Land use-cover type Year 1995 Year 2000
Dense forest 0.125 0.000
Shrub forest 0.034 0.000
Sparse forest 0.187 0.000
Orchard 0.137 0.477
Dense grassland 0.054 0.821
River 0.125 0.000
Lake 2.660 0.000
Reservoir and pond 14.018 17.530
Shoal 0.007 0.000
Urban construction 39.328 32.578
Rural construction 38.099 40.443
Large factory and transportation 3.508 6.848
Plain dry land 1.719 0.157
Table 4
Summary for regression models during 1990–1995
Model R R2 Adjusted
R2Std. error of the
estimate
1 0.734a 0.539 0.506 4.16110
2 0.883b 0.780 0.747 2.97884
3 0.980c 0.960 0.950 1.32329
4 0.988d 0.977 0.968 1.05117
aPredictors: (Constant), R-CNST.bPredictors: (Constant), R-CNST, TIRE.cPredictors: (Constant), R-CNST, TIRE, U-CNST.dPredictors: (Constant), R-CNST, TIRE, U-CNST, GDPV.
Table 5
Coefficients for the final regression model during 1990–1995a
Unstandardized coefficients
B Std. error
(Constant) �0.230 1.382
R-CNST �0.153 0.039
TIRE �0.002 0.000
U-CNST �0.029 0.004
GDPV 0.011 0.004
aDependent Variable: PADDY.
construction, reservoir and pond, and large factory andtransportation construction are the four largest bene-ficiaries of the paddy field conversions (Table 3).
3.2. Regression analysis of the interactions in the policy
period, 1990– 1995
The regression analysis revealed different influencesfrom socioeconomic and policy factors at the twodistinct periods, 1990–1995 and 1995–2000. The paddyfield conversion was mainly contributed to the changesof four factors TIRE (total income of rural economy),U-CNST (urban construction), R-CNST (rural con-struction), and GDPV (gross domestic product value)during the period of 1990–1995 (Tables 4 and 5).Together these parameters explain 96.8% of the paddyfield conversion. The regression analysis confirms thatrapid economic growth in the first half of the 1990s has adirect impact on the paddy land conversion. The largestcontributor is the increase of total income of ruraleconomy (TIRE), which is much higher during1990–1995 than its change at the period of 1995–2000(Table 10). TIRE is the income generated from non-agricultural economic activities by collective and privateenterprises registered and administrated in (Xiang andCun) rural towns and villages (EBACE, 1993). Massiveupsurge of rural industrialization is at the core ofChina’s recent economic miracle (Sun et al., 1999).Rural nonagricultural employment constituted overone-third of the employment of rural households inthe mid-1990s, and contributed above 40% of their totalincome. Remarkable rural industrialization demandsthat large amounts of farming land be converted tourban land for industrial, commercial and infrastructureconstruction. Steady increase of the rural economycontributes positively to reducing poverty, improvingthe quality of life of the rural population, andmodernizing the farming sector (Oi, 1999). Ruralresidents who have more money in their pockets arebuilding new, modernized and spacious houses. There-fore, TIRE, U-CNST and R-CNST strongly affect thepaddy field conversion (in an opposite direction). This
Standardized
coefficients
t Sig.
Beta
�0.167 0.871
�0.270 �3.935 0.002
�0.694 �12.864 0.000
�0.558 �7.617 0.000
0.164 2.831 0.016

ARTICLE IN PRESS
Fig. 2. Spatial patterns of paddy field conversion and socioeconomic factors in 1990–1995. (The upper is the thematic map of paddy field conversion
rate (PADDY) in 1990–1995 and the bottom is the thematic map of gross domestic product value (GDPV). The values of these parameters display
reversed patterns. Higher values of PADDY usually coincide with lower values of GDPV.)
Y. Xie et al. / Global Environmental Change 15 (2005) 238–252 245
explanation is easily comprehendible and consistentwith China’s policy intentions of that period.
The yearly increase of gross domestic productvalue (GDPV—a measure of the size of the economy)is at a record high of 0.37 during 1990–1995 (Table 10).However, its relationship with the paddy field conver-sion is reversed (Table 4), which conflicts with thecommon understanding that the rapid increaseof GDPV should accompany with rapid loss of arableland. The GIS thematic maps reveal unmatchedspatial patterns between the paddy field conver-sion and GDPV increase (Fig. 2). The interpretation isthat GDPV contains a large portion of agricultu-rally related output value, though its share is diminish-ing (Wuxian City Statistical Bureau, 1991, 1996).Moreover, an increasing portion of rural town andvillage industries is for export, but this activity wasnot included in GDPV and the data were not collec-ted until the late 1990s (Wei, 2002). Therefore, theGDPV indicator shows different spatial variationscomparing with other economic indicators during thisperiod.
3.3. Regression analysis of the interactions in the policy
period, 1995– 2000
The relationships between the paddy field conversionand the demographic and socioeconomic statisticsduring the period of 1995–2000 have shown a complexpicture. Concerns about an overheated economy ob-viously caught public and governmental attention inChina since 1994 (Baker, 2003). The total fixed assetinvestment (TFAI) decreased from the dramatic increaseduring 1990–1995 (0.53) to a negative increase in1995–2000 (�0.13). The economic wheel was spinningmuch slower. As Table 10 discloses, almost all majoreconomic indicators show much smaller increase rates.The increase rate of the gross product value of primaryand secondary industries (GPSI) decreased from 0.7714to 0.0181; total income of rural economy (TIRE) from0.80 to 0.06; and non-agriculture product value(N-IAFHF) from 1.31 to 0.06.
Corresponding to the socioeconomic changes, landuse-cover conversions illustrated dissimilar trends fromthe previous period. The paddy field conversion was

ARTICLE IN PRESSY. Xie et al. / Global Environmental Change 15 (2005) 238–252246
decelerated from 0.0103 to 0.01 (Table 2). Urbanconstruction conversion was much reduced from0.1523 to 0.0339. However, the conversion rates ofother land categories increased. For instance, the ruralconstruction (R-CNST) increased from 0.0335 to 0.0447and plain dry land (P-DRY) from 0.0398 to 0.0506. Theconversion rates of the dense forest, dense grassland,shrub forest, and orchards are all higher than thoseduring 1990–1995. The negative environmental impacts,as the outcomes of rapid economic growth, were visibleat this period (Wong and Zhao, 2000).
Furthermore, the paddy field conversion during1995–2000 was primarily credited to the changes of fivedemographic and socioeconomic parameters, includingagricultural population (A-POP), total output value ofagriculture, forestry, animal husbandry and fishery(TAFHF), non-agricultural population (NA-POP), totaltax value (TTV), and total value of industrial asset(TVIA) (Tables 6 and 7). Together the changes of theseparameters can explain 94.9% of the paddy fieldconversion variation. A-POP is the largest contributor.Agricultural population decreased significantly from83.0% to 74.7% of the total population, at 2.31% ayear, and, as a result, non-agricultural populationincreased by 7.98% per year (Table 10). TAFHF keptincreasing at a slightly slower pace (compared with theperiod of 1990–1995) though the agriculture populationwas decreasing. TVIA illustrated a similar impact.
Table 6
Summary for regression models during 1995–2000
Model R R2 Adjusted
R2Std. error of
the estimate
1 0.818a 0.670 0.646 2.61335
2 0.914b 0.836 0.810 1.91243
3 0.957c 0.916 0.895 1.42036
4 0.972d 0.945 0.926 1.19746
5 0.983e 0.966 0.949 0.99630
aPredictors: (Constant), A-POP.bPredictors: (Constant), A-POP, TAFHF.cPredictors: (Constant), A-POP, TAFHF, NA-POP.dPredictors: (Constant), A-POP, TAFHF, NA-POP, TTV.ePredictors: (Constant), A-POP, TAFHF, NA-POP, TTV, TVIA.
Table 7
Coefficients for the final regression model during 1995–2000a
Unstandardized coefficients
B Std. error
(Constant) 1.917 1.082
A-POP 0.490 0.030
TAFHF �0.029 0.006
NA-POP 0.012 0.003
TTV 0.013 0.004
TVIA �0.005 0.002
aDependent Variable: PADDY.
However, the spatial patterns of the changes for NA-POP and TTV are found to be different from the paddyfield conversion (Fig. 3). The variations in the spatial
Standardized
coefficients
t Sig.
Beta
1.772 0.107
1.045 16.132 0.000
�0.339 �4.967 0.001
0.298 4.649 0.001
0.267 3.679 0.004
�0.175 �2.427 0.036
Fig. 3. Spatial patterns of paddy field conversion and socioeconomic
factors in 1995–2000. (The upper is the thematic map of paddy field
conversion rate (PADDY) in 1995–2000; the middle is the thematic
map of non-agricultural population change (NA-POP); and the
bottom is the thematic map of total tax value change (TTV)). The
values of PADDY parameters display reversed patterns. The value
distributions of these parameters display obvious spatial variations.)

ARTICLE IN PRESSY. Xie et al. / Global Environmental Change 15 (2005) 238–252 247
patterns explain why the Beta values of these factors areshowing reversed directions from the paddy fieldconversion (Table 7).
It becomes obvious that the policy changes institu-tionalized in the second half of the 1990s to controlarable land loss and to curb overheated economy showvaried successes. The Chinese government was able tocontrol the investment (supporting by the fact thatTFAI displayed a negative increase) and consequentlyreduce the conversion rates of the paddy field and urbanconstruction (Sun, 2002). However, the demands ofmore lands for rural construction were not diminishing.Due to the strict regulations of protecting farming land,developers were forced to turn their attention to landsthat are less regulated in the new policy (Wong andZhao, 2000). Therefore the conversion rates of plain dryland, grassland, shrub forest, and orchards wereincreasing. If rapid economic growth is the main drivingforce for the land conversion in 1990–1995, thepopulation shifting, the demand for better livingstandards, and the negligible attention to environmentalquality are the primary causes affecting land changedynamics during 1995–2000.
3.4. Regression analysis with POLICY explanatory
variable, 1990– 2000
POLICY is a dummy variable that has a value 0for the period of 1990–1995 (indicating the absenceof the arable land protection legislation) and a value 1
Table 8
Summary for regression models with the explanatory variable, POLICY
Model R R2
1 0.551a 0.303
2 0.678b 0.460
3 0.714c 0.510
4 0.784d 0.615
aPredictors: (Constant), A-POP.bPredictors: (Constant), A-POP, U-CNST.cPredictors: (Constant), A-POP, U-CNST, TIRE.dPredictors: (Constant), A-POP, U-CNST, TIRE, POLICY.
Table 9
Coefficients for the final regression model with POLICYa
Unstandardized coefficients
B Std. error
(Constant) 1.409 1.451
A-POP 0.118 0.039
U-CNST �0.030 0.006
TIRE �0.002 0.000
POLICY �5.799 1.694
aDependent Variable: PADDY.
for 1995–2000 (signifying the presence of the arable landprotection legislation). The regression analysis, with theexplanatory variable POLICY, reveals how the policychange correlates with the paddy field loss and howother socioeconomic factors impact paddy field conver-sion when experiencing policy change. The regressionanalysis indicates several findings (Tables 8 and 9): (1)the policy change (the explanatory variable, POLICY)itself is statistically significantly correlated with thepaddy field conversion, though the influence level ismoderate compared with other contributors; (2) U-CNST (urban construction) and TIRE (total income ofrural economy) are the two strongest factors affectingrapid paddy field conversion; and (3) the agriculturalpopulation shift is another contributor to paddy fieldconversation. These statistical findings lead to someinteresting and important arguments on the causes ofthe paddy field losses in Southern Jiangsu of China.First, as China is in the take-off stage of economicgrowth, it is inevitable to experience arable land losses tonon-agricultural uses and, in particular, rapid urbanexpansion. Second, in developed regions such as Sunan,the income from rural non-agricultural enterprises(household-based small-scale township- and village-run) is the primary driving force converting arable landto other uses in rural areas. Third, the decrease ofagricultural population (either leaving agriculture to beengaged in non-agricultural activities or migrating tocities) accelerates farmland losses. Finally, the conver-sion of farmland (paddy fields in this study) is slowed
Adjusted R2 Std. error of the estimate
0.288 3.97360
0.436 3.53642
0.477 3.40605
0.579 3.05441
Standardized
coefficients
t Sig.
Beta
0.971 0.337
0.340 3.070 0.004
�0.547 �4.661 0.000
�0.622 �4.137 0.000
�0.622 �3.423 0.001

ARTICLE IN PRESS
Table 10
Annual change rates of the socioeconomic factors used in analysis
Factors 1990–1995 1995–2000 Factors 1990–1995 1995–2000
A-POP �0.0093 �0.0231 IAFHF 0.1499 0.0308
NA-POP 0.0474 0.0798 N-IAFHF 1.3107 0.0631
T-POP �0.0009 �0.0024 TERE 0.9596 0.0700
C-LAND �0.0135 �0.0319 TIF 0.3759 0.0508
TAFHF 0.1171 0.0879 TVIA 0.3791 0.2761
GDPV 0.3700 0.1097 NV-FA 0.4189 0.0331
GPSI 0.7714 0.0181 NF 0.0022 0.0442
GTI 0.5826 0.1430 EMPL �0.0199 �0.0159
TFAI 0.5318 �0.1319 TTAX 0.8000 0.1026
TIRE 0.8035 0.0607 SRPV90 1.1609 �0.0004
Y. Xie et al. / Global Environmental Change 15 (2005) 238–252248
and curtailed with the decree of arable land protectionlegislations (see Table 10).
4. Discussion
4.1. Reflections on the integrated LUCC research method
This paper presents a case study of policy changes andrelated environmental responses through investigatingthe paddy field conversion and its causal relations withthe demographic and socioeconomic factors. First, thisstudy illustrates an integrated research method toexplore how policy and socioeconomic factors interactwith each other to drive land use-cover changes. Thestudy suggests conducting a policy review to determineimportant historical events of policy change and to usethese episodes to guide policy research design. Thishuman and policy dimension drives data compilationand analysis. Second, the paper acquires accuratebiophysical data (i.e., land use-cover change vectors)from the Landsat images at different time scenesthrough remote sensing analysis. Though the detectionmethods and the quality of remote sensed data mayaffect the accuracy level, this method definitely fills agap in studying land use changes in China because theChinese statistical data on land use changes is veryquestionable (Lohmar, 2001; Ma, 2002). Third, thepaper merges the LUCC data with the demographic andsocioeconomic data at fine-scale (rural towns andvillages) and conducts statistical analyses (includingthe multiple and categorical regression analyses) todiscern how the policy change correlates with the paddyfield conversion and how socioeconomic factors interactwith each other to drive land use-cover changes undertwo periods (1990–1995, and 1995–2000) with distinctpolicy variations. Fourth, the paper adopts GISscientific visualization to interpret abnormal associa-tions between paddy field conversion and socioeconomicfactors from the perspective of spatial pattern analysis.
Physical, social, and political systems are interacting incomplex ways to drive LUCC dynamics. It is difficult tounderstand the temporal trajectory and spatial imprintof LUCC simply from quantitative (statistical) analysisand qualitative (policy) assessment. Interactive andsynthetic data exploratory analyses supported by GISscientific visualization help discern spatial interactionsbetween LUCC and its driving forces. The thematicmaps of spatial relationships of the paddy fieldconversion with the gross domestic product in1990–1995 (Fig. 2) and with the changes of non-agriculture population and total tax value during1995–2000 (Fig. 3) help to understand and clarify theextent and direction of their interactions. In thisintegrated manner, several important findings areextracted to advance our understanding of the issuesof environmental changes and the associated drivingforces.
Caution must be exercised when adopting informaticsand statistical methods to study policies. Society is acomplex system in which science and technology areintegral elements and play increasingly active roles.However, the roles of science and technology in shapingpolicies are hardly studied. In other word, policies areseldom explained plainly with science and modeling(Odum, 1997). Science and modeling are often devel-oped as crude tools to obtain a preliminary examinationof complicated social issues or policy impacts (Batty,1997). A fuller appreciation of what is going on must bematched by enhanced understanding of political andanthropologic causes (Committee on Global ChangeResearch, 1999). Moreover, there are several seriousstatistical limitations when applying regression methodsin studying policies. Specification error directly relatesto choosing appropriate explanatory variables. Avail-ability and selection of the right indicators for policystudies have been a great challenge for convincing theapplicability of regression method in policy studies(Hammond et al., 1995; World Bank, 1997; Goertzel,2002; Brumm, 2003). Statistical considerations of
ARTICLE IN PRESSY. Xie et al. / Global Environmental Change 15 (2005) 238–252 249
multicollinearity and heteroskedasticity which existamong explanatory variables make it more rigid toapply the regression method (Crown, 1998; Miles andShevlin, 2001). It is critical to conduct thoroughexamination and experimentation between large numberof explanatory variables for determining the bestsuitable regression models and to have good knowledgeof policy issues to construct a valid statistics-basedpolicy analysis (Burnside and Dollar, 2000; Brumm,2003; Easterly et al., 2003).
4.2. Comments on China’s land control policy and its
impacts on LUCC
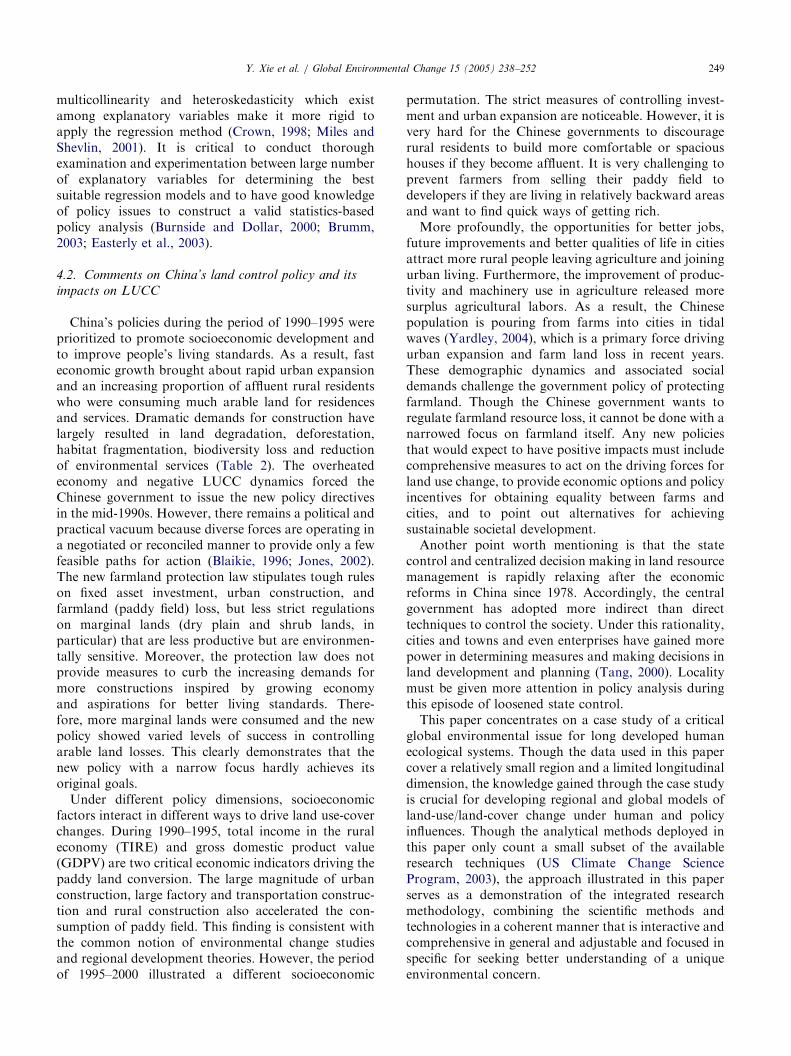
China’s policies during the period of 1990–1995 wereprioritized to promote socioeconomic development andto improve people’s living standards. As a result, fasteconomic growth brought about rapid urban expansionand an increasing proportion of affluent rural residentswho were consuming much arable land for residencesand services. Dramatic demands for construction havelargely resulted in land degradation, deforestation,habitat fragmentation, biodiversity loss and reductionof environmental services (Table 2). The overheatedeconomy and negative LUCC dynamics forced theChinese government to issue the new policy directivesin the mid-1990s. However, there remains a political andpractical vacuum because diverse forces are operating ina negotiated or reconciled manner to provide only a fewfeasible paths for action (Blaikie, 1996; Jones, 2002).The new farmland protection law stipulates tough ruleson fixed asset investment, urban construction, andfarmland (paddy field) loss, but less strict regulationson marginal lands (dry plain and shrub lands, inparticular) that are less productive but are environmen-tally sensitive. Moreover, the protection law does notprovide measures to curb the increasing demands formore constructions inspired by growing economyand aspirations for better living standards. There-fore, more marginal lands were consumed and the newpolicy showed varied levels of success in controllingarable land losses. This clearly demonstrates that thenew policy with a narrow focus hardly achieves itsoriginal goals.
Under different policy dimensions, socioeconomicfactors interact in different ways to drive land use-coverchanges. During 1990–1995, total income in the ruraleconomy (TIRE) and gross domestic product value(GDPV) are two critical economic indicators driving thepaddy land conversion. The large magnitude of urbanconstruction, large factory and transportation construc-tion and rural construction also accelerated the con-sumption of paddy field. This finding is consistent withthe common notion of environmental change studiesand regional development theories. However, the periodof 1995–2000 illustrated a different socioeconomic
permutation. The strict measures of controlling invest-ment and urban expansion are noticeable. However, it isvery hard for the Chinese governments to discouragerural residents to build more comfortable or spacioushouses if they become affluent. It is very challenging toprevent farmers from selling their paddy field todevelopers if they are living in relatively backward areasand want to find quick ways of getting rich.
More profoundly, the opportunities for better jobs,future improvements and better qualities of life in citiesattract more rural people leaving agriculture and joiningurban living. Furthermore, the improvement of produc-tivity and machinery use in agriculture released moresurplus agricultural labors. As a result, the Chinesepopulation is pouring from farms into cities in tidalwaves (Yardley, 2004), which is a primary force drivingurban expansion and farm land loss in recent years.These demographic dynamics and associated socialdemands challenge the government policy of protectingfarmland. Though the Chinese government wants toregulate farmland resource loss, it cannot be done with anarrowed focus on farmland itself. Any new policiesthat would expect to have positive impacts must includecomprehensive measures to act on the driving forces forland use change, to provide economic options and policyincentives for obtaining equality between farms andcities, and to point out alternatives for achievingsustainable societal development.
Another point worth mentioning is that the statecontrol and centralized decision making in land resourcemanagement is rapidly relaxing after the economicreforms in China since 1978. Accordingly, the centralgovernment has adopted more indirect than directtechniques to control the society. Under this rationality,cities and towns and even enterprises have gained morepower in determining measures and making decisions inland development and planning (Tang, 2000). Localitymust be given more attention in policy analysis duringthis episode of loosened state control.
This paper concentrates on a case study of a criticalglobal environmental issue for long developed humanecological systems. Though the data used in this papercover a relatively small region and a limited longitudinaldimension, the knowledge gained through the case studyis crucial for developing regional and global models ofland-use/land-cover change under human and policyinfluences. Though the analytical methods deployed inthis paper only count a small subset of the availableresearch techniques (US Climate Change ScienceProgram, 2003), the approach illustrated in this paperserves as a demonstration of the integrated researchmethodology, combining the scientific methods andtechnologies in a coherent manner that is interactive andcomprehensive in general and adjustable and focused inspecific for seeking better understanding of a uniqueenvironmental concern.

ARTICLE IN PRESSY. Xie et al. / Global Environmental Change 15 (2005) 238–252250
Acknowledgements
The authors wish to thank Center for EcologicalResearch, Institute of Botany, Chinese Academy ofSciences for the financial support through The OneHundred Scholars—Distinguished Overseas ScholarFunds, and Ms Wu Li at Eastern Michigan Universityfor data entry and preprocessing.
References
Angrist, J.D., Imbens, G.W., 1995. Two-stage least squares estimation
of average causal effects in models with variable treatment
intensity. Journal of the American Statistical Association 90,
431–442.
Baker, S., 2003. China: No reason to frighten the analysts. Asia Times
Online Dec 9, 2003 http://www.atimes.com/atimes/China/
EL09Ad01.html.
Batty, M., 1997. Cellular automata and urban form: a primer. Journal
of the American Planning Association 63, 266–274.
Batty, B., Xie, Y., 1994. Modeling inside GIS: Part I: Model structures,
exploratory spatial data analysis, and aggregation. International
Journal of Geographical Information Systems 8, 291–307.
Berkhout, F., Hertin, J., 2000. Socio-economic scenarios for climate
impact assessment. Global Environmental Change 10, 165–168.
Berry, W.D., Sanders, M.S., 2000. Understanding Multivariate
Research. Westview Press, Oxford.
Blaikie, P., 1996. Post-modernism and global environmental change
(viewpoint). Global Environmental Change 6 (2), 81–85.
Brumm, H.J., 2003. Aid, policies, and growth: Bauer was right. Cato
Journal 23, 167–174.
Burnside, C., Dollar, D., 2000. Aid, policies, and growth. American
Economic Review 90, 847–868.
CEI (China Economic Information Network) News, 1997. http://
www.cei.go.co, June 3.
Chan, K., 1994. Urbanization and rural-urban migration in China
since 1982. Modern China 20, 243–281.
China State Council—Office of Population Census, 2001. Major
Figures on 2000 Population Census of China. China Statistics
Press, Beijing.
Collins, J.B., Woodcock, C.E., 1994. Change detection using the
Gramm-Schmidt transformation applied to mapping forest mor-
tality. Remote Sensing of Environment 50, 267–269.
Committee on Global Change Research, 1999. Global Environmental
Change: Research Pathways for the Next Decade. National
Academy Press, Washington, DC.
Crown, W.H., 1998. Statistical Models for the Social and Behavioral
Sciences: Multiple Regression and Limited-Dependent Variable
Models. Praeger, Westport, Connecticut.
Diggle, P.J., Heagerty, P., Liang, K.Y., Zeger, S., 1994. Analysis of
Longitudinal Data. Oxford University Press, Oxford.
Doos, B.R., 2002. Population growth and loss of arable land. Global
Environmental Change 12 (2), 303–311.
Dutt, A., Xie, Y., 1992. Changing face of agricultural development
strategies in socialist China. In: Raza, M. (Ed.), Development and
Ecology: Essays in Honor of Professor Mohammad Shafi. Rawat
Publications, New Delhi, pp. 121–138.
Easterly, W., Levine, R., Roodman, D., 2003. New data, new doubts: a
comment on Burnside and Dollar’s ‘Aid, Policies, and Growth’.
NBER Working Paper 9846, National Bureau of Economic
Research, Cambridge, Mass.
EBACE (Editing Board of Almanac of China’s Economy), 1993.
Almanac of China’s Economy. Economic Management Press,
Beijing, China, p. 735.
Engelman, R., LeRoy, P., 1995. Conserving Land: Population and
Sustainable Food Production. Population Action International,
Washington, DC.
FAO, 1996. Forest Resources Assessment 1990. Survey of Tropi-
cal Forest Cover and Study of Change Processes. Number 130,
Rome.
Fearnside, M.P., 2001. Saving tropical forests as a global warming
countermeasure: an issue that divides the environmental move-
ment. Ecological Economics 39, 167–184.
Fischer, G., Chen, Y., Laixiang Sun, L., 1998. The balance of
cultivated land in china during 1988–1995. Interim Report IR-98-
047/August, International Institute for Applied Systems Analysis,
A-2361 Laxenburg, Austria, http://www.iiasa.ac.at.
Fung, T., 1990. An assessment of TM imagery for land cover change
detection. IEEE Transactions on Geoscience and Remote Sensing
28, 681–684.
Gale, F., 2002. China’s food and agriculture: issues for the 21st
century. Agriculture Information Bulletin No. 775. Market and
Trade Economics Division, Economic Research Service, US
Department of Agriculture, Washington, DC.
Gardner, G., 2001. Preserving global cropland. http://www.utep.edu/
its3350/readings/cropland.html.
Goertzel, T., 2002. Myths of murder and multiple regression. The
Skeptical Inquirer 26, 19–23.
Gordon, S., 1980. Utilizing Landsat imagery to monitor land use
change: a case study in Ohio. Remote Sensing of Environment 9,
189–196.
Gotelli, N.J., Ellison, A.M., 2004. A Primer of Ecological Statistics.
Sinauer Associates, Inc, Sunderland, MA.
Hammond, A., Adriaanse, A., Rodenburg, E., Bryant, D., Woodward,
R., 1995. Environmental Indicators: A Systematic Approach in
Measuring and Reporting on Environmental Policy Performance.
World Resources Institute, Washington DC.
Heineman, R.A., Bluhm, W.T., Peterson, S.A., Kearny, E.N., 2002.
The World of the Policy Analyst: Rationality, Values, &
Politics. Chatham House Publishers, Chatham.
Hess, F.M., Leal, D.L., 2003. Technocracies, bureaucracies, or
responsible polities? urban school systems and the politics of
school violence prevention. Social Science Quarterly 84, 526–542.
Hobbs, N.T., Schimel, D.S., Owensby, C.E., Ojima, D.S., 1991. Fire
and grazing in the tallgrass prairie: contingent effects on nitrogen
budgets. Ecology 72, 1374–1382.
Hughes, J.W., 1974. Urban Indicators, Metropolitan Evolution and
Public Policy. Rutgers University Center for Urban Policy
Research, New Brunswick, NJ.
Jaeger, D.A., Page, M.G., 1996. Degrees matter: new evidence on
sheepskin effects in the returns to education. Review of Economics
and Statistics 78, 733–740.
Jones, S., 2002. Social constructionism and the environment: through
the quagmire. Global Environmental Change 12 (2), 247–251.
Kirkby, R., 2000. Urban Land Reform in China. Oxford University
Press, Oxford.
Lambin, E., 1994. Modelling Deforestation Processes: A review.
(TREES Series B/11) European Commission DG XIII, Luxem-
bourg.
Lambin, E.F., Turner, B.L., Helmut, J., Geist, S.B., Agbola, S.B.,
Arild, A., Bruce, J.W., Coomes, O.T., Dirzo, R., Fischer, G.,
Folke, C., George, P.S., Homewood, K., Imbernon, J., Leemans,
R., Li, X., Moran, E.F., Mortimore, M., Ramakrishnan, P.S.,
Richards, J.F., Skanes, H., Steffen, W., Stone, G.D., Svedin, U.,
Veldkamp, T., Vogel, A., Xu, C.J., 2001. The causes of land-use
and land-cover change: moving beyond the myths. Global
Environmental Change 11, 261–269.
Li, X., 1997. Driving forces of arable land conversion in china, Interim
Report IR-97-076/Sept. International Institute for Applied Systems
Analysis, A-2361 Laxenburg, Austria, http://www.iiasa.ac.at.

ARTICLE IN PRESSY. Xie et al. / Global Environmental Change 15 (2005) 238–252 251
Lijphart, A., 1971. Comparative politics and the comparative method.
American Political Science Review 65, 682–693.
Lin, C., 2001. Evolving spatial form of urban-rural interaction in post-
reform China: a case study of the Pearl River Delta. Professional
Geographer 53, 56–70.
Liu, J., Liu, M., Zhuang, D., et al., 2002a. Study on spatial pattern of
land-use change in China during 1995–2000. Science in China (D)
46 (4), 373–384.
Liu, J., Liu, M., Deng, X., et al., 2002b. The land-use and land-cover
change database and its relative studies in China. Journal of
Geographical Sciences 12, 275–282.
Logan, J. (Ed.), 2002. The New Chinese City. Blackwell, Oxford.
Lohmar, B., 2001. Changes in labor, land, and credit markets lead
china’s farmers on the path toward modernization. In: Hsu, H.,
Gale, F. (Eds.), China Agriculture in Transition. WRS –012,
Economic Research Service, USDA, pp. 9–12.
Ma, L., 2002. Urban transformation in China, 1949–2000: a review
and research agenda. Environment and Planning A 34, 1545–1569.
Ma, L., Cui, G., 1987. Administrative changes and urban population
in China. Annals of the Association of American Geographers 77,
373–395.
Ma, L., Xiang, B., 1998. Native place, migration and the emergence of
peasant enclaves in Beijing. China Quarterly 155, 546–581.
Mark, M., Henry, G., Julnes, G., 2000. Evaluation: an Integrated
Framework for Understanding, Guiding, and Improving Policies
and Programs. Jossey-Bass.
Marton, A., 2000. China’s Spatial Economic Development: Restless
landscapes in the Lower Yangzi Delta. Routledge, New York.
Miles, J., Shevlin, M., 2001. Applying Regression & Correlation:
A Guide for Students and Researchers. Sage Publications, London.
Morin, S., Sengupta, S., Gozen, M., Richards, T.A., Shriver, M.D.,
Palacio, H., Kahn, J.G., 2002. Responding to racial and ethnic
disparities in use of HIV drugs: analysis of state policies. Public
Health Reports 117, 263–272.
New, M.J., 2004. Analyzing the Effects of State Legislation on the
Incidence of Abortion During the 1990s. Center for Data Analysis
Report #04-01, The Heritage Foundation, http://www.herita-
ge.org/Research/Family/CDA04-01.cfm.
NRC (National Research Council, Committee on Grand Challenges in
Environmental Sciences), 2001. Grand Challenges in Environmen-
tal Sciences. National Academy Press, Washington, DC.
Obach, B.K., 2002. Labor-environmental relations: an analysis of the
relationship between labor unions and environmentalists. Social
Science Quarterly 83, 82–100.
Odum, E., 1997. Ecology: A Bridge Between Science and Society.
Sinauer Associates, Sunderland, MA.
Oi, J.C., 1999. Rural China Takes Off—Institutional Foundations of
Economic Reform. University of California Press, Berkeley, CA.
Pannell, C., 2002. China’s continuing urban transition. Environment
and Planning A 34, 1571–1589.
Parker, D.C., Berger, T., Manson, S.M., 2002. Agent-Based Models of
Land-Use and Land-Cover Change: Report and Review of an
International Workshop. LUCC International Project Office,
October 4–7, 2001, Irvine, California, USA.
Peterson, T.A., Ortega, M.A., Bartley, J., Sanchez, V., Soberon, J.,
Buddemeier, R.H., Stockwell, D.R.B., 2001. Future projections for
Mexican faunas under global climate change scenarios. Nature 416,
626–629.
Pilon, P.G., Howarth, P.J., Bullock, R.A., et al., 1988. An enhanced
classification approach to change detection in semi-arid environ-
ment. Photogrammetric Engineering and Remote Sensing 54,
1709–1716.
Quarmby, N.A., Cushnie, J.L., 1989. Monitoring urban land cover
changes at the urban fringe from SPOT HRV imagery in south-
east England. International Journal of Remote Sensing 10,
953–963.
Richards, J.F., 1990. Land transformation. In: Turner II, B.L., et al.
(Eds.), The Earth as Transformed by Human Action. Cambridge
University Press, New York, pp. 163–178.
Stern, P., Young, O.R., Druckman, D. (Eds.), 1992. Global Environ-
mental Change: Understanding the Human Dimensions. National
Research Council, Commission on Behavioral and Social Sciences
and Education, Committee on the Human Dimensions of Global
Change. National Academy Press, Washington, DC.
Stock, J.H., Watson, M.W., 2003. Introduction to Econometrics.
Addison-Wesley, Reading, MA.
Sun, L., 2002. Aggregate behavior of investment in china, 1953–96: an
analysis of investment hunger and fluctuation. Journal of
Comparative Economics 30 (3), 620–622.
Sun, L., Gu, E.X., Mclntyre, R., 1999. The Evolutionary Dynamics of
China’s Small- and Medium-Sized Enterprises in the 1990s. UNU
World Institute for Development Economics Research, Washing-
ton, DC.
Tan, K., 1986. Revitalized small towns in China. Geographical Review
76 (2), 138–148.
Tang, W.S., 2000. Chinese urban planning at fifty: an assessment of the
planning theory literature. Journal of Planning Literature 14,
347–366.
Turner II, B.L., 1989. The human causes of global environmental
change. In: DeFries, R.S., Malone, T. (Eds.), Global Change and
Our Common Future: Papers From a Forum. National Academy
Press, Washington, DC, pp. 90–99.
Turner II, B.L., Meyer, W.B., 1991. Land use and land cover in global
environmental change: considerations for study. International
Social Science Journal 43, 669–679.
Turner II, B.L., Moss, R.H., Skole, D.L., 1993. Relating Land Use
and Global Land-Cover Change: A Proposal for an IGBP-HDP
Core Project—The International Geosphere-Biosphere Program,
http://www.ciesin.org/docs/002-105/002-105.html.
Turner II, B.L., et al. (Eds.), 1995. IHDP Report No. 07: Land-Use
and Land-Cover Change Science/Research Plan, IHDP (Interna-
tional Human Dimensions Programme On Global Environmental
Change), Walter-Flex-Str. 3, D-53113 Bonn, Germany, http://
www.ihdp.uni-bonn.de/html/publications/publications.html.
UCLA, 2004. UCLA Schools of Public Policy and Social Research
MPP Core Curriculum: Analytic Methodologies, http://
www.sppsr.ucla.edu/
dept.cfm?d=ps&s=academic&f=aca_curr.cfm.
US Climate Change Science Program, 2003. Strategic Plan for the US
Climate Change Science Program. 1717 Pennsylvania Avenue,
NW, Suite 250, Washington, DC. http://www.climatescience.gov/
Library/stratplan2003/final/.
Uusivuori, J., Lehto, E., Palo, M., 2002. Population, income and
ecological conditions as determinants of forest area variation in the
tropics. Global Environmental Change 12 (2), 313–323.
Velazquez, A., Duran, E., Ramırez, I., Mas, J., Bocco, G., Ramırez,
G., Palacio, J., 2003. Land use-cover change processes in highly
biodiverse areas: the case of Oaxaca, Mexico. Global Environ-
mental Change 13, 175–184.
Wagner, T., 1999. Mapping impervious surfaces from remote sensing
data: Detroit case study. Proceedings of URISA Annual Con-
ference (on CDROM).
Wang, F., 1993. A knowledge based vision system for detecting land
changes at urban fringes. IEEE Transactions on Geoscience and
Remote Sensing 31, 136–145.
Wei, Y., 2002. Beyond the Sunan model: trajectory and underlying
factors of development in Kunshan, China. Environment and
Planning A 34, 1725–1747.
Wong, K.K., Zhao, X.B., 2000. Shrinking farmland in the Pearl River
Delta region of China: Institutional factors. In: Li, S., Tang, W.
(Eds.), China’s Regions, Polity, & Economy. The Chinese
University Press, Hong Kong, pp. 351–370.

ARTICLE IN PRESSY. Xie et al. / Global Environmental Change 15 (2005) 238–252252
World Bank, 1997. Expanding the Measure of Wealth: Indicators of
Environmentally Sustainable Development. World Bank, Wa-
shington DC.
Wuxian City Statistical Bureau, 1991. Statistical Yearbook of Wuxian
City—1990. Wuxian, Jiangsu Provinice, China.
Wuxian City Statistical Bureau, 1996. Statistical Yearbook of Wuxian
City—1995. Wuxian, Jiangsu Provinice, China.
Wuxian City Statistical Bureau, 2001. Statistical Yearbook of Wuxian
City—2000. Wuxian, Jiangsu Provinice, China.
Xie, Y., Costa, F., 1991. The impact of economic reforms on the urban
economy of the People’s Republic of China. The Professional
Geographer 43, 318–335.
Xie, Y., Fan, Z., 2003. Examine urban expansion from remote sensing
and GIS: a case study in Beijing. Asian Geographer 22, 119–132.
Xie, Y., Ward, R., Wang, X., 1997. Agriculture and socialist policies in
the minority areas of China. In: Singh, A.L. (Ed.), Land Resource
Management. VIKAS Publishing House PVT LTD, New Delhi,
India, pp. 267–286.
Xinhua, 2004. China urges further protection of arable land. China
Daily News 03-23-2004, 15:10 http://www.chinadaily.com.cn/eng-
lish/doc/2004-03/23/content_317346.htm.
Yardley, J., 2004. In a tidal wave, China’s masses pour from farm to
city. The New York Times September 12, 2004.
Zhang, L., Zhao, S., 1998. Re-examining China’s ‘urban’ concept
and the level of urbanization. The China Quarterly 154,
330–381.
Zhou, Y., Ma, L., 2000. Economic restructuring and suburbanization
in China. Urban Geography 21, 205–236.