socio-economic determinants of vaccination and screening
TRANSCRIPT
Socio-economic determinants
of vaccination and screening
uptake
Paolo Giorgi Rossi
AUSL Reggio Emilia
Topics of the presentation
• Cervical cancer prevention and inequalities
• The existing inequlities in Italy and how public
health initiatives reduce them
– About screening
– About vaccine
• The problem of association between screening
and vaccination:
– a rapid review of the evidence
– An Italian example

Health inequalities in cervical
cancer prevention
• One of the aims of the NHS, and in particular of the screening programs, is to reduce inequalities in accessing health services and definitely in health
• Screening and vaccine uptake may share the same socioeconomic determinats
• Association between screening and vaccination may increase existing health inequalities

Association between vaccination
and screening: what’s the problem?
• Screening is effective in preventing cervical cancer in women regularly attending
• The vast majority of cancers still occurs in women under or never screened
• Despite all the efforts a 30/15% of the women are still not covered by screening
• Vaccine will have a relevant impact on cancer incidence only if we are able to vaccine those girls that will be under or never screened in the future.

Falcini et al. RE-R
The majority
(not the vast)
of invasive
cancers are
still due to non-
partecipation
20,6
0,3
24,5
27,8
5,7
0,3
4,1
16,7
0,0 5,0 10,0 15,0 20,0 25,0 30,0
Screen-detected at first round
Non respondent
Too young
Too old
Other
<5yy mostly interval cancers
>=5yy mostly screen detected at
subsequent rounds
Unclassified
%
6.1
16,5
0,3
27,4
6,3
13,4
5,2
3,8
27,3
0,0 5,0 10,0 15,0 20,0 25,0 30,0
Screen-detected at first round
Non respondent
Too young
Too old
Other
<5yy mostly interval cancers
>=5yy mostly screen detected at
subsequent rounds
Unclassified
%
18.6

Existing socio-economic differences in
screening coverage in Italy
Screening programs
extension Overall uptake
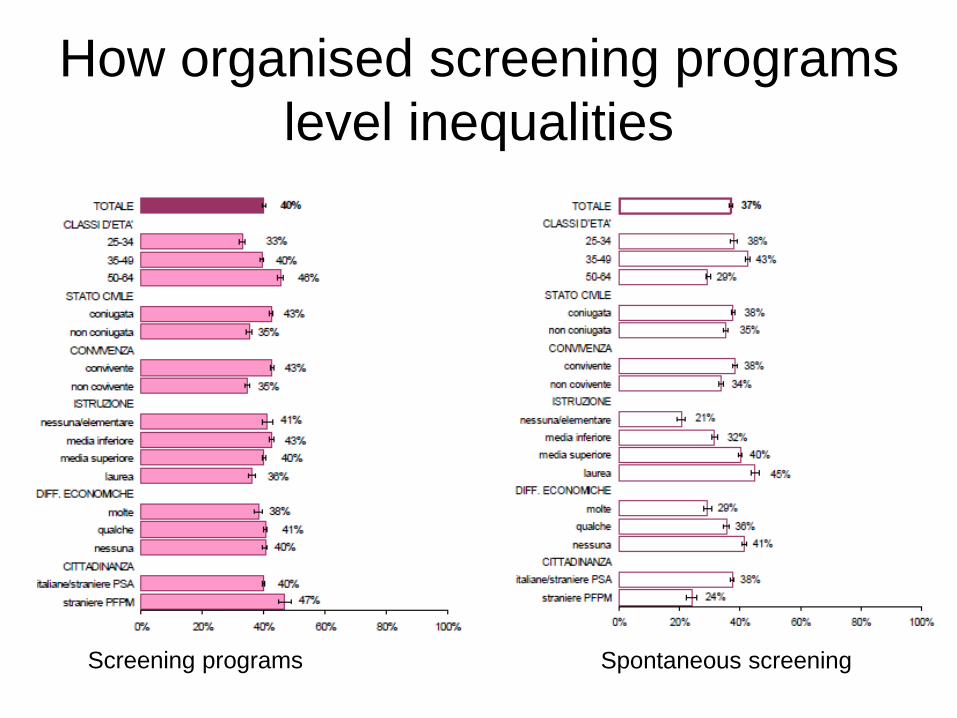
How organised screening programs
level inequalities
Screening programs Spontaneous screening

The studies on socio-economic
inequalities in vaccine in Italy
• There are many studies showing association between educational level and knowledge about HPV and cervical cancer (Capogrosso 2015; Giambi 2014; Bianco 2014; Napoli 2011)
• There are few studies (Giambi 2011) showing difference in vaccine uptake and educationale leve (in 18-26yo women).
• One study showed lower knowledge about HPV, but higher awreness of the need for screening in in vaccinated than unvaccianted girls (14-18yo) (Sopracordevole 2013)

Vaccination coverage, cohorts 1997-1998-
1999 (al 31/12/2014)
1997- 71% 1998 – 71% 1999 – 72%
CV > 70% CV < 70% http://www.epicentro.iss.it/problemi/hpv/pdf/Aggiornamento_HPV_31122014.pdf
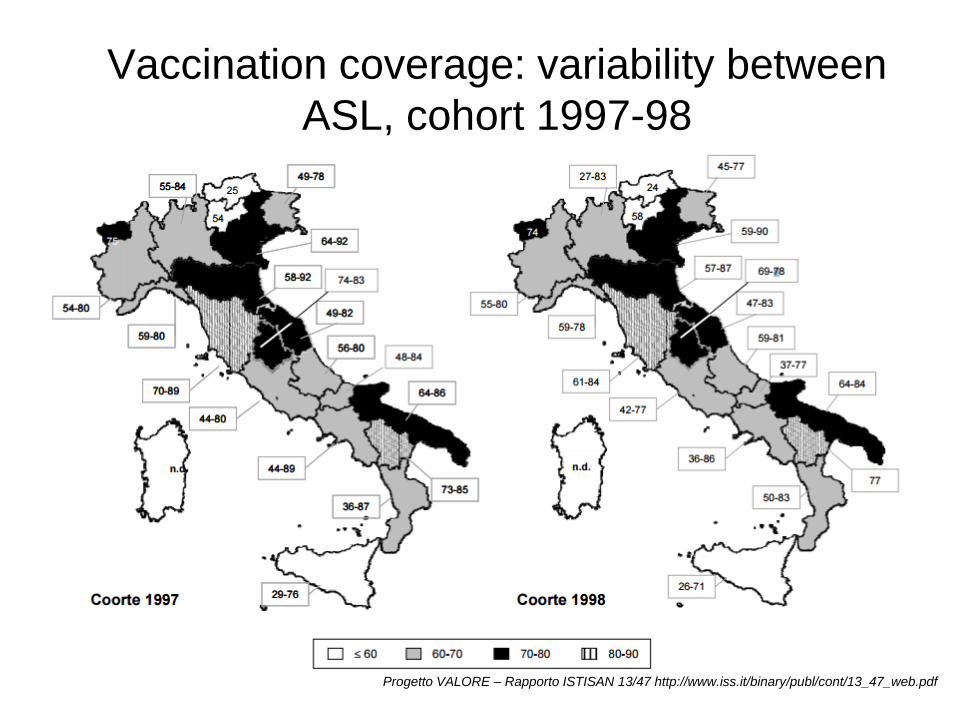
Vaccination coverage: variability between
ASL, cohort 1997-98
Progetto VALORE – Rapporto ISTISAN 13/47 http://www.iss.it/binary/publ/cont/13_47_web.pdf

In Regione Emilia-Romagna, 2008
Coorte nate nel 1996
Coorte nate nel 1997
0
10
20
30
40
50
60
70
80
1 2 3 4 5 6 7
Numero rilevazione copertura vaccinale HPV
Co
pert
ura
vaccin
ale
(%
)
1996 1997 1998 1999
Andamento temporale delle coperture in
Regione E-R contro l’HPV nelle corti 1996, 1997,
1998 e 1999.
INTRODUZIONE
offerta gratuita su
richiesta dei genitori
offerta gratuita a invito attivo

Dati
vaccinazioni
HPV
2008-2011
Anagrafe
assistiti
(2008)
METHODS
Nome Cognome
Data di nascita
Construction of the two cohorts: girls born in 1996
and 1997 in Reggio Emilia

RESULTS
Coorte di nascita
1997 1996
N % N %
Totale nate 2.307 2.260
Totale vaccinate con almeno una dose 1.896 1.087
Linkate 1.798 77,9 1.046 46,3

RISULTATI
Nazionalità
1996
Adesione alla
vaccinazione
Sì No
N % N %
Italiana 976 50,0 977 50,0
Straniera 70 22,8 237 77,2
Distretto di residenza
1996
Adesione alla
vaccinazione
Sì No
N % N %
Correggio 84 37,8 138 62,2
Montecchio 135 50,2 134 49,8
Reggio Emilia 520 52,1 479 47,9
Scandiano 98 27,8 254 72,2
Castelnuovo Monti 70 55,1 57 44,9
Guastalla 139 47,8 152 52,2
1997
Adesione alla
vaccinazione
Sì No
N % N %
1.534 77,7 441 22,3
264 79,5 68 20,5
1997
Adesione alla
vaccinazione
Sì No
N % N %
188 74,3 65 25,7
227 82,8 47 17,2
809 81,8 180 18,2
202 56,7 154 43,3
109 91,6 10 8,4
263 83,2 53 16,8
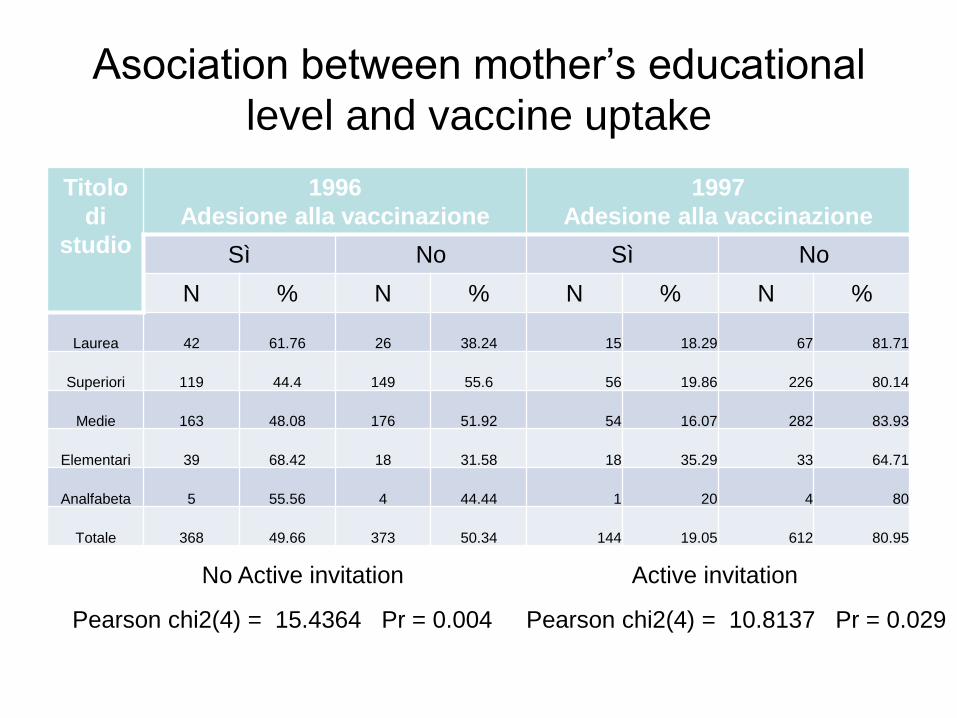
Asociation between mother’s educational
level and vaccine uptake
Titolo
di
studio
1996
Adesione alla vaccinazione
1997
Adesione alla vaccinazione
Sì No Sì No
N % N % N % N %
Laurea 42 61.76 26 38.24 15 18.29 67 81.71
Superiori 119 44.4 149 55.6 56 19.86 226 80.14
Medie 163 48.08 176 51.92 54 16.07 282 83.93
Elementari 39 68.42 18 31.58 18 35.29 33 64.71
Analfabeta 5 55.56 4 44.44 1 20 4 80
Totale 368 49.66 373 50.34 144 19.05 612 80.95
Active invitation No Active invitation
Pearson chi2(4) = 15.4364 Pr = 0.004 Pearson chi2(4) = 10.8137 Pr = 0.029

Association between mother’s
marital status and vaccination Stato
Civile
1996
Adesione alla vaccinazione
1997
Adesione alla vaccinazione
Sì No Sì No
N % N % N % N %
Coniugata o
convivente 327 50 327 50 127 19.13 537 80.87
Non
convivente 36 45 44 55 16 17.78 74 82.22
Totale 363 49.46 371 50.54 143 18.97 611 81.03
Pearson chi2(1) = 0.7129 Pr = 0.398 Pearson chi2(1) = 0.0938 Pr = 0.759

Association between maternal
age and vaccination Età al
parto
1996
Adesione alla vaccinazione
1997
Adesione alla vaccinazione
Sì No Sì No
N % N % N % N %
<20 15 71.43 6 28.57 5 19.23 21 80.77
20-34 307 49.2 317 50.8 111 18.35 494 81.65
35-40 47 48.96 49 51.04 27 22.5 93 77.5
>40 2 66.67 1 33.33 1 14.29 6 85.71
Totale 371 49.87 373 50.13 144 19 614 81
Pearson chi2(3) = 4.3871 Pr = 0.223 Pearson chi2(3) = 1.2248 Pr = 0.747
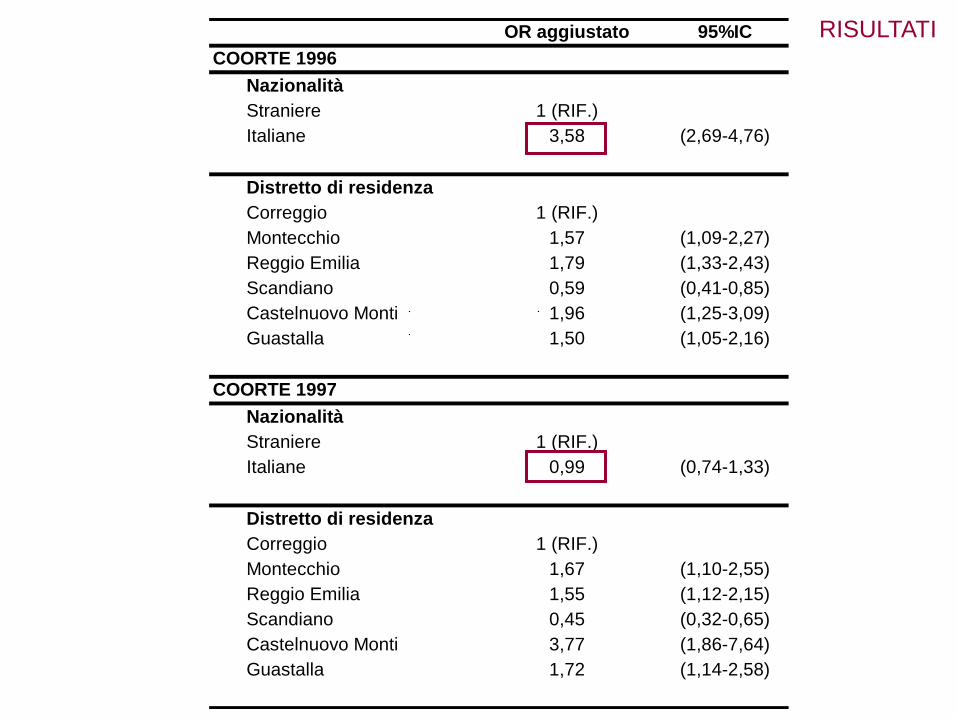
OR aggiustato 95%IC
COORTE 1996
Nazionalità
Straniere 1 (RIF.)
Italiane 3,58 (2,69-4,76)
Distretto di residenza
Correggio 1 (RIF.)
Montecchio 1,57 (1,09-2,27)
Reggio Emilia 1,79 (1,33-2,43)
Scandiano 0,59 (0,41-0,85)
Castelnuovo Monti 1,96 (1,25-3,09)
Guastalla 1,50 (1,05-2,16)
COORTE 1997
Nazionalità
Straniere 1 (RIF.)
Italiane 0,99 (0,74-1,33)
Distretto di residenza
Correggio 1 (RIF.)
Montecchio 1,67 (1,10-2,55)
Reggio Emilia 1,55 (1,12-2,15)
Scandiano 0,45 (0,32-0,65)
Castelnuovo Monti 3,77 (1,86-7,64)
Guastalla 1,72 (1,14-2,58)
RISULTATI
The problem of association
between screening and
vaccination

Daughters
25
2021/22
vaccination screening
Mothers
screening screening screening screening screening screening
Young adults
screening screening screening screening screening
<26
2007
11
2007/8
vaccination

Possible effects of vaccination
campaign on screening uptake
Mothers Daughters
Invitation to vaccine
The daughter
Now
F
utu
re
Screening
uptake
vaccination vaccination Screening
uptake
Screening
uptake
Adult
Screening
uptake
vaccination

Possible association between
vaccination and screening uptake
Mother Daughter
Invitation
to vaccine
The daughter
Now
F
utu
re
Screening
uptake
vaccination vaccination
Mother’s
Preventive
attitude
Daughter’s
Prevention
Attitude
Screening
uptake
past
Adult
Screening
uptake
adult’s
Preventive
attitude
Screening
uptake
vaccination

A rapid review on the association
between vaccination and screening
• Pubmed search: HPV & screening &
vaccine* & (uptake OR participation)
• 18 relevant studies (one systematic
review), no in Italy
• Only one study assessing population
iimpact

Adult on adult
FIRST AUTHOR; YEAR
COUNTRY study design Population Results: RR/HR of screening in Vaccinated vs. Unvacciinated
Palmer TJ 2016 Scotland cohort 201 023 RR=1.54, 95% CI 1.54-1.56.
Boone SD 2016 USA case control
1123 cases;
1123 ctls HR=2.98 95% CI:2.45-3.61
Paynter CA 2015 USA cohort 27786
OR= 1.36 (1.16, 1.61) (più forte se vaccinate vicino ai 21 anni);
adjOR=0.82 (0.67, 1.02)
Herweijer E 2015 Sweden cohort 629,703
in the first round. HR=1.31 (95% CI 1.27-1.35) HRadj=1.09, 95% CI 1.05-1.13).
In the second round HR=1.26, 95% CI 1.21-1.32; HRadj=1.15, 95% CI 1.10-1.20)
Budd AC 2014 Australia cross-sectional 2.7 million
PR= 0.79 [95% CI, 0.78-0.80]; 20-24 yo
PR= 0.77 [95% CI, 0.76-0.78]; 25-29yo
Sauer AG 2015 USA cross-sectional 7095 aPR=1.08, 95% CI: 1.04-1.11.

Mother on daughter FIRST AUTHOR;
YEAR COUNTRY
study
design Population
Results: RR/OR of daughter's vaccination by mothers'
screening partecipation
Spencer Nee
Pilkington AM
2013 England cohort about 42000
Routine vaccination never= ref; screen>5aa=1.6 (95%CI 1.2-
2.1); recent screen= 2.2 (95%CI 1.6-2.9); catch up vaccination
never= ref; screen>5aa=1.1 (95%CI 0.8-1.4); recent screen=
1.5 (95%CI 1.2-2.0)
Steens A 2013
The
Netherlands
cross-
sectional 337368 OR: 1.54 [95% confidence interval: 1.51-1.57]).
Lefevere E 2011 Belgium cohort 127,854 OR=4.5; 95% CI=3.5-5.9.
Hansen BT 2015 Norway cohort 90,842 OR = 1.16 (95%CI 1.1-1.23);
Markovitz AR
2014 USA
cross-
sectional 38,604 pairs OR = 1.07, 95% CI = 1.06-1.08
Lutringer-Magnin
D 2013 France
cross-
sectional 502 OR= 6.2, 95%CI 1.5-25.8
Chao C 2009 USA
cross-
sectional 148 350 pairs OR = 1.47; 95%[CI] = 1.43, 1.52.
Hechter RC 2013 USA cohort 254 489 boys RR = 1.13; 95% CI = 1.01, 1.26

Daughter on Mother FIRST AUTHOR;
YEAR COUNTRY
study
design Population Results: Mothers returning to screening
Spencer AM 2015 UK cohort 112,451
OR 1.04 (95% confidence intervals 1.02-1.07) for
lapsed and 1.57 (1.48-1.67) for never screened.
Daughter on daughter FIRST AUTHOR;
YEAR COUNTRY study design Population Results
Bowyer HL 2014 UK cross-sectional 1912
Those with low intentions to attend cervical
screening were less likely to be fully vaccinated than
those with high intentions.
Mather T 2012 Australia cross-sectional 193 no association
Paynter CA 2015 USA case control 27,786 1.55 (1.11, 2.16) 1.00 (0.62, 1.63)

Dati vaccinazioni
HPV
2008-2011
METHODS
Girl’s Nome
Cognome Data di
nascita
Anagrafe
assistiti
(2008)
Anagrafe
Comunale
ricostruzione
Nucleo
familiare
Dati
Screening
2001-2008
Mother’s Nome
Cognome Data di
nascita
Girl’s Nome
Cognome Data di
nascita
Construction of the two cohorts: girls born in 1996
and 1997 in Reggio Emilia

Association between previous mother’s
participation in screening and daughter’s
vaccination
Adesi
one
1996
Vaccinazione
1997
Vaccinazione
Sì No Sì No
N % N % N % N %
Mai aderenti 60 67.42 29 32.58 31 34.44 59 65.56
Almeno una
volta aderenti 184 54.93 151 45.07 70 20.53 271 79.47
Aderenti 127 44.56 158 55.44 55 18.64 240 81.36
Totale 371 52.33 338 47.67 156 21.49 570 78.51
Pearson chi2(2) = 15.9189 Pr = 0.000 Pearson chi2(2) = 10.5561 Pr = 0.005

Association between previous mother’s
participation in screening and daughter’s
vaccination
OR
aggiustato
95% IC
1996
Adesione
Mai aderenti 1 (RIF)
Almeno una volta aderenti 1.47 (0.88 - 2.47)
Aderenti 2.24 (1.33 - 3.77)
1997
Adesione
Mai aderenti 1 (RIF)
Almeno una volta aderenti 1.86 (1.10 - 3.15)
Aderenti 2.15 (1.25 - 3.67)
Aggiustato per età al parto, nazionalità e numero di inviti ricevuti dal programma

Conclusions
• Screening and vaccine uptake present some
inequalities in Italy
• Active invitation campaigns are effective in
reducing inequalities
• Vaccination does not reduce intention to
undergo screening and screening uptake
• Women’s preventive attitude influence both
screening and vaccine uptake, this association is
not reduced by active invitation.