socially responsible investing in australia · a review of socially responsible investing in...
TRANSCRIPT

A REVIEW OF SOCIALLY RESPONSIBLE INVESTING IN AUSTRALIAAn independent report for National Australia Bank (NAB) by the Australian Centre for Financial Studies (ACFS) at Monash Business School
Author: Martin Foo
May 2017

| A Review of Socially Responsible Investing in Australia
DISCLAIMER ACKNOWLEDGEMENTS
The information in this report is general in nature and does not constitute financial product or investment advice. Past performance is not necessarily indicative of future results.
This report benefitted from feedback by Professor Rodney Maddock and Leanne Gordon. The calculations and tables in section 6 were produced by Yianni Katiforis.
The data in the Australian Equities Database (AED) were compiled by John Fowler, a research fellow at ACFS, over a number of years. The development of the AED was supported at various stages by ANZ, SIRCA and Vanguard.
This report is prepared for NAB as part of its longstanding partnership with the Australian Centre for Financial Studies (ACFS). It follows on from a report titled “How will Australians Retire? Investigating Retirement Income Outcomes in a Low-return World” (2016), and the six-part Australian Debt Securities and Corporate Bonds series.
GLOSSARY
ABS Asset-Backed Security
ACFS Australian Centre for Financial Studies
ACSI Australian Council of Superannuation Investors
ACSO Australian Community Support Organisation
AED Australian Equities Database
AODP Asset Owners Disclosure Project
APRA Australian Prudential Regulation Authority
ASIC Australian Securities and Investments Commission
ASX Australian Securities Exchange
AUM Assets Under Management
CalPERS California Public Employees’ Retirement System
CDP Carbon Disclosure Project
CSR Corporate Social Responsibility
EIA Ethical Investment Association
EOCGE Employers of Choice for Gender Equality
ESG Environmental, Social and Governance
ETF Exchange-Traded Fund
Eurosif European Sustainable Investment Forum
GICS Global Industry Classification Standard
GRI Global Reporting Initiative
GSIA Global Sustainable Investment Alliance
IIRC International Integrated Reporting Council
MSX Melbourne Stock Exchange
OECD Organisation for Economic Co-operation and Development
PRI Principles for Responsible Investment (United Nations)
QTC Queensland Treasury Corporation
RIAA Responsible Investment Association Australasia
SASB Sustainability Accounting Standards Board
SIS Act Superannuation Industry (Supervision) Act 1993 (Cth)
SRI Socially Responsible Investing or Sustainable, Responsible and Impact Investing
TCFD Task Force on Climate-related Financial Disclosures
UNEP United Nations Environment Programme
US SIF Forum for Sustainable and Responsible Investment (United States)
WGEA Workplace Gender Equality Agency

| A Review of Socially Responsible Investing in Australia
EXECUTIVE SUMMARY
Socially responsible investing (SRI) means integrating non-financial factors – such as ethical, social or environmental concerns – into the investment process with the aim of earning both a financial return and a moral ‘return’. It is closely related to the broader term responsible investing, in which environmental, social and governance (ESG) factors are incorporated into mainstream investment offerings rather than just specialist mandates. The terms SRI and responsible investment are sometimes conflated or used interchangeably.
The global responsible investment industry has grown rapidly, particularly in Europe and the United States (US). SRI fund managers have been credited with persuading public companies to improve greenhouse gas reduction goals, implement sustainable forestry practices, address poor labour conditions in global supply chains, and promote gender diversity on boards.
There are many different SRI strategies. The most well-known is ‘negative screening’, which encompasses the systematic exclusion of specific companies, practices, industries or countries that are perceived to be engaging in unethical behavior. ‘Positive screening’, on the other hand, involves selecting companies or sectors based on their positive ESG performance relative to peers. Other common strategies include ‘norms-based screening’, ‘sustainability-themed investing’, ‘impact investing’, and ‘corporate advocacy and shareholder action’ (see Appendix A for further definitions). The range of retail and wholesale SRI products available to investors is significant and growing.
The responsible investment industry in Australia is becoming increasingly sophisticated. A clear majority (70%) of Australia’s largest superannuation funds have made some form of public commitment to responsible investing, and about half have in place dedicated SRI options. Several banks (including NAB) have arranged ‘green bonds’ in the Australian market. Federal and state governments are exploring the use of social impact bonds and impact investing.
The balance of empirical evidence indicates that socially responsible investing does not come at a detriment to financial returns. In other words, on average there is no statistically significant cost – and in fact there is often a benefit – to an investor from choosing an ethical investment fund over a similar conventional fund. Large-scale academic studies conclude that the business case for ESG investing is empirically well-founded.
This paper extends the empirical evidence to the Australian context by conducting a new historical equities analysis based on negative screening. Specifically, we use the Australian Equities Database (AED), a unique historical dataset of Australian stocks, to show that negative screening would have had minimal effect on the returns of a portfolio of top 20 companies over the period 1926 to 2015 (on average). Filtering out companies involved in the alcohol, tobacco, gaming or explosives industries would not have caused detriment to an index investor with a long-term horizon.
Screening out mining companies would be expected to have a much larger effect on an Australian investor’s portfolio holdings. We show that mining stocks have outperformed the broader index in some (early) decades, and underperformed in many others. The recent outperformance of some Australian ethical funds can be partially attributed to the recent weakness of the Australian mining industry.

A Review of Socially Responsible Investing in Australia |
Socially responsible investing (SRI) means integrating non-financial factors – such as ethical, social or environmental concerns – into the investment process. The term SRI is often used interchangeably with other terms like ‘ethical investing’ and ‘values-based investing’.
Ethical investing is the oldest phrase, and its use can be traced back to early biblical times when Jewish law set out the first specific rules for ethical investment. In the mid-1700s, the Methodist Church sought to do the same, and in the 1900s markets started to focus more on the religious requirements of the Islamic community. In the early 1970s, socially responsible investors took to task companies involved in war, discrimination and environmental pollution. In the 1980s, they were joined by institutional investors participating in the worldwide South Africa divestment movement. More recently, investors have focused greater attention on the issues of corporate governance and climate change.1
SRI is closely linked to the broader term responsible investing, which also aims to incorporate environmental, social and governance (ESG) factors into investment decisions. According to the United Nations, while SRI seeks to combine financial return with a moral or ethical ‘return’, responsible investing can and should be pursued even by an investor whose sole purpose is attaining a financial return. That is, ESG information should be incorporated into decision-making to ensure that all relevant factors are accounted for when assessing risk and return.2
The global responsible investment industry has grown rapidly. According to the Global Sustainable Investment Alliance (GSIA), the worldwide ‘sustainable investment’ market grew from US$13.3 trillion at the start of 2012 to US$22.9 trillion at the start of 2016, with its share rising to 26.3% of all professionally managed assets in the regions surveyed by the GSIA (Tables 1 and 2).3 (Note: the GSIA defines ‘sustainable investment’ to include both responsible investing and SRI,)
Table 1: Responsible investment assets by region, 2014 – 2016 (US$ billion).
2014 2016 Growth
Europe $10,775 $1,00 1%
United States $6,57 $8,7 %
Canada $79 $1,086 9%
Australia/NZ $18 $516 7%
Asia (ex Japan) $5 $5 16%
Japan $7 $7 6,690%
Total $18,76 $,890 5.%
Source: Global Sustainable Investment Alliance.
Note: The GSIA does not draw a distinction between responsible investment and SRI.
Table 2: Proportion of responsible investment assets to total professionally-managed assets.
2014 2016
Europe 58.8% 5.6%
United States 17.9% 1.6%
Canada 1.% 7.8%
Australia 16.6% 50.6%
Asia (ex Japan) 0.8% 0.8%
Japan .%
Global 0.% 6.%
Source: Global Sustainable Investment Alliance.
1. WHAT IS SOCIALLY RESPONSIBLE INVESTING?
1 von Wallis, M. and Klein, C. (2014), ‘Ethical Requirement and Financial Interest: A Literature Review on Socially Responsible Investing’, Business Research, Vol. 8, pp. 61-98.
See also: Lydenberg, S. (2014), ‘Ethics, Politics, Sustainability and the 21st Century Trustee’, in: Socially Responsible Investment in the 21st Century: Does it Make a Difference for Society?, Emerald Group Publishing.
2 UN Principles for Responsible Investment (n.d.) https://www.unpri.org/about/what-is-responsible-investment
3 Global Sustainable Investment Alliance (2015), ‘Global Sustainable Investment Review 2014’, February.
4 Eurosif (2014), ‘European SRI Study’.
5 Steurer, R., Margula, S. and Martinuzzi, A. (2008), ‘Socially Responsible Investment in EU Member States: Overview of Government Initiatives and SRI Experts’ Expectations towards Governments’, report for the European Commission, Vienna, April.
ESG information should be incorporated into decision-making to ensure that all relevant factors are accounted for when assessing risk and return.

5 | A Review of Socially Responsible Investing in Australia
The SRI industry is perhaps most advanced in Europe. A survey of 13 European countries by Eurosif (the European Sustainable Investment Forum) found that the SRI market there grew at double-digit rates between 2011 and 2013, faster than the broader European investment market.4 Some European countries have produced government-sponsored SRI guidelines or information resources for investors; others have offered tax relief for ‘green funds’ or community investment. Belgium has introduced a law prohibiting any Belgian investor from investing in any company that produces or distributes anti-personnel mines and cluster munitions.5
In the United States (US), the total US-domiciled assets under management using responsible investment strategies grew from US$6.57 trillion at the start of 2014 to US$8.72 trillion at the start of 2016, an increase of 33%. These assets now account for more than one in every five dollars under professional management in the US, according to US SIF (the Forum for Sustainable and Responsible Investment).6
The SRI industry in Asia is relatively small, but growing. A common form in Asia is community investing, which includes micro-credit and revolving loan schemes. Some of the best-known practitioners of community investing, such as Grameen Bank of Bangladesh, originated in Asia. Another form of SRI common in Asia is Islamic finance and Syariah-compliant financial schemes.7
Australia/New Zealand is a standout in the period 2014-2016 growing 247%, with 1 out of every 2 dollars under professional management subject to a responsible investment strategy.
Investment firms have been eager to participate in the expanding SRI market, and have responded by creating and promoting various products to investors or by assigning analysts to overlay ESG analysis across regular investment products. Family offices, foundations, nonprofit organisations and university endowments are also increasingly exploring SRI. SRI fund managers – often in concert with civil society organisations and other groups – have been credited with persuading public companies to improve greenhouse gas reduction goals, implement sustainable forestry practices, address poor labour conditions in global supply chains, and promote gender diversity on boards.8 Proponents of SRI argue that investing is not an inherently ‘neutral’ activity, and that through their decisions investment managers can play a role in creating both social and financial value.
A major contemporary driver of SRI is concern about climate change. Environmental groups have urged university endowment managers to divest from fossil fuels, and investors concerned about climate risk are increasingly seeking to reduce carbon-intensive holdings and to expand renewable energy and energy efficiency investment options.9
6 US SIF (2016), ‘Report on US Sustainable, Responsible and Impact Investing Trends’, Executive Summary.
7 Williams, G. (2010), ‘Socially Responsible Investment in Asia’, Lien Centre for Social Innovation.
8 US SIF Foundation (2016), ‘The Impact of Sustainable and Responsible Investment’, June.
9 US SIF Foundation (2016), ‘Family Offices and Investing for Impact’.
Australia/New Zealand is a standout in the period 2014 to 2016 growing 247%, with 1 out of every 2 dollars under professional management subject to a responsible investment strategy.

A Review of Socially Responsible Investing in Australia | 6
At a basic level, SRI asset managers often adopt one of two approaches: an exclusionary filter, or an inclusionary one. The exclusionary approach, which is more popular, filters out certain companies (based on their products or corporate behaviour) when selecting investments for a portfolio.10 Commonly excluded products include alcohol, tobacco, gambling and weapons.11 A firm might also be excluded because it participates in, say, violations of labour standards. The inclusionary approach typically involves adjusting the weights of an investment in a company according to whether its behaviour is more or less socially responsible. A large number of research firms now specialise in collecting information on SRI or corporate social responsibility (CSR).12
In some OECD countries, pension funds and sovereign wealth funds have started engaging in positive (inclusionary) screening based on ethical and/or ESG criteria. In others, a negative (exclusionary) screening approach has been taken – for instance, the Norwegian Government Pension Fund-Global does not invest in weapons producers and has divested from Wal-Mart, citing concerns about labour standards. The California Public Employees' Retirement System (CalPERS) was one of the leaders of the tobacco divestment movement of the late 1990s.13
Other SRI approaches include ‘norms-based screening’, which screens investments against minimum standards of business practice; ‘sustainability-themed investing’, which focuses on investing in themes or assets specifically related to sustainability (such as renewable energy); ‘impact/community investing’, which are investments targeted at a particular social or environmental problem; and ‘corporate engagement and shareholder action’, in which shareholder power is used to influence corporate behaviour. Asset managers may apply various combinations of these approaches. A more detailed description of each of these strategies can be found at Appendix A.
A seventh strategy, ‘integration of ESG factors’, sees investment managers explicitly include ESG factors (Table 3) into traditional financial analysis as part of a mainstream investment offering. This strategy is commonly included in broader measures of responsible investment, but not SRI.
Table 3: Common ESG issues.
Environmental Clean technology, climate change/carbon, green building/smart growth, pollution/toxics, sustainable natural resources/agriculture, water
Social Workplace safety, labour relations, workplace benefits, diversity and anti-bias issues, community development, poverty alleviation, human rights
Governance Corporate political contributions, executive compensation, board diversity, anti-corruption policies, board independence
Source: US SIF Foundation.
Some asset managers employ in-house ESG specialists, while others rely on dedicated research providers or the scoring of managed funds by companies like Morningstar and MSCI. ESG-related company data are much more readily available today. Bodies such as the International Integrated Reporting Council (IIRC), the Global Reporting Initiative (GRI) and the Sustainability Accounting Standards Board (SASB) are all pushing for mandatory reporting of non-financial material information.14 The Task Force on Climate-related Financial Disclosures (TCFD) is developing a set of voluntary disclosure recommendations for use by companies about the financial risks stemming from climate change.
2. PUTTING SOCIALLY RESPONSIBLE INVESTING INTO PRACTICE
10 Companies, industries, practices or even entire countries could be excluded based on a manager’s specific ESG criteria.
11 Increasingly, asset managers are applying similar strategies to industries that have detrimental effects on health and welfare, including organisations that contribute to obesity issues, as well as environmentally destructive products such as palm oil.
12 Berry, T.C. and Junkus, J.C. (2013), ‘Socially Responsible Investing: An Investor Perspective’, Journal of Business Ethics, Vol. 112, pp. 707-720.
13 Oxford Business Knowledge (2007), ‘Recent Trends and Regulatory Implications in Socially Responsible Investment for Pension Funds’, 2007 OECD Roundtable on Corporate Responsibility. 14 Barclays (2016), ‘Sustainable Investing and Bond Returns’, Impact Series.

7 | A Review of Socially Responsible Investing in Australia
For an individual investor, there are three main approaches to implementing an ethical investment strategy.15 These are:
• Direct investing: investors set their own ethical constraints regarding industries or companies that they are comfortable, or not comfortable, having exposure to.
• Investing in ethical managed strategies: investors place their money with ethical managed funds or exchange-traded funds (ETFs).
• Investing in managed strategies with regular reviews for unethical exposure: investors place their money in managed funds that may not have specific ethical filters, but review investments regularly to ensure that no unwanted exposures arise. This approach requires transparency of a fund’s underlying holdings.
For trustees, considering and acting on ethical considerations can be a more complicated process. Ideally, they should try to exercise judgment about the objective validity of any non-financial factors that they choose to include in the investment process. Trustees will also want to consider the potential effectiveness of a contemplated action and the resources available to put actions into effect. They may request from companies the disclosure of additional data, or choose to join established coalitions of investors, such as the Carbon Disclosure Project (CDP).16
A first step for many institutional investors is passive exposure to any of a growing number of relevant indices, such as MSCI’s Low Carbon Target Index. For active investments, trustees are increasingly designing mandates and requiring managers (both internal and external) to identify and articulate ESG factors in their investment processes. ESG integration is more advanced in listed equities than in unlisted assets.17
The range of retail and wholesale investment products available to ethical investors is substantial. In Australia, there are 69 asset managers offering 128 SRI products. The Responsible Investment Association Australasia (RIAA) has certified 51 responsible investment products to date. These include deposit accounts, separately managed accounts, equity funds, fixed interest funds, property funds, cash funds, and ETFs in both equity and credit markets. When choosing an ethical managed fund, an investor can still select from a wide range of investment styles, including Australian or international share funds, conservative or high-growth funds, or ETFs that track international indices in the US, Europe, Japan and Asia.18
15 Campbell, S. (2015), ‘Investment Strategy – How to Action an Ethical Investment Strategy’, NAB Private View, April.
16 Lydenberg, S. (2014), op. cit.
17 Rundell, S. (2016), ‘The Steps of Integration’, pp. 28-31, top1000funds.com (print edition), September.
18 Responsible Investment Association Australasia (n.d.), ‘Certified Investment Products’. http://responsibleinvestment.org/certification/certified-investment-products/
For an individual investor, there are three main approaches to implementing an ethical investment strategy:
• Direct investing
• Investing in ethical managed strategies
• Investing in regular managed strategies, with review for unethical exposures

A Review of Socially Responsible Investing in Australia | 8
In Australia, the mainstream SRI movement began in 1981 with the establishment of August Investment Proprietary Limited (which later became the Australian Ethical Investment Trust). In 1999, the Ethical Investment Association (EIA) was founded. The EIA changed its name in 2007, becoming the contemporary RIAA.19
According to the RIAA, responsible investment constituted $633.2 billion of assets under management in Australia as of 31 December 2015.20 Over 50% of the major superannuation funds and eight of the top ten fund managers in Australia and New Zealand have committed to a more responsible approach to undertaking investments.21 Responsible investing has become increasingly sophisticated across much of the financial sector, including superannuation, asset management, banking, community finance, and financial advisory services.
‘Core’, or SRI, funds accounted for $51.5 billion of assets under management. In terms of their approach, almost all SRI superannuation funds adopt negative screening, with 67% of funds screening against tobacco and 64% against weapons. Just under 50% of SRI superannuation funds also screen against environmental degradation, gambling or animal cruelty. About 33% of funds surveyed by SuperRatings utilise a positive screen in seeking out clean technology investments, while 30% sought out investments in renewable energy.22
Among Australia’s 50 largest superannuation funds, there is a great depth and breadth of approaches to responsible investment. A clear majority (70%) have made some form of public commitment to responsible investing, and about half have in place dedicated SRI options (with the most common product exclusions being tobacco and uranium).23
In-depth analysis of superannuation investments is constrained by the fact that many funds do not fully disclose their investment holdings. The start date for portfolio holdings disclosure reporting in Australia has been delayed to 30 June 2017.24
Following the implementation of the Financial Services Reform Act 2002 (Cth), issuers of financial products in Australia with an investment component have been legally required to disclose the extent to which labour standards, or environmental, social or ethical considerations, are taken into account. This obligation is specifically directed at entities that issue superannuation products, managed investment products and investment life insurance products. The penalties for non-compliance include criminal sanctions and exposure to a range of civil actions.25 Under the Corporations Act 2001 (Cth), providers of financial advice must act in the best interests of their clients. This may involve ascertaining whether ESG considerations are important to their clients and, if they are, conducting inquiries about them.26
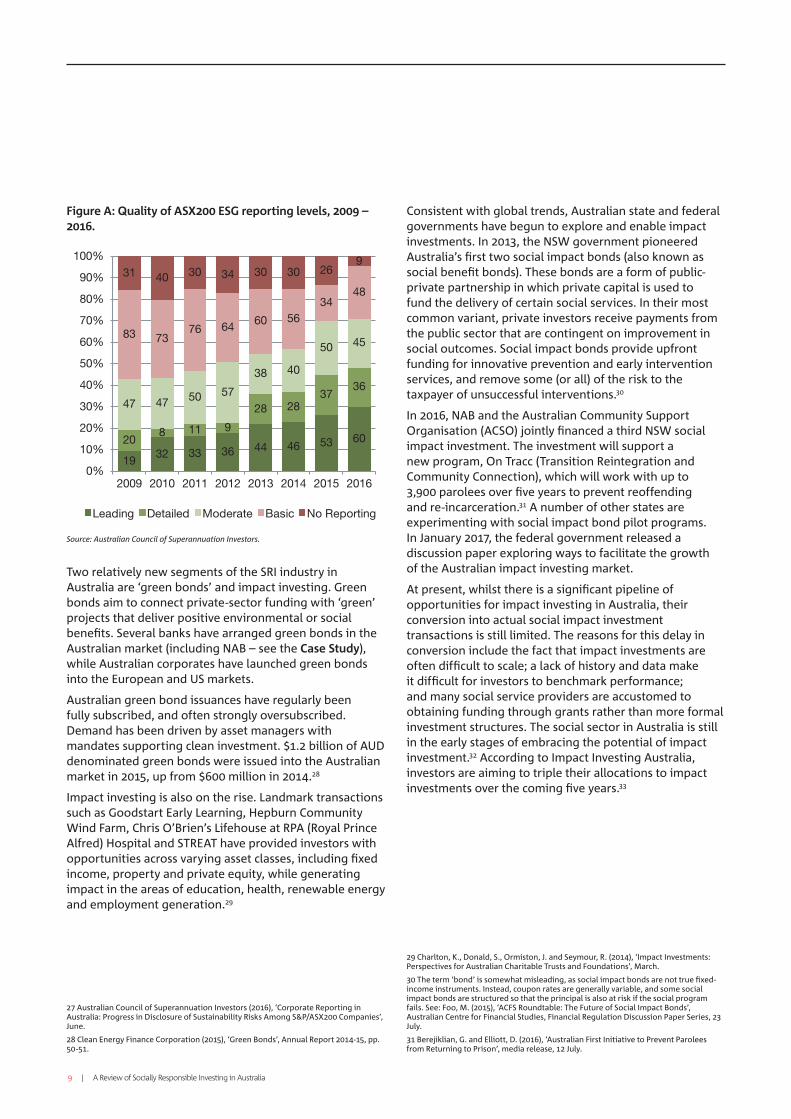
In addition, Recommendation 7.4 of the ASX Corporate Governance Council’s Corporate Governance Principles and Recommendations (3rd edition, 2014) states that listed entities should disclose (on an “if not, why not” basis) whether they have any material exposure to economic, environmental and social sustainability risks – and, if so, how they manage or intend to manage those risks. In 2015, 90% of ASX200 companies provided some level of reporting on sustainability factors in their public disclosures. The introduction of Recommendation 7.4 is likely responsible for the improvement in ESG reporting over the past year (Figure A).27
3. THE SOCIALLY RESPONSIBLE INVESTMENT INDUSTRY IN AUSTRALIA
19 Méndez-Rodríguez, P., Galguera, L., Bravo, M., Benson, K., Faff, R. and Pérez-Gladish, B. (2015), ‘Profiling Ethical Investors’, in: Socially Responsible Investment: A Multi-Criteria Decision Making Approach, Springer.
20 Responsible Investment Association Australasia (2016), ‘Responsible Investment Benchmark Report 2016 Australia’.
21 Responsible Investment Association Australasia (n.d.), ‘About Us’. http://responsibleinvestment.org/about-us/
22 SuperRatings (2015), ‘Sustainable Investments Producing Strong Returns for Superannuation Members’, media release, 11 June.
23 Responsible Investment Association Australasia (2016), ‘Superfund Responsible Investment Benchmark Report 2016’.
24 ASIC (2016), ’16-130MR Further Update on Stronger Super Regime’, media release, 4 May.
25 Donnan, J. (2002), ‘Regulating Ethical Investment: Disclosure under the Financial Services Reform Act’, Journal of Banking and Finance Law and Practice, Vol. 13, pp. 155-178.
26 ASIC (2013), ‘Licensing: Financial Product Advisers – Conduct and Disclosure’, Regulatory Guide 175, October.
70% of major superannuation funds have committed to a more responsible approach to their investments.
9 | A Review of Socially Responsible Investing in Australia
Figure A: Quality of ASX200 ESG reporting levels, 2009 – 2016.
Source: Australian Council of Superannuation Investors.
Two relatively new segments of the SRI industry in Australia are ‘green bonds’ and impact investing. Green bonds aim to connect private-sector funding with ‘green’ projects that deliver positive environmental or social benefits. Several banks have arranged green bonds in the Australian market (including NAB – see the Case Study), while Australian corporates have launched green bonds into the European and US markets.
Australian green bond issuances have regularly been fully subscribed, and often strongly oversubscribed. Demand has been driven by asset managers with mandates supporting clean investment. $1.2 billion of AUD denominated green bonds were issued into the Australian market in 2015, up from $600 million in 2014.28
Impact investing is also on the rise. Landmark transactions such as Goodstart Early Learning, Hepburn Community Wind Farm, Chris O’Brien’s Lifehouse at RPA (Royal Prince Alfred) Hospital and STREAT have provided investors with opportunities across varying asset classes, including fixed income, property and private equity, while generating impact in the areas of education, health, renewable energy and employment generation.29
Consistent with global trends, Australian state and federal governments have begun to explore and enable impact investments. In 2013, the NSW government pioneered Australia’s first two social impact bonds (also known as social benefit bonds). These bonds are a form of public-private partnership in which private capital is used to fund the delivery of certain social services. In their most common variant, private investors receive payments from the public sector that are contingent on improvement in social outcomes. Social impact bonds provide upfront funding for innovative prevention and early intervention services, and remove some (or all) of the risk to the taxpayer of unsuccessful interventions.30
In 2016, NAB and the Australian Community Support Organisation (ACSO) jointly financed a third NSW social impact investment. The investment will support a new program, On Tracc (Transition Reintegration and Community Connection), which will work with up to 3,900 parolees over five years to prevent reoffending and re-incarceration.31 A number of other states are experimenting with social impact bond pilot programs. In January 2017, the federal government released a discussion paper exploring ways to facilitate the growth of the Australian impact investing market.
At present, whilst there is a significant pipeline of opportunities for impact investing in Australia, their conversion into actual social impact investment transactions is still limited. The reasons for this delay in conversion include the fact that impact investments are often difficult to scale; a lack of history and data make it difficult for investors to benchmark performance; and many social service providers are accustomed to obtaining funding through grants rather than more formal investment structures. The social sector in Australia is still in the early stages of embracing the potential of impact investment.32 According to Impact Investing Australia, investors are aiming to triple their allocations to impact investments over the coming five years.33
27 Australian Council of Superannuation Investors (2016), ‘Corporate Reporting in Australia: Progress in Disclosure of Sustainability Risks Among S&P/ASX200 Companies’, June.
28 Clean Energy Finance Corporation (2015), ‘Green Bonds’, Annual Report 2014-15, pp. 50-51.
29 Charlton, K., Donald, S., Ormiston, J. and Seymour, R. (2014), ‘Impact Investments: Perspectives for Australian Charitable Trusts and Foundations’, March.
30 The term ‘bond’ is somewhat misleading, as social impact bonds are not true fixed-income instruments. Instead, coupon rates are generally variable, and some social impact bonds are structured so that the principal is also at risk if the social program fails. See: Foo, M. (2015), ‘ACFS Roundtable: The Future of Social Impact Bonds’, Australian Centre for Financial Studies, Financial Regulation Discussion Paper Series, 23 July.
31 Berejiklian, G. and Elliott, D. (2016), ‘Australian First Initiative to Prevent Parolees from Returning to Prison’, media release, 12 July.

A Review of Socially Responsible Investing in Australia | 10
Also consistent with global trends is a local push for institutional divestment from tobacco and fossil fuel holdings. As a result, a number of Australian financial institutions, superannuation funds and religious groups have taken strong divestment stances.34
The Asset Owners Disclosure Project (AODP) Global Climate 500 Index rates the world’s 500 biggest asset owners – pension funds, insurers, sovereign wealth funds, foundations and endowments – on their management of climate risk within their portfolios. Australia places third overall in the AODP’s country rankings, with a number of Australian asset owners ranked amongst the world’s best in addressing climate risk (Table 4).
Table 4: Highest-ranked Australian asset owners, AODP Global Climate 500 Index.
2016 Rating
2016 Rank
Organisation
AAA Local Government Super (LGS)
AAA 7 AustralianSuper
AAA 1 First State Super
A 1 Victorian Superannuation Fund (VicSuper)
A BT Financial Group (BTFG)
A 8 Cbus Super
BBB 5 MLC Superannuation Fund*
BBB 6 National Australia Bank Superannuation Fund (NAB Super)*
BBB 7 Plum Superannuation Fund (NAB Group)*
BBB 0 Mercer Super Trust (MST)
Source: Asset Owners Disclosure Project (AODP).
* In 2016, NAB announced plans to consolidate several of its superannuation trusts into the MLC brand.
Case Study: National Australia Bank: Green and Social BondsIn 2014, NAB became the first Australian issuer to bring a ‘green bond’ to the local market with its $300 million Climate Bond. The Climate Bond is a senior unsecured NAB corporate bond, with proceeds ring-fenced for financing a portfolio of renewable energy assets including wind farms and solar energy facilities in Victoria, South Australia, Tasmania, WA, NSW and ACT. The NAB Climate Bond was the first bank-issued bond to be certified in compliance with the international Climate Bonds Standard.35
The bond has a tenor of seven years, coupon of 4%, and is rated AA- (S&P) / Aa2 (Moody’s). It was issued with the intention of raising a minimum of $150 million; due to strong investor demand, the final issue was upsized to $300 million.36 NAB attracted interest from both mainstream and dedicated SRI investors (including Australian Ethical and the Clean Energy Finance Corporation) – notably, investors in the bond were more diverse than those in a normal NAB senior unsecured bond.37
In 2016, NAB arranged Australia’s first green ABS (asset-backed security) transaction for FlexiGroup Limited. The Flexi ABS Trust 2016-1 transaction had a size of $260 million, including a $50 million senior-ranking Class A2-G Note rated AAA (Fitch) / Aaa (Moody’s).38 The $50 million tranche, backed by solar receivables, was the world’s first ABS transaction to meet the criteria for certification under the Climate Bonds Standard.
Later in 2016, NAB arranged the Victorian government’s Green Bond, raising $300 million to help finance and refinance Victorian state investments in energy efficiency, renewable energy generation, low-carbon public transport and energy efficient water treatment. This was the first Australian green bond issued by a government.39 88% of investors in the bond had specific green or SRI mandates. The bond has a tenor of five years and pays a coupon of 1.75%.
In 2017, NAB became the first Australian bank to launch a green bond offshore. Proceeds from the EUR 500 million issue will refinance projects and assets in the UK, Europe, Australia and the Americas, including wind and solar energy generation and electrified rail infrastructure.40 NAB will also be one of the arrangers for the first green bond issuance planned by Queensland Treasury Corporation (QTC).
32 Graham, B. and Anderson, E. (2015), ‘Impact Measurement: Exploring its Role in Impact Investing’, National Australia Bank, The Difference Incubator and Benefit Capital.
33 Dembek, K., Madhavan, D., Michaux, F. and Potter, B. (2016), ‘2016 Investor Report’, Impact Investing Australia.
34 Alexander, S., Nicholson, K. and Wiseman, J. (2014), ‘Fossil Free: The Development and Significance of the Fossil Fuel Divestment Movement’, Melbourne Sustainable Society Institute, Issues Paper No. 4, September.
35 NAB (2014), ‘NAB’s Certified Climate Bond an Australian First’, 4 December.
36 Impact Investing Australia (n.d.), ‘Case Study: NAB Climate Bond’. http://impactinvestingaustralia.com/wp-content/uploads/IIA_NABClimateBond_final.pdf
37 Davison, L. (2015), ‘Green-tinted Lenses’, KangaNews, April/May, pp. 14-23.
38 NAB (2016), ‘NAB Launches Australia’s Inaugural Asset Backed Green Bond’, 19 April.
39 NAB (2016), ‘NAB Launches Australian and World First Green Bond’, 20 July.
40 NAB (2017), ‘NAB Becomes First Australian Bank to Launch Offshore Green Bond’, 1 March.
Australia places third overall in country ratings on the management of climate risk by the biggest asset owners.

11 | A Review of Socially Responsible Investing in Australia
Globally, the ‘labelled’ green bond market saw US$81 billion of issuance in 2016. 82% of the labelled green bond market is investment grade, with 43% of bonds outstanding falling into the AAA credit rating band (Figure B). This is primarily due to the presence of large development bank issuers such as the World Bank, International Finance Corporation and European Investment Bank.41
In 2017, NAB pioneered another type of SRI bond: the NAB Social Bond (Gender Equality). Proceeds from the $500 million issuance will be used to finance or refinance organisations that the Workplace Gender Equality Agency (WGEA) cites as Employers of Choice for Gender Equality (EOCGE), and whose primary activities do not involve alcohol, gambling, tobacco, military weapons, predatory lending, fossil fuels, palm oil, transport of live cattle or whaling. The bond has a tenor of five years and is rated AA– (S&P) / Aa2 (Moody’s).42
Figure B: Investment grades of the global labelled green bond market.
Source: Climate Bonds Initiative.
AAA43%
AA15%
A15%
BBB9%
<BBB4%
No Rating14%
41 Climate Bonds Initiative (2016), ‘Bonds and Climate Change: The State of the Market in 2016’.
42 NAB (2017), ‘Investors put $500 Million Behind World’s First Social Bond Promoting Workplace Gender Equality’, 17 March.
A Review of Socially Responsible Investing in Australia | 1
This section explores the evolving requirement for investment managers to incorporate ESG factors into their investment decisions – whether or not there is a specific mandate from the trustee to invest in accordance with SRI principles.
In common law jurisdictions, fiduciary duties are the key source of limits on the discretion of investment managers. In Australia, the fiduciary duty of investment managers is to act in the best interests of their clients. For instance, under the Superannuation Industry (Supervision) Act 1993 (Cth) (‘SIS Act’), superannuation trusts and their agents must act in the “best interests of all members by maximising returns and mitigating risks.”43 A superannuation fund must be maintained solely for the provision of benefits to members at retirement (the ‘sole purpose test’). In 2013, the Australian Prudential Regulation Authority (APRA) stipulated that superannuation licensees may take ethical or ESG considerations into account only where there is no conflict with the requirements in the SIS Act.44 Statutory and common law duties apply similarly to managed investment schemes (including managed funds) and the statutory funds of life insurance companies.
International legal opinion on ESG investing appears to have shifted over the past decade. For instance, a landmark United Nations report in 2005 (the ‘Freshfields Report’) concluded that the links between ESG factors and financial performance are increasingly being recognised, and therefore:
integrating ESG considerations into an investment analysis so as to more reliably predict financial performance is clearly permissible and is arguably required in all jurisdictions.45
A more recent, follow-up report purports to end the debate about whether fiduciary duty is a legitimate barrier to investors integrating ESG factors into their investment processes. It argues that failing to consider long-term investment value drivers, which include ESG issues, is itself a failure of fiduciary duty.
However, there may still be a lack of clarity. According to a report from the UNEP Finance Initiative, there is a wide range of interpretations being adopted by market participants. Many see ESG issues as consistent with value creation, particularly over long-term horizons, but others continue to view ESG issues as being ‘non-financial’.46
With respect to APRA-regulated bodies, clarification may be necessary. For its part, APRA officials have noted that they generally give funds the freedom to decide how to account for ESG issues, and that negative screens (so long as they are relatively limited in number) are generally unlikely to result in an unreasonable portfolio. However, positive screens could run counter to the ‘sole purpose’ test and result in inefficient portfolios.47
In the past few years, high-profile speeches by regulatory officials have strengthened the case for financial institutions to pay greater attention to ESG risks – and climate risks in particular. In a 2015 speech, Mark Carney, the governor of the Bank of England and chair of the Financial Stability Board, suggested that combating climate change would render the vast majority of the world’s reserves of fossil fuels “stranded” – affecting investors with potentially huge exposures to the natural resource and extraction sectors48. In 2017, Geoff Summerhayes, an executive board member of APRA, argued that climate risks can no longer be seen as a far-off problem and today are distinctly financial in nature.49 Recent legal analysis (commissioned by the Centre for Policy Development and the Future Business Council) supports the view that there are no legal obstacles to Australian directors taking into account climate change, and other sustainability risks, that are material to their companies’ interests. In fact, company directors who fail to consider climate change risks could conceivably be found liable for breaching the “duty of care and diligence” imposed on them by the Corporations Act 2001 (Cth).50
4. INCORPORATING ESG FACTORS INTO BROADER INVESTMENT CRITERIA
43 OECD (2011), ‘The Role of Institutional Investors in Promoting Good Corporate Governance’, p. 75.
44 APRA (2013), ‘SPG 530 – Investment Governance’, Prudential Practice Guide, November, paragraph 34.
45 Freshfields Bruckhaus Deringer (2005), ‘A Legal Framework for the Integration of Environmental, Social and Governance Issues into Institutional Investment’, report for the Asset Management Working Group of the UNEP Finance Initiative, October.
46 Sullivan, R., Martindale, W., Feller, E. and Bordon, A. (2015), ‘Fiduciary Duty in the 21st Century’, United Nations Global Compact, UNEP Finance Initiative, Principles for Responsible Investment and Inquiry: Design of a Sustainable Financial System, p. 29.
47 Ibid. See also: O’Connor, S. (2016), ‘Deeper Regulatory Clarity Around Fiduciary Duty Crucial to Scaling Impact Investments’, Impact Investing Australia, 9 August.
48 Carney, M. (2015), ‘Breaking the Tragedy of the Horizon – Climate Change and Financial Stability’, speech at Lloyd’s of London, 29 September.
49 Summerhayes, G. (2017), ‘Australia’s New Horizon: Climate Change Challenges and Prudential Risk’, speech at the Insurance Council of Australia Annual Forum, 17 February.
50 Hutley, N. and Hartford-Davis, S. (2016), ‘Climate Change and Directors’ Duties’, Memorandum of Opinion, The Centre for Policy Development and the Future Business Council, 7 October.
Failure to consider long-term investment value drivers, which include ESG issues, is itself a failure of fiduciary duty.

1 | A Review of Socially Responsible Investing in Australia
A priori theory suggests that imposing negative screens will shrink the investment opportunity set available to an SRI fund manager. SRI funds may underinvest in financially attractive opportunities and suffer from a loss of diversification. The result is that they would be expected to underperform (or at least not outperform) the broader market, or their unconstrained conventional fund counterparts. (Note: A lower rate of financial return may be acceptable to, and expected by, some SRI investors who derive non-financial utility from investing in ethical companies.) Furthermore, the added costs associated with screening and monitoring may cause SRI funds to charge higher management fees than similar actively-managed conventional funds.
In addition, there are reasons why ‘sin’ stocks51 might be expected to outperform other stocks. These include: (1) there may be a real economic cost to companies in upholding ‘good’ social values (e.g. the cost of pollution controls); (2) investors may fear ‘headline risk’, leading them to permanently discount sin stocks; (3) investors may spurn sin stocks because they subjectively dislike them; and (4) some sin industries tend to have significant barriers to entry, allowing incumbents to extract high profits.52 Conversely, companies perceived to be meeting high ethical standards may become overpriced in stock markets, as investors with ethical mandates buy these stocks and sell others.
A countervailing theory is that socially responsible companies might be expected to outperform other companies over the long run by using inputs more sustainably, generating employee and customer loyalty, and avoiding reputational damage or costly litigation – this is the notion of ‘doing well while doing good’. Positive SRI screens may help investment analysts to identify companies with superior corporate governance. A key assumption of this ‘outperformance hypothesis’ is that stock markets misprice information on CSR factors in the short run such that SRI funds may outstrip conventional funds in the long run.53
To assess the validity of arguments for and against socially responsible investing, we surveyed a range of local and international studies. These are discussed below.
Empirical EvidenceThe balance of empirical evidence would seem to suggest that socially responsible investing does not come at a detriment to financial returns. In addition, incorporating ESG factors into the investment process might even result in an outperformance effect. Most academic studies compare the performance of SRI funds with reference groups of conventional funds of similar age, size, fees and risk exposures.54 On balance, the extant literature indicates that there is not a significant difference in risk-adjusted returns between these two groups. For instance, Hamilton et al. (1993) find that the performance of socially responsible mutual funds in the US over 1981-1990 is not statistically different from the performance of conventional mutual funds. That is, investors can expect to lose nothing by placing their money in socially responsible funds.55 Guerard (1997), similarly, finds no statistically significant differences between the mean returns of unscreened and screened equity portfolios in the US over the period 1987-1994.56 Sauer (1997) uses the Domini 400 Social Index as a proxy for the restricted universe of socially responsible equity investments, and finds that its performance is comparable to benchmark portfolios.57
Goldreyer and Diltz (1999) conclude that social screening does not affect the investment performance of US equity, bond, and balanced mutual funds over the period 1994-1997 in any systematic, predictable way.58 Expanding the analysis internationally, Bauer et al. (2005) find no evidence of significant differences in risk-adjusted returns between ethical and conventional mutual funds in Germany, the UK and the US for the 1990-2001 period.59 Statman and Glushkov (2009), analysing returns to US stocks over 1992-2007, suggest that the advantage gained by tilting toward stocks of companies with high social responsibility scores is largely offset by the disadvantage that results from the exclusion of stocks of shunned companies.
5. THE EVIDENCE ON FINANCIAL PERFORMANCE
51 That is, stocks associated with ‘sin-seeking’ activities such as consumption of alcohol, adult services, gaming, tobacco, weapons and biotech alterations.
52 Fabozzi, F.J., Ma, K.C. and Oliphant, B.J. (2008), ‘Sin Stock Returns’, The Journal of Portfolio Management, 1 October.
53 The outperformance hypothesis is at odds with the efficient market hypothesis. If SRI screening processes generate value-relevant information, conventional investment managers could simply replicate these screens.
54 Some also compare fund performance relative to a market benchmark, such as a broad market index. However, actively-managed funds, of both the SRI and conventional varieties, tend to underperform the index over the long run on average.
55 Hamilton, S., Jo, H. and Statman, M. (1993), ‘Doing Well While Doing Good? The Investment Performance of Socially Responsible Mutual Funds’, Financial Analysts Journal, November-December, pp. 62-66.
56 Guerard, J.B. (1997), ‘Is There a Cost to Being Socially Responsible in Investing?’, Journal of Forecasting, Vol. 16, pp. 475-490.
57 Sauer, D.A. (1997), ‘The Impact of Social-Responsibility Screens on Investment Performance: Evidence from the Domini 400 Social Index and Domini Equity Mutual Fund’, Review of Financial Economics, Vol. 6, No. 2, pp. 137-149.
58 Goldreyer, E.F. and Diltz, J.D. (1999), ‘The Performance of Socially Responsible Mutual Funds: Incorporating Sociopolitical Information in Portfolio Selection’, Managerial Finance, Vol. 25, Issue 1, pp. 23-36.
59 Bauer, R., Koedijk, K. and Otten, R. (2005), ‘International Evidence on Ethical Mutual Fund Performance and Investment Style’, Journal of Banking & Finance, Vol. 29, Issue 7, pp. 1751-1767.
The balance of empirical evidence would seem to suggest that socially responsible investing does not come at a detriment to financial returns

A Review of Socially Responsible Investing in Australia | 1
The academic evidence is not unanimous. For instance, Renneboog et al. (2008) construct a database of socially responsible and conventional equity mutual funds across 17 countries, and find that SRI funds unequivocally underperform their conventional counterparts in France, Ireland, Sweden and Japan. (In the other countries, which include Australia, risk-adjusted returns are mostly not statistically dissimilar between the two groups.)60 On the other hand, Henke (2016) finds that socially responsible bond funds in the US and Eurozone have outperformed conventional bond funds by a statistically significant 0.33-0.49% annually over the period 2001-2014. Henke attributes this outperformance to the exclusion of corporate bond issuers with poor CSR activities.61 Barclays (2016) finds that a positive ESG tilt results in a small but steady performance advantage in diversified corporate bond portfolios. Bonds with low governance scores experienced a consistently higher rate of subsequent downgrades than those with high scores throughout the study period.62
A meta-analysis of 20 academic and broker studies, by the UNEP Finance Initiative and Mercer, establishes that half of these studies produce evidence of a positive relationship between ESG factors and portfolio performance, with seven reporting a neutral effect and three a negative association.63 A more recent meta-analysis, by analysts at Deutsche Bank, finds “overwhelming” evidence that firms with high ratings for CSR and ESG factors have a lower (ex ante) cost of capital in terms of debt and equity. Moreover, strong CSR and ESG factors are correlated with corporate financial outperformance. However, studies of actual SRI fund returns produce neutral or mixed results.64
The largest aggregated analysis to date, conducted by staff from Deutsche Asset & Wealth Management and the University of Hamburg, combines the findings of about 2,200 individual studies. It concludes that the business case for ESG investing is empirically well-founded, with roughly 90% of studies finding at least a non-negative relationship between ESG factors and corporate financial performance, and a majority reporting positive findings.65
Australian EvidenceBauer et al. (2006) find no evidence of significant differences in risk-adjusted returns between ethical and conventional funds in Australia over the period 1992-2003.66 Similarly, Humphrey and Lee (2011) conclude that investing in an Australian SRI fund does not result in either a financial penalty or benefit for investors. They find that Australian SRI funds on aggregate generally tilt their portfolios towards smaller stocks. However, imposing an increasing number of negative screens significantly reduces the ability of fund managers to form diversified portfolios.67 This is an important finding for countries with a relatively small universe of stocks (assuming that Australian investors choose to invest the bulk of their assets locally).
Jones et al. (2007) adopt a different methodology, comparing the investment performance of 89 SRI funds in Australia (with asset allocations across several categories, including Australian and international shares, Australian and international fixed interest, Australian and international property securities, cash, direct property, and other sectors) against market indices. They find that SRI funds underperformed key ASX benchmarks, on both raw and risk-adjusted measures of return, over the period 1986-2005. However, the authors note that many managed funds in Australia only perform as well as (or worse than) the market benchmark – and so again there may be little difference to an investor in choosing between an SRI fund and a conventional fund.68
60 Renneboog, L., Ter Horst, J. and Zhang, C. (2008), ‘The Price of Ethics and Stakeholder Governance: The Performance of Socially Responsible Mutual Funds’, Journal of Corporate Finance, Vol. 14, pp. 302-322.
61 Henke, H. (2016), ‘The Effect of Social Screening on Bond Mutual Fund Performance’, Journal of Banking & Finance, Vol. 67, pp. 69-84.
62 Barclays (2016), op. cit.
63 UNEP Finance Initiative and Mercer (2007), ‘Demystifying Responsible Investment Performance: A Review of Key Academic and Broker Research on ESG Factors’, October.
64 Fulton, M., Kahn, B.M. and Sharples, C. (2012), ‘Sustainable Investing: Establishing Long-term Value and Performance’, Deutsche Bank Climate Change Advisors, June.
65 Friede, G., Busch, T. and Bassen, A. (2015), ‘ESG and Financial Performance: Aggregated Evidence from more than 2,000 Empirical Studies’, Journal of Sustainable Finance & Investment, Vol. 5, No. 4, pp. 210-233.
66 Bauer, R., Otten, R. and Rad, A.T. (2006), ‘Ethical Investing in Australia: Is There a Financial Penalty?’, Pacific-Basin Finance Journal, Vol. 14, Issue 1, pp. 33-48.
67 Humphrey, J.E. and Lee, D.D. (2011), ‘Australian Socially Responsible Funds: Performance, Risk and Screening Intensity’, Journal of Business Ethics, Vol. 102, pp. 519-535.
68 Jones, S., van der Laan, S., Frost, G. and Loftus, J. (2007), ‘The Investment Performance of Socially Responsible Investment Funds in Australia’, Journal of Business Ethics, Vol. 80, pp. 181-203.

15 | A Review of Socially Responsible Investing in Australia
According to the RIAA’s latest annual benchmarking survey:
• Core69 responsible investment Australian equities funds have outperformed both the ASX300 and the average large-cap Australian equities fund across one, three, five and 10 years.
• Core responsible investment international equities funds have outperformed large-cap international equities funds over five and 10 years, but slightly underperformed them in the short run.
• Core responsible multi-sector growth funds (balanced funds) have outperformed their equivalent mainstream multi-sector growth funds over all time periods – one, three, five and 10 years (Table 5).70
An analysis by the Australian Financial Review shows that several Australian ethical funds have outperformed the ASX200 Accumulation Index over the past one, three and five years, although performance in the first quarter of 2016 was mixed (Table 6). One reason for the relative outperformance of many ethical funds has been the absence in their portfolios of laggard large-cap mining stocks, such as BHP Billiton and Rio Tinto, which are often negatively screened on account of their exposures to fossil fuels.71
According to SuperRatings, in the 12 months to April 2015 ‘Sustainable Balanced’ superannuation funds produced a median 11.9% return, compared with a 12% median return for the broader SuperRatings SR50 Balanced Index (with similar investment management fees). Both the Sustainable Balanced and Sustainable Australian Shares investment options outperformed mainstream options over the past three years, while mainstream options outperformed over five years.72
69 The RIAA defines ‘core’ responsible investment approaches to include at least one of the following primary strategies: negative, positive or norms-based screening; sustainability-themed investing; impact investing; community finance; or corporate engagement. In contrast, the ‘broad’ responsible investment market is largely comprised of institutional funds that apply ESG integration as part of a mainstream investment offering.
70 The response rate to the RIAA’s latest benchmark report was 75%. Where survey responses were not received, publicly available information was used where available.
71 Frost, J. (2016), ‘Ethical Investment: Just How Socially Responsible is Your Fund?’, The Australian Financial Review, 20 May.
72 SuperRatings (2015), op. cit.

A Review of Socially Responsible Investing in Australia | 16
Table 5: Performance of core responsible investment funds, 2016.
Australian Share Funds 1 year 3 years 5 years 10 years
Average Responsible Investment Fund* 8.% 1.% 10.5% 7.6%
Large-Cap Australian Share Fund Average .% 9.% 6.5% 5.1%
S&P/ASX00 Accumulation Index .6% 9.% 7.0% 5.6%
International Share Funds 1 year 3 years 5 years 10 years
Average Responsible Investment Fund** 9.0% 0.0% 15.% 7.0%
Large-Cap International Share Fund Average 10.7% 1.7% 1.7% .%
MSCI World ex Australia Index $A 11.8% .9% 15.5% 5.1%
Multi-Sector Growth Funds 1 year 3 years 5 years 10 years
Average Responsible Investment Fund*** 7.0% 11.5% 8.% 6.%
Multi-Sector Growth Fund Average .7% 9.5% 7.5% .5%
* (Between 16-30 funds sampled depending on time period)
** (Between 2-13 funds sampled depending on time period)
*** (Between 4-10 funds sampled depending on time period)
Source: Responsible Investment Association Australasia.
Table 6: Performance of selected ethical funds as at 31 March 2016.
1 month 3 months 1 year 3 years 5 years
AMP Capital Sustainable Fund .8% -.9% -11.0% .9% .99%
Australian Ethical Australian Equities .90% -5.0% .50% 1.50% 10.10%
Hunter Hall Value Growth Trust 1.0% 1.05% 11.60% 18.90% 9.90%
Perpetual Ethical SRI Fund 5.0% -.99% 0.% 10.78% 1.10%
ASX00 Accumulation Index .7% -.75% -9.59% 5.9% 5.70%
ASX Small Industrials 6.00% -1.10% 5.80% 8.00% 7.80%
MSCI World -0.80% N/A -.10% 18.0% 1.00%
Source: Australian Financial Review, company reports, Bloomberg.

17 | A Review of Socially Responsible Investing in Australia
This report is among the first to employ data from the recently-launched Australian Equities Database (AED), a unique proprietary dataset that offers monthly series for around 6,000 Australian stocks over the period 1926 to 1995. From 1995 to 2015, we supplement the AED with data obtained from Datastream.
The AED’s data from 1926 to 1972 are completely unique and were developed by reference to the monthly gazettes and paper records of the Melbourne Stock Exchange (MSX). From 1973 to 1995, the data are obtained from gazettes of the ASX. The AED only records information on the ordinary shares of each company; preference shares, rights trading and debentures are not recorded. Companies are categorised according to the Global Industry Classification Standard (GICS).
Figure C shows the 10 largest listed firms by market capitalisation at different points in Australian history. At various times, many of the large-cap Australian companies engaged in practices that would today be regarded as unethical or highly irresponsible. Tobacco companies (one of which was once the largest listed firm on the MSX) aggressively opposed the introduction of health warnings on cigarette packs for many decades.73 One large industrial company, responsible for a deadly asbestos mine at Wittenoom, was in 1988 found by the Western Australian Supreme Court to have been “recklessly indifferent” to the safety of its workers.74
To attempt to estimate how a socially responsible investment portfolio might have performed over the past 90 years, we can apply simple exclusionary screens to exclude certain stocks and industries.75 In the first instance, we filter out all companies in which alcohol, tobacco, gaming or explosives forms a fundamental part of their business.
We compare two hypothetical investment portfolios: one comprising the 20 largest stocks (by market capitalisation) that pass the exclusionary screen, and one unconstrained portfolio of the 20 largest stocks. We compare the performance of each portfolio over rolling 20-year windows from 1926 to 2015. Thus, the first pair of portfolios starts in 1926 and ends in 1945, the second pair starts in 1927 and ends in 1946, and so on with the final pair starting in 1996 and ending in 2015.76 This procedure generates 71 pairs of portfolios, each reflecting the experience of a hypothetical investor with a 20-year investment horizon.
We then calculate the median and mean annual returns, and the standard deviation of annual returns, for all 71 pairs of portfolios. We assume that dividends are reinvested on an annual basis. The results of this exercise are summarised in Table 7.
It is noted that the Australian equity market has considerably fewer listed securities than the US market, and is dominated by large resource stocks. Notwithstanding this observation, our exercise in exclusionary screening of equities provides some interesting insights.
6. HISTORICAL SRI PERFORMANCE: THE AUSTRALIAN EQUITIES DATABASE
73 Chapman, S. and Carter, S.M. (2003), ‘“Avoid Health Warnings on All Tobacco Products for Just as Long as we Can”: A History of Australian Tobacco Industry Efforts to Avoid, Delay and Dilute Health Warnings on Cigarettes’, Tobacco Control, Vol. 12, pp. iii13-iii22.
74 Barrowclough, A. (2011), ‘Wiped from the Map – But Town of Death is Still Killing’, The Times, 21 April, p. 46.
75 It is important to note that notions of corporate responsibility have shifted dramatically over time, and we do not have the records to assess many now-defunct companies against modern SRI criteria such as labour relations, human rights or animal testing.
76 Each portfolio is held constant for 20 years. Where a company ceases to exist, because it has either been acquired by another company or otherwise delisted, we substitute the next largest company (or the next largest company that passes the filter in the case of the screened portfolio) and allocate it the same weight that the exiting company had in the year before its exit.
A Review of Socially Responsible Investing in Australia | 18
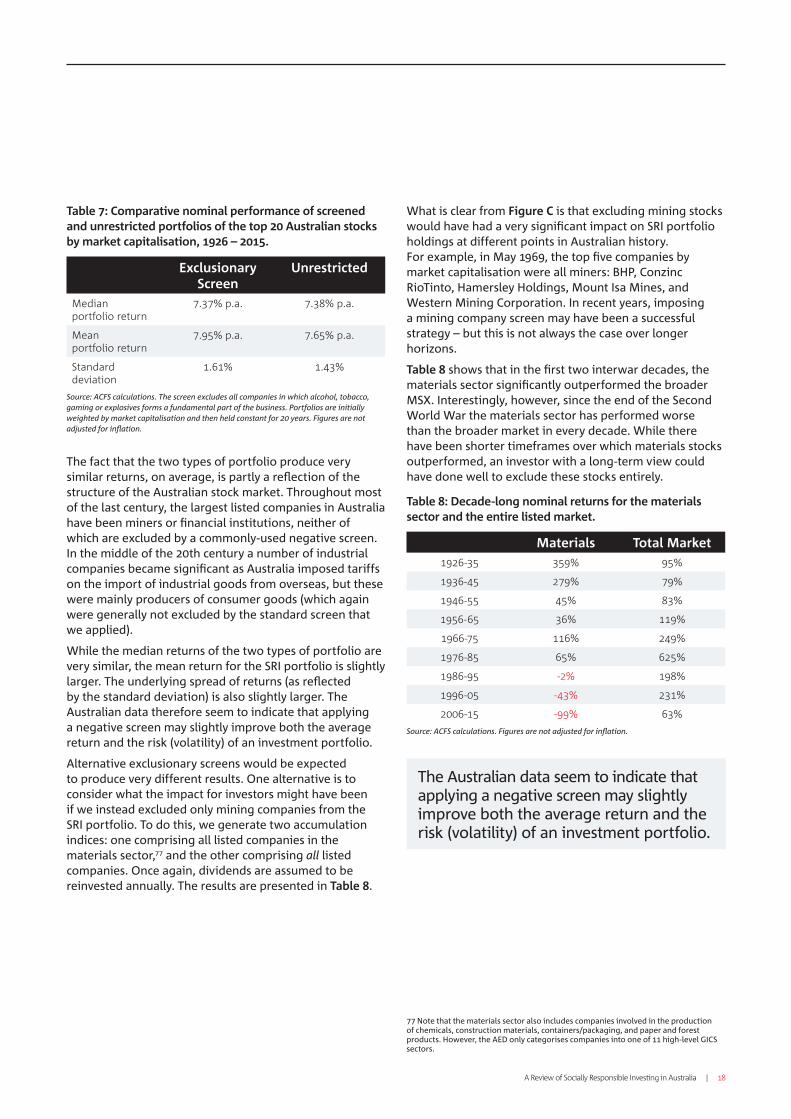
Table 7: Comparative nominal performance of screened and unrestricted portfolios of the top 20 Australian stocks by market capitalisation, 1926 – 2015.
Exclusionary Screen
Unrestricted
Median portfolio return
7.7% p.a. 7.8% p.a.
Mean portfolio return
7.95% p.a. 7.65% p.a.
Standard deviation
1.61% 1.%
Source: ACFS calculations. The screen excludes all companies in which alcohol, tobacco, gaming or explosives forms a fundamental part of the business. Portfolios are initially weighted by market capitalisation and then held constant for 20 years. Figures are not adjusted for inflation.
The fact that the two types of portfolio produce very similar returns, on average, is partly a reflection of the structure of the Australian stock market. Throughout most of the last century, the largest listed companies in Australia have been miners or financial institutions, neither of which are excluded by a commonly-used negative screen. In the middle of the 20th century a number of industrial companies became significant as Australia imposed tariffs on the import of industrial goods from overseas, but these were mainly producers of consumer goods (which again were generally not excluded by the standard screen that we applied).
While the median returns of the two types of portfolio are very similar, the mean return for the SRI portfolio is slightly larger. The underlying spread of returns (as reflected by the standard deviation) is also slightly larger. The Australian data therefore seem to indicate that applying a negative screen may slightly improve both the average return and the risk (volatility) of an investment portfolio.
Alternative exclusionary screens would be expected to produce very different results. One alternative is to consider what the impact for investors might have been if we instead excluded only mining companies from the SRI portfolio. To do this, we generate two accumulation indices: one comprising all listed companies in the materials sector,77 and the other comprising all listed companies. Once again, dividends are assumed to be reinvested annually. The results are presented in Table 8.
What is clear from Figure C is that excluding mining stocks would have had a very significant impact on SRI portfolio holdings at different points in Australian history. For example, in May 1969, the top five companies by market capitalisation were all miners: BHP, Conzinc RioTinto, Hamersley Holdings, Mount Isa Mines, and Western Mining Corporation. In recent years, imposing a mining company screen may have been a successful strategy – but this is not always the case over longer horizons.
Table 8 shows that in the first two interwar decades, the materials sector significantly outperformed the broader MSX. Interestingly, however, since the end of the Second World War the materials sector has performed worse than the broader market in every decade. While there have been shorter timeframes over which materials stocks outperformed, an investor with a long-term view could have done well to exclude these stocks entirely.
Table 8: Decade-long nominal returns for the materials sector and the entire listed market.
Materials Total Market
196-5 59% 95%
196-5 79% 79%
196-55 5% 8%
1956-65 6% 119%
1966-75 116% 9%
1976-85 65% 65%
1986-95 -% 198%
1996-05 -% 1%
006-15 -99% 6%
Source: ACFS calculations. Figures are not adjusted for inflation.
77 Note that the materials sector also includes companies involved in the production of chemicals, construction materials, containers/packaging, and paper and forest products. However, the AED only categorises companies into one of 11 high-level GICS sectors.
The Australian data seem to indicate that applying a negative screen may slightly improve both the average return and the risk (volatility) of an investment portfolio.

19 | A Review of Socially Responsible Investing in Australia
Figure C: Top 10 listed firms by market capitalisation, 1926 – present.
0%
10%
20%
30%
40%
50%
60%
1926
1931
1936
1941
1946
1951
1956
1961
1966
1971
1976
1981
1986
1991
1996
2001
2006
2011
2016
June-1951
1. BHP
. Colonial Sugar Refining
. Australian Gas Light
. Tooth & Company
5. ACI International
6. British Tobacco Australia
7. ANZ Group (ANZ Banking Group)
8. Email
9. Herald & Weekly Times
10. Bank of NSW (Westpac)
June-1930
1. British Tobacco Australia
. Bank of NSW (Westpac)
. Colonial Sugar Refining
. Union Bank (ANZ Banking Group)
5. Australasia Bank (ANZ Banking Group)
6. Commercial Banking Co of Sydney (National Australia Bank)
7. Tooth & Company
8. Eng S & A Bank (ANZ Banking Group)
9. National Bank of Australia (National Australia Bank)
10. Australian Gas Light
May-2016
1. Commonwealth Bank of Australia
. Westpac
. National Australia Bank
. ANZ Banking Group
5. Telstra
6. BHP Billiton
7. CSL
8. Wesfarmers
9. Woolworths
10. Transurban Group
Financials
Materials
Other Sector
May-1969
1. BHP
. Conzinc Rio Tinto of Australia (Rio Tinto Group)
. Hamersley Holdings
. Mount Isa Mins (MIM Holdings)
5. Western Mining Corporation (Alumina)
6. Colonial Sugar Refining
7. The Plessey Company
8. ANZ Bank (ANZ Banking Group)
9. Myer Emporium
10. Bank of NSW (Westpac)
May-1987
1. BHP
. Western Mining Corporation (Alumina)
. Elders IXL (Foster's Group)
. Conzinc Rio Tinto of Australia (Rio Tinto Group)
5. Placer Devlopment
6. Boral Limited (Boral)
7. ANZ Banking Group
8. Industrial Equity
9. National Australia Bank
10. Westpac

A Review of Socially Responsible Investing in Australia | 0
7. CONCLUSION
The SRI sector is an increasingly important component of the broader investment management industry, both in Australia and abroad. In recent years, investors and superannuants have benefited from a larger set of options to match their ethical values. Even in ‘mainstream’ investment funds, fund managers are progressively incorporating ESG factors into their decision-making processes.
Crucially, the international evidence on SRI funds suggests that over the long run, they generally match or outperform similar conventional managed funds. Funds that engage in ESG integration have also matched or outperformed their mainstream peers. In Australia, with respect to negatively-screened Australian equities strategies, a number of SRI funds can attribute their outperformance in part to the global decline in commodity prices over the past few years, and the impact of this decline on mining stocks.
Looking back at the last 90 years of listed equities data in Australia, we find that applying the standard negative screens (alcohol, tobacco, gaming and explosives) would have had a minimal positive impact on the returns of a portfolio of large companies, given the low historic exposure of the Australian market to these industries. However, screening out mining stocks – on account of their contribution to fossil fuel production and environmental degradation – would substantially alter portfolio holdings. In this context, the impact on historical returns is mixed: in some decades, mining stocks have outperformed the broader market, while in others they have significantly trailed it.
Going forward, we expect the SRI industry in Australia to continue to mature. Growth will be driven by greater demand for ethical products from socially-conscious investors – with climate change risk being a major contemporary source of concern. Growth will also result from new commitments by investment managers, superannuation funds, and financial advisers to offer specific SRI options or to integrate ESG overlays across their portfolios; and from new innovations in philanthropy and impact investing.
As the Australian superannuation system – already among the world’s largest – is projected to double in size over the next 10 years, the pool of funds available for SRI and responsible investing should also expand, both in relative and absolute terms. Financial services firms have a role to play in developing new products that cater to investors’ changing needs. Policymakers may have a role to play in facilitating a pipeline of impact investments, and in clarifying the regulatory framework that applies to investment managers.

1 | A Review of Socially Responsible Investing in Australia
Re
spo
nsi
ble
In
vest
me
nt
Co
re R
esp
on
sib
le I
nve
stm
en
t (S
RI
or
Eth
ical
In
vest
me
nts
)
Negative screening – screening that systematically excludes specific industries, sectors, companies, practices, countries or jurisdictions that do not align with responsible investment goals. This approach is also referred to as ‘values-based’ or ethical screening. Common criteria used in negative screening include gaming, alcohol, tobacco, weapons, pornography and animal testing.
Positive screening – involves screening investment in sectors, companies or projects selected for positive ESG or sustainability performance relative to industry peers. It may also be referred to as ‘best-in-class’ screening. Positive screening involves identifying companies with superior ESG performance from a variety of industries and markets.
Norms-based screening – involves the screening of investments that do not meet minimum standards of business practice. Standards applied are based on international norms such as those defined by the United Nations (UN). In practice, norms-based screening may involve the exclusion of companies that contravene the UN Convention on Cluster Munitions, as well as positive screening based on ESG criteria developed through international bodies such as the UNGC (United Nations Global Compact), ILO (International Labour Organization), UNICEF (United Nations Children’s Fund) and the UNHRC (United Nations Human Rights Council).
Sustainability-themed investing – relates to investment in themes or assets that specifically relate to sustainability. This commonly includes funds that invest in clean energy, green technology, sustainable agriculture and forestry, green property or water technology. This category also includes multi-strategy portfolios that may contain a variety of asset classes or a combination of these themes.
Impact investing – targeted investments aimed at addressing social or environmental issues while also creating positive financial returns for investors. Impact investing includes community investing, which involves projects that have a defined social purpose, as well as environmental investing that typically aims to finance initiatives that address key environmental issues.
Corporate advocacy and shareholder action – refers to the employment of shareholder power to influence corporate behaviour. This may be conducted through direct corporate engagement such as communications with senior management or boards, filing or co-filing shareholder proposals, and proxy voting in alignment with comprehensive ESG guidelines.
Bro
ad
Re
spo
nsi
ble
In
vest
me
nt ESG integration – ESG integration involves the systematic and explicit inclusion of environmental,
social and governance factors into traditional financial analysis and investment decision-making by investment managers. This approach rests on the belief that these factors are a core driver of investment value and risk.
Source: Responsible Investment Association Australasia.
APPENDIX A: DEFINITIONS OF RESPONSIBLE INVESTMENT STRATEGIES

A Review of Socially Responsible Investing in Australia |

| A Review of Socially Responsible Investing in Australia

This document is independent research written by ACFS and is distributed by National Australia Bank Limited ABN 1 00 0 97 (AFSL 0686) (‘NAB’) for information purposes and does not constitute financial product advice. This is not an offer to buy, sell or provide any product or service described herein. So far as the law allows, neither ACFS, NAB nor its related bodies corporate or any of their officers, employees, agents, advisers or contractors warrants or represents that the information in this document is accurate, reliable, complete or contemporary. To the extent permitted by law, NAB shall not be liable for any loss or damage which may be suffered by any person relying upon this document or any Information (including by way of negligence or misrepresentation) arising from or in connection with information contained in this document.Disclaimer: The Information accurately reflects the personal views of the author(s) about the securities, issuers and other subject matters discussed, and is based upon sourcesreasonably believed to be reliable and accurate. The views of the author(s) are independent of the views of the NAB Group. No part of the compensation of the author(s) was,is, or will be, directly or indirectly, related to any specific recommendations or views expressed.
Leanne Gordon Head of Thought Leadership & Insights Corporate and Institutional Bank T: +61 2 9237 7295 E: [email protected]
About the Australian Centre for Financial StudiesThe Australian Centre for Financial Studies (ACFS) is a public interest research centre of Monash Business School. It was established as the Melbourne Centre for Financial Studies in 2005, with seed funding from the Victorian Government. Today, ACFS receives funding from Monash University, a range of project partners and affiliated universities, and through research partnerships such as the one with NAB which has led to this report.
The mission of ACFS is to build links between academics, practitioners and government in order to promote thought leadership in the financial sector.
National Australia BankContact
Steve Lambert Executive General Manager Capital Financing T: +61 2 9237 1150 E: [email protected]
nab.com.au
australiancentre.com.au
Contact
Professor Rodney Maddock Interim Executive Director Australian Centre for Financial Studies Level 46, Rialto South Tower, 525 Collins St, Melbourne VIC 3000 T: +61 3 9666 1050
©2017 National Australia Bank Limited ABN 12 004 044 937 AFSL and Australian Credit Licence 230686 A135316-0417