social recognition and investor overcon dence annual... · 2018-03-15 · social recognition and...
TRANSCRIPT

Social recognition and investor overcon�dence ∗
Bastian Breitmayer † Matthias Pelster ‡
January 9, 2018
Abstract We investigate the trading patterns of 21,694 investors who received social
recognition for their investment decisions between 2012 and 2015. We �nd that con�r-
matory social recognition leads to increased trading activity, which can be explained by
overcon�dence, biased self-attribution, and misinterpretation of observed feedback. On
average, investors execute 29 additional trades in the month after receiving con�rmatory
social recognition for the �rst time. We demonstrate that (i) social recognition in�uences
investor trading patterns and that (ii) under certain circumstances, the e�ect of social
recognition on trading activity is greater than that of �nancial outcomes. Our results
suggest that social interaction may not increase market e�ciency.
Keywords: social interaction; overcon�dence; investor behavior; trading activity; feed-
back
JEL Classi�cation: G11, G12.
∗Financial support by the Fritz Thyssen Stiftung (Grant number 20.16.0.018WW) is gratefully ac-knowledged. We thank Sonja Warkulat and Thang Quang Nquyen for outstanding research support.We are grateful for comments from Tim Hasso, Jürgen Deller, Michael Gielnik, Bruce Vanstone, TobiasHahn, and participants of the research seminars at Leuphana University in 2016 and Bond University in2017. Any errors, misrepresentations, and omissions are our own.†Leuphana University Lueneburg. Universitätsallee 1, 21335 Lueneburg, Germany. e-mail: breit-
[email protected].‡Paderborn University. Warburger Str. 100, 33098 Paderborn, Germany. e-mail:

Social recognition and investor overcon�dence
Abstract
We investigate the trading patterns of 21,694 investors who received social recognition
for their investment decisions between 2012 and 2015. We �nd that con�rmatory social
recognition leads to increased trading activity, which can be explained by overcon�dence,
biased self-attribution, and misinterpretation of observed feedback. On average, investors
execute 29 additional trades in the month after receiving con�rmatory social recognition
for the �rst time. We demonstrate that (i) social recognition in�uences investor trading
patterns and that (ii) under certain circumstances, the e�ect of social recognition on
trading activity is greater than that of �nancial outcomes. Our results suggest that
social interaction may not increase market e�ciency.
Keywords: social interaction; overcon�dence; investor behavior; trading activity; feed-
back

For most people, interaction with the social environment is a part of everyday life. Re-
searchers argue that social interaction in�uences people's health and behavior.1 People
tend to learn by observing the decisions and actions of other individuals (Banerjee, 1992;
Bikhchandani et al., 1998). In particular, people increasingly rely on the advice of their
social peers when making consumption decisions (see, e.g., Kim and Srivastava, 2007;
Chen and Xie, 2008; Mitton et al., 2017). Social interaction also a�ects people's behavior
on �nancial markets, such as encouraging them to participate in the stock market.2 For
instance, households' stock purchases are signi�cantly in�uenced by neighbors' purchases
of stocks and local peers' recent stock returns (Hong et al., 2004; Ivkovic and Weisben-
ner, 2007; Kaustia and Knüpfer, 2012). Similarly, Du�o and Saez (2002, 2003) report
that people's decision-making with respect to particular retirement plans is in�uenced
by the decisions of their colleagues, family, and friends. The trading decisions not only
of households but also of professional investors are in�uenced by recent communication
with peers (Shiller and Pound, 1989).3
Active trading and high trading activity are associated with investor overcon�dence
(Daniel et al., 1998; Barber and Odean, 2000, 2001). In fact, overcon�dence is among the
most common and well-known psychological phenomena a�ecting individuals' decision-
making and has been found to have implications for overall stock market returns (see, e.g.,
Hirshleifer, 2001; Statman et al., 2006). Being overcon�dent with respect to their abil-
ity to evaluate stock-price-related information compels investors to trade more actively
(Grinblatt and Keloharju, 2009) and in a more speculative manner, and as a consequence,
they tend to lose money (see, e.g., Barber and Odean, 2001; Choi et al., 2002). The over-
con�dence phenomenon is omnipresent but complex. For instance, age and gender are
signi�cant determinants of overcon�dence (see, e.g., Barber and Odean, 2001; Forbes,
1For instance, researchers have provided evidence of a causal relationship between social interaction andpeople's mental health (House et al., 1988). Additionally, studying social interrelations helps to explainlocal crime rates (Glaeser and Scheinkman, 1996; Case and Katz, 1991) and smoking behavior (Cutlerand Glaeser, 2007).
2Social interaction involves the transfer of information among investors and a�ects professional and retailinvestors' investment decisions. For empirical evidence on this topic, see, e.g., Shiller (1984, 2010a);Kelly and Gráda (2000); Massa and Simonov (2005); Brown et al. (2008); Cohen et al. (2007, 2010);Shive (2010); Georgarakos and Pasini (2011); Heimer (2014).
3Results con�rming this �nding are reported by Hong et al. (2005) and Crawford et al. (2017).
1

2005). Young men's behavior is particularly a�ected by this psychological bias. In ad-
dition, individuals' overcon�dence is not static but varies over time. In this context,
overcon�dence is closely related to investors' perceived feedback in response to previous
decisions and has been widely studied as a function of past returns.
In line with Heimer and Simon (2013) and Burks et al. (2013), we argue that overestimat-
ing one's own ability is a function not only of observed monetary outcomes but also of an
investor's social environment. Shiller (1984) notes that investing in speculative assets is a
social activity and argues that investors spend a substantial portion of their leisure time
discussing investments, reading about investments, or gossiping about others' success or
failures in investing. Therefore, �nancial outcomes are not the only factor to characterize
an investment decision's success: it is also determined by the feedback of one's peers who
endorse or disapprove of the decision. Speci�cally, we argue that the potential for and ex-
perience of social recognition not only motivates investors to share their trading strategies
(see also Han et al., 2017) but also changes their behavior in accordance with the response
of their social environment. In this paper, we study the impact of feedback, particularly
the impact of con�rmatory social feedback�social recognition�on investors' trading ac-
tivity. We aim to answer the question of whether social recognition a�ects individuals'
trading activity. We hypothesize that � especially in situations where market movements
provide ambiguous signals about the success of a trade � positive feedback from peers
regarding an investment decision will impact investors' future trading behavior.
People interact with their social environment in various circumstances (e.g., at work or
in sports clubs). A large portion of people's interactions with the social environment
occurs in online social networks such as Facebook�which has become a part of most
people's everyday lives.4 Similarly, �nancial market participants increasingly use online
brokerage services to manage their portfolios (see, e.g., Barber and Odean, 2002; Choi
et al., 2002).5 The increasing overlap between social media and �nancial markets has led
4In the last quarter of 2016, facebook.com recorded 231 million active users in North America (1.86 billionworldwide). Active users are de�ned as those who have logged in at least once within the last 30 days[www.statista.com].
5In 2016, 15.09 million U.S. citizens lived in households that used an online investing/stock tradingservice within the previous twelve months (a 7% increase compared to 2015) [www.statista.com].
2
to the emergence of new business models in recent years. Several online brokerage services
combine the services of an online brokerage with features of social networks and allow
individuals to manage their portfolios and exchange capital-market-related information.
In particular, these additional social network features enable investors to disclose and
discuss their investment decisions with their peers. We will label these kind of brokerage
services social trading platforms in the following. These social trading platforms enable
investors to share and obtain information and receive feedback on their trading decisions
in large networks and thus may reduce information asymmetry on �nancial markets.6
Researchers have provided three main explanations for why investors share information
with their social environment (see, e.g., Becker, 1974; Hong et al., 2004; Garcia, 2013;
Chen et al., 2014). First, word-of-mouth and observation of the actions of other traders
allow investors to learn from others, e.g., how to trade or evaluate information and to
participate in �nancial markets. Seen in this light, social interaction is likely to facilitate
the process of learning and gathering information, and investors may believe that they
make better investment decisions after talking to their peers. Second, people may enjoy
talking about market movements with their peers in the same way that they enjoy talking
about restaurants, sports, or other topics. Third, investors gain utility from the attention
and positive recognition they receive from their peers. In short, making money feels good,
but telling others about it and earning others' respect feels even better. The argument
that investors exchange information because they are motivated by the opportunity to
learn or to increase their utility through communication or recognition may also explain
why social interaction a�ects investor behavior.
By studying the trading behavior of investors who engage on a social trading platform,
this study examines whether and how social recognition a�ects investors' trading patterns.
We assess the magnitude of the in�uence of social recognition on investors' trading activity
relative to the in�uence of con�rmatory market feedback. Our results show that investors
who receive social recognition for the �rst time subsequently execute 29 additional trades
6Social trading platforms provide information that can be more accurate than assessments by professionalanalysts in some cases (Bagnoli et al., 1999; Clarkson et al., 2006; Doering et al., 2015). However, socialtrading platforms may not necessarily improve market e�ciency: Han and Yang (2013) argue that socialcommunication can result in endogenous information �ow.
3
per month on average and 29 more trades per month on average than investors who do
not receive positive feedback (recognition) from their peers. We �nd that positive market
feedback has a higher impact on investors' trading activity than does social recognition.
Our study shows that increased trading behavior can be observed to the same extent
for women and men, while young investors in particular seem to be less a�ected by
social recognition. Our robustness checks show that social recognition also a�ects the
trading activity of (i) the most successful investors, (ii) investors who use a buy-and-hold
strategy, (iii) investors who have traded online for a long time, and (iv) those who trade
frequently. Experiencing social and monetary con�rmation simultaneously is associated
with excessive levels of trading activity. However, in cases in which market feedback is
unclear, social recognition expressed as positive social feedback seems to play a greater
role in investors' future trading activity than monetary outcomes do.
We contribute to the existing literature on behavioral �nance by introducing social recog-
nition as a driver of investors' trading patterns and a factor that in�uences how individuals
behave in �nancial markets. In line with the theory of overcon�dence and biased self-
attribution, we show that after experiencing social recognition, investors tend to trade
more often than they did before. Given its association with lower returns (Barber and
Odean, 2000) and capital market overreactions (Daniel et al., 1998; Statman et al., 2006),
overcon�dence helps to illustrate individual investors' behavior and has implications for
market e�ciency. Therefore, we argue that social interaction may not contribute to
market e�ciency.
A growing strand of literature investigates the social dynamics on trading platforms and
reports implications for �nancial markets.7 For example, reporting signi�cant �ndings for
investor loss aversion, Liu et al. (2014) con�rms key propositions of prospect theory in
an online trading framework. In addition, Heimer (2016) reports evidence for the dispo-
sition e�ect. In particular, he �nds that traders' tendency to close winning trades while
7For instance, Antweiler and Frank (2004) report that comments on stock message boards (e.g., Yahoo!Finance or Ranging Bull) contain predictive power for stock market volatility. In line with these �ndings,Chen et al. (2014) argue that social communication captures investor sentiment, which has signi�cante�ects on stock prices. Wang et al. (2015) �nd evidence that online communication has predictivepower for stock returns. The authors show that online articles and comments by retail investors haveexplanatory power for stock returns.
4

simultaneously holding on to losing positions is twice as pronounced when individuals
are involved in social interactions (see also, e.g., Pelster and Hofmann, 2017). Moreover,
Ammann and Schaub (2016) show that investor communication within online networks
(e.g., comments on investment decisions) in�uences the investment decisions of other
traders. The frequency of communication, however, cannot be used to predict future
return outcomes. Park et al. (2013) consider how investors value information obtained
from their social environment and how this valuation a�ects their behavior and expecta-
tions. The authors report evidence that investors su�er from con�rmation bias and argue
that information that is in line with individuals' beliefs is valued more highly, whereas
information that is at odds with investors' opinions is mostly ignored. As a result, in-
vestors' beliefs are reinforced, and their certainty � especially with respect to investment
decisions � increases. In terms of outcomes, investors realize negative returns on average
and do not outperform a well-diversi�ed market portfolio when actively trading online
or sharing information with their peers (see, e.g., Barber and Odean, 2000, 2002; Barber
et al., 2006; Barber and Odean, 2009; Pan et al., 2012; Oehler et al., 2016).
Our paper proceeds as follows. In Section 1, we explain the relationship between social
recognition and overcon�dence. We provide information on our dataset in Section 2. The
results are presented in Section 3. We discuss our results and consider their implications
in Section 4. The �nal section concludes.
1 Social interaction and overcon�dence
Overcon�dence associated with biased self-attribution helps to explain stock market re-
turn patterns that re�ect irrational investor behavior (see, e.g., DeBondt and Thaler,
1985; Daniel et al., 1998; Thaler, 1999; Hirshleifer, 2001; Barberis and Thaler, 2003;
Statman, 2014; Thaler, 2016).8 The theoretical framework is based on two arguments.
First, investors tend to overestimate their ability to identify valuable information that
others miss. Second, investors are more likely to rely on self-generated information than
8DeLong et al. (1990) and Kyle and Wang (1997) provide evidence for the persistence of irrationalinvestor behavior and show that irrational investors may also earn positive risk premiums.
5

on public information (DeBondt and Thaler, 1995; Odean, 1998; Daniel et al., 1998; Hir-
shleifer, 2001). Investors overestimate their ability to predict stock prices, make trading
decisions based on personal assessments, and have favorable perceptions of their decisions.
Overcon�dence is even more pronounced for experts, and it increases with the degree of
task di�culty (Fischho� et al., 1977; Lichtenstein et al., 1982). The main side e�ect
of overcon�dence is increased trading activity, which has been introduced as a testable
measure of investor overcon�dence (Daniel et al., 1998; Gervais and Odean, 2001).9
In a multiperiod model, Gervais and Odean (2001) show that investors who are successful
and consequently become wealthier face the risk of becoming overcon�dent. This argu-
ment centers on the cognitive bias of self-attribution, which causes the misinterpretation
of new information (Bem, 1972; Rabin and Schrag, 1999). In experimental settings, psy-
chologists have found empirical evidence that con�dence is strongly in�uenced by the feed-
back that participants receive regarding their past decisions (Wells and Brad�eld, 1998)
and that individuals tend to credit themselves for past success while blaming external
factors for failure (Fischho� and MacGregor, 1982; DeLong et al., 1991).10 Speci�cally,
individuals tend to attribute observed feedback that con�rms the validity of their actions
to their high level of ability, but they attribute events that are not in line with their de-
cisions to external noise or sabotage. Consequently, in the case of biased self-attribution,
public feedback can lead to overreaction and cause investors to become overcon�dent.
In addition, people tend to make mistakes when they intuitively apply rules of statistics
and probability (Paul and Lichtenstein, 1971; Tversky and Kahnemann, 1971; Kahne-
mann and Tversky, 1972) and are therefore inconsistent in their decision-making and
judgment (Tversky and Kahnemann, 1981).11 Individuals' judgment is driven primarily
by the strength of supporting arguments for a certain hypothesis, but they exhibit poor
consideration of the credibility of the source of these arguments (Tversky and Kahne-
mann, 1974; Dawes and Kagan, 1988; Gri�n and Tversky, 1992). In particular, Gri�n
9Glaser and Weber (2007) show that overcon�dence is associated with higher trading activity.10In a more recent meta-analysis, Douglass and Steblay (2006) provide supporting evidence for therelationship between feedback and con�dence.
11Tversky and Kahnemann (1981) also show that this phenomenon cannot be eliminated with monetaryincentives.
6

and Tversky (1992) show that when they change their con�dence, individuals focus on the
strength of observed feedback regarding prior decisions and underestimate its credibility.
Strong feedback from an unreliable source is perceived as more valuable than weak feed-
back from a reliable source. As a result, an individual's level of con�dence is determined
by a trade-o� between supporting and non-supporting arguments, while only some ad-
justments are made in response to their perceived credibility.12 In the context of �nancial
markets, observed feedback that has the same sign con�rms a decision. As investors expe-
rience con�rmation of their past decisions, their con�dence increases; however, negative
feedback triggers only a moderate or no decrease in con�dence. The empirical �nance
literature has tested this hypothesis based on market returns. The results indicate that
individuals attribute investment decisions that result in positive returns to their own
abilities to accurately evaluate securities. Conversely, investors blame bad luck and other
external factors for trading losses.
We argue that social recognition has similar implications for investor overcon�dence.13
When investors interact with their peers (e.g., on trading �oors, in social networks, or
on the golf course) and discuss stock market developments, they also address past trades
and their outcomes. Heimer and Simon (2013) and Han et al. (2017) argue that investors
enjoy talking about success and thus are more likely to focus on pro�table trades than
on unpro�table trades. When sharing this type of information about past transactions,
other investors provide feedback regarding investors' past trading decisions. When eval-
uating the observed social recognition, investors can gauge this feedback based on their
peers' verbal or visual cues and sometimes even based on monetary stakes, e.g., when
another investor indicates that he or she might use this information for a future trans-
action. However, it is very di�cult to evaluate the credibility of the feedback provider.
Individuals will tend to attribute positive social feedback to their ability to accurately
evaluate securities. They may, however, also interpret discon�rming social feedback as
ignorance, a lack of knowledge, or jealousy on the part of the feedback provider. As
12Gri�n and Tversky (1992) show that people exhibit overcon�dence when the magnitude of feedbackis high but the validity of the source is low.
13Pirmoradi and McKelvie (2015) provide empirical evidence that people's level of con�dence can bein�uenced by social feedback.
7

investors receive con�rmatory social feedback regarding their past decisions, overcon�-
dence increases; however, dissenting feedback leads to only a moderate or no decrease in
overcon�dence.
We argue that social recognition expressed as positive feedback has a signi�cant e�ect on
the overcon�dence of capital market participants, leading them to increase their trading
activity. Speci�cally, the level of overcon�dence among investors increases and decreases
in response to the feedback from their social environment regarding their past investment
decisions. If investors receive social recognition, they tend to become overcon�dent and
will trade more actively. However, in the case of a negative social response, investors'
level of overcon�dence shows only a moderate or no decrease.
Drawing on this and other insights in the literature, we aim to test the following set of
hypotheses. We argue that (i) investors who receive social recognition trade more than
those who do not; (ii) investors increase their trading activity in response to con�rmatory
feedback from their social peers; (iii) simultaneously observing con�rmatory market and
social feedback is associated with an even greater increase in trading activity; (iv) the
e�ect of social recognition is robust to investors' level of success and trading strategy;
and (v) investors tend to follow the signals of the highest magnitude and those that, in
retrospect, con�rm their decisions.
2 The social trading platform and data
2.1 The social trading platform
Similar to market feedback, which can be measured by returns, we focus on social recogni-
tion that is directly related to investment decisions. To avoid inconsistencies with respect
to the perceived validity and magnitude of feedback, which a�ect how individuals value
this type of feedback, we rely on a quanti�ed measure of social recognition. Speci�cally,
we attribute con�rmatory social recognition to an investment decision if that investment
8

decision directly in�uences a transaction made by another investor. When traders in-
vest their own money in response to an investment decision of another trader and thus
place their own money at risk, they send a strong signal that con�rms other investors'
investment decisions. Thus, investors can interpret the triggered transaction as social
recognition.
We base our analysis on data obtained from a social trading platform.14 Similar to other
online trading brokerage websites, this trading platform allows investors to complete var-
ious capital market transactions. In addition to permitting traditional �nancial services,
a disclosure function allows investors to share and to keep track of capital market trans-
actions executed by other investors on the trading platform. This feature allows us to
analyze the implications of social recognition for investor trading behavior. Traders can
communicate about and follow others' transactions. Investors' performance in the previ-
ous year and on the last trading day and a follow function are provided at �rst glance. On
individual pro�le pages, traders are able to communicate with others by posting messages,
which can be highlighted, commented on, or shared by other traders.
Detailed information on each investor's trading activity can be obtained from four dif-
ferent sections. First, the statistics section provides a detailed overview of investors' his-
torical performance, risk-taking, social recognition, and trading activity. Other traders
can review past monthly and annual returns, the number of total trades executed, the
proportion of di�erent asset classes, and the percentage of pro�table outcomes. The
website also provides a historical risk level, which tracks an investor's leverage and the
volatility of his or her investments compared to the volatility of the markets in which
s/he trades. More important for this study, the statistics section also provides detailed
information on investors' received social recognition: people can review how many in-
vestors currently follow the transactions of a particular trader. The social chart shows
the historical development of followers over the past year, whereas the social trend indi-
cates the relative change in followers over the last seven days. Additional statistics, such
as the average trades per week or an investor's average holding period, are provided at
14The data provider asked to remain anonymous.
9

the bottom of the page. The portfolio section provides a detailed overview of the current
portfolio, including a list of the individual securities, their shares in the overall portfolio,
their performance, and their current bid and ask price. In the graph section, historical
performance is visualized in a time-dynamic chart.
To follow another trader, people can click a follow button at the top of each investor's
pro�le page. They can de�ne how much money they intend to invest when following
the positions and have the opportunity to set a stop-loss price. Thus, people decide to
follow the transactions made by other investors with their own money. Consequently,
people who copy an investment made by another trader entrust a proportion of their
wealth to the decisions of another investor. Therefore, we argue that people who copy
the transactions of others signal a high level of faith in and serious commitment to the
investors they follow. Since investors seek to earn money, we argue that following a
trader can be seen as a disclosed prediction that the investor can execute pro�table
trades in the future. This action may also be a signal for other investors to follow certain
traders. Moreover, investors who share their trades will receive information on how many
other traders have followed their investment decisions. By being aware of the �nancial
commitment of their followers, investors can interpret the number of traders who follow
them as the magnitude of their social recognition. Speci�cally, investors may attribute
a level of social recognition to their past trading activity. As the magnitude of social
recognition increases, traders' past investment decisions are more strongly con�rmed.
More importantly, investors observe a standardized indicator of social recognition and
are therefore able to compare their level of social recognition with that of other investors
or their own history. These data on individual investors allow us to study the implications
of social recognition for investor trading behavior.
2.2 Data
The focus of our analysis is the change in trading behavior after investors receive so-
cial recognition. Our dataset comprises 72,245 unique individuals who engaged in online
10

trading for at least �ve months during the period from January 2012 to October 2015.
Of these investors, 21,694 received social recognition at least once during that period and
executed 12.4 million trades. In total, our treatment group comprises 284,058 investor-
months. The collected data provide detailed information on all transactions and related
social recognition. On a monthly basis, we analyze investor-speci�c trades, realized re-
turns, the number of followers, portfolio diversi�cation, the holding period of positions,
the number of di�erent securities traded, the number of other investors followed, and the
use of leverage.15
- Place Table 1 about here -
We determine the average returns, number of executed trades, holding period, level of
diversi�cation, number of traders followed, and instruments used for each individual in-
vestor and di�erentiate between those investors who receive social recognition and those
who do not. Panel A of Table 1 reports basic summary statistics of the di�erent investor
groups in our dataset across �ve independent return groups. Overall, investors who re-
ceive social recognition trade more often than those who do not across all di�erent return
groups. The investors in the highest return quintiles exhibit the lowest trading activity in
their investor group on average (22.93 [10.46] trades executed by investors who [never] re-
ceived social recognition). These investors also exhibit the highest average holding period
in their investments. In line with the literature on online trading, investors lose money
on average as they trade online (see, e.g., Barber and Odean, 2002; Pan et al., 2012).
Only 22.06% of those investors who never receive social recognition earn positive overall
returns, whereas only 15.19% of all investors who receive social recognition gain money.
Moreover, investors who receive social recognition have lower average holding times for
15Trades are the number of executed trades in a particular month; return is the average return realizedin a month; follower represents the number of other investors who have followed investors' trades;portfolio diversi�cation is a dummy variable that equals one if no single open position exceeds 20%of an investor's overall capital and zero otherwise; holding position represents the average number ofhours that the investor keeps each position open; the number of instruments is the number of di�erentsecurities that the investor traded in a particular period; and leverage is a dummy variable that takesthe value of one if a trader has any leveraged position in his portfolio, and zero otherwise. Followingothers represents the number of other investors that a trader is currently following.
11

their trading positions, are more diversi�ed, and have more faith in other investors. We
provide a more detailed multivariate analysis in the following sections.
Panel B of Table 1 illustrates the distribution of investors in our sample across gender
and age. We report demographic information for the full sample and for investors who
receive social recognition and those who do not separately. We observe that our sample
contains more than �ve times more male investors than female investors. Moreover, the
table highlights that our sample contains a large number of young investors.
Based on the demographic information, we generate two dummy variables. In particular,
we generate a dummy variable Male taking the value of one if the investor is male and
zero otherwise and a dummy variable Young taking the value one if the investor is 34
years or younger and zero otherwise.
3 Social recognition and overcon�dence
Our analysis is divided into two parts. First, we study the change in the trading behavior
of investors who receive social recognition relative to that of investors who do not receive
social recognition. We employ a di�erence-in-di�erences approach for our analysis. Sec-
ond, we conduct a thorough analysis of the e�ects of social recognition on trading activity
for investors who experience con�rmatory social feedback. This step allows us to study
the implications of monetary and social feedback for investors' trading activity.
3.1 Does social recognition cause a change in trading behavior?
To investigate whether investors change their trading behavior in response to social recog-
nition of their investment decisions, we conduct a di�erence-in-di�erences analysis. Our
treatment group comprises all investors who receive social recognition about their in-
vestment decisions, while our control group comprises those investors who do not receive
social recognition. The treatment event, namely, the �rst time that at least one investor
follows the trading decision of another investor with his or her own money, can occur
12

at any point in time. We perform nearest-neighbor matching to match investors in the
treatment and control groups based on gender and age range and on criteria that con-
stitute similar trading activity, similar realized returns, similar position holding periods,
a similar number of instruments used, similar levels of leverage, and a similar number
of other investors followed as proxy for sociability prior the treatment event. We ex-
clude investors for which we cannot �nd a match in our data from the analysis. For our
main analysis, our matched sample consists of 19,777 investors from the treatment group
and 19,777 investors from the control group. We di�erentiate among di�erent treatment
e�ects and study their implications. The di�erent treatment e�ects are (i) the �rst in-
stance of social recognition, (ii) the second instance of social recognition, and (iii) the
�rst instance of social recognition combined with simultaneous positive market feedback.
For each treatment, we perform a separate matching. In our estimations, we control for
investors' past pro�tability, their holding periods, the number of instruments used, the
level of leverage, the degree of diversi�cation, and the number of other investors followed.
Additionally, we include dummy variables to identify male and young investors.
- Place Table 2 about here -
Table 2 reports the results of our di�erence-in-di�erences estimation. We observe positive
signi�cant average treatment e�ects (ATE) and average treatment e�ects on the treated
(ATET) in the month following the treatment event in all three cases. On average,
investors execute 29.05 more trades in the month after they receive social recognition for
the �rst time than do traders in the control group (Panel A, Model (1)). In Models (2)
and (3) of Panel A, we investigate the in�uence of gender and age on the in�uence of social
recognition on trading activity. In particular, in Model (2) we observe a similar treatment
e�ect for male and female investors. Male investors do not seem to be particularly
prone to changes in their trading behavior following social recognition. However, Model
(3) indicates that young investors seem to be less a�ected by social recognition. The
negative interaction term indicates that young investors increase their trading behavior
to a signi�cantly smaller extent than other investors do. To be speci�c, investors who
13

are 34 years or younger execute 25.08 more trades in the month after they receive social
recognition for the �rst time. Models (4) and (5) present ATE for our additional treatment
speci�cations.
Panel B of Table 2 reports simulated ATET. Investors increase their trading activity and
execute 29.05 more trades per month on average than they did before receiving social
recognition. Our results are robust to three di�erent treatment speci�cations. Investors
increase their trading activity after receiving (i) social recognition for the �rst time, (ii)
social recognition for the second time, and (iii) con�rmatory social and market feedback
simultaneously. Social recognition causes an increase in investors' trading activity.
3.2 Returns, social recognition, and overcon�dence
In the second part of our analysis, we apply additional sorting and panel data regressions
to investigate the relationship between received market and social feedback and trading
activity. For each investor, we identify the periods before and after receiving social
recognition for the �rst time. Moreover, we independently rank all periods by the realized
returns for each investor and assign them to �ve groups (low-return-months to high-
return-months).
- Place Table 3 about here -
Table 3 reports the results of a two-way sorting approach on the treatment event (pre-
and post-social recognition) and realized return-months. In line with our previous results,
investors complete, on average, more trades in months after experiencing social recogni-
tion. The highest increase in trading activity (9.03 to 10.96) is recorded for months when
investors realize slightly negative (Return-3) to slightly positive (Return-4) returns. In
these months, the observed market feedback is of low magnitude, and strong con�rmatory
social recognition seems to have a larger e�ect on investor trading activity. In months
when investors realize their worst outcomes, i.e., when market feedback is strongly neg-
ative, investors decrease their trading activity. We also observe that in months with low
14

return outcomes, investors increase their average position holding period in the post-
treatment month. This result con�rms results presented by Pelster and Hofmann (2017)
and Heimer (2016) concerning the disposition e�ect. Investors also tend to follow fewer
other investors after receiving social recognition.
Table 4 presents the pairwise correlation coe�cients between all variables of interest.
The correlation between follower, return, and executed trades is low. Unsurprisingly,
investors' position holding periods are negatively correlated with the use of leverage. In
addition, the number of di�erent securities held is positively correlated with following
other investors' investment decisions.
- Place Table 4 about here -
To further investigate the relationship between social recognition and investor trading
activity, we perform a set of panel data regressions on the sample of investors who receive
social recognition. We control for investor and time �xed e�ects and use robust standard
errors clustered at the investor level to control for heteroskedasticity and serial correlation.
Our dependent variable, the log number of trades executed by investor i in month t,
captures traders' individual trading activity. Our variable of interest is the magnitude of
social recognition (Follower), that is, the log of number of traders who followed investor i
in month t− 1. As the number of followers increases, the magnitude of social recognition
increases. We lag all independent variables by one period to capture behavioral patterns
after experiencing a change in social recognition to avoid potential endogeneity problems.
- Place Table 5 about here -
Table 5 reports the results of our main analysis. In Model (1), we observe a positive
and signi�cant coe�cient on Follower (0.198, p < 0.01). This result indicates that social
recognition is associated with an increase in investors' trading activity in the next pe-
riod and underlines the �ndings of our di�erence-in-di�erences analysis. Next, we control
for past trading performance (return), trading activity, average holding period, investor
15

sociability, and the type of portfolio (leveraged or diversi�ed). Model (2) presents the co-
e�cients for Follower and all the control variables we consider in our analysis. A positive
and signi�cant coe�cient on Follower (0.017, p < 0.01) con�rms the positive and signi�-
cant relationship between social recognition and trading activity in the following period.
In Model (3), we investigate the interaction between past performance and social recog-
nition. In particular, we aim to examine investors' behavior after observing simultaneous
market con�rmation (positive returns) and social recognition (an increasing number of
followers). The signi�cantly positive interaction coe�cient (71.45, p < 0.01) indicates
that investors increase their belief in their own trading abilities to an even greater extent
after simultaneously observing a high magnitude of social and market con�rmation.
In our next step, we examine the interaction e�ects of social and market feedback in
greater detail. In particular, we investigate controversial observed outcomes with respect
to market and social feedback. In Model (4), we replace investors' continuous past re-
turns with a pro�t dummy variable (Pro�table) that equals one if an investor's return
was positive and zero otherwise. We also replace continuous social con�rmation with a
dummy variable (Follower Decrease) that equals one if the trader experienced a decrease
in followers in this period and zero otherwise. Our analysis reveals a positive (negative)
and signi�cant relationship between the Pro�table (Follower Decrease) dummy variable
(0.230, p < 0.01; −0.132, p < 0.01) and trading activity. Investors tend to trade more
actively after making pro�table trades and less actively after losing social recognition. A
smaller but signi�cantly positive interaction coe�cient (0.081, p < 0.01) indicates that
market con�rmation has stronger e�ects on trading activity than do social responses but
that discon�rming social feedback attenuates the increase in trading activity.
To study the counterpart to the interaction, we replace investors' past mean return with a
loss dummy (Unpro�table) that equals one if a trader's past return was negative, and zero
otherwise, in Model (5). We measure social recognition as a dummy variable (Follower
Increase) that equals one if the trader experienced increasing followers in this period
and zero otherwise. Our regression results indicate a negative (positive) coe�cient for
the Unpro�table (Follower Increase) dummy (−0.234, p < 0.01; 0.037, p < 0.01). After
16

experiencing trading losses, investors tend to trade less, whereas an increase in social
recognition has a positive in�uence on investor trading activity. A signi�cantly negative
interaction coe�cient (−0.087, p < 0.01) indicates that investors value monetary over
social recognition. Investors who experience an increasing number of followers associated
with monetary losses tend to execute fewer trades in the following period.
3.3 Investors' trading characteristics and social recognition
Next, we investigate how investors with di�erent trading outcomes and trading strategies
respond to social recognition. The summary statistics presented in Table 1 indicate that
investors who realize positive overall returns exhibit the lowest trading activity in their
respective groups. Successful investors who trade less might not systematically change
their behavior after receiving social recognition. We conduct a subsample analysis with
only those investors who are successful traders. Speci�cally, we consider all investors who
realize positive overall returns. In addition, we examine those investors who, on average,
exhibit the longest holding period for their positions, i.e., the buy-and-hold investors in
our sample period. Moreover, we examine investors who have the longest history, i.e.,
at least 30 months of trading in our 46-month sample period. Finally, we examine those
investors who, on average, show the highest number of executed trades per month.
- Place Table 6 about here -
Our results presented in Table 6 show that the relationship between social recognition and
trading activity is robust to the various speci�cations. The results indicate that social
recognition is associated with increasing trading activity in the following month for (i)
successful investors, (ii) investors who pursue a buy-and-hold strategy, (iii) investors who
trade for a long time, and (iv) investors who tend to execute the most trades per month
on average. A positive and signi�cant coe�cient on Follower in all subsample regressions
con�rms our previous results and shows that social recognition is indeed associated with
increased trading activity in the future.
17

3.4 The magnitude of observed social recognition
Next, we apply an additional two-way sorting procedure to investigate the relationship
between observed return, social recognition, and trading activity. For each investor, we
independently rank all months with respect to realized returns and the magnitude of social
recognition. We allocate all months to �ve return groups (low-return-month to high-
return-month) and into three social recognition groups (weak, medium, and strong). This
approach results in 15 return-social recognition intersection months. We consider months
with relatively low realized returns and relatively weak social recognition compared with
months with high realized returns and strong social recognition.
- Place Table 7 & Table 8 about here -
Table 7 reports the results of our sorting procedure. One month after receiving strong
social recognition, investors exhibit increased trading activity. Except for the months
with the highest realized returns, investors' trading activity increases with higher observed
returns. On average, investors realize positive online trading returns in 40% of the months
in our sample period. Especially in periods with ambiguous market outcomes (Return
month-2 to Return month-4), social recognition is associated with an increase in trading
activity. This result holds in particular in months in which investors receive the strongest
social recognition. Table 8 provides more detailed information on the return distribution
across investors' 15 intersection months and shows that some investors realize just slightly
negative returns while some investors realize no positive returns in their worst and best
months. Finally, Table 7 provides additional information about the realized returns one
period after the sorting procedure. The results indicate a reversal pattern in individual
investor returns, which is in line with existing empirical studies on the implications of
investor overcon�dence (see, e.g., Barber and Odean, 2001; Choi et al., 2002; Grinblatt
and Keloharju, 2009). More precisely, investors who realized positive returns in period t
experience losses on average in the following period t+ 1.
18

3.5 Peer comparison and social recognition
Our investigation shows that investors change their trading activity depending on ob-
served social recognition over time. Within social communities, i.e., on social trading
platforms, investors can observe not only their own social recognition but also the re-
sponses that other individuals receive from the social community. In particular, investors
can monitor other investors' level of social recognition as the number of traders following
them. Individuals can not only keep track of their own level of social recognition but also
compare themselves with other peers. Consequently, the level of social recognition within
the social community might also a�ect how investors' con�dence is in�uenced by social
recognition. We conduct an additional sorting procedure to assess the e�ect of social
recognition in the cross-section of investors. Each month, we sort all investors based on
their number of followers and realized returns. We separate groups for investors with
top 10%, 20%, and 50% of social recognition at each point in time to investigate the
implications of absolute ranking within the social community. In addition, we investigate
how trading activity and realized returns change if an investor's position in the social
community changes compared to the previous period. In order to do so, we generate a
dummy variable that is equal to one if the investor switches to a group of higher social
recognition than in the previous month and zero otherwise. Furthermore, in each month,
we allocate investors into �ve return groups (low-return to high-return).
- Place Table 9 about here -
Table 9 provides the results of our two-way-period-based sorting. Our results indicate
that the absolute rank within the social community does not a�ect investors' trading
activity. However, if investors move into a higher social recognition group, i.e., from the
top 20% to the top 10% of investors, they increase their trading activity in the next
period on average. Interestingly, we observe these e�ects only for investors who are in
the top three return groups. On the other hand, even if investors signi�cantly improve
their position in the social community with respect to the recognition of their peers, when
combined with negative realized returns, they do not increase their trading activity.
19

4 Discussion and implications
The aim of our study is to answer the question of whether social recognition in�uences
investors' trading activity. Our results show that con�rmatory social feedback � social
recognition � causes investors to trade more actively. Speci�cally, our �ndings indicate
that investors incorporate feedback from their social environment when updating their
level of con�dence in their ability to accurately evaluate stock prices. Our results can be
explained by overcon�dence, biased self-attribution, and misinterpretation of observed
feedback.
Our study makes two important contributions to the literature on behavioral �nance.
First, we provide empirical evidence that suggests that social interaction may not increase
market e�ciency. Feedback provided by investors regarding a past trading decision of
another investor is unlikely to contain any relevant information for future stock prices.
This feedback should not have any e�ect on the future investment decisions of rational
investors. Consequently, increased trading activity caused by social recognition does not
contribute to stock price e�ciency.
Second, our results indicate that social recognition increases investor overcon�dence. This
increase can be explained by biased self-attribution and low attention devoted to the
credibility of the source of feedback. Changing behavior due to overcon�dence has been
identi�ed as a reason for the non-persistence of investor returns. Understanding the
in�uence of social recognition on overcon�dence will help researchers to understand why
investors overestimate their ability to accurately evaluate information and to predict
future stock prices and why they consequently lose money.
Additionally, our results suggest that online social recognition has a similar impact on
males and females and a lower impact on young individuals. This �nding contradicts
other studies on overcon�dence (see, e.g., Barber and Odean, 2001; Forbes, 2005) but
could be explained by the speci�c nature of interactions on social media. In particular,
the younger generation may be more accustomed to interactions on social media because
they have grown up in a society increasingly reliant on social media, and as a result,
20

they may be less a�ected by online social recognition. Nonetheless, in our study, the
younger generation proved to be signi�cantly a�ected by social recognition, executing 25
additional trades in the month after receiving social recognition for the �rst time.
Our results have implications for investors who interact with their social environment,
seek information from their peers, and receive social recognition. While being aware of
their behavioral biases, investors should be cautious when they share the outcomes of
their past trading decisions with their social environment because past trading activity
does not provide relevant information for future market prices. Utility gains due to so-
cial recognition should be considered carefully. Social recognition allows for conscious or
unconscious manipulation by peers. However, investors engage in social interactions to
seek information and learn from others and ultimately make better investment decisions.
Nevertheless, those investors should be aware of the signals that they send to their peers
once they begin to follow others' information or investment decisions. In other contexts,
such as yelp.com (e.g., for restaurants) or amazon.com (e.g., for books), social recom-
mendations seem to be a valid indicator of high-quality goods or services. Therefore,
people increasingly rely on the recommendations and evaluations of their peers and have
begun to apply peer advice systems to �nancial markets. Investors seek to identify other
investors who earn the highest pro�ts and share the most pro�table trades. Given the
assumption that investors who follow other traders' transactions still seek to earn pos-
itive returns, the possession many followers can be interpreted as an indicator of high
reputation and trading skill. In the context of �nancial markets, investors should be
cautious when they rely on traders who are recommended by their peers for two reasons.
First, traders who already observe a large magnitude of social recognition may act in
an overcon�dent manner. Second, following those investors' trading decisions is an ad-
ditional signal of social recognition. When traders receive social recognition for the �rst
time, the in�uence on their level of con�dence is even greater, which can cause changes
in investors' behavior and adversely a�ect trading performance. Social trading platforms
allow investors to receive feedback on their past trading decisions with the objective of
o�ering their clients more e�cient communication and participation in �nancial markets.
21

Due to social dynamics and individual cognitive biases, some of the decisions made by
investors may be even worse than they would have been without such a service.
There may also be other possible explanations for our results. First, individual investors
who rely on more than one brokerage service may not increase their trading activity but
instead shift a proportion of trades previously executed by other brokerage services to
social trading networks. Speci�cally, individual investors may not trade more but shift
between service providers. Another possible explanation relates to the fact that lead
traders receive monetary compensation if they manage others' capital. Similar to profes-
sional fund managers, investors receive compensation for their assets under management,
an incentive to increase the number of following investors and increase one's assets under
management. Investors could simply aim to maximize their followers and assets under
management instead of seeking pro�table investment decisions. However, our results
show that the actual trading outcome still has a greater in�uence on investors' trading
activity than social recognition. Observing adverse outcomes of investments is associated
with lower trading activity in the next period even though the trader simultaneously
receives social recognition. Finally, similar to Barber and Odean (2002), we may face the
risk of sample selection bias. Social trading platforms simplify the process of information
exchange and encourage trading activity. Consequently, social traders are more likely to
be overcon�dent.
5 Conclusion
This study has three important �ndings. First, observing social recognition increases
investors' trading activity. Second, positive monetary and social feedback is associated
with even greater trading activity in the future. Third, when market outcomes are un-
clear, social recognition has a greater e�ect on investors' trading activity. Our results
are robust to di�erent investor characteristics and trading outcomes. These �ndings are
consistent with the theory of overcon�dence and biased self-attribution. Investors will
attribute con�rmatory feedback from their peers to their high ability to predict stock
22

prices. In addition, people focus on the magnitude of signals and devote less attention to
the credibility of the source of information. Due this cognitive bias, information exchange
between social peers does not necessarily increase market e�ciency.
Social interaction has been identi�ed as a relevant factor of human behavior, and in-
creasing opportunities for information exchange are likely to increase the intensity of
social interactions, which has implications for human behavior. Online networks enable
researchers to study the behavioral patterns of individuals within social groups and to
shed light on the in�uence of social interaction on investor behavior. We study the con-
sequences of social recognition as part of the interaction within peer groups and thereby
contribute to the literature on behavioral �nance and investor behavior.
However, there is room for further research to better understand the relationship be-
tween social interrelations and human behavior in �nancial markets. It remains unclear
whether social dynamics have implications for overall market prices (see Pelster, 2017,
for a discussion). Further research may also investigate how social interaction in�uences
emotions and trust between investors and how this may play a role in decision-making
related to �nancial markets.
References
Ammann, M. and N. Schaub (2016): �Social Interaction and Investing: Evidence froman Online Social Trading Network,� Working Paper.
Antweiler, W. and M. Z. Frank (2004): �Is All That Talk Just Noise? The Infor-mation Content of Internet Stock Message Boards,� Journal of Finance, 59, 1259�1294.
Bagnoli, M., M. D. Beneish, and S. G. Watts (1999): �Whisper forecasts of quar-terly earnings per share,� Journal of Accounting and Economics, 28, 27�50.
Banerjee, A. V. (1992): �A Simple Model of Herd Behavior,� The Quarterly Journal
of Economics, 107, 797�817.
Barber, B. M., Y.-T. Lee, Y.-J. Liu, and T. Odean (2006): �Just How Much DoIndividual Investors Lose by Trading,� Review of Financial Studies, 22, 609�632.
Barber, B. M. and T. Odean (2000): �Trading Is Hazardous to Your Wealth: TheCommon Stock Investment Performance of Individual Investors,� Journal of Finance,55, 773�806.
23
��� (2001): �Boys Will be Boys: Gender, Overcon�dence, and Common Stock Invest-ment,� The Quarterly Journal of Economics,, 116, 261�292.
��� (2002): �Online Investors: Do the Slow Die First?� Review of Financial Studies,15, 455�487.
��� (2009): �Too many cooks spoil the pro�ts: The performance of investment clubs,�Financial Analyst Journal, 56, 17�25.
Barberis, N. and R. H. Thaler (2003): �A Survey of Behavioral Finance,� Handbookof the Economics of Finance, 1, 1053�1128.
Becker, G. S. (1974): �A Theory of Social Interactions,� The Journal of Political
Economy, 82, 1063�1093.
Bem, D. J. (1972): �Self-Perception Theory,� Advances in Experimental Social Psychol-
ogy, 6, 1�62.
Bikhchandani, S., D. Hirshleifer, and I. Welch (1998): �Learning from the Be-havior of Others: Conformity, Fads, and Informational Cascades,� The Journal of
Economic Perspectives, 12, 151�170.
Brown, J., Z. Ivkovic, P. Smith, and S. Weisbenner (2008): �Neighbors Matter:Causal Community E�ects and Stock Market Participation,� The Journal of Finance,63, 1509�1531.
Burks, S., J. P. Carpenter, L. Goette, and A. Rustichini (2013): �Overcon�-dence and Social Signalling,� The Review of Economic Studies, 80, 949�983.
Case, A. and L. Katz (1991): �The company you keep: The e�ect of family andneighborhood on disadvantaged youths,� NBER Working Paper, 3705.
Chen, H., P. De, Y. J. Hu, and B.-H. Hwang (2014): �Wisdom of Crowds: The Valueof Stock Opinions Transmitted Through Social Media,� Review of Financial Studies,27, 1367�1403.
Chen, Y. and J. Xie (2008): �Online consumer review: Word-of-mouth as a newelement of marketing communication mix,� Management Science, 54, 477�91.
Choi, J. J., D. Laibsona, and A. Metrick (2002): �How does the Internet a�ecttrading? Evidence from investor behavior in 401(k) plans,� Journal of Financial Eco-nomics, 64, 397�421.
Clarkson, P. M., D. Joyce, and I. Tutticci (2006): �Market reaction to takeoverrumour in Internet Discussion Sites,� Accounting and Finance, 46, 31�52.
Cohen, L., A. Frazzini, and C. Malloy (2007): �The small world of investing: Boardconnections and mutual fund returns,� Journal of Political Econom, 116, 951�979.
��� (2010): �Sell-Side School Ties,� The Journal of Finance, 65, 1409�1437.
Crawford, S. S., W. R. Gray, and A. E. Kern (2017): �Why Do Fund ManagersIdentify and Share Pro�table Ideas?� Journal of Financial and Quantittive Analysis,52, 1903�1926.
24

Cutler, D. M. and E. L. Glaeser (2007): �Social Interaction and Smoking,� NBERWorking Paper, 13477.
Daniel, K., D. Hirshleifer, and A. Subrahmanyam (1998): �Investor Psychologyand Security Market Under and Overreactions,� The Journal of Finance, 53, 1839�1885.
Dawes, R. M. and J. Kagan (1988): Rational choice in an uncertain world, HarcourtBrace Jovanovich.
DeBondt, W. F. M. and R. H. Thaler (1985): �Does the Stock Market Overreact,�The Journal of Finance, 793�805.
��� (1995): �Financial Decision-Making in Markets and Firms: A Behavioral Perspec-tive,� Handbooks in operations research and management science, 9, 385�410.
DeLong, J. B., A. Shleifer, L. H. Summers, and R. J. Waldmann (1990): �NoiseTrader Risk in Financial Markets,� Journal of Political Economy, 98, 703�738.
DeLong, J. B., A. Shleifer, L. H. Summers, and R. J. Wladmann (1991): �TheSurvival of Noise Traders in Financial Markets,� The Journal of Business, 64, 1�19.
Doering, P., S. Neumann, and S. Paul (2015): �A Primer on Social Trading Net-works - Institutional Aspects and Empirical Evidence,� Working Paper.
Douglass, A. B. and N. Steblay (2006): �Memory Distortion in Eyewitnesses: AMeta-Analysis of the Post-identi�cation Feedback E�ect,� Applied Cognitive Psychol-
ogy, 20, 859 � 869.
Duflo, E. and E. Saez (2002): �Participation and investment decisions in a retirementplan: the in�uence of colleagues' choices,� Journal of Public Economics, 85, 121�148.
��� (2003): �The role of information and social interactions in retirement plan deci-sions: Evidence from a randomized experiment.� Quarterly Journal of Economics, 118,815�842.
Fischhoff, B. and D. MacGregor (1982): �Subjective con�dence in forecasts,� Jour-nal of Forecasting, 1, 155�172.
Fischhoff, B., P. Slovic, and S. Lichtenstein (1977): �Knowing with Certainty:The Appropriateness of Extreme Con�dence,� Journal of Experimental Psychology, 3,552�564.
Forbes, D. P. (2005): �Are some entrepreneurs more overcon�dent than others?� Jour-
nal of Business Venturing, 20, 623�640.
Garcia, M. J. R. (2013): �Financial Education and Behavioral Finance: New Insightsinto the Role of Information in Financial Decision,� Journal of Economic Surveys, 27,297�315.
Georgarakos, D. and G. Pasini (2011): �Trust, sociability and stock market partic-ipation,� Review of Finance, 15, 693�725.
25

Gervais, S. and T. Odean (2001): �Learning to Be Overcon�dent,� The Review of
Financial Studies, 14, 1�27.
Glaeser, E. L. and B. S. J. Scheinkman (1996): �Crime and social interactions,�The Quarterly Journal of Economics, 111, 507�548.
Glaser, M. and M. Weber (2007): �Overcon�dence and trading volume,� Geneva
Risk Insur Rev, 32, 1�36.
Griffin, D. and A. Tversky (1992): �The Weight of Evidence and the Determinantsof Con�dence,� Cognitive Psychology, 24, 411�435.
Grinblatt, M. and M. Keloharju (2009): �Sensation Seeking, Overcon�dence, andTrading Activity,� The Journal of Finance, 64, 549�578.
Han, B., D. Hirshleifer, and J. Walden (2017): �Social Transmission Bias andInvestor Behavior,� Working Paper.
Han, B. and L. Yang (2013): �Social Networks, Information Acquisition, and AssetPrices,� Management Science, 59, 1444�1457.
Heimer, R. Z. (2014): �Friends do let friends buy stocks actively,� Journal of EconomicBehavior and Organization, 107, 527�540.
��� (2016): �Peer Pressure: Social interaction and the Disposition E�ect,� The Reviewof Financial Studies, 29, 3177�3209.
Heimer, R. Z. and D. Simon (2013): �Facebook Finance: How Social InteractionPropagates Active Investing,� AFA 2013 San Diego Meetings Paper.
Hirshleifer, D. (2001): �Investor Psychology and Asset Pricing,� The Journal of Fi-
nance, 56, 1533�1597.
Hong, H., J. D. Kubik, and J. C. Stein (2004): �Social Interaction and Stock-MarketParticipation,� Journal of Finance, 59, 137�163.
��� (2005): �Thy neighbor's portfolio: Word-of-mouth e�ects in the holdings andtrades of money manager,� The Journal of Finance, 6, 2801�2824.
House, J. S., K. R. Landis, and D. Umberson (1988): �Social Relationships andHealth,� Science, 241, 540�545.
Ivkovic, Z. and S. Weisbenner (2007): �Information Di�usion E�ects in IndividualInvestors' Common Stock Purchases: Covet Thy Neighbors' Investment Choices,� TheReview of Financial Studies, 20, 1327�1357.
Kahnemann, D. and A. Tversky (1972): �Subjective probability: A judgment ofrepresentativeness,� Cognitive Psychology, 3, 430�454.
Kaustia, M. and S. Knüpfer (2012): �Peer performance and stock market entry,�Journal of Financial Economics, 104, 321�338.
Kelly, M. and C. Ó. Gráda (2000): �Market Contagion: Evidence from the Panicsof 1854 and 1857,� The American Economic Review, 90, 1110�1124.
26

Kim, Y. A. and J. Srivastava (2007): �Impact of social in�uence in e-commerce deci-sion making,� ICEC '07 Proceedings of the ninth international conference on Electronic
commerce, 293�302.
Kyle, A. S. and F. A. Wang (1997): �Speculation Duopoly with Agreement to Dis-agree: Can Overcon�dence Survive the Market Test?� The Journal of Finance, 52,2073�2090.
Lichtenstein, S., B. Fischhoff, and L. D. Phillips (1982): �Calibration of prob-abilities: The state of the art to 1980. D. Kahneman, P. Slovic, and A. Tverski (Eds.)Judgement under uncertainty: Heuristics and biases,� New York, Cambridge University
Press.
Liu, Y.-Y., J. C. Nacher, T. Ochiai, M. Martino, and Y. Altshuler (2014):�Prospect Theory for Online Financial Trading,� PloS one, 9.
Massa, M. and A. Simonov (2005): �History vs. Geography: The role of collegeinteraction in portfolio choice,� CEPR Discussion Paper, 4815.
Mitton, T., K. Vorkink, and I. Wright (2017): �Neighborhood E�ects on Specu-lative Behavior,� Working Paper.
Odean, T. (1998): �Volume, Volatility, Price, and Pro�t When All Traders Are AboveAverage,� The Journal of Finance, 53, 1887�1934.
Oehler, A., M. Horn, and S. Wendt (2016): �Bene�ts from social trading? Empir-ical evidence for certi�cates on wikifolios,� International Review of Financial Analysis,46, 202�210.
Pan, W., Y. Altshuler, and A. S. Pentland (2012): �Decoding Social In�uence andthe Wisdom of the Crowd in Financial Trading Network,� International Conference onPrivacy, Security, Risk and Trust and International Conference on Social Computing,
Institute of Electrical and Electronics Engineers, 203�209.
Park, J., P. Konana, B. Gu, A. Kumar, and R. Raghunathan (2013): �Informa-tion Valuation and Con�rmation Bias in Virtual Communities: Evidence from StockMessage Boards,� Information Systems Research, 24, 1050�1067.
Paul, P. S. and S. Lichtenstein (1971): �Comparison of Bayesian and regression ap-proaches to the study of information processing in judgment,� Organizational behaviorand human performance, 6, 649�744.
Pelster, M. (2017): �I'll Have What S/he's Having: A Case Study of a Social TradingNetwork,� Proceedings of the International Conference on Information Systems.
Pelster, M. and A. Hofmann (2017): �About the Fear of Reputational Loss: SocialTrading and the Disposition E�ect,� Working Paper.
Pirmoradi, M. and S. McKelvie (2015): �Feedback, Con�dence, and False Recall inthe DRMRS Procedure,� Current Psychology, 34, 248�267.
Rabin, M. and J. L. Schrag (1999): �First Impressions Matter: A Model of Con�r-matory Bias,� The Quarterly Journal of Economics, 114, 37�82.
27

Shiller, R. J. (1984): �Stock Prices and Social Dynamics,� Brookings Papers on Eco-
nomic Activity, 2, 457�510.
��� (2010a): �Conversation, information, and herd behavior,� American Economic
Review, 85, 181�185.
Shiller, R. J. and J. Pound (1989): �Survey evidence on di�usion of interest andinformation among investors,� Journal of Economic Behavior and Organization, 12,47�66.
Shive, S. (2010): �An Epidemic Model of Investor Behavior,� Journal of Financial andQuantitative Analysis, 45, 169�198.
Statman, M. (2014): �Behavioral �nance: Finance with normal people,� Borsa IstanbulReview, 14, 65�73.
Statman, M., S. Thorley, and K. Vorkink (2006): �Investor Overcon�dence andTrading Volume,� The Review of Financial Studies, 1, 1531�1565.
Thaler, R. H. (1999): �The End of Behavioral Finance,� Financial Analysts Journal,55, 12�17.
��� (2016): �Behavioral Economics: Past, Present, and Future,� American Economic
Review, 106, 1577�1600.
Tversky, A. and D. Kahnemann (1971): �Belief in the law of small numbers,� Psy-chological bulletin, 76, 105�110.
��� (1974): �Judgment under uncertainty: Heuristics and biases,� Science, 185, 1124�1131.
��� (1981): �The Framing of Decisions and the Psychology of Choice,� Science, 211,453�458.
Wang, G., T. Wang, B. Wang, D. Sambasivan, Z. Z. H. Zheng, and B. Y.Zhao (2015): �Crowds on Wall Street: Extracting Value from Collaborative InvestingPlatforms,� CSCW 2015, March 14-18, 2015, Vancouver, BC, 17 � 30.
Wells, G. L. and A. L. Bradfield (1998): �"Good, You Identi�ed the Suspect�:Feedback to Eyewitnesses Distorts Their Reports of the Witnessing Experience,� Jour-nal of Applied Psychology, 83, 360�376.
28

Summary: Social recognition vs. No social recognition
Follower No Yes No Yes No Yes No Yes
Investors Trades Return Holding
All 50,551 21,694 20.17 36.79 -.000274 -.000216 288.30 161.58Low-Return 10,975 3,474 19.05 34.57 -.001186 -.001037 156.48 94.45Return-2 10,022 4,427 24.96 42.29 -.000318 -.000314 189.55 113.63Return-3 9,637 4,812 26.11 43.83 -.000095 -.000093 220.89 134.01Return-4 8,764 5,685 21.94 35.94 -.000000 -.000000 226.73 184.50High-Return 11,153 3,296 10.46 22.93 .000298 .000239 613.40 297.45
Diversi�cation Following Others No. Securities Leverage
All .32 .44 34.29 70.85 5.72 7.11 .8702 .9719Low-Return .13 .17 15.10 35.01 4.67 5.80 .9540 .9847Return-2 .24 .29 23.99 48.58 5.73 6.77 .9321 .9834Return-3 .39 .45 37.62 68.70 6.55 7.53 .9147 .9834Return-4 .66 .74 86.72 125.37 8.11 8.52 .9299 .9809High-Return .25 .42 18.36 47.61 4.17 5.89 .6467 .9104
Table 1: Panel A: Summary statistics based on two-way sorting on social recognition andreturn
Gender AgeFemale Male Missing 18-24 25-34 35-44 45-54 55-64 Other Missing
Total 11,419 59,825 1,001 4,019 28,012 21,341 10,140 4,624 2,361 1,748
Follower: Yes 3,817 17,613 264 734 7,814 6,826 3,413 1,672 728 507Follower: No 7,602 42,212 737 3,285 20,198 14,515 6,727 2,952 1,633 1,241
Table 1: Panel B: Summary statistics of demographic information
This table reports summary statistics for our data. Panel A reports summary statistics across di�erentinvestor and return groups. We calculate the average of executed trades, realized returns, positionholding period, level of diversi�cation, number of investors they follow, the di�erent instruments theyinvest in, and the level of leverage for each individual. We di�erentiate investors who receive (Follower:Yes) or do not receive (Follower: No) social recognition at any point in time. We sort investorsindependently into �ve groups based on their overall monthly average return. We require investors totrade online at for least �ve months over our sample period. Panel B reports an overview of the genderand age distribution of investors in our data. We report the summary statistics for the entire sample andfor investors that receive (Follower: Yes) or do not receive (Follower: No) social recognition separately.
29

Model (1) Model (2) Model (3) Model (4) Model (5)
First-time follower 29.05 29.80 31.86(0.53) (1.22) (0.69)
Male 2.05 2.51 2.06 2.51 2.60(0.68) (0.95) (0.68) (1.02) (0.78)
Young −11.01 −11.01 −7.62 −14.53 −10.26(0.53) (0.53) (0.75) (0.83) (0.62)
First-time follower × Male −0.91(1.35)
First-time follower × Young −6.78(1.06)
Second-time follower 25.14(0.80)
First-time follower and positive return 25.04(0.62)
Controls Yes Yes Yes Yes Yes
Adj. R2 0.20 0.20 0.20 0.19 0.17Observations 39,554 39,554 39,554 19,866 24,124RMSE 52.08 52.08 52.05 56.32 47.53
Table 2: Panel A: Estimation of treatment e�ects
Average treatment e�ect on the treated
Coe�cient SE Observations
First-time follower 29.05 .3704 39,554Second-time follower 25.15 .5646 19,866First-time follower and positive return 25.04 .4378 24,124
Table 2: Panel B: Average treatment e�ect on the treated
This table reports the results of the di�erence-in-di�erences estimation. We report the coe�cientsof average treatment e�ects (ATE) in Panel A and simulated average treatment e�ects on the treated(ATET) in Panel B together with the associated standard errors. The treatment group initially comprisesall investors who receive social recognition about their investment decisions (for the �rst time). Thecontrol group comprises investors who do not receive social recognition. Investors in the treatmentand control groups are matched with a nearest neighbor matching routine based on their gender, agerange, past trading activity, realized returns, position holding periods, number of instruments used, levelsof leverage, and a similar number of other investors followed prior to the treatment event. We excludeinvestors without a match from our analysis. Reported treatment e�ects are (i) the �rst instance of socialrecognition, (ii) the second instance of social recognition, and (iii) the �rst instance of social recognitioncombined with simultaneous positive market feedback. Male denotes a dummy variable taking the valueone if the investor is male and zero otherwise. Young denotes a dummy variable taking the value one ifthe investor is 34 years or younger and zero otherwise.
30

Summary: Pre and post treatment
Follower Pre Post Pre Post Pre Post
Trades Return Holding
Low Return-month 27.04 22.84 -.00073 -.00091 183.62 214.15Return month-2 34.95 38.43 -.00018 -.00026 157.94 154.53Return month-3 37.47 46.50 -.00005 -.00007 132.35 129.60Return month-4 36.22 47.18 .00002 .00001 136.50 127.59High Return month 32.68 36.18 .00022 .00021 166.68 142.57
Diversi�cation No. Securities Leverage
Low Return-month 0.38 0.46 6.32 5.00 0.978 0.992Return month-2 0.53 0.57 8.65 7.38 0.978 0.993Return month-3 0.62 0.64 9.47 8.41 0.981 0.992Return month-4 0.61 0.65 8.97 7.96 0.972 0.990High Return month 0.46 0.53 7.15 6.20 0.954 0.985
Table 3: Summary statistics based on two-way sorting on returns and pre/post-treatmentperiods
This table reports summary statistics for investors prior to and after experiencing social recognition(Follower). For each investor, all periods are ranked independently with respect to realized returns. Weallocate all periods into �ve groups (low-return-month to high-return-month). We then di�erentiatebetween the month before and the month after investors receive social recognition for the �rst time.
31

Variables Follower Return Trades Divers. Holding Leverage Following
Return 0.0287(0.000)
Trades 0.0609 0.0769(0.000) (0.001)
Diversi�cation 0.0737 0.1811 -0.1311(0.000) (0.000) (0.000)
Holding 0.0285 0.0515 -0.1660 0.1566(0.000) (0.000) (0.000) (0.000)
Leverage 0.0052 -0.0651 0.0802 0.0721 -0.4380(0.000) (0.000) (0.000) (0.000) (0.000)
Following Others -0.0228 0.0820 0.0832 0.2223 -0.0479 0.0620(0.000) (0.014) (0.000) (0.000) (0.000) (0.000)
No. Securities -0.0137 0.1558 0.3351 0.1051 -0.0951 0.1119 0.561(0.000) (0.000) (0.000) (0.000) (0.000) (0.011) (0.000)
Table 4: Correlations between selected variables
This table reports the pairwise correlations between selected variables. p-values are shown in parentheses.In total, our sample covers 284,058 investor-months of trading information from January 2012 to October2015.
32
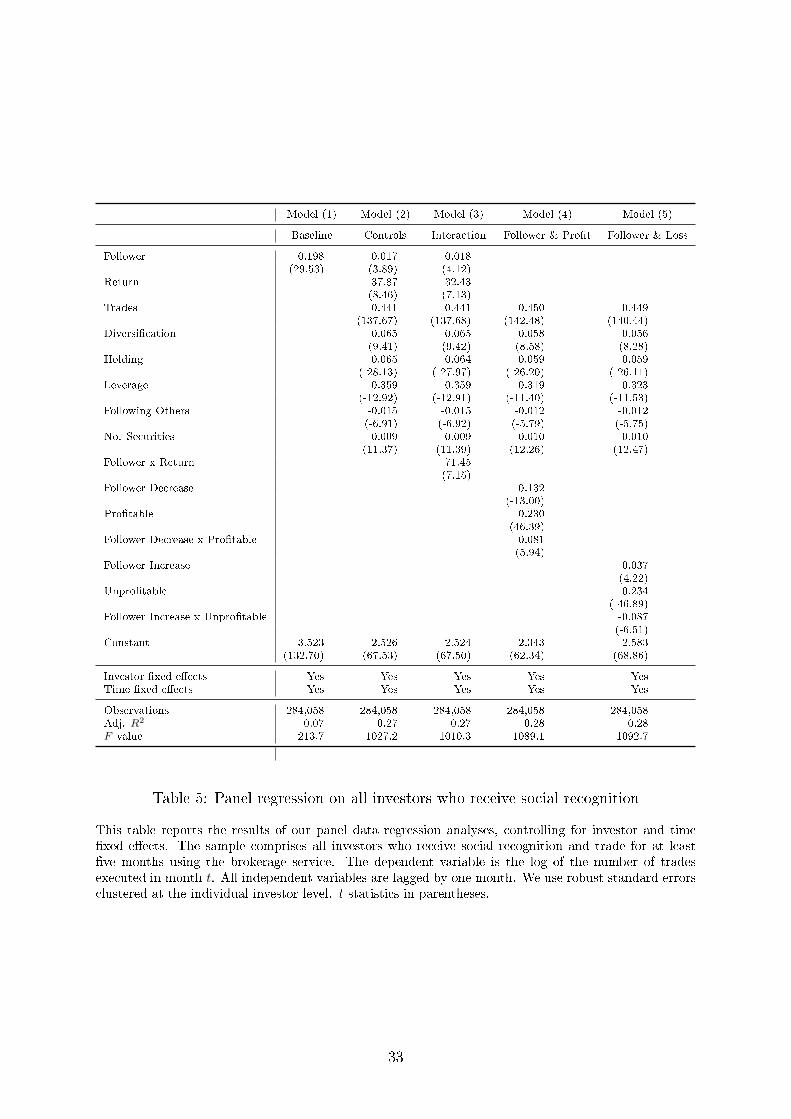
Model (1) Model (2) Model (3) Model (4) Model (5)
Baseline Controls Interaction Follower & Pro�t Follower & Loss
Follower 0.198 0.017 0.018(29.53) (3.89) (4.12)
Return 37.87 32.43(8.46) (7.13)
Trades 0.441 0.441 0.450 0.449(137.67) (137.68) (142.48) (140.44)
Diversi�cation 0.065 0.065 0.058 0.056(9.41) (9.42) (8.58) (8.28)
Holding -0.065 -0.064 -0.059 -0.059(-28.13) (-27.97) (-26.20) (-26.11)
Leverage -0.359 -0.359 -0.319 -0.323(-12.92) (-12.91) (-11.40) (-11.53)
Following Others -0.015 -0.015 -0.012 -0.012(-6.91) (-6.92) (-5.79) (-5.75)
No. Securities 0.009 0.009 0.010 0.010(11.37) (11.39) (12.26) (12.47)
Follower x Return 71.45(7.15)
Follower Decrease -0.132(-13.00)
Pro�table 0.230(46.39)
Follower Decrease x Pro�table 0.081(5.94)
Follower Increase 0.037(4.22)
Unpro�table -0.234(-46.89)
Follower Increase x Unpro�table -0.087(-6.51)
Constant 3.523 2.526 2.524 2.343 2.583(132.70) (67.53) (67.50) (62.34) (68.86)
Investor �xed e�ects Yes Yes Yes Yes YesTime �xed e�ects Yes Yes Yes Yes Yes
Observations 284,058 284,058 284,058 284,058 284,058Adj. R2 0.07 0.27 0.27 0.28 0.28F -value 213.7 1027.2 1010.3 1089.1 1092.7
Table 5: Panel regression on all investors who receive social recognition
This table reports the results of our panel data regression analyses, controlling for investor and time�xed e�ects. The sample comprises all investors who receive social recognition and trade for at least�ve months using the brokerage service. The dependent variable is the log of the number of tradesexecuted in month t. All independent variables are lagged by one month. We use robust standard errorsclustered at the individual investor level. t statistics in parentheses.
33
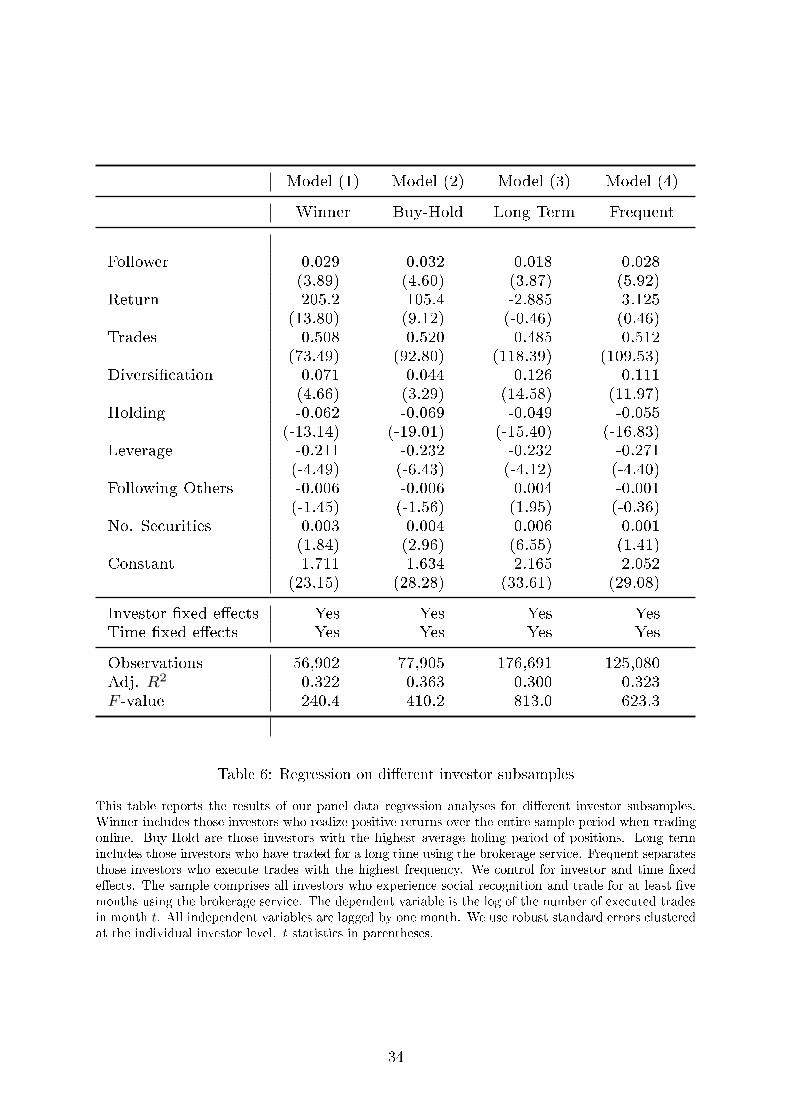
Model (1) Model (2) Model (3) Model (4)
Winner Buy-Hold Long Term Frequent
Follower 0.029 0.032 0.018 0.028(3.89) (4.60) (3.87) (5.92)
Return 205.2 105.4 -2.885 3.125(13.80) (9.12) (-0.46) (0.46)
Trades 0.508 0.520 0.485 0.512(73.49) (92.80) (118.39) (109.53)
Diversi�cation 0.071 0.044 0.126 0.111(4.66) (3.29) (14.58) (11.97)
Holding -0.062 -0.069 -0.049 -0.055(-13.14) (-19.01) (-15.40) (-16.83)
Leverage -0.211 -0.232 -0.232 -0.271(-4.49) (-6.43) (-4.12) (-4.40)
Following Others -0.006 -0.006 0.004 -0.001(-1.45) (-1.56) (1.95) (-0.36)
No. Securities 0.003 0.004 0.006 0.001(1.84) (2.96) (6.55) (1.41)
Constant 1.711 1.634 2.165 2.052(23.15) (28.28) (33.61) (29.08)
Investor �xed e�ects Yes Yes Yes YesTime �xed e�ects Yes Yes Yes Yes
Observations 56,902 77,905 176,691 125,080Adj. R2 0.322 0.363 0.300 0.323F -value 240.4 410.2 813.0 623.3
Table 6: Regression on di�erent investor subsamples
This table reports the results of our panel data regression analyses for di�erent investor subsamples.Winner includes those investors who realize positive returns over the entire sample period when tradingonline. Buy-Hold are those investors with the highest average holing period of positions. Long termincludes those investors who have traded for a long time using the brokerage service. Frequent separatesthose investors who execute trades with the highest frequency. We control for investor and time �xede�ects. The sample comprises all investors who experience social recognition and trade for at least �vemonths using the brokerage service. The dependent variable is the log of the number of executed tradesin month t. All independent variables are lagged by one month. We use robust standard errors clusteredat the individual investor level. t statistics in parentheses.
34
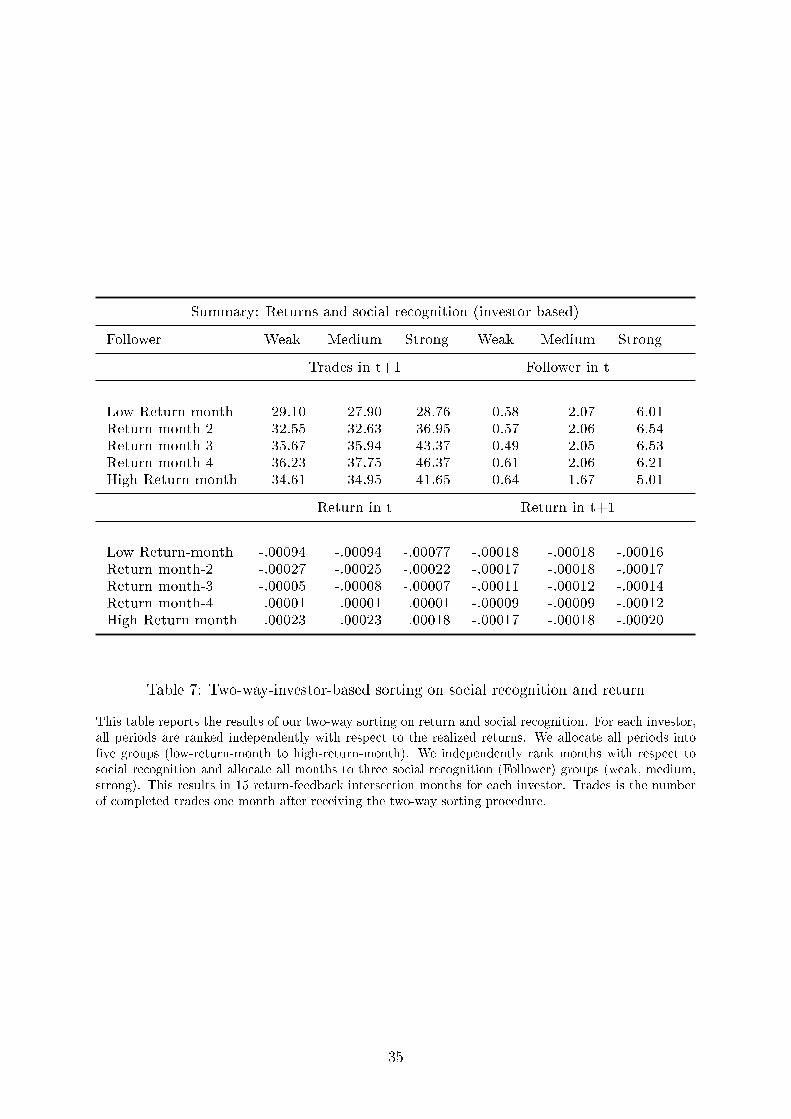
Summary: Returns and social recognition (investor based)
Follower Weak Medium Strong Weak Medium Strong
Trades in t+1 Follower in t
Low Return-month 29.10 27.90 28.76 0.58 2.07 6.01Return month-2 32.55 32.63 36.95 0.57 2.06 6.54Return month-3 35.67 35.94 43.37 0.49 2.05 6.53Return month-4 36.23 37.75 46.37 0.61 2.06 6.21High Return month 34.61 34.95 41.65 0.64 1.67 5.01
Return in t Return in t+1
Low Return-month -.00094 -.00094 -.00077 -.00018 -.00018 -.00016Return month-2 -.00027 -.00025 -.00022 -.00017 -.00018 -.00017Return month-3 -.00005 -.00008 -.00007 -.00011 -.00012 -.00014Return month-4 .00001 .00001 .00001 -.00009 -.00009 -.00012High Return month .00023 .00023 .00018 -.00017 -.00018 -.00020
Table 7: Two-way-investor-based sorting on social recognition and return
This table reports the results of our two-way sorting on return and social recognition. For each investor,all periods are ranked independently with respect to the realized returns. We allocate all periods into�ve groups (low-return-month to high-return-month). We independently rank months with respect tosocial recognition and allocate all months to three social recognition (Follower) groups (weak, medium,strong). This results in 15 return-feedback intersection months for each investor. Trades is the numberof completed trades one month after receiving the two-way sorting procedure.
35

Realized return distribution in each intersection month
Return-months Follower p5 p10 p25 Mean p75 p90 p95
Low-Return Weak -.00518 -.00301 -.00106 -.00094 -.00006 -.00001 -.00001Low-Return Medium -.00533 -.00305 -.00103 -.00094 -.00006 -.00001 -.00001Low-Return Strong -.00428 -.00234 -.00077 -.00077 -.00005 -.00001 -.00001Return-1 Weak -.00121 -.00065 -.00020 -.00027 -.00001 .00000 .00000Return-1 Medium -.00115 -.00064 -.00020 -.00025 -.00001 .00000 .00000Return-1 Strong -.00099 -.00053 -.00016 -.00022 -.00001 .00000 .00000Return-2 Weak -.00033 -.00016 -.00003 -.00005 .00000 .00001 .00003Return-2 Medium -.00040 -.00020 -.00004 -.00008 .00000 .00001 .00003Return-2 Strong -.00035 -.00018 -.00004 -.00007 .00000 .00001 .00003Return-3 Weak -.00011 -.00003 .00000 .00001 .00002 .00008 .00015Return-3 Medium -.00011 -.00004 .00000 .00001 .00002 .00008 .00016Return-3 Strong -.00013 -.00005 .00000 .00001 .00002 .00008 .00015High-Return Weak .00000 .00000 .00001 .00023 .00022 .00066 .00129High-Return Medium .00000 .00000 .00001 .00023 .00022 .00067 .00130High-Return Strong -.00002 .00000 .00001 .00018 .00017 .00050 .00096
Table 8: Return distribution in each intersection month
This table reports the return distribution of each intersection return-social recognition month in Table7. For each investor, all periods are ranked independently with respect to the realized returns. Weallocate all periods into �ve groups (low-return-month to high-return-month). We independently rankmonths with respect to social recognition and allocate all months to three social recognition (Follower)groups (weak, medium, strong).
36
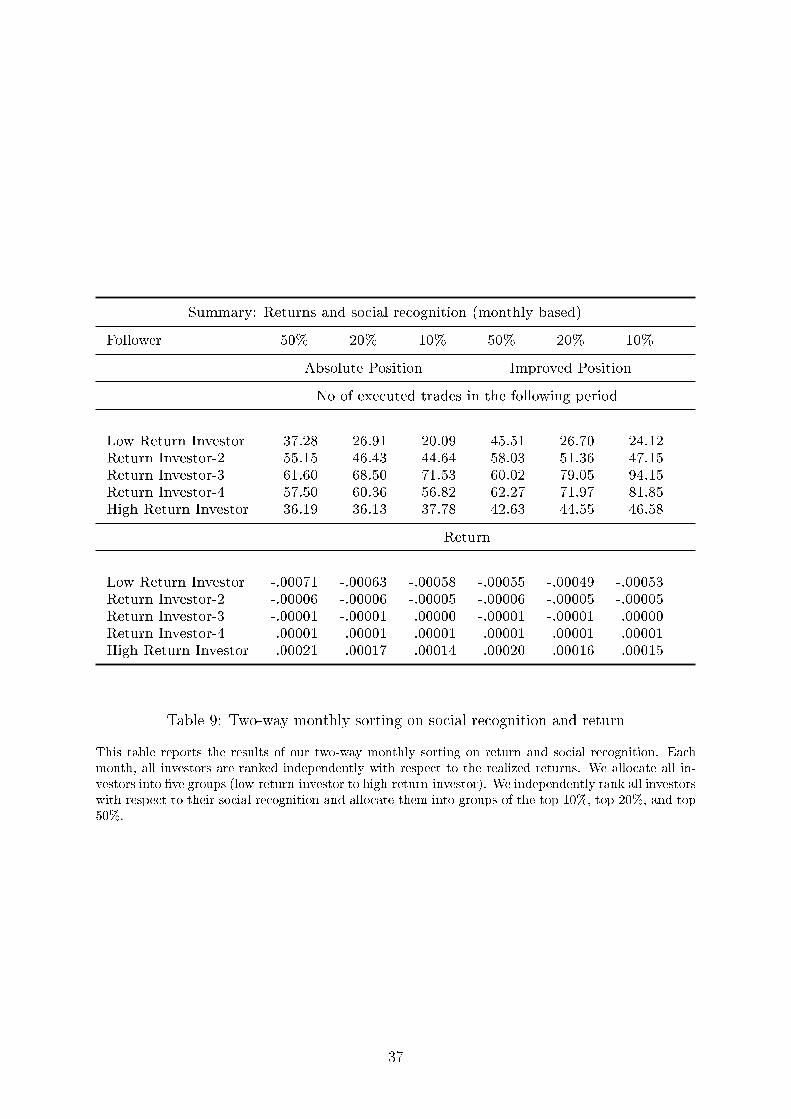
Summary: Returns and social recognition (monthly based)
Follower 50% 20% 10% 50% 20% 10%
Absolute Position Improved Position
No of executed trades in the following period
Low Return Investor 37.28 26.91 20.09 45.51 26.70 24.12Return Investor-2 55.15 46.43 44.64 58.03 51.36 47.15Return Investor-3 61.60 68.50 71.53 60.02 79.05 94.15Return Investor-4 57.50 60.36 56.82 62.27 71.97 81.85High Return Investor 36.19 36.13 37.78 42.63 44.55 46.58
Return
Low Return Investor -.00071 -.00063 -.00058 -.00055 -.00049 -.00053Return Investor-2 -.00006 -.00006 -.00005 -.00006 -.00005 -.00005Return Investor-3 -.00001 -.00001 .00000 -.00001 -.00001 .00000Return Investor-4 .00001 .00001 .00001 .00001 .00001 .00001High Return Investor .00021 .00017 .00014 .00020 .00016 .00015
Table 9: Two-way monthly sorting on social recognition and return
This table reports the results of our two-way monthly sorting on return and social recognition. Eachmonth, all investors are ranked independently with respect to the realized returns. We allocate all in-vestors into �ve groups (low-return-investor to high-return-investor). We independently rank all investorswith respect to their social recognition and allocate them into groups of the top 10%, top 20%, and top50%.
37