social, racial and gender profile of the 500 brazilian ... · social, racial and gender profile of...
TRANSCRIPT


1

Social, Racial and Gender Profile of the 500 Brazilian Largest Companies and Their Affirmative Actions is the version into English for Perfil Social, Racial e de Gênero das 500 Maiores Empresas do Brasil e Suas Ações Afirmativas, published by Instituto Ethos also in December, 2003, and distributed to its associates free of charge.
Produced by
Instituto Ethos de Empresas e Responsabilidade SocialRua Francisco Leitão, 469 – 14º. andar – Conj. 1407 – Pinheiros – 05414-020 – São Paulo – SPPhone number: (55 11) 3897-2400 / Fax: (55 11) 3897-2424Site: www.ethos.org.br
Partnership
Escola de Administração de Empresas de São Paulo da Fundação Getulio Vargas (FGV-EAESP), Instituto de Pesquisa Econômica Aplicada (Ipea), International Labor Organization (ILO) and United Nations Development Fund for Women (Unifem)
Sponsored by
Banco Safra, CPFL Energia and Philips do Brasil
Institutional Support
Inter-American Foundation (IAF)
Research Performance
Ibope Opinião: Helio Gastaldi Filho (general coordination), Malu Rossi and Fábio Fernandes (technicians)
Instituto Ethos Collaborators
Benjamin S. Gonçalves (coordination), Carmen Weingrill, Fernando Pacchi, Karinna Bidermann Forlenza (sponsorship raising), Leno F. Silva and Paulo Itacarambi
Text Production
Claudio Pucci (Estação das Mídias)
Editor
Benjamin S. Gonçalves
Translation
Miriam Exman Fuks
Graphic Project and Art Edition
Waldemar Zaidler and William Haruo (Planeta Terra Design)
Our acknowledgements for the cooperation given by Hélio Santos, Rachel Moreno, Reinaldo Bulgarelli and Rede Saci/USP in evaluating the research data.
Press run: 2,500 copiesSão Paulo, December, 2003.
Reproduction is permitted, as long as previously authorized, in writing, by Instituto Ethos.
Important clarifications on the activities of Instituto Ethos
1. The orientation given to the companies is a voluntary work free of charge.2. We do not render consultancy services, nor do we qualify or authorize any professional to offer any kind of service on our behalf.3. We are not a social responsibility certifying entity nor do we give a “seal” for that purpose.4. We do not permit that any entity or company (associated or not) use the logo of Instituto Ethos without our prior and express written authorization.
Should you have any doubt or wish to consult us on the supporting activities of Instituto Ethos, please contact us by the link “Fale Conosco” (in Portuguese) or by the link “English”, item “Team”, both at www.ethos.org.br, where you may identify the most suitable area.
Printing in Reciclato – cover - 240 g/m2 , contents - 90 g/m2 – Cia. Suzano, Brazilian offset 100% recycled.
Index
INTRODUCTION . . . . . . . . . . . . . . . . . . . . . . . . . . . . . . . . . . . . . . . . . . . . . . . . . . . . . . . . . . . . .5
Methodology . . . . . . . . . . . . . . . . . . . . . . . . . . . . . . . . . . . . . . . . . . . . . . . . . . . . . . . . . . . .6
THE SAMPLE PROFILE . . . . . . . . . . . . . . . . . . . . . . . . . . . . . . . . . . . . . . . . . . . . . . . . . . . . . . . .8
RESULTS . . . . . . . . . . . . . . . . . . . . . . . . . . . . . . . . . . . . . . . . . . . . . . . . . . . . . . . . . . . . . . . . . .11
Overview . . . . . . . . . . . . . . . . . . . . . . . . . . . . . . . . . . . . . . . . . . . . . . . . . . . . . . . . . . . . . . .11
Distribution per Gender . . . . . . . . . . . . . . . . . . . . . . . . . . . . . . . . . . . . . . . . . . . . . . . . . .14
Distribution per Race . . . . . . . . . . . . . . . . . . . . . . . . . . . . . . . . . . . . . . . . . . . . . . . . . . . . .15
Disabled People . . . . . . . . . . . . . . . . . . . . . . . . . . . . . . . . . . . . . . . . . . . . . . . . . . . . . . . . .16
Age Group . . . . . . . . . . . . . . . . . . . . . . . . . . . . . . . . . . . . . . . . . . . . . . . . . . . . . . . . . . . . .17
Length of Service in Company . . . . . . . . . . . . . . . . . . . . . . . . . . . . . . . . . . . . . . . . . . . . .18
Education Level . . . . . . . . . . . . . . . . . . . . . . . . . . . . . . . . . . . . . . . . . . . . . . . . . . . . . . . . .19
International Background . . . . . . . . . . . . . . . . . . . . . . . . . . . . . . . . . . . . . . . . . . . . .20
Relationship with Shareholders . . . . . . . . . . . . . . . . . . . . . . . . . . . . . . . . . . . . . . . . . . . .21
The President’s Perception . . . . . . . . . . . . . . . . . . . . . . . . . . . . . . . . . . . . . . . . . . . . . . . .22
Promoting Equality . . . . . . . . . . . . . . . . . . . . . . . . . . . . . . . . . . . . . . . . . . . . . . . . . . . . . .23
THE IMPORTANCE OF DIVERSITY FOR THE COMPANIES . . . . . . . . . . . . . . . . . . . . . . . . .25
HOW THE COMPANY CAN ENCOURAGE DIVERSITY . . . . . . . . . . . . . . . . . . . . . . . . . . . . .28
5
I N T R O D U C T I O N
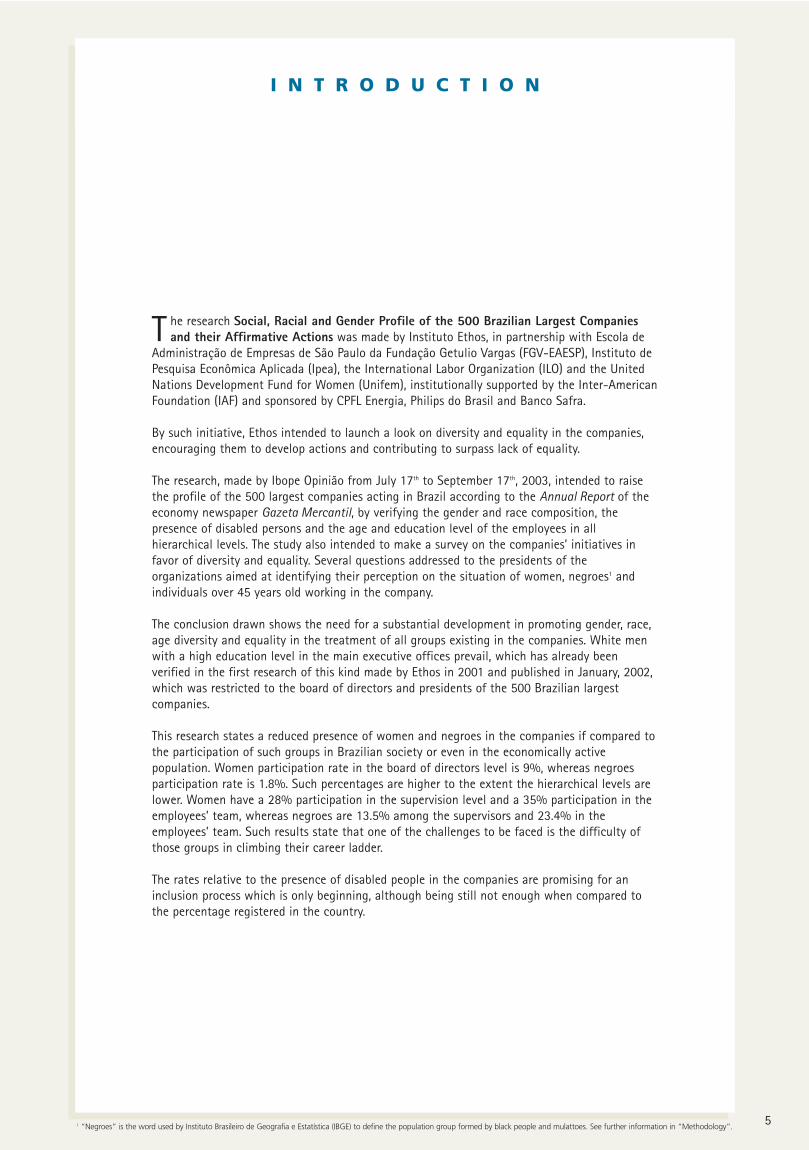
T he research Social, Racial and Gender Profile of the 500 Brazilian Largest Companiesand their Affirmative Actions was made by Instituto Ethos, in partnership with Escola de
Administração de Empresas de São Paulo da Fundação Getulio Vargas (FGV-EAESP), Instituto dePesquisa Econômica Aplicada (Ipea), the International Labor Organization (ILO) and the UnitedNations Development Fund for Women (Unifem), institutionally supported by the Inter-AmericanFoundation (IAF) and sponsored by CPFL Energia, Philips do Brasil and Banco Safra.
By such initiative, Ethos intended to launch a look on diversity and equality in the companies,encouraging them to develop actions and contributing to surpass lack of equality.
The research, made by Ibope Opinião from July 17th to September 17th, 2003, intended to raisethe profile of the 500 largest companies acting in Brazil according to the Annual Report of theeconomy newspaper Gazeta Mercantil, by verifying the gender and race composition, thepresence of disabled persons and the age and education level of the employees in allhierarchical levels. The study also intended to make a survey on the companies’ initiatives infavor of diversity and equality. Several questions addressed to the presidents of theorganizations aimed at identifying their perception on the situation of women, negroes1 andindividuals over 45 years old working in the company.
The conclusion drawn shows the need for a substantial development in promoting gender, race,age diversity and equality in the treatment of all groups existing in the companies. White menwith a high education level in the main executive offices prevail, which has already beenverified in the first research of this kind made by Ethos in 2001 and published in January, 2002,which was restricted to the board of directors and presidents of the 500 Brazilian largestcompanies.
This research states a reduced presence of women and negroes in the companies if compared tothe participation of such groups in Brazilian society or even in the economically activepopulation. Women participation rate in the board of directors level is 9%, whereas negroesparticipation rate is 1.8%. Such percentages are higher to the extent the hierarchical levels arelower. Women have a 28% participation in the supervision level and a 35% participation in theemployees’ team, whereas negroes are 13.5% among the supervisors and 23.4% in theemployees’ team. Such results state that one of the challenges to be faced is the difficulty ofthose groups in climbing their career ladder.
The rates relative to the presence of disabled people in the companies are promising for aninclusion process which is only beginning, although being still not enough when compared tothe percentage registered in the country.
1 “Negroes” is the word used by Instituto Brasileiro de Geografia e Estatística (IBGE) to define the population group formed by black people and mulattoes. See further information in “Methodology”.

6
According to the perception of the companies’ presidents, 74% of the companies do not haveany negro in the board of directors, and 58% of them do not have any women in suchhierarchical level. The reduced participation of those two groups in higher offices confirmsseveral statistics data on their situation in the labor market. According to Instituto Brasileiro deGeografia e Estatística (IBGE — Brazilian Institute of Geography and Statistics)2, for instance,the average monthly salary of the women working population, with 11 or more years ofeducation corresponds to 57.1% of the average salary of the men population under the sameconditions. In the Southeastern region there are 42.8% more men than women with an incomehigher than five minimum salaries. Furthermore, the women are only in a higher number in thecategories with an income up to two minimum salaries.
Further, according to IBGE, the average monthly income of the negro working population is 50%less than the average salary of the white population. Besides, each additional educational levelentitles the white to an increase by 1.25 minimum salary, whereas the negroes are only entitledto an increase by 0.53 of a minimum salary.
The result verified in the research related to the initiatives taken by the companies in favor ofdiversity is promising: 40% of the ones that answered have reported to promote such actions.Until recently, the relevance of this subject has been practically ignored in the Brazilianbusiness sector. However, the result also points out that although the companies are alreadycarrying out such practices, they can and should promote their practices in favor of inclusion,acknowledgment and valuing of diversity.
Among the initiatives, however, few organizations arrange according to priority the hiring ofpeople over 45 or have clear policies to promote racial or gender diversity. We have noticed theexistence of affirmative action and inclusion projects, mainly those for disabled persons, whichindicates that many companies have already put into practice social responsibility actions tomeet diversity criteria.
Besides, the results of this research show clearly the need to strengthen diversity promotiontaking into consideration equality of opportunities for all racial groups and for both genders,that means, diversity with equality.
Methodology
OBJECTIVE OF THE STUDYTo raise the social, racial and gender profile of the employees of the 500 Brazilian largest companies,
per revenue, according to the classification provided by the Annual Report of Gazeta Mercantil.
METHOD EMPLOYEDQuantitative research, pursuant to the application of a questionnaire to be filled in.
UNIVERSEAll the employees of the 500 companies indicated.
SAMPLE247 questionnaires filled in.
T he research was made by Ibope Opinião through the questionnaire sent by mail to thecompanies’ presidents. Ibope was also in charge of monitoring the receipt, filling in and
return of the questionnaires by the companies and tabulating the results.
The first part of the research presented to the organization’s director several questions on hisperception about the situation of women, negroes and people over 45 years old working in thecompany. Such part of the research also listed policies and affirmative actions in favor of those
2 The data about Brazilian population used in this report were extracted from 2001 Pesquisa Nacional por Amostra de Domicílio (Pnad – National Research according to Domicile Sample), produced by IBGE.

7
groups as well as of disabled people and ex-convicted in order to be indicated the ones possiblyadopted by the company.
The second part of the questionnaire requested information on all the company’s employeesrelative to gender, race, age group and intellectual education, among other characteristics. Itwas divided into four panels, one for each hierarchical level, thus designated: executive staff,including the president, vice-presidents and directors; senior management staff; supervision,management and coordination staff; and employees, to identify the non-managementemployees.
The panels of the executive staff and senior management requested separate information whilethe supervision and employees level only requested the totals of each group.
The classification adopted in this study to designate the races was according to InstitutoBrasileiro de Geografia e Estatística (IBGE), the official body for Brazilian national statistics:white (branco), for a white person; black (preto), for a black person; mulatto (pardo), for aperson of mixed black and white ancestry or black and Brazilian Indian ancestry; yellow(amarelo) for a person of Asian ancestry; and Indian (indígena), for a Brazilian Indian ordescendant of a Brazilian Indian. The population formed by the black people and the mulattoesis called Negroes (negros), and they are put together because both groups have the same socialand economical characteristics.
The sample comprehended 247 questionnaires filled in, equivalent to 49.4% of the total sent,with data about a universe of around 1.2 million employees. Some companies have not filled inthe questions about one or more staffs, thus resulting in the variation of the sample size,according to the following chart.
Hierarchical Level Companies Total Employees
(questionnaires filled in)
Executive staff 246 3,688
Senior management 221 33,283
Supervision, management and coordination 213 88,172
Employees 222 1,045,454
Total 247 1,170,597

8
6.5%
20%
NortheasternRegion
South Region
65%Southeastern
Region
2%North Region
6.5%Midwestern
Region
T H E S A M P L
The largest universe of the sample islocated in the Southeastern Region— 65% of the total. The SouthRegion represents 20%, whereas theNorth, Northeastern and MidwesternRegions correspond, together, to15% of the organizations.
55%
2%
9%
19%
3%
7%
TransformationIndustry
CivilConstruction
2%Public
Administration
Commerce
3%Agricultural
Livestock
Services
Financial
Others
The transformation industryconcentrates the majority of thecompanies answering the research,corresponding to 55% of the total,followed by the services companieswith 19% and the commerceactivity with 9%.
PRIMARY ACTIVITY SECTOR
LOCATION OF THE COMPANY’S HEAD OFFICES

9
E P R O F I L E
About one fifth (19%) of the companies have abilling higher than R$ 3 billion, however, themajority (35%) is in the range from R$ 500million to R$ 1 billion.
The majority of the companies (42.5%) has from1,001 to 5,000 employees and 27%, more than5,000. One third has up to 1,000 employees, andsome of them would be considered medium sizecompanies if the criteria adopted in the researchhad not been the billing.
19%19%
Up toR$ 500 millionMore than
R$ 3 billion
35%From R$ 500 million
to R$ 1 billion
27%From R$ 1 billion
to R$ 3 billion
SIZE PER REVENUE
NUMBER OF EMPLOYEES
27%
20%
10.5%
More than5,000 Employees
From 301 to1,000 employees
Up to 300employees
14.5%From 3,001 to
5,000 employees 28%From 1,001 to
3,000 employees
11
R E S U L T S
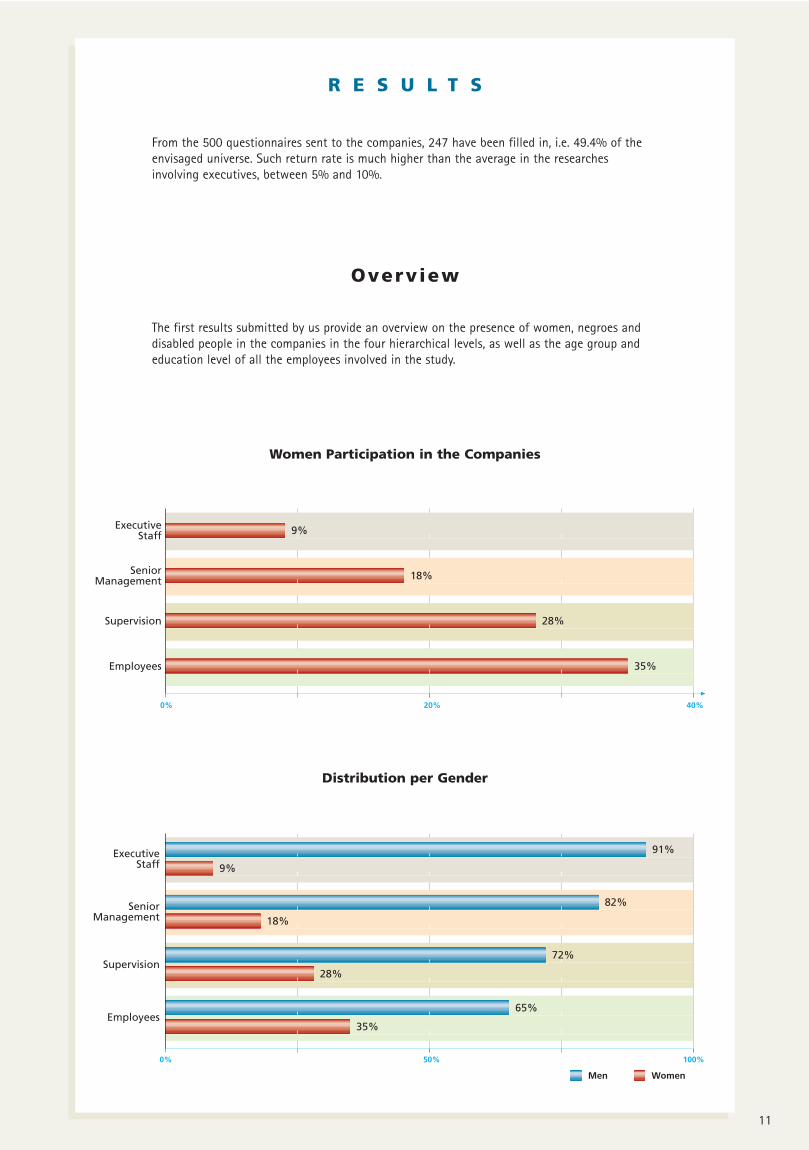
From the 500 questionnaires sent to the companies, 247 have been filled in, i.e. 49.4% of theenvisaged universe. Such return rate is much higher than the average in the researchesinvolving executives, between 5% and 10%.
Overview
The first results submitted by us provide an overview on the presence of women, negroes anddisabled people in the companies in the four hierarchical levels, as well as the age group andeducation level of all the employees involved in the study.
Women Participation in the Companies
ExecutiveStaff
SeniorManagement
Supervision
Employees
0% 20% 40%
9%
18%
28%
35%
0% 50% 100%
65%
35%
72%
28%
82%
18%
91%
9%
WomenMen
ExecutiveStaff
SeniorManagement
Supervision
Employees
Distribution per Gender

12
O v e r
Negroes Participation in the Companies
Distribution per Race or Color
Disabled People Participation in the Companies
0% 15% 30%
23.4%
13.5%
8.8%
1.8%ExecutiveStaff
SeniorManagement
Supervision
Employees
0% 50% 100%
96.5%1.8%1.7%
0%
89%8.8%
2.1%0.1%
84.2%13.5%
2.2%0.1%
74.6%
1.8%0.2%
23.4%
ExecutiveStaff
SeniorManagement
Supervision
Employees
IndiansYellowsNegroesWhites
0% 10% 20%
10%
ExecutiveStaff
SeniorManagement
Supervision
Employees
Worldpopulation
Brazilianpopulation 14.5%
3.5%
1.6%
3.7%
1%

13
Subsequently, we present the resultsaccording to the composition per
gender and race, age, length of service in company, education and internationalbackground, relationship with shareholders and presence of disabled people in the differenthierarchical levels.
Each item further contains a comparisonof the data included in this researchregarding the executive staff to the onesobtained in the research Social, Racial andGender Profile of the Boards of Directorsof the Brazilian Large Companies, made byInstituto Ethos in 2001, focusing only onthe companies’ boards of directors.
v i e w
0% 25% 50%
3%27%
46%22.5%
1.5%
19.7%35.5%
29.2%14%
1.6%
0.02%7%
13.5%
38.5%41%
19%
33.8%2.7%
0.2%
44.3%
ExecutiveStaff
SeniorManagement
Supervision
Employees
56 or over46 to 5536 to 4525 to 3516 to 24
Age Group
Education Levels
0% 35% 70%
0.5%21%
60%14.5%
3.5%0.5%
0.5%9.5%
48%36.3%
4%1.7%
6.4%15.7%
52%22%
3.6%0.3%
0.1%0.7%
2%65%
31%1.2%
ExecutiveStaff
SeniorManagement
Supervision
Employees
Doctorate/Post-doctorate
Post-graduation/Master
CollegeHigh SchoolElementary – 5th to 8thElementary – 1st to 4th

14
Composit ion per Gender
T he presence of women in the samplecompanies is lower to the extent the
hierarchical level is higher: 35% in theemployees, 28% in the supervision,management and coordination staff, 18% inthe senior management staff and 9% in theexecutive staff.
Those percentages — calculated as fromobjective information furnished by the humanresources department of each company — arefar below the women percentage in theBrazilian company, that is, 50,8%. They are
also lower than the women participation inthe economically active population (41.4%) or in the working population (40.7%).
It should be also pointed out that among the economically active population with acollege education, 52.3% are women, whereasin the working population, 35.4% of thewomen have 11 or more years of education,while the men under such condition are only 24.8%. That situation is not reflected in the composition of the companies’leadership staffs.
COMPARISON
Considering the first research made byInstituto Ethos, there is a variation which mayindicate a trend to an increase in womenparticipation in the companies’ executivestaffs. However, it is necessary to take into
account that such data is relative once thesamples shown are of different sizes: 89 of the 500 largest companies answered the first research whereas this one wasanswered by 247.
Negro women situation comes to one’s attention – it is the most unfavorable one, according to the objective data of the research about woman’s presence in the senior
management and in the executive staff. In absolute numbers: only 372 out of 6,016 womenin the senior management are negroes (blacks or mulattoes); among 339 women of theexecutive staff, only three are negroes. That data indicates the need to adopt measures
which ease the climbing of such group in the companies.
Situation of negro women in the executive and senior management staffs
% Nr. of cases Total Nr.
Executive 0.1 3 3,688
Senior 1 372 33,283Manegement
91%
65%35%
Men Women
9%
72%28%
82%18%
ExecutiveStaff
SeniorManagement
Supervision Employees
0% 50% 100%
2001
2003
WomenMen
94%
6%
91%
9%

15
Composit ion per Race
T he companies that informed negroesparticipation in their personnel have
presented the following percentages: 23.4% in the employees, 13.5% in the supervision,management and coordination staff, 8.8% in the senior management staff and only 1.8%in the executive staff.
The low participation of negro people in thecompanies composing the research samplecomes to one’s attention more than womenparticipation. Brazil has a self-perceived negro
population of 46%, of which 5.6% are blacksand 40.4% mulattoes. The economically activepopulation has a 43.3% negro universe, andthe main indicators show that the negroescorrespond to 45% of the working population.
The failing in answering the question aboutthe employees’ color or race ranged between23% and 27%, which shows a certaindifficulty of the companies in dealing with thematter. Having furnished full information mayhave changed the chart presented.
COMPARISON
The composition of the executive staff perrace has presented no significant changesbetween the results of the research made in2001 and these ones. The slight variationsnoted can be explained by the differencebetween the sample sizes.
The report published on the 2001 researchonly informed the percentage of white
executives in comparison to the executives of“other races”. To compare the results of thetwo studies it was necessary to take the dataof 2001 and split them. The differencebetween the results published at that timeand the ones used in this comparison is dueto the fact that the blank answers to thisquery in both researches have beendisregarded.
Although the yellows represent only 0.4% of the Brazilian population and the blacks 5.6%, the research shows three times more yellows (1.7%) than blacks (0.5%) in the executive staff. The yellows are also more present than the blacks in the senior
management staff (2.1% against 1.6%), and in the supervision, management and coordination levels (2.2% against 1.9%). Only in the employees team the total number of blacks (6.3%) exceeds the number of yellows (1.8%).
74.6%
23.4%
1.8%
1.8%
96.5%
1.7%
0.2%
2.2%
84.2%
13.5%
0.1%
8.8%
2.1%
89%
0.1%
ExecutiveStaff
SeniorManagement
Supervision Employees
Whites Negroes Yellows Indians
0% 50% 100%
2.6%2%
0.2%
95.2%
1.7%0%
1.8%
2001
2003
96.5%
IndiansYellowsNegroesWhites

16
Disabled People
W e were faced with a high percentage oflack of answers to the question about
the existence of disabled people in eachhierarchical level: 29% in the board ofdirectors, 44% in the senior management,45% in the supervision, management andcoordination and 45% in the employees.
The companies that answered still register a lowpercentage of individuals under such conditiononce there are 24.6 million disabled in Brazil,that is, 14.5% of the population; however, thedisabled are found in all hierarchical levels.
The inclusion of the disabled in the labor market is supported by legislationwhich sets forth, among other issues, the existence of a quota system, accordingto article 93 of Law 8.213, of 1991, whereby “the company with 100 or moreemployees must fill in 2% to 5% of theirpositions with rehabilitated disabled people or habilitated disabled people, on the following proportions: up to 200 employees, 2%; 201 to 500, 3%; 501 to 1,000, 4%; more than 1,000, 5%”.
About 610 million people worldwide – 10% of the world population – bear some kind of physical or mental disability, according to an estimate of the World Health Organization (WHO). 386 million of this group (62%) belonging to the economically active population. Further, according to WHO, 80% (488 million people) live in developing countries.
99%
1%Physically 0.3%
Visually 0.5%Hearing 0.1%Multiply 0.1%
3.5%
96.5%
Physically 0.8%Visually 0.5%Hearing 1.0%Multiply 1.2%
Disabled People
1.6%
98.4%
Physically 0.2%Visually 0.1%Hearing 0.7%Multiply 0.6%
Physically 0.3%Visually 0.9%Hearing 1.5%Multiply 1.0%
96.3%
3.7%ExecutiveStaff
SeniorManagement
Supervision Employees

17
Age group
T he individuals 46 years old or over aremajority in the executive staff, forming
a 54.5% universe, 13,5% being 56 years old or over.
The youngest, with up to 45 years old, occupythe majority of offices in the lower hierarchicallevels: 84.4% among the employees, 76% inthe supervision, management and coordinationstaff, and 63.2% in the senior management.
COMPARISON
By comparing the present data with thosepresented in the 2001 research on this item,we have noted a significant change in the agegroups of 36 to 45 and of 56 or over whichmay indicate a trend to a rejuvenation of the
companies’ executive staff. There would beanother indication of such possibility in thelength of service in company registered inboth researches, as may be verified in thefollowing item.
It is noted a great lack of equality between the 46 to 55 age group and the 56 or over age group, not only in the executive staff (from 41% to 13.5%), but also in other hierarchical levels: 33.8% to 2.6% in the senior management, from 22.5% to
1.5% in the supervision and from 14% to 1.6% in the employees. Such panorama requires actions for people aged 56 or over.
38.5%
29.2%
14%
1.6%19.7%
35.5%
22.5%
1.5% 3%
27%
46%
2.7%
19%
13.5%
41%
7%
0.02%
33.8%
44.3%
0.2%ExecutiveStaff
SeniorManagement
Supervision Employees
56 or over46 to 5536 to 4525 to 3516 to 24
0% 25% 50%
0%
0.02%7%
38.5%41%
13.5%
6%33%
43%18%
2001
2003
56 or over46 to 5536 to 4525 to 3516 to 24

18
Length of Service in Company(Executive Staff and Senior Management)
COMPARISON
Considering the results of the 2001 research,it is noted an increase in the 3 to 10 yearsgroup in the company, from 24% to 31%, and
a reduction in the universe of over 10 years,from 49% to 45%.
The majority of the negroes belonging to the executive staff (53.8%) has more than 15 years in the company and only 37.4% of the white executives and 29.7% of the yellows are under the same conditions. That means the few
negroes to reach top positions take longer to make so than the executives of other races.
T he senior management´s universe (68% ofthe staff) is greater than the board of
directors’ universe (45% of the staff) with 11years or more in the company. Thus, it is notunsuitable to suppose that individuals withmore length of service in the company,therefore older, do not climb the ladder andare surpassed by professionals with lesslength of service in company.
The comparison with the results obtained in2001 presented below seems to indicate so.
It has also come to our attention the fact that 42% of the directors have only been working for five years in the company,thus indicating that a substantial part of them has been brought from outside the company.
Less than 1 year 1 to 2 years 3 to 5 years 6 to 10 years 11 to 15 years
36%
9%
10%14% 55%
3.5%
10.5%
18%
13%
7%
13%
11%
More than 15 years
ExecutiveStaff
SeniorManagement
0% 30% 60%
27%24%
49%
24%31%
45%
2001
2003
3 to 10 yearsUp to 2 years Over 10 years

19
Education
F rom those who answered this query,almost all the directors (97.2%) and the
majority of the managers (81.5%) havecollege degree.
In spite of the clear relation betweenhierarchical level and education level, it may
be verified that 2% of the directors and 14.5%of the managers have graduated from highschool, whereas 0.8% of the directors and 4%of the managers have graduated only fromelementary school. On the other hand, morethan half of the supervisors and one fourth ofthe employees have graduated from college.
COMPARISON
Considering the first research of InstitutoEthos, it can be verified that, from 2001 to2003, the percentage of directors with asuperior education has increased significantly.However, those with post-graduation/master
education and with doctorate have dropped.Nevertheless, as it has already been mentioned, the conclusions obtained whencomparing the data from both studies shouldbe relative once the samples are different.
The most outstanding racial group among the directors with post-graduation or master are the mulattoes: 44.7% of them are in such education level, followed by the yellows, 40.5%, the whites, 31.9%, and the blacks, 21.5%.
22%
15.7%
3.6%
Doctorate/Post-doctorate
Post-graduation/Master
CollegeHigh SchoolElementary - 5th to 8thElementary – 1st to 4th
65%
31% 2%
1.2%
52%
6.4%
0.7%0.1%
0.3%
9.5%4%
48%
36.3%
1.7%0.5%
14.5%
3.5%21%
60%
0.5%0.5%
ExecutiveStaff
SeniorManagement
Supervision Employees
0% 35% 70%
4%51%
40%5%
2.8%
31%1.2%
65%
2001
2003
Doctorate/Post-doctoratePost-graduation/MasterCollegeUp to High School

20
International Background
T he percentage of directors with a courseor training abroad is clearly higher than
the one of employees from other hierarchical
levels in the same conditions, which indicatesthat this is a differential competitive issue forthe career climbing.
COMPARISON
By comparing the two results of the studies of Instituto Ethos, we verify that the number of directors that have not made anycourse abroad has increased significantly. Themajor part of such difference is due to thegreat reduction in the group of those who
attend or have attended a training course inanother country.
However, it is important to compare those datawith the due restrictions, and not to forget thatthey were collected from samples of different sizes.
Apart from the companies which have not provided information on the issue (24% did not answer this item), it is concluded that the racial group which has the greatest percentage of executives in the board of directors who attended course abroad
are the yellows, with 42.5%, followed by far by the whites (16%) and by the negroes (7.7%).
99%
10%
68%
16.5% 4%
1.5%
0.7% 0.2%0.04%
0.06%
86.3%11.2%
0.8%1.2%
0.5%
2%
97%
0.4%0.4%0.2%
ExecutiveStaff
SeniorManagement
Supervision Employees
No internationalbackground
Doctorate/Post-doctorate
Post-graduation/Master
CollegeTraining
0% 35% 70%
36%4%
11%4%
45%
16.5%4%
10%1.5%
68%
2001
2003
No internationalbackground
Doctorate/Post-doctorate
Post-graduation/Master
CollegeTraining

21
Relationship with Shareholders
(Executive Staff)
T he companies were asked whether theexecutives had any family relationship
with shareholders holding more than 5% ofthe company’s shares, or if they held suchnumber of shares in the company. Consideringonly the companies that answered this item,
we note that only 4.5% of the executives areunder one of those conditions.
That information indicates that almost allboards of directors of the big companies wasformed according to professional criteria.
COMPARISON
Despite the difference in the sample sizes ofthe two researches, the result is practicallythe same.
0% 50% 100%
2001
2003
Yes No
4%
96%
4.5%
95.5%
4.5%95.5%
NoYes
ExecutiveStaff
22
The President’s Perception
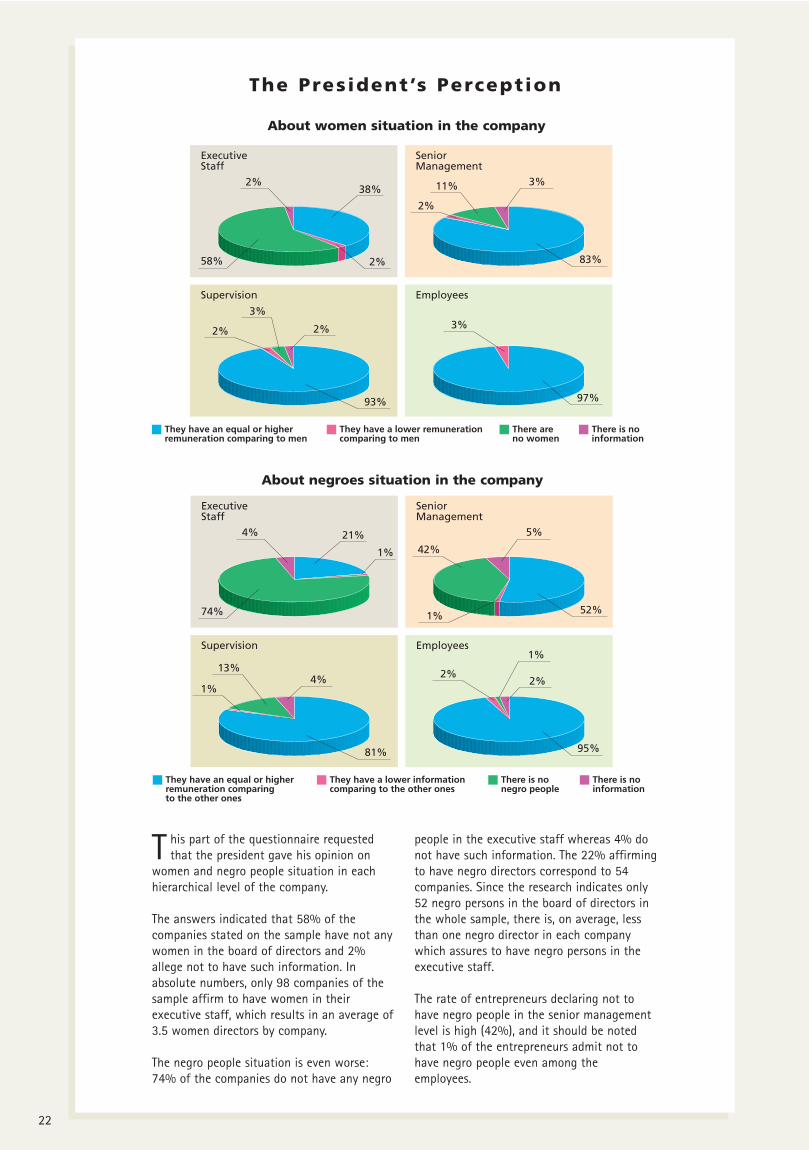
T his part of the questionnaire requestedthat the president gave his opinion on
women and negro people situation in eachhierarchical level of the company.
The answers indicated that 58% of thecompanies stated on the sample have not anywomen in the board of directors and 2%allege not to have such information. Inabsolute numbers, only 98 companies of thesample affirm to have women in theirexecutive staff, which results in an average of3.5 women directors by company.
The negro people situation is even worse:74% of the companies do not have any negro
people in the executive staff whereas 4% donot have such information. The 22% affirmingto have negro directors correspond to 54companies. Since the research indicates only52 negro persons in the board of directors inthe whole sample, there is, on average, lessthan one negro director in each companywhich assures to have negro persons in theexecutive staff.
The rate of entrepreneurs declaring not tohave negro people in the senior managementlevel is high (42%), and it should be notedthat 1% of the entrepreneurs admit not tohave negro people even among theemployees.
2%
58%
38%
2%
3%
97%
There is noinformation
They have a lower remunerationcomparing to men
They have an equal or higherremuneration comparing to men
2%
3%
2%
93%
2%
11%
83%
3%
There areno women
ExecutiveStaff
SeniorManagement
Supervision Employees
4%
74%
21%
1%
2%
95%
There is noinformation
2%
1%
1%
13%4%
81%
1%
42%
52%
5%
There is nonegro people
They have an equal or higherremuneration comparingto the other ones
They have a lower informationcomparing to the other ones
ExecutiveStaff
SeniorManagement
Supervision Employees
About women situation in the company
About negroes situation in the company

23
Promoting Equal ity
F rom the companies of the sample, 40%allege to develop some kind of policy or
affirmative action to make up for thedisadvantages of the social groupstraditionally discriminated.
According to the result obtained from a listwith nine options presented in thequestionnaire, the maintenance of a specialprogram to hire disabled people is the mostdivulged affirmative policy, practiced by 32%of the companies. Probably, such ampleadhesion is due not only to the legislationwhich ensure disabled inclusion, but also or
mainly to a change in the mentality with thegrowing valuation of social responsibility.
A significant support is provided tocommunity projects to improve the offer ofqualified professionals deriving from thegroups usually discriminated in the labormarket, mentioned by 24% of the companies.On the other hand, only 1% of the companiesallege to maintain programs to improve theprofessional capacitation of negro people,which constitute 43.3% of the economicallyactive population.
0% 20% 40%
Maintenance of a special program tohire disabled people 32%
Support to projects in the community aimingto improve the offer of qualified professionalsoriginating from the groups usually discriminatedin the labor market 24%
Creating special programs to hire people usuallydiscriminated in the labor market such as women,negro people and individuals over 45 years old. 7%
6%
Establishing goals to reduce the differencebetween the highest and the lowest salarypaid by the company
3%
Establishing programs for professional capacitationaiming at improving the qualification of peopleover 45 years old. 3%
Establishing goals to reduce the lack of salaryequality in the company(between men and women, for instance). 3%
Offering work opportunities for ex-convicted. 2%
Establishing programs for professionalcapacitation aiming at improvingthe qualification of negro people. 1%
Establishing programs for professional capacitationaiming at improving women qualification.

25
T H E I M P O R T A N C E O F
D I V E R S I T Y F O R
T H E C O M P A N I E S
The data obtained by this research reinforce the idea that to promote action in favor of diversity in the companies is necessary. For that reason, we have decided to attach to this study a summary of the main issues focused by the manual Como as Empresas
Podem (e Devem) Valorizar a Diversidade (How the Companies May – and Should – ValueDiversity), published by Instituto Ethos in September, 2000. However, we noted that only
promoting diversity is not enough; it is also necessary to promote equality.
T he present economic scenario strongly requires not only productivity and competition, butalso an ethical and legal performance by the companies.
In view of the growing availability of technological resources, the competitive advantage of acompany shall be determined to a great extent by the quality of the relationship maintainedwith people, internally and externally, such quality being directly related to the inclusion orexclusion of different social groups.
Diversity is frequently more associated to gender and race. However, the companies have beenexpanding the concept and considering issues such as social and economic condition of theemployees, as well as their age, marital status, nationality, sexual orientation, disabilities, workstyle and world view, among other differences.
Valuing and practicing diversity, fighting against discrimination and prejudice are principles ofbusiness social responsibility.
26
CRITICAL SUCCESS FACTOR
Implementing efficiently strategies for labor diversity may be a decisive factor in businesssuccess. Diversity policies increase competition when enabling that companies take advantageof all the potential resulting from positive differences among their employees. There is also agrowing trend towards valuing the brands and assets produced by organizations with adiversified image and social responsibility.
ADAPTATION TO THE CLIENTS’ PROFILE
The companies’ workforce shall include diversity and changes within their clients and marketsto remain competitive in the global economy.
The companies with diversified labor are better prepared to place their products and services atthe market, serving more and more distinct and demanding consumers.
STRENGHTENED FINANCIAL PERFORMANCE
Several international studies indicated that the diversity programs have a positive influence ona good financial performance by the companies. The diversity programs also have a differentialfactor for many companies in attracting new investors.
REDUCTION IN ROTATION
The experience undergone by several companies shows that the attention given to diversity mayresult in a reduction in labor rotation.
IMPROVEMENT IN PRODUCTIVITY
A diversity environment tends to be more stimulant and productive, favoring new projects andsolutions. Valuing diversity contributes to a positive environment which fights againstintolerance, stimulates cooperation and synergy among the professionals of the organizationabout their common objectives. Therefore, an environment reinforcing employees’ binding towork and their identification with the company.

27
INCREASE IN WORK SATISFACTION
When evaluating the reach of the programs including equal opportunities for development,non-discrimination and respect, it is concluded that the employees with an encouragingenvironment at work are more pleased with their professional activities and more loyal.
LESS LEGAL SUSCEPTIBILITY
The companies that establish diversity programs and management methods directed to ascertainand prevent potential situations involving discrimination are less susceptible to legalrequirements.
VALUED CORPORATE IMAGE
By stating the presence of a macro trend in valuing diversity in different countries, it is ofutmost and strategic importance to practice it internally. This subject has been constantlydiscussed in the media, especially in case of racism or sexual discrimination in the companies.The publicity of a discriminatory practice may be extremely negative for the organization,affecting its image before consumers and public opinion. On the other hand, if diversity ispresent in the company’s activities, making such company a good place to work at, with anopen and inclusive environment, the company’s image in the market may improve.
GREATER FLEXIBILITY
Mergers, acquisitions and spin-offs of companies have been more and more frequent. There isalso a growing trend towards outsourcing operations. A pluralist organization culture favorsadaptation to such changes. Many times, such processes require that groups with differentcultures and characteristics be together. A diversity promotion policy may make the companymore flexible, increasing its capacity to become adapted to new situations.
PROPER RECOGNITION
Encouraging diversity means reinforcing talent and individual potential, thus the companybecomes more capable to evaluate and promote its employees based on their actualqualification. A discriminatory environment may repress talents and compromise the company’scapacity to recognize properly the performance of its employees and directors.

28
HOW THE COMPANY CAN
ENCOURAGE DIVERSITY
Follow up information on your employees, identifying the discrepancies and changes in comparable situations involving women, negro people or other groups
relevant for the company.
Commit itself to hire and promote people with different experiences and perspectives. Recruit your personnel under diversified forms and sources.
Adopt diversity as a guideline for development, maintenance, career and remuneration policies of the company’s personnel.
Include diversity in your integration programs, favoring the surpassing of hierarchical barriers and penetration of groups already internally organized.
Promote regular training and communication actions for all employees.
Turn diversity practice into part of the periodical evaluation of all administrators and employees.
Measure your need for external support and hire experts and technically qualified institutions to help in implementing diversity policies.
Seek to multiply diversity culture among the other companies of your field of activity by means of associate entities or entrepreneur unions.
Implement initiatives to spread your diversity policy among your partners, consumers, clients, suppliers and in the communities where you act.
Establish partnerships and exchanges with entities and institutions of the community directed to promote diversity.
Reinforce the company’s community relations.
Make sure that the diversity principles are guiding the advertising and marketing campaigns. Also, make the institutional marketing of your
initiatives in favor of diversity valuing.
Produced by
Partnership
Research Performance
Sponsorship
Institutional Support