social partners and daily affect in the oldest-old · social partners and daily affect in the...
TRANSCRIPT

Social Partners and Daily Affect in the Oldest-Old:
Helena Chui1, Christiane Hoppmann2, Denis Gerstorf3, Ruth Walker1, Mary Luszcz1
1Flinders University, 2University of British Columbia, 3Humboldt University
Who are with Them and How do They Feel?

Overview 1. Social relationships: Between- / within-person perspectives 2. Research Questions 3. Method: ALSA Daily Life Time-
Sampling Study (ADuLTS) 4. Results 5. Conclusion
2

1. Social relationships in the oldest-old
• Adults aged 85+ are the fastest growing (He & Muenchrath, 2011; Suzman, 1992).
• Composition and size of social network change with age, e.g. widowhood, death of kin, and frailty (Antonucci et al, 2006).
• Social network size shrinks with age (Lang & Carstensen, 1994).
3

1. Social relationship: Between-person
• Social network size and composition, e.g. marital status, have implications on health outcomes (Cohen, 2004)
• More friends -> lower mortality over 10 years in older adults aged 70+ (Giles et al., 2005)
• Spouses shape each other’s developmental trajectories of depressive symptoms (Hoppmann et al, 2011)
4

1. Social relationships: Within-person
• Daily interactions with spouses, family, and friends are associated with different affect (Median age = 68) (Larson et al., 1986)
• Move beyond between-person perspective:
daily lives in context (Baltes, Wahl, & Schmid-Furstoss, 1990).
5
Between-person Within-person Composition and size
How many friends do you have?
Who are you with at this moment?
Outcome CESD: I felt depressed. Affect: How happy are you?

1. Between- and within-person perspectives
• Adapted from Fingerman and Lang’s Cube Model (2004)
6

2. Research Questions
1. What are the types of social partners that the oldest-old interact with on a day-to-day basis?
2. How do social partners contribute to daily affect in the oldest-old?
7

3. Method: ADuLTS • ALSA Daily Life Time-Sampling
Study (ADuLTS) • Participants
– 50 women and 25 men (M age = 88.65 years, SD = 3.04, range = 83.55 – 102.40)
– Mostly community-dwelling (98.7%) – Widowed (68%) – Men (44% married) and women (16%
married)
8

3. Method • Procedure
– Baseline – Daily affect and social partners: 7 days, 6 times a
day (Waking, every 3 hours)
• Measures – Affect: “How are you feeling at this moment?”
(1 = not at all; 5 = very much) • Positive affect: happy, excited, calm (RKF = .99; R1R =
.75; RKR = .98; RC = .37; Shrout & Lane, 2011) • Negative affect: sad, anxious, irritated (RKF = .99; R1R
= .78; RKR = .98; RC = .36)
9

3. Method • Measures (Con’t)
– Social partners: “Who are you with?” • (a) service provider, (b) formal carer, (c) spouse,
(d) other family member, (e) friend, (f) other, and (g) alone
• Dummy-coded, e.g. When participants reported being with spouse and friend, spouse = 1, friend = 1.
• Variable “peripheral ties” was created because of the few occasions when service provider, formal carer, and other were present.
10

3. Method: Measures • Measures - covariates
1. Neuroticism (BFI; John & Srivastava, 1999). Cronbach’s α = .74 (M = 14.51, SD = 4.97).
2. Depressive symptoms (10-item CES-D; Andresen et al., 1994). “My sleep was restless” was dropped. Cronbach’s α = .65 (M = 4.69, SD = 3.46).
3. Chronic health conditions, checking “Yes” or “No” on a list of 10 medical conditions, e.g. arthritis and cancer (M = 2.43, SD = 1.48).
4. Loneliness (PGCMS; Lawton 1975), “You feel lonelier than you used to feel” (1 = Agree; 0= Disagree). (M = .30, SD = .46).
5. Time (duration in study)
11

• Multivariate multilevel models (Raudenbush & Bryk, 2002)
• Level-1 model:
• PA and NA are dummy-coded: • PA = 1 and NA = 0, d = PA. • PA = 0 and NA = 1, d = NA.
3. Method: Analysis
12
𝑑𝑑𝑖𝑖𝑖𝑖 = 𝛿𝛿1𝑖𝑖𝑃𝑃𝑃𝑃𝑖𝑖𝑖𝑖 + 𝛿𝛿2𝑖𝑖𝑁𝑁𝑃𝑃𝑖𝑖𝑖𝑖
+𝛿𝛿3𝑖𝑖𝑃𝑃𝑃𝑃𝑖𝑖𝑖𝑖 × 𝑆𝑆𝑆𝑆𝑆𝑆𝑆𝑆𝑆𝑆𝑆𝑆𝑖𝑖𝑖𝑖 + 𝛿𝛿4𝑖𝑖𝑁𝑁𝑃𝑃𝑖𝑖𝑖𝑖 × 𝑆𝑆𝑆𝑆𝑆𝑆𝑆𝑆𝑆𝑆𝑆𝑆𝑖𝑖𝑖𝑖 +𝛿𝛿5𝑖𝑖𝑃𝑃𝑃𝑃𝑖𝑖𝑖𝑖 × 𝑂𝑂𝑂𝑂𝑂𝑆𝑆𝑂𝑂 𝑓𝑓𝑓𝑓𝑓𝑓𝑓𝑓𝑓𝑓𝑓𝑓𝑖𝑖𝑖𝑖 + 𝛿𝛿6𝑖𝑖𝑁𝑁𝑃𝑃𝑖𝑖𝑖𝑖 × 𝑂𝑂𝑂𝑂𝑂𝑆𝑆𝑂𝑂 𝑓𝑓𝑓𝑓𝑓𝑓𝑓𝑓𝑓𝑓𝑓𝑓𝑖𝑖𝑖𝑖
+𝛿𝛿7𝑖𝑖𝑃𝑃𝑃𝑃𝑖𝑖𝑖𝑖 × 𝐹𝐹𝑂𝑂𝑓𝑓𝑆𝑆𝐹𝐹𝑑𝑑𝑖𝑖𝑖𝑖 + 𝛿𝛿8𝑖𝑖𝑁𝑁𝑃𝑃𝑖𝑖𝑖𝑖 × 𝐹𝐹𝑂𝑂𝑓𝑓𝑆𝑆𝐹𝐹𝑑𝑑𝑖𝑖𝑖𝑖 +𝛿𝛿9𝑖𝑖𝑃𝑃𝑃𝑃𝑖𝑖𝑖𝑖 × 𝑃𝑃𝑆𝑆𝑂𝑂𝑓𝑓𝑆𝑆𝑂𝑆𝑆𝑂𝑂𝑓𝑓𝑓𝑓𝑖𝑖𝑖𝑖 + 𝛿𝛿10𝑖𝑖𝑁𝑁𝑃𝑃𝑖𝑖𝑖𝑖 × 𝑃𝑃𝑆𝑆𝑂𝑂𝑓𝑓𝑆𝑆𝑂𝑆𝑆𝑂𝑂𝑓𝑓𝑓𝑓𝑖𝑖𝑖𝑖 + 𝑆𝑆𝑖𝑖𝑖𝑖

3. Method: Analysis
13
• Level-2 model:
𝛿𝛿1𝑖𝑖 = 𝛾𝛾10 + 𝑆𝑆1𝑖𝑖 𝛿𝛿2𝑖𝑖 = 𝛾𝛾20 + 𝑆𝑆2𝑖𝑖 𝛿𝛿3𝑖𝑖 = 𝛾𝛾30 + 𝑆𝑆3𝑖𝑖 𝛿𝛿4𝑖𝑖 = 𝛾𝛾40 + 𝑆𝑆4𝑖𝑖 𝛿𝛿5𝑖𝑖 = 𝛾𝛾50 + 𝑆𝑆5𝑖𝑖 𝛿𝛿6𝑖𝑖 = 𝛾𝛾60 + 𝑆𝑆6𝑖𝑖 𝛿𝛿7𝑖𝑖 = 𝛾𝛾70 + 𝑆𝑆7𝑖𝑖 𝛿𝛿8𝑖𝑖 = 𝛾𝛾80 + 𝑆𝑆8𝑖𝑖 𝛿𝛿9𝑖𝑖 = 𝛾𝛾90 + 𝑆𝑆9𝑖𝑖
𝛿𝛿10𝑖𝑖 = 𝛾𝛾100 + 𝑆𝑆100𝑖𝑖
Level-2 covariates: Gender, CESD, chronic health conditions, loneliness.

4. Results: Descriptive
• Affect
– Women and men did not significantly differ from each other in mean PA and mean NA.
14
Men Women M(SD) M(SD)
PA 3.16(.55) 3.09(.53) NA 1.39(.46) 1.45(.48)

4. Results: Descriptive • Social partners
15

4. Results: Final model Model
95% CI
Fixed effects γ (SE) Lower Upper
PA, γ10 3.15(.06)*** 3.03 3.26
NA, γ20 1.44(.05)*** 1.34 1.55
PA × Time, γ30 -.02(.01)** -.03 -.01
NA × Time, γ40 -.01(.01) -.02 .003
16

4. Results: Social partners Model
95% CI
Fixed effects γ (SE) Lower Upper
PA × Spouse, γ50 -.04(.06) -.16 .08
NA × Spouse, γ60 .02(.06) -.10 .14
PA × Other family, γ70 .13(.05)** .04 .23
NA × Other family, γ80 .04(.05) -.05 .13
PA × Friend, γ90 .17(.07)* .04 .30
NA × Friend, γ100 -.13(.07)* -.26 -.001
PA × Peripheral ties, γ110 -.02(.07) -.16 .12
NA × Peripheral ties, γ120 .06(.07) -.08 .20 17

4. Results: Between-person differences
Model
95% CI
Fixed effects γ (SE) Lower Upper
PA × Neuro, γ150 -.04(.01)*** -.06 -.02
NA × Neuro, γ160 .03(.01)** .01 .05
PA × CES-D, γ170 -.05(.02)** -.09 -.02
NA × Lonely, γ220 .20(.07)** .06 .34
18

4. Results: Social partner ×Between-person difference
Model
95% CI
Fixed effects γ (SE) Lower Upper
PA × Spouse × Gender, γ230 -.32(.13)* -.58 -.06
NA × Friend × Neuro, γ360 -.03(.01)* -.06 -.003
PA × Spouse × Chronic, γ470 -.11(.05)* -.20 -.02
PA × Spouse × Lonely, γ550 .18(.08)* .02 .34
19

4. Results: Random effects 95% CI
Random effects Estimate (SE) Lower Upper
Level-2 (between-person):
PA variance .18(.03)*** .13 .26
NA variance .15(.03)*** .11 .22
PA-NA covariance -.01(.02) -.05 .03
Level-1 (within-person):
PA variance .22(.01)*** .20 .23
NA variance .20(.01)*** .19 .21
PA-NA covariance -.06(.004)*** -.07 -.05
AR(1) .26(.01)*** .23 .29 20

5. Conclusion • The oldest-old spent most of their time being
alone (over 70% of the times reported), compared to adolescents (17%), adults (29%), young-old adults in the US (48%), and young-old adults in Germany (59%) (Baltes et al, 1990; Larson et al, 1985).
• When not alone, whether individuals benefit from being with social partners depends on who the individuals are (Between-person characteristics) and who are with them (Within-person variability).
21
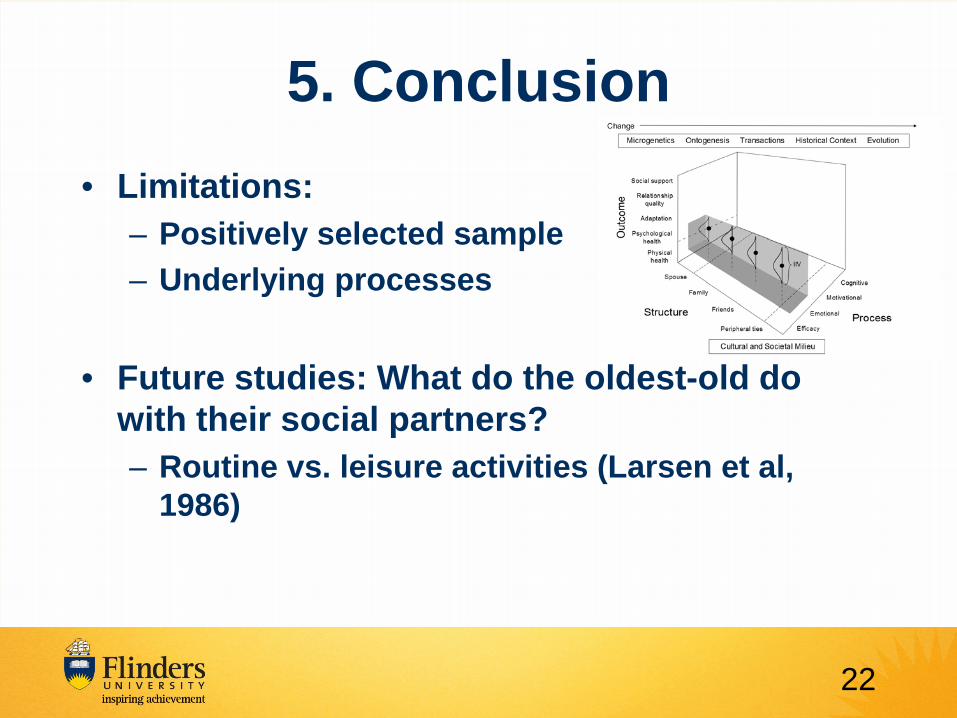
5. Conclusion • Limitations:
– Positively selected sample – Underlying processes
• Future studies: What do the oldest-old do
with their social partners? – Routine vs. leisure activities (Larsen et al,
1986)
22

5. Conclusion • Daily activities
23
10.32%
6.15%
18.65%
14.66%
25.08%
2.42% 22.72
%
Alone 8.35% 6.88%
18.58%
15.60%
22.98%
5.18%
22.43%
Spouse
28.11%
6.01% 15.88
% 13.30
%
21.78%
2.47% 12.45%
Other family
30.19%
6.23% 13.21%
7.55%
20.57%
10.94%
11.32%
Friend 12.81% 5.63%
12.81%
15.63% 27.81%
20.63%
4.69% Peripheral ties SocialPhysicalHomeCognitionSelf careProductiveLeisure

Acknowledgement • Australian Research Council (LP100200413) • Canadian Institutes for Health Research • ECH Inc • Helping Hand Aged Care Inc • Minister for the Ageing (DFC) • Minister for Health (DoH) • Anglicare SA • COTA Seniors Voice
24

Questions and comments?
Thank you very much.
25