social effects - toothillschool.co.uk · web viewthis unexpected warming weakened the jet stream...
TRANSCRIPT

Name:Class:Teacher:
This is the whole course in one booklet. It is set up in exam order. You should use this to accompany any other notes you have. There is also a command word mat which tells what each command word means, how many points to make, what words in the question mean.
Paper 1 Paper 2 Paper 3Date: 22nd May 2018 5th June 2018 11th June 2018Length: 1 hour 30 minutes 1 hour 30 minutes 1 hour 15 minutesTime of day: PM PM PMTotal number of marks:
883 marks for SPaG
883 marks for SPaG
766 marks for SPaG
Equipment needed:
2 black or blue pens2 pencilsRulerCalculator
2 black or blue pens2 pencilsRulerCalculator
2 black or blue pens2 pencilsRulerCalculator
Topics covered:
Section A – Question 1: Challenges of Natural hazards – 33 marks – answer all questionsSection B – Question 2: The living world – 25 marks – answer all questionsSection C: Question 3 – Coasts – 15 marksQuestion 4 – Rivers – 15 marksQuestion types: multiple-choice, short answers, 2 x 9 markers
Section A – Question 1: Urban issues and challenges – 33 marks – answer all questionsSection B – Question 2: The changing economic world -30 marks – answer all questionsSection C: Answer Question 3 and question 6 (ENERGY) – 25 marks Question types: multiple-choice, short answers, 2 x 9 markers
Section A – Question 1: Issue Evaluation – 37 marks – answer all questionsSection B – Question 2: Geographical skills and fieldwork – 39 marks – answer all questionsQuestion types: multiple-choice, short answers, 2 x 9 markers.

Paper 1Date: 22nd May 2018Length: 1 hour 30 minutesTime of day: PMTotal number of marks: 88
3 marks for SPaGEquipment needed: 2 black or blue pens
2 pencilsRulerCalculator
Topics covered: Section A – Question 1: Challenges of Natural hazards – 33 marks – answer all questions
Section B – Question 2: The living world – 25 marks – answer all questions
Section C: Question 3 – Coasts – 15 marksQuestion 4 – Rivers – 15 marks
Question types: multiple-choice, short answers, 2 x 9 markers
Natural hazards pose major risks to people and property
Key terms:
• Natural hazard = A natural event that threatens people or has the potential to cause damage, destruction and death. E.g earthquakes/volcanoes.
Section A: The challenge of natural hazards

Tectonic hazards – movement of the crusts plates
• Volcanoes• Earthquakes• Tsunamis
Atmospheric hazards – occur due to changes in temperatures
• Hurricanes• Tornadoes• Drought
Geomorphological hazard – occur on the surface of the earth
• Flooding• Landslides• Mudflows
Biological hazards – involved living organisms
• Forest fires
• Natural disaster = A natural hazard that has already happened• Extreme events that do not pose any threat to human activity are not
counted as hazards e.g. an avalanche in Antarctica.Types of natural hazard:
The factors affecting the hazard risk from natural hazards:
Hazard risk = the probability (chance) that a natural hazard occurs.• URBANISATION - Most people now live in cities and densely populated areas are
at most risk of damage from natural events e.g. living on a floodplain in Bangladesh.
• POVERTY - This forces people, especially in LICs, to live in these places e.g. unstable buildings or on unstable land. They do not have the capacity to cope with events e.g. due to money.
• CLIMATE CHANGE - Warmer airs lead to hurricanes an droughts and wetter areas are prone to more floods e.g. more frequent natural hazards.
• FARMING - River water contains silt which makes farm land fertile. Living on these floodplains is dangerous due to flood risk
Why do people live in areas that are prone to natural disasters?
Cannot predict the timing, location or magnitude Cannot move due to money, lack of knowledge or language barrier Worth staying for jobs and resources Don’t want to go as it might not happen and there are defences in place
TECTONIC HAZARDS
Earthquakes and volcanic eruptions are the result of physical processes
1) Tectonic plates The earth’s surface is split into huge floating plates (tectonic plates)

*The place where tectonic plates meet = plate margins/boundaries*
2) The Earth’s structure:
CONTINENTAL CRUST OCEANIC CRUSTThick (20-200km) Less denseFormed of granite rockFloatsIs not destroyedOld at up to 3.8 billion years old
Thin (5-10km)DenseFormed of basaltic rockSinksRecycled at destructive marginsLess than 200 million years old
3) Plate Tectonic Theory
Crust = Rock. This is divided into tectonic plates (two types of crust = continental and oceanic).Mantle = Semi-molten rock: Magma. The upper part of the mantle is called the asthenosphere which is a bit like a plastic. It moves slowly.Inner core = Rock Outer core = Liquid.

There is the idea that the world was once joined together in a super continent called PANGEA. Alfred Wegner’s theory of ‘continental drift’ explains how the plates have moved apart.
WEGNER’S EVIDENCE:
1. Continental fit Some continents seem to fit together if placed beside each other e.g. Western Africa and Eastern America.
2. Geological Evidence Rocks of the same age and type displaying the same formations are found in South-East Brazil and South Africa.Similar glacial deposits are found in Antarctica, South America and India despite being thousands of km apart.
3. Climatological evidence Places far apart like Antarctica, North America and the UK all contain coal deposits of a similar age that were formed in tropical conditions. They are no longer in tropical climate zones so must have moved.
4. Biological evidence Similar fossils are found on either side of the Atlantic e.g. a reptile (Mesosaurus) is found only in South American and South African sediments.
*HOWEVER WEGNER COULD NOT PROVE HOW THE PLATES HAD MOVED APART*
Theories of plate movement:
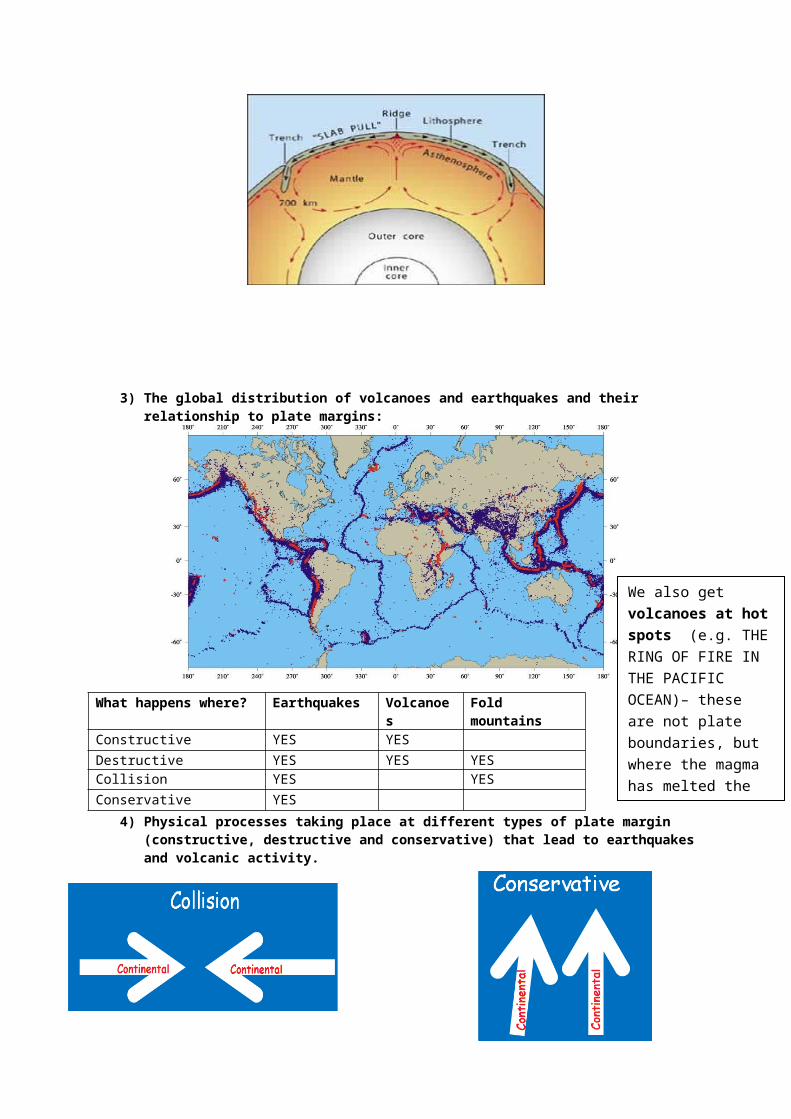
1) Convection currents in the mantle:
The core’s temperature is around 6000c. This causes magma (molten rock) to rise into the mantle and sink towards the core when it cools. The currents flow beneath the lithosphere, building up lateral pressure (pressure going upwards) and carrying the plates with them. Only limited evidence of this theory has been found.

2) Slab-pull theory:
At constructive plate margins there are ocean ridges (high bits of land) above the ocean floor. Beneath these ocean ridges, the mantle melts and the molten magma rises as the plates move apart and cools down to form new plate material. As the lithosphere cools it becomes denser and starts to slide down, away from the ridge which causes the plates to move away from each other. This is called ridge push.
Additionally, as destructive plate margins the denser plate sinks back into the mantle under the influence of gravity which pulls the rest of the plate along behind it. This is called slab pull.
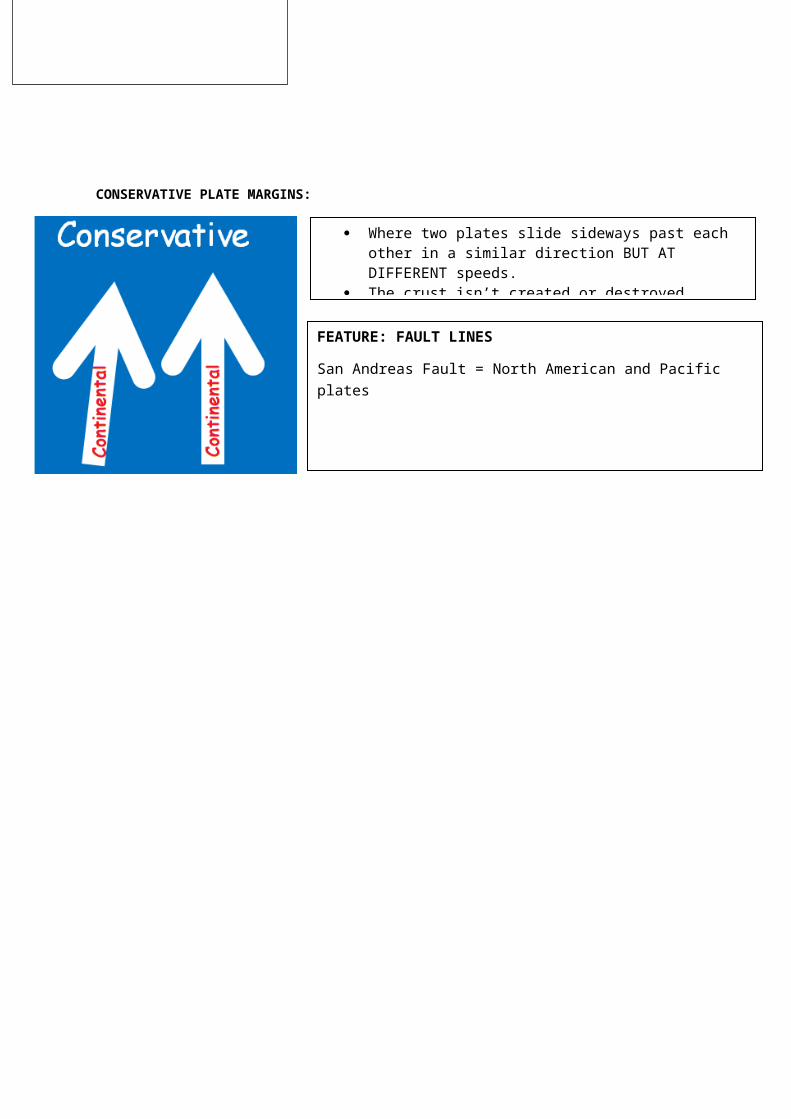
3) The global distribution of volcanoes and earthquakes and their relationship to plate margins:
4) Physical processes taking place at different types of plate margin (constructive, destructive and conservative) that lead to earthquakes and volcanic activity.
CONSTRUCTIVE PLATE MARGINS:
We also get volcanoes at hot spots (e.g. THE RING OF FIRE IN THE PACIFIC OCEAN)– these are not plate boundaries, but where the magma has melted the mantle in the ocean.
1. At constructive margins, the upper part of the mantle melts and the hot molten magma rises.
2. As the tectonic plates are moved away from each other by slab pull, ridge push or a combination of these, the molten magma rises in between and cools down to form solid rock. This forms part of the oceanic plate. The new solid plate sometimes fractures as it is moved, causing earthquakes. These shallow earthquakes are usually small and not violent.
3. Much of the magma never reaches the surface but it is buoyant enough to push up the crust at constructive margins to form ridge and rift features.
In a few places the magma erupts on to the
FEATURE = RIFT VALLEYAs the plates move apart the land drops either side of the valley.E.G. The East African Rift Valley
What happens where?
Earthquakes Volcanoes
Fold mountains
Constructive YES YESDestructive YES YES YESCollision YES YESConservative YES

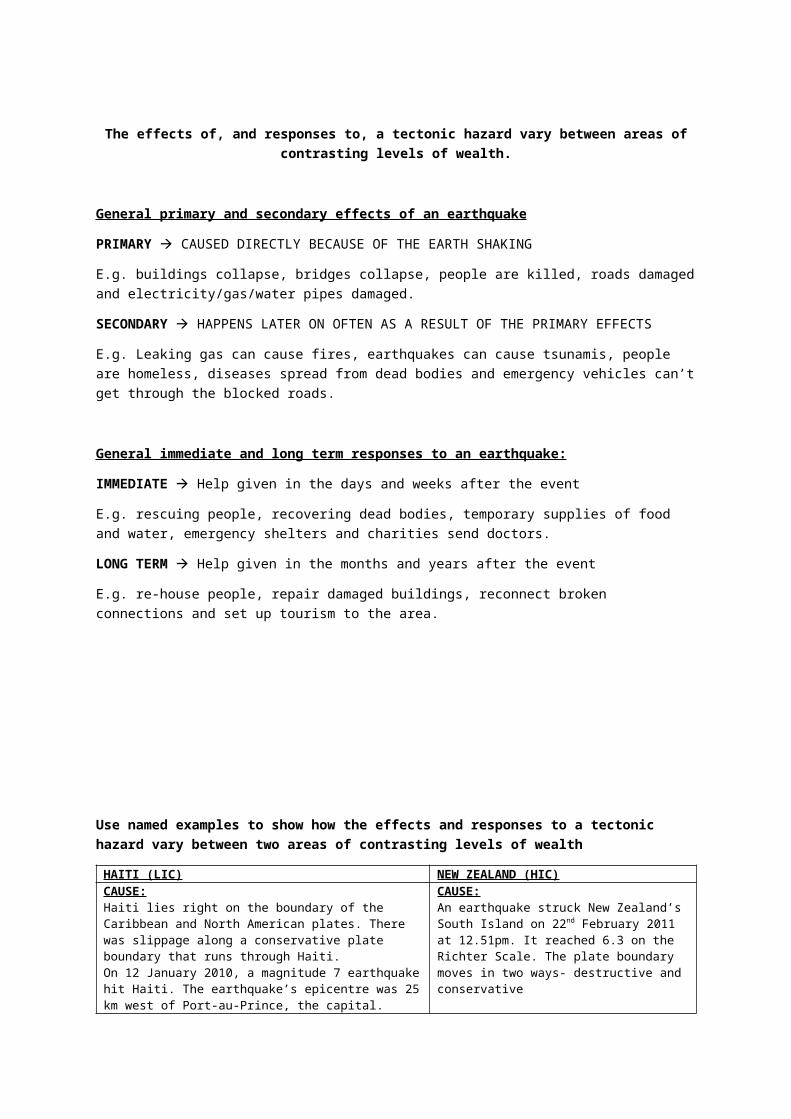
DESTRUCTIVE PLATE MARGINS/ COLLISION PLATES:
CONSERVATIVE PLATE MARGINS:
1. At constructive margins, the upper part of the mantle melts and the hot molten magma rises.
2. As the tectonic plates are moved away from each other by slab pull, ridge push or a combination of these, the molten magma rises in between and cools down to form solid rock. This forms part of the oceanic plate. The new solid plate sometimes fractures as it is moved, causing earthquakes. These shallow earthquakes are usually small and not violent.
3. Much of the magma never reaches the surface but it is buoyant enough to push up the crust at constructive margins to form ridge and rift features.
In a few places the magma erupts on to the
FEATURE = RIFT VALLEYAs the plates move apart the land drops either side of the valley.E.G. The East African Rift Valley
The pressure and strain of an oceanic and continental plate moving towards each other can cause the Earth’s crust to crumple and form fold mountains. As the plates converge, pressure builds up. The rocks eventually fracture, causing an earthquake, which can be very destructive.
The oceanic plate, as the denser of the two plates, is subducted or pulled down into the mantle beneath the lighter (and thicker) continental plate under gravity. At the surface this creates a deep ocean trench. As the oceanic plate sinks deeper into the mantle, it causes part of the mantle to melt.
Hot magma rises up through the overlying mantle and lithosphere, and some can eventually erupt out at the surface producing a linear belt of Volcanoes. The magma becomes increasingly viscous (sticky) as it rises to the surface, producing composite volcanoes which are steep sided and have violent eruptions.
FEATURES:Ocean trenches = An ocean trench is the groove that is made in the ocean bed where the oceanic pate is subducted beneath the continental crust.Fold Mountains = When two plates collide and get crumpled upwards to form a mountain e.g. the Alps.
Where two plates slide sideways past each other in a similar direction BUT AT DIFFERENT speeds.
The crust isn’t created or destroyed.
FEATURE: FAULT LINESSan Andreas Fault = North American and Pacific plates

5) Volcanoes Destructive plate margins the oceanic plate sinks under the continental
plate because it is more dense. The oceanic plate moves down into the mantle where it is melted and destroyed. A pool of magma forms. The magma rises through cracks in the crust called vents. The magma erupts onto the surface (where it is called lava) = COMPOSITE VOLCANO
Constructive plate margins The magma rises up into the gap created by the plates moving apart forming a SHIELD VOLCANO.
Some volcanoes form over parts of the mantle that are really hot = HOTSPOTS (e.g. Hawaii)
When a volcano erupts it emits lava and gases. Some volcanoes emit lots of ash which can cover the land and block out
the sun and form pyroclastic flows (super heated currents of gas, ash and rock).
6) Earthquakes Earthquakes are caused by tension that builds up at all types of margin. The plates eventually jerk past each other sending out shock waves = earthquake The shock waves spread out from the focus (the point in the Earth where the
earthquake starts). NEAR THE FOCUS THE WAVES ARE STRONGER = MORE DAMAGE.
The epicentre is the point above the Earth’s surface which is straight above the focus.
Earthquakes are measured by two scales:
The Mercalli scale - describes the intensity of an earthquake based on its observed effect e.g. buildings falling down. It is measured in Roman numerals and has 12 descriptors to choose from. The Richter scale - describes the earthquake's magnitude (energy released by an earthquake) by measuring the seismic waves that cause the earthquake. It is measured on the Richter Scale where the scale is logarithmic e.g. a mag 7 earthquake is 10 times bigger than a mag 6 earthquake.
The effects of, and responses to, a tectonic hazard vary between areas of contrasting levels of wealth.
General primary and secondary effects of an earthquake
PRIMARY CAUSED DIRECTLY BECAUSE OF THE EARTH SHAKING
E.g. buildings collapse, bridges collapse, people are killed, roads damaged and electricity/gas/water pipes damaged.SECONDARY HAPPENS LATER ON OFTEN AS A RESULT OF THE PRIMARY EFFECTSE.g. Leaking gas can cause fires, earthquakes can cause tsunamis, people are homeless, diseases spread from dead bodies and emergency vehicles can’t get through the blocked roads.
General immediate and long term responses to an earthquake:
IMMEDIATE Help given in the days and weeks after the eventE.g. rescuing people, recovering dead bodies, temporary supplies of food and water, emergency shelters and charities send doctors.LONG TERM Help given in the months and years after the eventE.g. re-house people, repair damaged buildings, reconnect broken connections and set up tourism to the area.
Use named examples to show how the effects and responses to a tectonic hazard vary between two areas of contrasting levels of wealth
HAITI (LIC) NEW ZEALAND (HIC)CAUSE:Haiti lies right on the boundary of the Caribbean and North American plates. There was slippage along a conservative plate boundary that runs through Haiti.On 12 January 2010, a magnitude 7 earthquake hit Haiti. The earthquake’s epicentre was 25 km west of Port-au-Prince, the capital.
CAUSE:An earthquake struck New Zealand’s South Island on 22nd February 2011 at 12.51pm. It reached 6.3 on the Richter Scale. The plate boundary moves in two ways- destructive and conservative
EFFECTSPrimary effects:
3 million people affected. Over 230,000 deaths – 300,000 injured – 50 hospitals collapsed 30,000 commercial buildings collapsed –
primary effect Airport and port damaged (Port Au-Prince)
Secondary effects: Businesses destroyed – Damage to the main clothing industry 20% of people were left without a job 1.3 million homeless
Primary effects 181 people killed in total Road and bridges were severely
damaged in places Christchurch’s cathedral spire
was damaged Canterbury Television (CTV)
building collapsed. This was 6 storeys high
Secondary effects 1000 people were left homeless Review of all building codes to
make buildings stronger Fires spread due to gas pipes
catching fireImmediate responses
Neighbouring Dominican Republic provided emergency water and medical supplies
Immediate Responses The Australian Government
donated NZ$6 .7 million to the

as well as heavy machinery to help with search and rescue.
Emergency rescue teams arrived from a number of countries, eg Iceland.
Temporary field hospitals were set up by the Red Cross.
United Nations troops and police were sent to help distribute aid and keep order.
Long term responses Money was pledged by organisations and
governments to assist in rebuilding e.g. Port Au-Prince, but only slow progress had been made after one year.
After one year, there were still 1,300 camps. ‘Cash for work’ programs are paying
Haitians to clear rubble. Schools are being rebuilt.
Red Cross appeal to rebuild the area
Bottled water was provided as water supplies were cut off
27,000 chemical toilets were flown into the area as sanitation and sewerage works were damaged
Electricity companies worked around the clock to restore power to areas that were cut off
Search and rescue teams came from New Zealand, Australia, UK, USA, Japan, Taiwan, China and Singapore
Long term Responses Review of all building codes to
make buildings stronger Total cost of rebuilding was $40
billion which included buildings like the CTV building
OVERALL: HAITI DID NOT HAVE THE INFRASTRUCTURE OR MONEY TO COPE WITH THE EARTHQUAKE
OVERALL: NEW ZEALAND HAD THE INFRASTRUCTURE, KNOWLEDGE AND MONEY TO COPE WITH THE EARTHQUAKE
Management can reduce the effects of a tectonic hazard
Reasons why people continue to live in areas at risk from a tectonic hazard:
1) They’ve always lived there and moving away would mean leaving family.2) They’re employed in the area and moving away would mean getting a new job.3) They’re confident in the support of their government after an earthquake or
volcano e.g. rebuild houses.4) Some people don’t think earthquakes or volcanoes will happen in their area.5) The soil around volcanoes is fertile because it is full of minerals from the volcanic
ash and lava. This makes it good for growing crops which attracts farmers.6) Volcanoes are tourist attractions and lots of tourists visit volcanoes. This gives
people jobs.7) Volcanoes can produce geothermal energy.
Management can reduce the effects of tectonic hazards:
MONITORINGSeismometers and lasers monitor earth movement to predict for earthquakes.
Volcanoes give off signs such as sulphur dioxide gas or bulges to indicate magma is rising.
PREDICTIONMonitor tectonic plate movement
Well monitor the volcano to predict when it will go off so people can evacuate
Sometimes you can’t predict them!
PROTECTIONBuildings are designed to withstand earthquakes e.g. steel frames.
Automatic shut off switches to gas and electricity in case there is an earthquake.
PLANNINGEmergency services prepare for disasters.
People educated on what to do if there is an earthquake e.g. Japan.
Emergency supplies e.g. food are stockpiled.
WEATHER HAZARDS
Global atmospheric circulation helps to determine patterns of weather and climate
General atmospheric circulation model: pressure belts and surface winds
Air circulates between high and low pressure belts as surface winds:1) Winds are large scale movements of air caused by differences in air pressure.2) Differences in air pressure are caused by differences in temperature between the
equator and the poles. Winds move FROM the areas of high pressure TO the areas of low pressure.
3) Winds are part of global atmospheric circulation loops (or cells). These loops have warm rising air which creates low pressure belt.
4) There are loops in each hemisphere and it works as below:
At the equator the sun warms the Earth which transfers heat to the air above causing it to rise. This creates a low pressure belt with rising air, clouds and rain.
As the air rises it cools and moves out to 30 degrees north and south of the equator.

30 degrees north and south of the equator the cool air sinks, creating a high pressure belt with cloudless skies and very low rainfall.
The cool air reaches the ground surface and moves as surface winds either back to the equator or towards the poles:
-Surface winds blowing towards the equator are called trade winds. They blow from the SE in the Southern Hemisphere and NE in the Northern Hemisphere. At the equator the trade winds meet and are heated via the sun. This caused them to form clouds.
-Surface winds blowing towards the poles are called westerlies. They blow from the NW in the southern hemisphere and SW in the northern hemisphere.
60 degrees north and south of the equator, the warmer surface winds meet colder air from the poles. The warmer air is less dense than the cold air so it rises and creates low pressure.
Some of the air moves back towards the equator and the rest moves towards the poles.
At the poles the cool air sinks and creates high pressure. The high pressure air is drawn back towards the equator as surface winds.
Global atmospheric circulation causes areas to have some types of weather more often e.g. the UK has lots of low pressure weather that are blown in from the Atlantic Ocean on westerly winds. This brings wet and windy weather.
Tropical storms (hurricanes, cyclones and typhoons) develop as a result of particular physical conditions.
Global distribution of tropical storms (hurricanes, cyclones and typhoons)
Mainly occur in South East Asia, the Indian Ocean and the South West Pacific Ocean.4An understanding of the relationship between tropical storms and general atmospheric circulation and the causes/formation of them:
1) Tropical storms occur when the sea temperature is 27c or higher and when the wind shear (the difference in windspeed) between higher and lower parts of the atmosphere is low.
2) Warm, moist air rises and condensation occurs. This releases huge amounts of energy which makes the storms powerful. The rising air creates an area of low pressure which increase the surface winds.
3) Tropical storms move towards the west because of the easterly winds near to the equator.
4) The earth’s rotation deflects the path of the winds which then causes the storm to spin (Coriolis effect).
5) The storm gets stronger due to the energy from the warm water so the wind speeds increase. As the air rises and cools it forms massive cumulonimbus clouds which cause torrential rainfall.
6) Cold air sinks in the eye so it is calm there and not very windy. 7) They lose strength when they move over land or cooler water because the energy
supply from the warm water is cut off.8) Most tropical storms occur between 5-30 north and south of the equator as any
further from the equator means that the water isn’t warm enough.

9) Most of the storms occur in the northern hemisphere (over the Pacific) in late summer and autumn when the temperatures are highest.
The structures and features of a tropical storm:
Tropical storms are circular in shape. Usually last 7-14 days. They spin anticlockwise in the Northern hemisphere and clockwise in the Southern
hemisphere. The centre of the storm = THE EYE = Up to 50km across and is caused by falling
air. It is very low pressure – no wind, rain and high temps. The eye is surrounded by the EYEWALL here there is spiralling rising air,
strong winds (160km per hr), torrential rain and low temps. Towards the edges of the storm the wind speed falls, the clouds become
smaller and more scattered, the rain becomes less intense and temperatures increase.
*Hurricanes are measured on the Saffir Simpson Scale according to their wind speed- category 1= not much damage but category 5 = damage beyond repair*
How climate change could affect the distribution, frequency and intensity of tropical storms:
1) Global temperatures are expected to rise as a result of climate change. This means that more oceans could be above 27c so more places may experience tropical storms.
2) Oceans will stay at 27c for more of the year so the number of storms could increase every year (frequency).
3) Higher temps will mean that tropical storms are stronger (by 2-11%) and could cause more damage (intensity).
4) Using previous data will not be accurate as storms will get worse so there is uncertainty around tropical storms.

Tropical storms have significant effects on people and the environment
General primary and secondary effects of a tropical storm
PRIMARY CAUSED DIRECTLY BECAUSE OF STORME.g. buildings collapse, bridges collapse, people are killed, roads damaged, people drown and electricity/gas/water pipes damaged.SECONDARY HAPPENS LATER ON OFTEN AS A RESULT OF THE PRIMARY EFFECTSE.g. People are homeless, shortage of clean water, diseases spread from dead bodies and shortage of crops due to them being swept away.
General immediate and long term responses to a tropical storm:
IMMEDIATE Help given in the days and weeks after the eventE.g. rescuing people, recovering dead bodies, temporary supplies of food and water, emergency shelters and charities send doctors.LONG TERM Help given in the months and years after the eventE.g. re-house people, repair damaged buildings, reconnect broken connections and set up tourism to the area.
Use a named example of a tropical storm to show its effects and responses: Typhoon Haiyan (2013)

Causes: Typhoon Haiyan was a tropical cyclone that affected the Philippines in South East Asia in November 2013. It was one of the strongest tropical cyclones ever recorded with winds of 313 km/h. In some areas, 281.9 mm of rainfall was recorded, much of which fell in under 12 hours. Waves of up to 7 m in height battered the coast. The Philippines is a fairly poor part of the world with minimal investment in prediction, planning and protection schemes.Economic effects
The overall economic impact of Typhoon Haiyan is estimated at $5.8 billion (£3.83 billion).
Six million workers lost their sources of income. Major rice, corn and sugar-producing areas for the Philippines were destroyed
affecting the country's international trade and farmers' incomes.
Social effects
More than 7,000 people were killed by Typhoon Haiyan. 1.9 million people were left homeless and more than 6,000,000 displaced. There were outbreaks of disease due to the lack of sanitation, food, water, shelter,
and medication. In the city of Tacloban, widespread looting took place in the days following the
typhoon.
Environmental effects
Widespread floods damaged and in many cases destroyed homes and businesses in coastal areas.
Thousands of trees were uprooted leading to a massive release of carbon dioxide and loss of habitat with resulting effects on wildlife.
Major roads were blocked by trees, and were impassable. Responses
Even though the loss of life was significant, it could have been much worse if not for the efforts of the Philippines' meteorological agency. It broadcast warnings leading to the evacuation of approximately 750,000 residents.
The UK government provided food, shelter, clean water, medicine and other supplies for up to 800,000 victims.
Several charities provided emergency aid such as water, food and shelter. The United Nations launched an international aid appeal in December 2013 for
£480 million to finance the humanitarian relief effort for 2014.
How monitoring, prediction, protection and planning can reduce the effects of tropical storms.
MONITORING
SATELLITES-The classic cloud pattern is monitored-Rain clouds at 16km in the sky
PREDICTION
In 2013, NOAA developed two super computers to give 5 days warnings and
PROTECTION
Buildings have areas of weakness which can be reinforced. FEMA advises home owners to:
-install hurricane straps
PLANNING
American National Hurricane Preparedness Week in May encourages people to plan what they need.

indicate a tropical stormThe Global Precipitation Measurement satellite monitors the clouds 65 degree north and south of the equator to look for these clouds
AIR CRAFT-Drones from planes fly through tropical storms at 10,000 feet to collect data on air pressure, rainfall and wind speed.-NASA monitors weather patterns across the Atlantic using unmanned aircraft called Global Hawk. This monitors the data
an accurate location of within 400 kmThe National Hurricane centre in Florida predicts a tropical storms path for 7 days using ‘track clone’. This is 70% accurate.Early warnings are issued so people have time to evacuate due to prediction. However some people do not both as it is costly, time consuming and not always accurate
(metal strips) between roofs and walls-storm shutter on windows-install emergence generators-tie down objects like garden furniture that could blow away-reinforce garage doors-remove trees close to buildings
Trees and mangroves can reduce wind energy can trap debris
Do not build on low lying areas
Build levees and flood walls to reduce the impact of a storm surge (like a tsunami wall of water) Build a house on stilts
For example:-supply kits (long life food and medical kits)-fuel in cars-knowing where evacuation centres are-storing loose objects
The UK is affected by a number of weather hazards
An overview of the types of weather hazard experienced in the UK:
RAINToo much rain in too short time can cause flooding which can disrupt homes and possessions, disrupt transport networks and cause death by drowning.
It can also force businesses to close and recovering from flooding can cost
WINDStrong winds (gales) can damage properties and cause disruption to transport.
Unrooted trees and debris can injure people.
Winds are very strong in coastal areas of the UK
SNOW AND ICESnow and ice can cause injuries due to slipping and deaths due to the cold.
Schools and businesses can be force to shut and lots of disruption to road and rail.
Can damage crops.

millions of pounds.
E.g. wet winter during 2014E.g 2005 in Birmingham E.G. Beast from the east
2018HAILSTORMSCan make driving very dangerous and can damage property
HEAT WAVES/DROUGHTS
Water supplies are low during a drought which can cause crop failures.
Can cause people breathing difficulties e.g. pollution builds up due to heat wave.
THUNDERSTORMS:Heavy rain, lightening and strong winds can cause death and damage. It can also cause fires.
*You need to know an example of a recent extreme weather event in the UK – remember that time when you were off school having snow days!!! (see next page)*
An example of a recent extreme weather event in the UK: The Beast From The East/Storm Emma February 2018
CAUSES:
1. The Beast from the East (25 February) was caused by a change to the northern polar jet stream, which twisted its direction unexpectedly, drawing in cold air to the UK from the east.
2. This bending was caused by a jump in temperatures high over the Arctic.
3. This unexpected warming weakened the jet stream that brings warm air in from the Atlantic to Ireland and Britain, this allowed COLD air in from the East
4. So cold air from thousands of miles away is dragged over to us, bringing a severe chill – though the air is a lot warmer when it arrives at our doorstep, having
Primary effects1. A man died in London after being pulled from a frozen lake, whilst there were 3 other reported deaths2. Gusts of 60-70mph in parts of northern England and Wales destroying houses.3. Rural areas experienced temperature lows of -12°C4. Snow drifts were as high as 7m in placesSecondary effects1. British Airways cancelled hundreds of short-haul flights from Heathrow, and London City Airport also cancelled many services.

risen from -50°C.5. This air picked up moisture over the
North Sea bringing SNOW6. This affected mainly the East coast and
dumped a huge amount of snow on the UK
7. Then on the 1st of March a depression called Storm Emma started to move in from the SE (from the Atlantic) across Cornwall causing even more snow as it hit the cold air sat over the UK. This caused the Met Office to issue Red weather warnings.
2. Hospitals in Glasgow, Grimsby, Scunthorpe and Goole cancelled all outpatient appointments.3. Hundreds of people were trapped in their vehicles for hours, on the A31. 4. The AA estimated that there were 8,260 collisions on Britain’s roads from the snow chaos in just three days, with the insurance cost above £10m. 5.Some supermarkets saw a rush of customers. There were reports of shelves being stripped of bread, milk and soup.
Management/Responses1.Stranded drivers were given foil blankets2. Army and Royal Air Force personnel were called in to ferry health workers through blocked roads in Lincolnshire and in Scotland. Ten RAF 4x4 vehicles with 20 airmen began transporting health staff from dawn in Lincolnshire after an urgent request from local police.3. Councils had to lend out gritters and snow ploughs to clear the roads4. Drivers of a Greggs Delivery van, stuck on the A1 near Newcastle, gave out free food to stranded drivers5. The Met Office issued "red Warnings" for several areas, including the belt between Edinburgh and Glasgow, and6. Public Health England (PHE) urged people to plan ahead to ensure they have enough food and medicine.7. Rail passengers were warned to avoid travelling to or from Scotland on Thursday while in Kent 50 stations closed.
Evidence that weather is becoming more extreme in the UK:
1) Temperatures have become more extreme in recent years e.g. Dec 2010 was the coldest for over 100 years
2) It is raining more e.g. Dec 2015 was the wettest month ever recorded.3) Major flooding occurs often e.g. Cumbria 2009
Responding to extreme weather in the UK:
TWO APPROACHESTO MANAGING THE RISKS OF EXTREME WEATHER IN THE UK:
Top down: These are simply where the government and people in charge of the country manage the risks of extreme weather in the UK and people rely on them.
E.g. hosepipe bans, clearing the roads with grit during the snow
Bottom up: When citizens of a country make their own actions to increase their resilience (the ability to bounce back) to hazards.
E.g. mobile phone warnings

CLIMATE CHANGE
Climate change is the result of natural and human factors and has a range of effects
Evidence for climate change from the beginning of the Quaternary period to the present day:
Climate change is any significant change in the Earth’s climate over a long time. The climate is constantly changing and always will do.
The quaternary period is the most recent geological period and it spans from 2.6 million years ago to the present day.
In the period before the Quaternary, the Earth’s climate was warmer and stable, but then things changed.
During the quaternary, global temperature has shifted between cold glacial periods that last for around 100,000 years and warmer interglacial periods that last for around 100,000 years.
The last glacial period ended 15,000 years ago and since then the climate has been warming.
Global warming is the term used to describe the sharp rise in global temperatures over the last century and is a type of climate change.
Evidence of climate change:
Modern evidence (temperature records):
• Climate change is the long-term change in the weather• Occurs over thousands of years• Earth’s average surface air temperature has increased by approximately 1 degree
Celsius over the last 100 years• Sea-levels have risen by 19cm since 1900 – due to thermal expansion and ice
sheets melting• Ocean temperatures are the warmest they have been since 1850• World’s glaciers and ice sheets are decreasing in size• Antarctica loses 134 billion tonnes per year
Past evidence:
TREE RINGS:As a tree grows it forms a new ring each year – the tree rings are thicker in warm, wet conditions.
Scientists take cores and count the rings to find the age of a tree. The thickness of each ring show
ICE CORES:Ice sheets are made up of layers of ice – one layer is formed each year.
Scientists drill into ice sheets to get long cores of ice.
By analysing the gases trapped in the layers of ice they can tell what
OCEAN SEDIMENTS:
The remains of organisms found in cores taken from ocean sediments can also be analysed. These can extend the
FOSSIL POLLEN:
Pollen from plants gets preserved in sediment, e.g. at the bottom of lakes or in peat bogs.
Scientists can identify the preserved pollen to show which species were living at that time.

what the climate is like.
Tree rings are a reliable source of evidence of climate change for the past 10,000 years
the temperature was each year.
Oxygen isotopes (the amount of oxygen in the ice) are used to estimate temperatures.
One ice core from Antarctica shows the temperature changes over the last 400,000 years
temperature record back at least 5 million years.
Plankton can reveal information such as past surface water temperatures and levels of oxygen and nutrients
Scientists know the conditions that plants live in now, so preserved pollen form similar plants shows that climate conditions were similar.
The causes of climate change:
HUMAN – Caused by manPHYSICAL/NATURAL – Caused naturallyPhysical causes of climate change:
SOLAR OUTPUT
The amount of energy given off by the sun can be measured by observing sunspots.
Sunspots = A dark patch that appears from time to time on the sun.
Lots of sunspots = lots of solar energy = warm
Over the last 50 years, the amount of sunspots have not changed so this shows that solar energy alone can not be responsible for climate change.
VOLCANIC ACTIVITY:
Violent volcanic eruptions blast lots of ash, gas and liquids into the atmosphere.Volcanic ash can block out the sun causing the temperature to drop.Sulphur dioxide can turn to sulphuric acid after an eruption and reflect the radiation from the sun.When there is a cooling of the atmosphere = a volcanic winter.
ORBITAL CHANGES:
The way the Earth moves around the sun changes. For example, the path of the Earth’s orbit around the sun changes from an almost perfect circle to an ellipse (an oval) and back again over 96,000 years.These changes affect the amount of solar radiation the Earth receives. If the Earth receives lots of energy then it gets warmer.Orbital changes may have caused glacial and interglacial cycles in the Quaternary
Human causes of climate change:
What is the enhanced greenhouse effect?
• The atmosphere allows most of the heat from the sun (short wave radiation) to pass straight through to warm up the Earth’s surface.
• However, when the Earth gives off heat in the form of long-wave radiation, some gases, such as carbon dioxide and methane (caused by huamns) are able to absorb it.
• Therefore, the greenhouse effect keeps the Earth warm.Causes of the greenhouse effect:
Burning fossil fuels, farming (e.g. cows produce methane when they trump), deforestation increases the amount of c02 in the air and cement production releases lots of c02.
Overview of the effects of climate change on people and the environment
ENVIRONMENT Glaciers shrink Sea level rise due to glaciers melting e.g. AntarcticaSea ice shrinks – loss of polar habitatsLow lying areas e.g. Maldives floodWater temps increasing causes the bleaching of coral in Australia Less ice could lead to oil being extracted and spilt in Antarctica
SOCIALMore deaths due to heat wavesLow lying areas e.g. Maldives flood and people lose their homes. Less water availability so there could potentially be wars e.g. Mali Loss of crops e.g. Mexico 12% less maize UK could grow grapes for wine
Managing climate change
Two ways:
• Mitigation = deals with the cause of the problem. The solutions reduce or prevent greenhouse gases being released to lessen climate change.

Alternative energy production Reducing fossil fuels and using
renewable energy supplies to reduce ghg emissions from power stations.
In the UK more offshore wind farms have been built and some tidal power projects have been explored
International agreements From 1997 most countries in the
world agreed to monitor and cut their ghg emissions by signing the Kyoto Protocol.
Each country was set a target e.g. the UK agreed to reduce emissions by 12.5% by 2012. The UK met its target actually reducing co2 emissions by 2%.
The EU has agreed to cut emissions by 20% from 1990 levels by 2020.
BUT SOMETIMES NOT ALL COUNTRIES SIGN IT E.G. THE USA DID NOT.
Planting trees (afforestation) Planting trees increases the amount of
co2 absorbed by the atmosphere. UK has a $24.9 million project to
reduce deforestation in the Amazon Rainforest and recover over 1000 hectares of rainforest.
Carbon capture Carbon capture and storage is a new
technology designed to reduce c02 by reducing the emissions from fossil fuels by power stations. It involves capturing c02 and transporting it to a place where it can be stored safely underground.
• Adaptation = responds to the impacts of climate change and tries to make a population less vulnerable
CHANGING AGRICULTURAL SYSTEMS:
It may be necessary to plant new crop types that are more suitable to grow in new climate conditions e.g. soya, peaches and grapes in Southern England.
In some regions, biotechnology is being used to create new crop varieties which are more resistant to extreme weather events e.g. drought resistant millet grown in Kenya.
However, a lot of farmers are becoming very poor as they do not have the money to make the changes.
MANAGING WATER SUPPLY:
Dry areas are expected to get drier with more shortages.
Water meters can be installed to stop people using lots of water.
Rainwater can be collected and waste water recycled to make more water available.
Reducing demand: As Mayor of London, Boris Johnson developed a Water Strategy to reduce London’s water demand. By 2030, all London homes should have been offered a free package of water-efficient devices.
Increasing supply: Thames Water opened a desalination plant in Beckton in 2010 to increase water supply. Water is taken from the River Thames at low tide (when it is least salty). A process called reverse osmosis is used to produce

drinking water for 400,000 homes. The plant requires a lot of energy (enough to power 8,000 homes), so carbon emissions need to be offset by a biodiesel electricity plant.
COPING WITH RISING SEA LEVELS: Sea levels are expected to rise by 82cm by 2100. Physical defences such as flood barriers could be built and better flood warning
systems put into place e.g. the Thames barrier in London can be closed to prevent damage to the city.
In areas that can’t afford expensive flood defences e.g. Bangladesh then people are building their houses on top of earth embankments and building raises flood shelters to use in emergencies.
*YOU NEED TO ANSWER THIS AND THE COLD ENVIRONMENTS SECTION*
Ecosystems are made up of:
-Living things (plants, animals and bacteria)= BIOTIC FACTORS-Non-living things (such as climate and soil) = ABIOTIC FACTORS*They can be at a small scale e.g. a hedgerow or a large scale e.g. tropical rainforest*
Key words:
Ecosystem =The living and non-living components of an environment and the interrelationships that exist between themBiome = A global scale ecosystem.Habitat = Small areas of an ecosystem where a particular species may live.Adaptations = The ways that plants evolve to cope with certain conditions, such as lots of rainfall.Producers = Plants use sunlight, water and nutrients from the soil to produce their own food.Consumers = Animals get their energy by feeding on plants or each other.
Section B: The living world

Food chain = A line of links between producers and consumers.Food web = A diagram that shows all the links between producers and consumers in an ecosystem.Scavengers = Organisms that eat dead animals or plants.Decomposers = Fungi and bacteria eat the dead/waste material and make things break down and rot. They recycle nutrients for the plants to use again.Nutrient cycling =The recycling of nutrients between living organisms and the environment
food chain:
Food web:

An example of a small scale UK ecosystem to illustrate the concept of interrelationships within a natural system : A hedgerow
A hedgerow includes the plants that make up the hedgerow, the organisms that live in it and feed on it, the soil in the area and the rainfall/sunshine it receives.
The producers include hawthorn bushes and blackberry bushes The consumers include thrushes and ladybirds
The balance between components of an ecosystem and the impact on an ecosystem of changing one component:
Some parts of an ecosystem depend on the others e.g. consumers depend on producers for a source of food and some depend on them for a habitat. So if one part changes then it affects all other parts.E.g. Hedgerow
Hot dry summer reduced plants fewer berries for birds in winter number of sparrows and thrushes fall fewer birds for sparrowhawks to hunt so sparrowhawk numbers fall.
Factors that can change the balance in ecosystems:
1) Climate change: May cause droughts so plants may die2) Population growth: May cause more plants to be used as sources of food so less
plants around.3) Fertilisers Put on plants to grow but can be washed into the rivers and cause
eutrophication which can cause fish to die.
The nutrient cycle:

Ecosystems rely on two processes:1) Recycling nutrients Nutrients constantly go round the ecosystem.2) Energy flows Ecosystems work because there is energy flows in them. The
main source is the sun absorbed by plants in photosynthesis energy passed through system in food chain
An overview of the distribution and characteristics of large scale natural global ecosytems:
Distribution = where ecosystems are found and why
*Remember that if you get a map you need to use countries, continents and compass directions**You also need to know where ecosystems are located off by heart as you will not always get a map!*Tropical Rainforest
• They are found close to the equator (approximately 0°-20° north and south of the equator).
• Mainly found between the Tropic of Cancer and the Tropic of Capricorn• They are not found in Europe• The largest rainforest is the Amazon in South America.• Hot and wet all year around, dense canopy of vegetation

Hot Desert
• Close to the Tropics of Cancer and Capricorn.• They are found 15° to 30° north and south of the Equator.• Mainly found in North Africa (the Sahara) and the Middle East (between the
Tropics of Cancer and Capricorn)• Little rainfall, hot during day and cold at night
Deciduous Forest
• They are found roughly between 40˚ and 60˚ north and south of the equator.• Mainly found over Europe.• There are none in South America.• Sherwood Forest is an example in the UK• Summers are warm; trees lose their leaves
Polar and Tundra:
• Found outside the tropics of cancer and Capricorn• Found mainly in the northern hemisphere e.g. Greenland • Not found near the equator • Little rainfall, hardly any trees, permafrost
Grasslands:
Found between the tropics Dry and wet seasons
Factors that affect where ecosystems are located:
TEMPERATUREEquator is warmer as the sun’s rays do not have to travel as far so they do not lose as much heat energyThe poles, it is colder as the sun’s rays have to travel further and spread over a larger area which makes it cooler here.
PRECIPITATIONAreas of low pressure = cold and wetAreas of high pressure = sun shinee.g. Between the Tropics is wet so it is rainy (hence rainforest)

Tropical Rainforests
CLIMATE:
• A tropical rainforest has a hot, wet climate with no definitive season. • They receive approximately 2,000mm rainfall a year and experience
temperatures at 27˚C on average throughout the year.• Temperatures are high and constant all year because the solar rays are
powerful over the equator and the Sun is overhead most of the time.• Rainfall is high because the global atmospheric circulation causes an area of
low pressure over the equator (so the air rises) which creates clouds.• Rainfall does vary throughout the year, with a distinct wet season lasting 6
months of the year (Dec-May).
SOIL:
• Soil is not fertile because the heavy rain washes away the nutrients, this is known as leaching.
• However a thin layer of nutrients is found at the top due to the leaf litter where many plants and animals decompose.
• This soil is known as red soil or latosol as it is rich in iron.
PLANTS:
There are 4 distinct layers in the stratification of a tropical rainforest:1. Emergent layer - Fast growing tree that sticks out above the main canopy
(approx. 45m tall). Here you will find the tallest trees and broad leaves.
LOCAL FACTORSAltitude – As you go higher, it gets colder. Continentality (Distance from the sea) Away from the sea, land is warmer in summer and cooler in winterNutrient rich environment – gives food for plants either from the soil or seaOcean currents: A cold ocean current flowing along the South American coast creates dry conditions because little evaporation happens when it is cold. This has created deserts like the Atacama.

2. Canopy layer - Provides a roof to the two layers below. Here you will find leaves that are oval and come to a point. Also there are lots of animals here.
3. Under canopy - The leaves here grow the biggest as they fight to find the sunlight. Here there are lots of insects.
4. Shrub layer/forest floor - There is little vegetation here are the sunlight rarely reaches the forest floor so plants quickly die here.
WATER:
Rainforest ecosystems are characterised by heavy convectional rainfall, high humidity, lushness of vegetation and nutrient-rich but shallow soil. These factors give rise to a unique water and nutrient cycle.
The roots of plants take up water from the ground and the rain is intercepted as it falls much of it at the canopy level.
As the rainforest heats up, the water evaporates into the atmosphere and forms clouds to make the next day's rain. This is convectional rainfall.
PEOPLE:
The rainforests are home to many people who have adapted to life there over many generations. They make a living by hunting and fishing, gathering nuts, berries and growing vegetables in small garden plots.
ANIMAL ADAPTATIONS TO THE PHYSICAL CONDITIONS:
ANIMAL CHARACTERISTICS ADAPTATION:JAGUAR Rosettes/spots
Large feetRosettes/spots for camouflage when hunting preyLarge feet – to walk through small streams and sand banks and not sink
CAPYBARA Webbed feetNose is high up on its head
Webbed feet – to swim through the many streams/riversNose is high up on its head – to help it swim in the wet environment
TOUCAN Colourful and strong beakEyes on the side of its head
Strong beak to crack food like nuts. This can also spread the seeds from a treeEyes to see prey
PLANT ADAPTATIONS TO THE PHYSICAL CONDITIONS:

PLANT CHARACTERISTICS ADAPTATIONButtress Roots these are very wide at the
base of a treeThe soil in the rainforest is red, not very fertile and quite shallow. The roots of this tree spread out wide to allow it to get more nutrients.
Dip tip leaves leaves often have a long pointed tip
Water can run off the leaf so it does not break off the branch during heavy rainfall
Kapok Tree Smooth bark the smooth bark allows the water to run down to it roots helping it grow
Rainforests are interdependent ecosystems:
1) The warm and wet climate means that dead plant material is decomposed quickly by fungi and bacteria on the forest floor. This males the surface soil high in nutrients, meaning that plants can grow quickly and easily.
2) Plants pass on their nutrients when they are eaten by animals. The dense vegetation provides lots of food so animal populations are high. Many plant and animal species have formed symbiotic relationships (where everything relies on each other) e.g.
Agouti (a rodent) cracks open brazil nuts and they can bury them into new seedlings. However, if the agouti become extinct then Brazil nut trees would decline and other animals who feed on them would decline. The people who also sell the Brazil nuts would lose money.
3) Changes to the rainforest ecosystem e.g. people reducing tree cover via deforestation could have knock on effects on the whole ecosystem e.g. reducing the amount of co2 would add to the greenhouse effect and warm the climate.
4) Trees also intercept and take up lots of water and release it back into the atmosphere, providing moisture for further rainfall. Deforestation means that the climate may change and drought may increase which affects the plants and animals in the ecosystem.
Rainforests have high biodiversity:
1) Biodiversity means the huge variety of plants and animals in an area2) Rainforests contain 50% of the world’s animal, plant and insect species.3) Rainforest are stable all year around the plants and animals don’t have to cope
with changing conditions.4) Deforestation could lead to the loss of biodiversity e.g. the amount of extinct
species was 628 in 2008.

CASE STUDY of deforestation: Amazon Rainforest (BRAZIL)
Key words:
Deforestation = Removing trees from a forest
Afforestation – Adding trees to a forest
The changing rates of deforestation in the Amazon Rainforest:
The rate of rainforest deforestation is very high – 130,000 km2 per year Globally the rate of deforestation seems to be slowing down but there are still
hotspots where the rate of deforestation is increasing e.g. Borneo Overall deforestation in Brazil and Indonesia accounted for almost half of the
global total between 2001-2014 but Brazil has reduced its deforestation rate since 1990.
THE VALUE OF THE AMAZON RAINFOREST:
• It could reduce the effects of climate change as trees absorb C0² and release oxygen – the Amazon stores around 100 billion tonnes of carbon!
• 28% of the world’s oxygen comes from the rainforest• Rainforests are rich in biodiversity (contains ½ worlds plants and animals)• 25% of all medicines come from rainforest plants• The Amazon regulates the water cycle and without it some countries may risk
droughts.
CAUSES OF DEFORESTATION IN THE AMAZON RAINFOREST:
Logging – This is often of hardwoods which is to make furniture. Logging is also done by the government to repay the debts they made in the 1960s.
Mineral extraction – Mining is common with companies seeking gold. Population growth – People move from Rio to the rainforest to the new capital
= Brasilia Commercial farming – Large spaces are needed for cattle ranches for example,
McDonalds. Slash and burn is often done to create fertile soils.

Road building –Trans-Amazonian Highway has improved communications. Subsistence farming – Forest is cleared so that farmers can grow food for
themselves and their families. Energy development – Building dams to generate HEP which floods areas of the
rainforest.
THE IMPACTS OF DEFORESTATION IN THE AMAZON RAINFORESTS:
Companies will pay taxes to the
government to improve public services (multiplier effect – economic development)
Farming creates money e.g. $6.9 million/year trading cattle with McDonalds (economic development).
Improved transport infrastructure opens up more industry and tourism.
3,100 people are employed in mines and minerals like gold are valuable
X Pollution from the Carajas mine of water sources resulting in water shortages.
X Farming mean 55 million tonnes of top soil are lost every year (soil erosion). This is because there are no trees to hold the soil together so the soil gets washed away by the rain.
X Plants that could be used for medical benefits may become extinct.
X Deforestation will release carbon dioxide which causes global warming/ climate change contributes to 15% of global co2 emissions per year.
LOCAL AND INTERNATIONAL SUSTAINABLE MANAGEMENT OF ECOSYSTEMS:
LOCAL - Agro-forestry - Growing trees and crops at the same time to prevent soil erosion. Replanting in deforested areas by a project called REGUA
LOCAL -Selective logging and replanting – Trees are only felled when they reach a particular height/mature. This maintains a strong gene pool of hardwoods. Replant 3 trees for every 1 cut down.
LOCAL - Ecotourism – Yachana Eco lodge in Ecuador only allows 36 people in at any time and people get there by 54ft canoes. They only use sustainable sources e.g. solar panels, locally produced food and locals for tour guides
GLOBAL - Inter-government agreements on hardwoods and endangered species – the FSC put their logo on sustainably logged hardwood and CITIES bocks the illegal trade of endangered animals
GLOBAL – Conservation and education - Protect-An-Acre teaches children about conservation work and tourists can volunteer in the rainforest

GLOBAL – Reducing the debt – Debt for nature swaps are done by the WWF; they pay some of Brazil’s debts in return for protecting the rainforest. The USA have also paid £13.5 million of debt in 2010 so they protect the rainforest
Cold Environments
Cold environments (polar and tundra) have a range of characteristics
POLAR CLIMATE TUNDRA CLIMATE• Temperatures are never normally
above 0˚C• Winters range from -40˚C to -90˚C• Cold summers and even colder
winters• Rainfall/snowfall = <100mm a year
• Temperatures range from 10˚C in summer months to -50˚C in winter months
• Cold summers and even colder winters
• Rainfall/snowfall = <380mm a year
POLAR SOIL:• Covered in ice sheets so there is
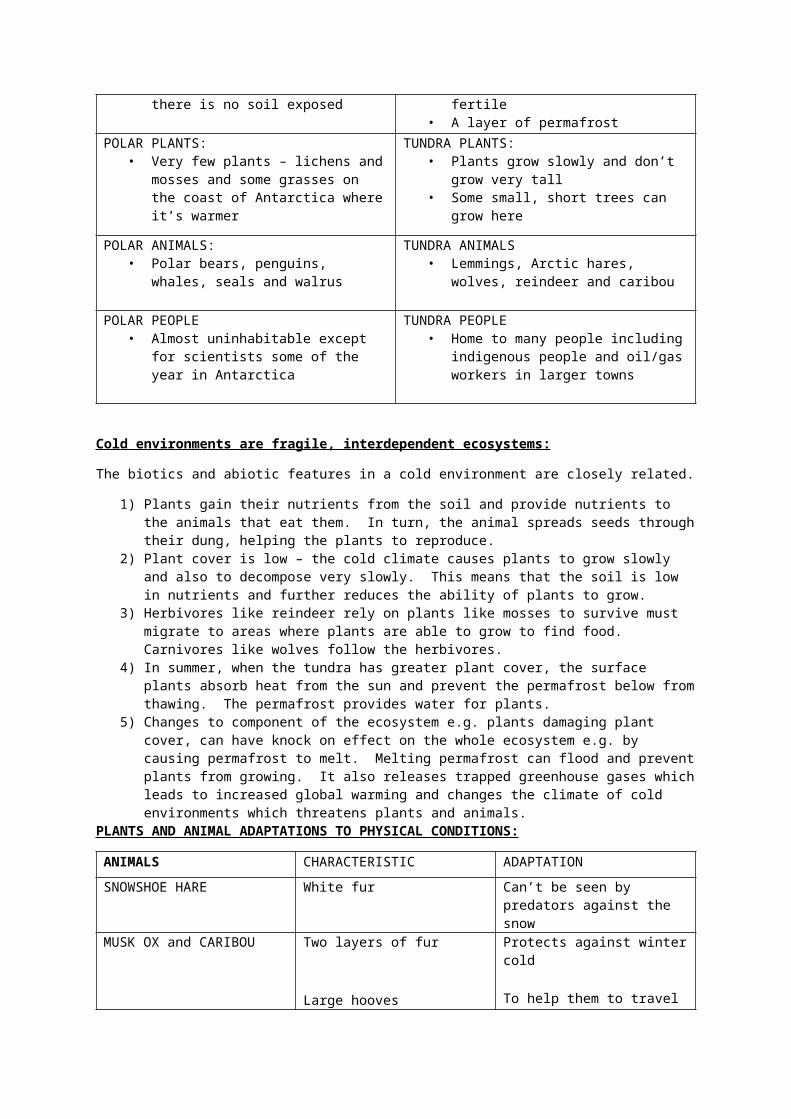
no soil exposed
TUNDRA SOIL:• Thin, acidic and not very fertile• A layer of permafrost
POLAR PLANTS:• Very few plants – lichens and
mosses and some grasses on the coast of Antarctica where it’s warmer
TUNDRA PLANTS:• Plants grow slowly and don’t grow
very tall• Some small, short trees can grow
here
POLAR ANIMALS:• Polar bears, penguins, whales,
seals and walrus
TUNDRA ANIMALS• Lemmings, Arctic hares, wolves,
reindeer and caribou
POLAR PEOPLE• Almost uninhabitable except for
scientists some of the year in Antarctica
TUNDRA PEOPLE• Home to many people including
indigenous people and oil/gas workers in larger towns
Cold environments are fragile, interdependent ecosystems:
The biotics and abiotic features in a cold environment are closely related.1) Plants gain their nutrients from the soil and provide nutrients to the animals that
eat them. In turn, the animal spreads seeds through their dung, helping the plants to reproduce.
2) Plant cover is low – the cold climate causes plants to grow slowly and also to decompose very slowly. This means that the soil is low in nutrients and further reduces the ability of plants to grow.

3) Herbivores like reindeer rely on plants like mosses to survive must migrate to areas where plants are able to grow to find food. Carnivores like wolves follow the herbivores.
4) In summer, when the tundra has greater plant cover, the surface plants absorb heat from the sun and prevent the permafrost below from thawing. The permafrost provides water for plants.
5) Changes to component of the ecosystem e.g. plants damaging plant cover, can have knock on effect on the whole ecosystem e.g. by causing permafrost to melt. Melting permafrost can flood and prevent plants from growing. It also releases trapped greenhouse gases which leads to increased global warming and changes the climate of cold environments which threatens plants and animals.
PLANTS AND ANIMAL ADAPTATIONS TO PHYSICAL CONDITIONS:
ANIMALS CHARACTERISTIC ADAPTATIONSNOWSHOE HARE White fur Can’t be seen by predators
against the snowMUSK OX and CARIBOU Two layers of fur
Large hooves
Protects against winter cold
To help them to travel over the soggy ground and break through ice to drink drinking water in the winter months
SEALS Lots of blubber To keep it insulatedPLANTSBEARBERRY The plant hass red berries
and waxy green leaves. They are very low growing and have a thick stem
To enable it to survive strong winds. The waxy leaves allow the leaves to be water resistant. The stems are also hairy so they retain heat in the low temperature and the red berries can be eaten by birds to help distribute the seeds.
ARCTIC POPPY Their cup shaped flowers face upwards to the sun
High latitudes mean that the light is weak leaving snow covering the plants for the aortic of the year. Plants have adapted to make maximum photosynthesis in the short periods = SUN GOES INTO THE CENTRE OF THE POPPY
MOSSES Hairy leaves and small leaves
High air pressure causes strong, cold winds. Plants have adapted to ensure minimal transpiration – keep plant warm.
LICHENS Shallow roots To enable the plant to grow because of the layer of

permafrost beneath the soil layer.
Cold environments have low biodiversity…
1) Cold environments have very low biodiversity (particularly Antarctica) because there are fewer species of plants and animals in cold environments than most other environments.
2) Low biodiversity means when the population of one species changes it can affect the population of dependent species e.g. changes in the number of lemmings affects the number of Arctic foxes (their predators).
3) Global warming is causing some species to move towards the poles, where it is cooler, to cope with temperature rises elsewhere. Species already adapted to polar environments can’t go anywhere colder so are at risk of decline or extinction if climate change causes polar areas to warm up.
Developments and challenges in cold environments case study = ALASKA
Alaska is a cold environment that’s part of the USA. The northern parts of Alaska are inside the Arctic Circle. Development opportunities in Alaska:
Fishing – There are 3,000 rivers in Alaska and commercial fishing (for salmon) provides 78,500 jobs and creates $6 billion. Lots of native communities rely on fishing (subsistence fishing) for food, fuel and the bones for clothing and tools.
Mineral extraction – One fifth of the area’s income comes from mining, mainly gold. It contributed £2.2 billion to Alaska’s GDP in 2013.
Energy – 50 HEP plants provide a lot of jobs and one fifth of Alaskan electricity. Geothermal energy is also being harnessed in the tourist resort of Chena.
Tourism – 2 million tourist visit a year, which provides seasonal jobs. There are numerous National Parks and monuments of the Yup’ik heritage. 60% of people come from cruise ships and people often hike, ski and rock climb.
Challenges of developing cold environments:
1. Extreme temperatures
It is very cold, especially in the north with extreme weather Extreme cold can cause injury or death In Prudhoe Bay is it -9c
2. Inaccessibility
Some areas are extremely remote, covered with snow/ice. Frost heave pulls parts of the roads up which makes it hard to drive on. There are not many roads, especially to small towns and villages The population is small and scattered across Alaska
3. Buildings and infrastructure
Construction work only takes place in summer as days are longer and warmer Melting permafrost means building can subside and no crops can be grown. Dark surfaces can melt the permafrost
Managing the challenges:

High, steep roofs means snow can run off Triple glazed windows to keep the heat in Buildings raised on piles which prevents the permafrost melting Roads built on 1-2m of gravel to stop heat transfer taking place Utilidors are piles above ground to carry water and gas so they do not freeze. Airport runways are painted white to reflect sunlight, stopping them warm.
Cold environments are at risk from economic development
The value of cold environments as wilderness areas:
What is a wilderness area?
• Wilderness areas are wild, natural environments that haven’t been changed significantly by people.
• They are undeveloped, uninhabitable and undisturbed.• Large parts of cold environments are wilderness areas
Why are they worth protecting?
• Scientists can study wild plants and animals in their natural habitat• They are the last remaining areas that haven’t been altered by human activity• They can be used to compare to managed ecosystems as they are natural
Cold environments are fragile and can take a long time to recover…
Cold environments are very fragile and can be interfered with Plant growth is very slow – if plants are damaged e.g. by vehicle tyres then they
can take a long time to recover Species are highly specialised to find it difficult to adapt to change e.g. polar
bears are adapted to hunt on ice and their numbers are decreasing as sea ice melts earlier each year.
Strategies used to balance the needs of economic development and conservation in cold environments:
USE OF TECHNOLOGY:
Modern construction methods can minimise environmental impacts e,g, elevating
ROLE OF GOVERNMENTS:
• This can cause conflicts between different interest groups. For example in Alaska, some politicians want to increase oil production to

buildings on piles or gravel beds can prevent buildings from warming the ground.
Facebook have located in the Arctic as the cold air cools the generators so not as much energy is used.
increase income for the country. • However, Barack Obama anted to maintain the
wilderness of the environment. He banned oil exploration from taking place in 12 million acres if the Arctic National Wildlife Refuge.
• The US government has been involved with the protection of Alaska since oil was discovered in the 1960’s
• The National Environmental Policy Act ensures companies involved with the extraction and transportation of oil protect and recognise the rights of native people
• The NOAA oversee sustainable fishing and protection of marine habitats
• Just over 10% of the Arctic's land now has some level of special protection and it is the responsibility of the country with hold the claim to that area to look after it ecosystem e.g. National Park. Each country has its own laws
• However these laws are not always followed e.g. Norway continues to hunt for whales
INTERNATIONAL AGREEMENTS:
• There has been a global ban on whaling from the International Whaling Convention in 1986 and bowhead whales have increased by 3% since then
• The Treaty of Antarctica was signed in 1959 by countries. It banned mining, drilling extraction of oil and wars on shore.
CONSERVATION GROUPS:
• A recent campaign for the native Alaskan against Pebble Mine as it would have been owned by North America. Greenpeace sent campaigners to Russia’ Arctic Ocean to protest about oil exploration and the Russian government arrested some members of GP.
• Greenpeace called for ‘global sanctuary’ to be established in the Arctic by wanting a ban on oil drilling and fishing. However this approach limits indigenous people’s freedom to use the Arctic’s resources.
UK Physical Landscapes:
Relief describes the shape of the land:• Height above sea level
Section C:
Physical landscapes in the
UK
YOU NEED TO PICK THE COASTAL LANDSCAPES IN THE UK AND RIVER LANDSCAPES IN THE UK SECTIONS
• Steepness of slopes• Landscape features e.g. mountain range.
Relief is determined by the lands geology – more resistant types of rocks such as granite will be harder to break down, this is why they tend to form mountain ranges.In the UK in the North there are highlands (areas where there are mountains) and in the South lowlands (areas where the land is flat).
Coastal landscapes in the UK
Wave types and characteristics:
What forms a wave?
• Waves are formed by wind blowing over the sea.• The friction between the surface of the water and the wind causes ripples which
form into waves.• The distance the wind travels is called the ‘fetch.’ • The longer the fetch the more powerful the wave.
What happens when a wave reaches the coast?
When a wave travels inland, rushing up the beach, it is called a ‘SWASH’ When a wave travels back towards the sea it is called a ‘BACKWASH’
Types of waves and characteristics:
CONSTRUCTIVE DESTRUCTIVE Low wave that surges up the beach Powerful swash, weak backwash This type of wave ‘spills’ onto the
beach Deposit large amounts of sand and
pebbles Powerful swash, weak backwash
Weak swash, strong backwash Formed by storms close to the
coast High frequency (10-14 waves per
min) Destroys beaches – removes sand
and pebbles. Destroys beaches – removes sand
and pebbles. Formed by storms close to the
coast

Coastal processes:
1) Weathering

2) Mass movement:
What is mass movement?Movement downslope of any loose material (soil, mud, loose rock) under the influence of gravity.
Causes of mass movement:
Steep gradient
Water content (lots of water)
Human activity (puts pressure on the land)
Lack of vegetation
Types of mass movement:
ROCKFALL:Bare rocks are prone to freeze-thaw weathering, which results in individual rocks breaking off the cliff face. On vertical cliffs, due to gravity they fall. At
MUDFLOW:Mudflows are often rapid and occur when slopes are steep (10 o).They usually occur after heavy rainfall. There is little vegetation so cannot hold the
the bottom of the cliff they fan out to form scree.
soil together. At the base, the soil forms a lobe.
LANDSLIDE:A landslide is when a large amount of rock blocks slide down a cliff. This happens along a fairly steep slide plane, where rocks maintain contact with the cliff. These collect as a pile of rocks at the bottom of the cliff.
ROTATIONAL SLIP:A slump of saturated soil or weak rock along a curved slip plane. When material slumps, it is rotated backwards into the cliff face as it slips.
3) Erosional processes: The wearing away of the coastline
Hydraulic power = Powerful destructive waves smash into the base of the cliff. Water is forced in and out of the cracks in the rock. Air pressure changes as waves go in and as they go out, pressure is released causing the rock to break apart. This is called cavitation. This process is aided by weathering. Abrasion (corrasion) = Destructive waves hurl rocks at a cliff. The scrapes the rocks like sand paper on the cliff, causing it to become smoother and is more erosive in storm conditions. Attrition = Rocks carried by the sea knock against one another causing them to become smaller and more roundedRates of erosion will be higher where
The coastline is exposed to a large fetch (area of water wind can blow over to create a wave)
• Stronger winds • There are soft rocks
4) Transportation = the movement of material on the coast
Traction - Large pebbles rolled along the seabedSaltation - A ‘hopping’ or ‘bouncing’ motion of particles too heavy to be suspendedSuspension - Particles carried (suspended) within the waterSolution - Dissolved chemicals often derived from limestone or chalk
Longshore drift = Longshore drift is the movement of material along a beach by wave action

1) The swash moves in the same direction as the prevailing wind2) Backwash goes back to the sea at a 90 degree angle due to gravity3) This process is repeated to create a zigzag movement of material along a beach
5)Deposition – the dropping of material at the coast due to:
• Loss of energy• Mainly constructive waves• Large flat beaches so the swash spread over a large area• Material gets trapped behind a spit or engineered structures e.g. groynes
Distinctive coastal landforms are the result of rock type, structure and physical process
*The geology (rock type) affects the coast as if the area is made of soft rock then it will erode very quickly*
CHARACTERISTICS AND FORMATION OF LANDFORMS RESULTING FROM EROSION
LANDFORM CHARACTERISTICS FORMATIONHEADLANDS AND BAYS
• Headlands and bays happen at DISCORDANT coastlines.
• This means there are bands of hard and soft rock that meet at right angles to the
1. There is a discordant coastline where there is hard rock (e.g. sandstone and chalk) and soft rock (e.g clay). The

coast.Headlands:
• It is a cliff that juts out into the sea surrounded by water on three sides.
• Made of hard rock, such as granite, chalk or limestone.
• They have near vertical cliff faces.
Bays:• They are crescent shaped
and are found between two headlands due to the erosion of soft rock, such as clay.
• They have a beach made of sand or shingle.
• They have low energy constructive waves making them.
waves start to attack it
2. The waves start differential erosion. The soft rock is eroded by hydraulic action and attrition.
3. The less resistant soft rock is eroded at a faster rate which causes a bay to form.
4. The hard, resistant rock forms a headland that sticks out into sea.
5. Sand is deposited into the bay to form a beach.
LANDFORM CHARACTERISTICS FORMATION
CLIFFS WAVE CUT PLATFORMS
Cliffs1. Made of sandstone2. Horizontal bedding3. Rocks at the base
Wave cut platforms1. Deep cracks in the rocks2. Slope down to the sea at
3-4° angle3. Smooth rock due to
attrition4. Covered at high tide and
exposed at low tide.
1.Freeze-thaw weathering weakens the upper part of the cliff. 2. Waves cause most erosion at the foot of the cliff, undercutting it through hydraulic action and abrasion. This forms a wave-cut notch, which is enlarged as erosion continues.3. This makes the cliff above the notch unstable and it eventually collapses.4. The collapsed material is washed away by destructive waves and a new wave-cut notch starts to form.5. Repeating collapsing results in the cliff retreating.6. A wave-cut platform is the platform that’s left behind as the cliff retreats. This will be continuously smoothed by shingle grinding over it.
HEADLAND, CAVE, ARCH, STACK AND STUMP:

Headland = Reistant rock e.g. chalkCave = Can be made of limestone and are very darkArch = Very tall ceiling Stack – Isolated rock in the seaStump = Very small
CHARACTERISTICS AND FORMATION OF LANDFORMS RESULTING FROM EROSION
1) BEACHES
Characteristics of beaches:PEBBLE SANDYSteep because the weak backwash can’t move material down the beachDestructive wavesLarge pebbles at the back
Almost flat because the backwash moves the sand back down the beach creating a gentle slope.Constructive wavesWet sand, rippled appearance look
Beach profiles:

Formation:
SANDY BEACH: In sheltered bays, low energy constructive waves transport material onto the shore. The swash is stronger than the backwash, so sediment is slowly moved up the beach. Once the tide has gone out, there is more sediment on the beach than before.PEBBLE BEACH: Exposed beaches have a large fetch. The destructive waves have a stronger backwash so pebbles are not moved far up the beach, making a steep profile. A storm beach may form when there is stormy weather and waves hurl large pebbles to the back of the beach.
How do beaches change throughout the seasons?
WINTER = berms and sand dunes at the back of the beach are eroded by destructive waves which drag beach deposits offshore. This creates an offshore bar which LOWERS the beach.
WINTER = Winter profiles are narrower and steeper.
SUMMER = Constructive waves rebuild the beach.
2) SAND DUNES:
Characteristics:1. Unstable steep slope (30-34°)2. Crests (heights of 15m)3. Gentle slope on the windward side

How do sand dune change inland?
MY DOG SAMMY GOES YAPPY FOR EXERCISE
Characteristics and key points:
• Embryo dunes only a few metres high but mature dunes can be up to 15m high.• The dunes get bigger towards the back of the beach because the marram grass is
long and binds the vegetation roots together so it cannot move any further.• Dunes close to the beach are yellow, whereas dunes at the back of the beach are
grey.How are sand dunes formed?
1) Wind is blown inland by onshore winds.2) Large obstacles, such as driftwood, along the beach cause the grains of sand to
become trapped. The heavy grains will build up behind them, but the lighter grains may be transported over the obstacle and settle on the other side.
3) The sand cannot continue to build in height because it becomes unstable and collapses under its own weight. The top is called the crest.
4) When this happens, the lighter grains fall down the leeward side.5) The cycle repeats, with wind blowing up the windward side and slipping down the
leeward side causing the sand dune to migrate inland over time.
3) SPITS AND BARS:
SPIT BAY BAR:

Characteristic: • This land form has a hooked end.• Large pebbles can be found where
it is attached to the land and smaller ones further out.
• It is created by longshore drift and is covered in salt marshes and mud flats
FORMATION:As a wave approaches a sharp bend in the coastline it loses energy so deposits material. Longshore drift causes the sand and shingle to move past the bend parallel to the land, out to sea and deposits the material in the sea. Strong winds and waves can curve the end of the spit (forming a recurved end). The sheltered area behind the spit is protected from the waves and lots of material accumulates to form a salt marsh.
Characteristic:This landform is visible at all times and is attached to the land
FORMATION:A bar is formed when a spit joints two headlands together. The bar cuts off the bay between the headlands from the sea. Longshore drift moves sediment from one side of the bay to the other. This eventually reaches the other side to form a ridge of sand and a lagoon forms behind the bar.
SUBMERGED BAR
Characteristic:• This landform is not attached to
the land and runs parallel to the land.
• It is several metres long
FORMATION:They form in shallow waters where there is a lot of sediment on a raised seabed. During a storm, material is taken from an offshore barrier out to sea via destructive waves. Constructive waves bring the material back.
OFFSHORE BARRIER ISLAND
Characteristic:• This landform is not attached to
the land and runs parallel to the land.
• It is covered in salt marshes, and dunes and mud flats
FORMATION:These are visible offshore bars which often form in chains when waves take sand out to sea. They can be made onshore (barrier beach) by ice melt.

An example of a section of coastline in the UK to identify its major landforms of erosion and deposition = JURASSIC COAST
Different management strategies can be used to protect the coastlines from the effects of physical processes:
There are 3 types of management used to defend the coast:1. Hard engineering – artificial structure e.g., sea wall2. Soft engineering – more environmentally friendly method e.g. beach
nourishment3. Managed retreat – allowing the sea to flood over low-lying land
HARD ENGINEERING WHAT IS IT AND SEA WALL It is a concrete or rock
barrier against the sea. It is placed at the foot of cliffs or the top of a beach. It has a curved face to reflect the waves back into the sea.
The sea walls can last for years which is good economicallyOften has a promenade for people to walk alongThey do not stop longshore drift so they don’t disadvantage other beaches £10,000 per metreCan look ugly and they can stop people getting to the beach.Very expensive to build and repairs are expensive.
GROYNES They are timber or rock structures built out to sea from the coast. They trap
Creates a wider beach, which can be popular with tourists.Provide useful structures for people interested in fishing.
DURDLE DOOR = ARCH CHESIL BEACH = LAGOONLULWORTH COVE = BAYOLD HARRY = STACKOLD HARRY’S WIFE = STUMPSWANAGE BAY = BAY AND HEADLAND

sediment being moved by longshore drift and enlarge the beach. The wider beach acts as a buffer to reduce wave damage.
Last for 40 years£150,000It stops longshore drift which can reduce sand on beaches They are unnatural and unattractive
ROCK ARMOUR Piles of large boulders dumped at the foot of a cliff. The rocks force waves to break which absorbs the energy and protects the cliffs. The rocks are brought by barge to the coast.
They are cheap and easy to maintainThey can be built in months rather than years. Can be used for fishing Rocks are usually used from other parts of the coastline or abroad e.g. Norway. Other countries can get annoyed about this.They can be a hazard for people getting to the beach.Do not fit in with the local geology (rocks)
GABIONS Wire cages filled with rocks that can be built up to support a cliff or provide a buffer against the sea.
Cheap to produce and it uses local pebbles.They can last for 20-25 years.Will eventually become vegetated (plants will grow there) and it will become part of the landscapeThey can cost £30,000 to repair.Cages only last 5-10 years before they rust and sea birds might trap their feet in them.Damaged gabions are unattractive and people might cut themselves.
SOFT ENGINEERING WHAT IS IT and

BEACH NOURISHMENT AND REPROFILING
Adding sand/shingle to a beach to make it wider or higher.
Relatively cheap and easy to maintain - £5000Blends in with beachCould increase tourism Needs maintenance unless structures are built to retain the beach like groynes. Not that effective against high energy wavesTaking material from the seabed can destroy coral
DUNE REGENERATION Encouraging the creation and growth of sand dunes by planting marram grass.
Maintains a natural coastal environment (attracts tourists and wildlife)Relatively cheap - £200Wave energy is absorbed which stops flooding Time consuming to plant the marram grassCan be damaged by stormsProtection is limited to a small area
MANAGED RETREAT/ DO NOTHING
Managed retreat is when the sea is allowed to flood or erode an area of low-value land.
It may reduce the risk of flooding further down the coast. It is cheaper to use than any other strategy. It conserves and enhances the environment e.g. at Wallasey 38 species of bird have been recorded. Houses and roads are destroyed which costs money to build new ones elsewhere.When some areas are destroyed then some habitats can be ruined. Causes conflicts with landowners
An example of a coastal management scheme in the UK = MEDMERRY IN SUSSEX:
Reasons for the scheme:
• The scheme was needed as the area was considered to be at high risk of flooding due to the climate change.
• Before the management scheme, they only had a shingle ridge for protection which cost £200,000 to repair every winter.
• 348 homes, a water treatment plant and a main road to Chichester could be destroyed without any protection.
• The last breach cost the government £5 million damage in 2008Management strategy:

A new embankment was built, 2km from the shore which protected the houses behind it.A channel behind the embankment was built to take water away from the area.60,000 tonnes of rock armour was placed near the sea. 110m breach was made in the shingle bank to allow the sea to flood the land.The Environment Agency built a 7km flood embankment.Resulting effects and conflicts:
They built a new cycle route and 10km of footpaths Selsey now has a 1 in 1000 chance of flooding which is the best level of protection
in the UK Tourism in the area has increased and bird watchers come to the RSPB reserve Flooding is now planned so species like water voles are protected and 300
intertidal habitats are forming Newly flooded area will become a fishing nursery to boost fisherman’s income
X Three wheat and rapeseed farms were destroyed X Badgers habitats have been destroyedX Not many people live in this areaX Cost of £28 million
River landscapes in the UK
Key words:
• Drainage basin: an area of land drained by a rivers and its tributaries.• Source: the start of a river.• Watershed: the edge of a river basin.• Tributary: a small stream that joins a larger river.• Confluence: where a tributary joins a larger river.• Mouth: the end of a river, usually where a river joins the sea.
The long and cross profile of a river

LANDFORMS FOUND:
The changing long cross profile of a river and its valley:
1) The path of a river flows downhill to its course2) Rivers have an upper course, a middle course and a lower course3) Rivers erode channels as they flow downhill4) Rivers erode the landscape and transport material to where it is deposited5) The shape of the valley and channel changes along a river depending on whether
erosion or deposition has the most impact.6) The long profile of a river shows you how the gradient (steepness)
changes over the different courses.7) The cross profile shows you what a cross-section of the river looks like
(see above).
The long profile changes downstream:
The upper course of the river has steep relief so the gradient of the valleys is also steep. There is only one channel with a steep decent so there is a lot of potential energy. The middle course has an increase in tributaries (other smaller rivers joining one larger river). Energy also increases due to more lateral erosion occurring. The shape is now concave due to less vertical erosion. The lower course has low lying land and the erosion is lateral so the valley is almost flat.The cross profile changes downstream:
The upper course has a lot of vertical erosion and the type of rock is hard rock so less erosion occurs here. This is why the channel is thinner and not very wide. The middle and lower course have softer rock and lateral erosion occurs here which is why the channel gets wider. Summary table:
Upper course landforms
Waterfalls, interlocking spurs and gorges
Middle course landforms
Meanders and oxbow lakes
Lower course landforms
Oxbow lakes, levees, estuaries and floodplains

UPPER COURSE-Steep gradient-V Shaped Valley-Steep sides-Narrow and shallow channel-Vertical erosion
MIDDLE COURSE-Medium gradient -Gently sloping valley sides-Wider, deeper channel-U Shaped Valley-Lateral erosion
LOWER COURSE-Very wide-Almost flat valley-U Shaped Valley-Very wide, deep channel-Lateral erosion
Two types of erosion:
1) Vertical: This is erosion downwards that deepens the river valley (and channel), making it V-shaped. It’s dominant in the upper course of the river.
2) Lateral: This is erosion sideways that widens the valley in the middle and lower course.
Fluvial processes:

Deposition:
• To carry a bigger load a river has to have a lot of energy (flowing fast)• When a river slows down it has less energy and has to drop heavier parts of its
load• The dropping of some of the load due to a loss of energy is called deposition
In general on a river:
• Upper course – mostly erosion• Middle course – erosion, transportation and deposition• Lower course – deposition
Distinctive fluvial landforms result from different physical processes:
CHARACTERISTICS AND FORMATION OF LANDFORMS RESULTING FROM EROSION
LANDFORM CHARACTERISTIC
FORMATION
INTERLOCKING SPURS Found in the upper course of a river.
They look like a zip from above
1) In the upper course of a river most of the erosion is vertical. This creates a steep sided v shaped valley.
2) The rivers aren’t powerful enough to erode laterally so they have to wind around high hillsides that stick out into their paths on either side.
3) The hillsides interlock with each other as the river winds around them = interlocking spurs.
WATERFALLS AND GORGES
Very narrow valley
Turbulent, fast flowing white waterAreas of bare rock on the valley sides
E.g. High Force Waterfall
1)Layer of hard, resistant rock lies on top of a layer of softer rock2)The river’s load erodes (by hydraulic action and abrasion) the foot of the waterfall. This forms a plunge pool.3)The soft rock is eroded more quickly, undercutting the hard rock to form an overhang. This overhang eventually collapses under its own weight.4)Over many years this process is repeated many times and the waterfall retreats upstream leaving behind a steep-sided valley called a gorge.

CHARACTERISTICS AND FORMATIONS OF LANDFORMS RESULTING FROM EROSION AND DEPOSITION
LANDFORM CHARACTERISTICS
FORMATION
MEANDERS Meanders are wide bends of a river found mainly in lowland areas.
They constantly change their shape and position because of LATERAL erosion and deposition.
1) The current (flow of the water) is faster on the outside of the bend because the river channel is deeper and there is less friction to slow the river down.
2) So more erosion takes place on the outside of the bend forming a river cliff.
3) The current is slower on the inside bend because the river channel is shallower and there is more friction to slow it down.
4) The eroded material is deposited on the inside of the bend = slip-off slope.
Riffle: areas of shallow, fast flowing water with coarse sediment. These form between meander bends because of a drop in velocity resulting in deposition.Pool: Deeper, slower moving water
You need to learn the cross-section of a meander:

OXBOW LAKE A horse shoe shaped lake that marks where the meander neck got cut off from the river channel.
An oxbow lake once started life as a meander.
Oxbow lakes start eroding the outside of the meander bend where there is the fastest flow.
Outside bends become closer as the neck of the meander becomes narrower.
The river breaks through this land during a flood and the river takes the fastest route.
Deposition eventually cuts of the meander neck and leaves a horseshoe shaped oxbow lake.
CHARACTERISTICS AND FORMATIONS OF LANDFORMS RESULTING FROM DEPOSITION
LANDFORM CHARACTERISTICS
FORMATION
FLOODPLAIN This is the wide valley floor on either side of the river which occasionally gets flooded.
May contain
1. When a river floods onto the floodplain, the water slows down and deposits the eroded material that it’s transporting. This builds up the floodplain (makes it higher).
2. Meanders migrate (move) across the floodplain making it wider.
3. The deposition that happens on the slip-off slopes of the meanders also builds up the floodplain.

reeds and marshes.
LEVEES Raised river banks (2-8m high)Made of gravel and stonesSteep-sided
1. These are natural embankments (raised bits) along the edges of a river channel.
2. During a flood, eroded material is deposited over the whole floodplain.
3. The heaviest material is deposited closest to the river channel because it gets dropped first when the river slows down.
4. Over time, the deposited material builds up, creating levees along the edges of the channel.
ESTUARIES Estuaries form when rivers meet the seaRivers near their mouth have a large amount of load causing the river to slow down and lose energyIf the rate of deposition is greater then the rate of erosion by the sea then sediment will be deposited
1) Estuaries are found at the mouth of the river where it meets the sea.
2) The water is tidal and the river level rises and falls each day.
3) The water floods over the banks of the river carrying silt and sand onto the valley floor.
4) As the tide reaches the highest point, the water is moving very slowly so the sediment is deposited.
5) Over time more and more mud builds up creating large mudflats
6) At low tide the wide muddy banks are exposed.

An example of a river valley in the UK to identify its major landforms of erosion and deposition = THE RIVER TEES
HIGH FORCE = WATERFALL AND GORGEYARM – MEANDER, LEVEES AND FLOODPLAINSMIDDLESBOROUGH = ESTUARY
Flooding
A river flood occurs when a river channel can no longer hold the amount of water flowing in it so overlaps the banks onto the adjacent land (floodplain).PHYSICAL FACTORS1. Heavy precipitation – leads to flash floods as the river channel cannot contain the volume of water.2. Geology – impermeable rocks
HUMAN FACTORS1. Urbanisation – building on a
floodplain creates impermeable surfaces (tarmac roads) means water cannot infiltrate into the ground.

(shale/clay) prevents water soaking through so it remains on the surface and directs the water to the river.3.Relief– steep slopes/mountainous environments causes the water to runoff the surface into the river.
Drains can also block.2. Deforestation – reduces the
amount of evapotranspiration so there is more water on the surface and in the river channel.
3. Agriculture – loose soil is moved into rivers through surface runoff.
The use of hydrographs to show the relationship between precipitation and discharge:
Key words to use in a flooding question:
1) Surface run off – Water runs back to the river channel e.g. over concrete2) Saturated soil – Lots of water in it
Base flow – The normal day to day discharge of the river
Peak discharge – the point when river discharge is at its greatest.
Peak rainfall – the point when rainfall is at its greatest.
Lag time – period of time between the peak rainfall and peak discharge.
Rising limb – amount of water in a river tarts to riseFalling limb – amount of water in a river starts to decreaseDischarge = Volume of water in the riverPrecipitation = Rain
CAUSES OF EACH HYDROGRAPH:Flashy – Lots of deforestation, impermeable rocks, saturated soils, lots of rainfall.Subdued – Afforestation, permeable rocks, unsaturated soils, calm rainfall

3) Impermeable rock – Rock that lets water into it4) Interception – When trees leaves take in rainfall5) Infiltration – When water soaks into soil6) Percolation = When water soaks into rock
The costs and benefits of flood management strategies
Two types of flood management:
Hard engineering– using man-made structures to prevent or control natural processes from taking place. Usually expensive.Soft engineering – working with natural river processes to manage the flood risk. Aims to reduce/slow down the movement of water into a river channel to prevent flooding.
Hard engineering:
STRATEGY HOW IT WORKS and DAMS AND RESERVOIRS A dam is a large
concrete barrier that is built across a river to slow its flow. This causes the valley behind a dam to flood and form an artificial lake called a reservoir. This stops water going downstream and water can be released through flood gates slowly to go downstream. This reduces the risk of flooding.
Dams are very expensive – Kielder Water cost £167 billion The flooding of a valley (to form a reservoir) can cause people to lose their homes. 58 people lost their homes at Kielder Water. Reservoirs can stop the natural migration (moving) of fish downstream Can use the reservoir for HEP e.g. can provide power for 10,000 peopleVery effective at reducing the risk of floodingBoosts tourism - £6 million at Kielder Water each year.
CHANNEL STRAIGHTENING Channel straightening is when a meandering (winding) section of the river is made wider, straighter and deeper. They sometimes line the river with concrete to speed up the flow and prevent the banks from collapsing. This means that water can flow through it
Flooding risk is lower so insurance is lower for peopleAnimals get new habitatsAllows water to move quicker which reduces flooding upstream. When the river meets a meander downstream it floods houses. Cost £110 million to straighten the River Tees.Habitats can be destroyed when making the channel.

faster and more easily. This reduces the risk of flooding.
EMBANKMENTS An embankment is when the river bank is raised so that more water can fit into the channel. This means that the river channel holds more water before flooding occurs. This reduces the flood risk.
Embankments may still flood. People get a false sense of security and don’t prepare for the flood. Embankments have high maintenance costs and need repairing a lot! They sometimes put concrete in to line the channel and this can cause animals to lose their habitats!Can be used as a riverside footpath for people Cheaper than other HE methodsCan provide habitats for water voles.
FLOOD RELIEF CHANNELS A flood relief channel is an artificially made channel that is designed to back up the main river channel for a river that often floods. It does this so that urban areas do not flood. During times of high discharge (lots of water in the river), gates open to allow the excess water to go into the flood relief channel) to stop flooding.
Footpaths and cycle tracks can be built along the new channel. This means people can bird watch. A relief channel protects 3000 properties in ExeterSome relief channels have artificial reed beds in them which give animals a habitat. However, some relief channels can destroys animal’s habitats.People who used to live where the relief channel is built in Exeter have to move. Settlements downstream of the relief channel can be flooded.
SOFT ENGINEERING:
STRATEGY HOW IT WORKS and Floodplain Zoning Where the land is
used to minimise the risk of flooding. The Environment Agency categorises land into four risk-zones. The most important buildings are built in zone 1 and the least important buildings are built in zone 3b.
In some cities, building has already taken place on the floodplain. There is a housing shortage in the UK so a restriction on building houses is not helpful Habitats are destroyed due to building on other greenfield sites.CheapProvides green spaceLess flooding due to not building on floodplain

Flood warnings and preparation
The Environmental Agency have an action plan for areas that are at risk. The MET office analyses data from its weather stations and gives flood warnings. These warnings are publicised via the media so people can prepare for a flood.
It is a cheap way of protecting people and their property.If people are warned then they can keep their valuables safe. It is a way of ensuring people’s safety without having to invest in high cost hard engineering. It may not help people who live in areas that are prone to flood. It does not stop a flood so insurance costs will be high. Flood warnings are only effective if people listen to them and take notice of them. Not everyone has access to social media.
Planting trees (afforestation) Planting trees on slopes helps intercept the rainfall to reduce the flood risk. The trees take up water via their roots.
More CO2 is absorbed. The trees leaves can reduce surface runoff. Animals gain new habitats Animals could lose grazing land. Planting more trees changes the appearance of a landscape e.g. less open grass and it could look unnatural. Not 100% effective
River restoration This is when the river that has previously been hard engineered is restored in an environmentally friendly way back to being a river channel. For example, trees are planted and storage areas are made.
Creates new wetland habitatsLooks niceIncrease water storage reduces floods downstream.Expensive – Up to £11 billion.Lose crops Not 100% effective
An example of a flood management scheme in the UK = Jubilee River Restoration (Windsor)
Location and Background

The River Jubilee is located in south-east England. It is a relief channel (an artificial channel which takes water when the river is near full discharge) for the River Thames and is was created to take overflow water from the River Thames. It opened in 2002 and is 1.7km long and 50m wide. It cost £110 million Why does the area need protecting?
The River Jubilee is in the area of the Thames floodplain so it is very low lying and prone to flooding. The river flows by Windsor Castle and the homes around the area are very expensive e.g. Eton. The area around the river is impermeable ground so there is a lot of flooding. Social impacts
• Three thousand properties were protected in very rich Eton and Windsor.• Other places downstream, such as Old Windsor got flooded.• Paddle boaters were promised a river to go on. However, due to two weirs (big
gates) they have to carry their boats around them.
Economic impacts
• It was the most expensive flood relief scheme in the UK (£110 million)• It has been cost effective for people who live upstream.• The weirs were damaged by floods one year after it had been completed and had
to be repaired costing £680,000.• The Environment Agency have run out of money to add weirs in the lower course
of the river so local people may have to pay £110 million for them to be built.
Environmental impacts
• In 2014, there was a big flood where the flood-relief channel re-joins the River Thames. This caused the flooding of houses and habitats.
• There is an embankment where animals have a habitat.• The concrete weirs are ugly to look at.• Algae collects behind the weir and disrupts the ecosystem.
Is the River Jubilee management strategy successful?
The River Management Strategy was expensive and has still caused flooding at the confluence with The Thames. However, lots of houses have been protected and the people upstream are protected from the flooding and animals have new habitats.