so2-alcohol-water fractionation of sugarcane straw
TRANSCRIPT

The University of MaineDigitalCommons@UMaine
Electronic Theses and Dissertations Fogler Library
Summer 8-18-2017
SO2-Alcohol-Water Fractionation of SugarcaneStrawAsif [email protected]
Follow this and additional works at: https://digitalcommons.library.umaine.edu/etd
Part of the Bioresource and Agricultural Engineering Commons, Industrial EngineeringCommons, Operational Research Commons, Other Operations Research, Systems Engineering andIndustrial Engineering Commons, and the Polymer Science Commons
This Open-Access Dissertation is brought to you for free and open access by DigitalCommons@UMaine. It has been accepted for inclusion inElectronic Theses and Dissertations by an authorized administrator of DigitalCommons@UMaine. For more information, please [email protected].
Recommended CitationSharazi, Asif, "SO2-Alcohol-Water Fractionation of Sugarcane Straw" (2017). Electronic Theses and Dissertations. 2749.https://digitalcommons.library.umaine.edu/etd/2749

i
SO2-ALCOHOL-WATER FRACTIONATION OF SUGARCANE STRAW
By
Asif Masih Sharazi
B.S. University of Engineering and Technology, Lahore, Pakistan, 2009
M.S. University of Engineering and Technology, Lahore, Pakistan, 2012
A DISSERTATION
Submitted in Partial Fulfillment of the
Requirements for the Degree of
Doctor of Philosophy
(in Chemical Engineering)
The Graduate School
The University of Maine
August 2017
Advisory Committee:
Adriaan R.P. van Heiningen, Professor of Chemical Engineering, Advisor
M. Clayton Wheeler, Professor of Chemical Engineering
G. Peter van Walsum, Associate Professor of Chemical Engineering
Barbara J.W. Cole, Cooperating Professor of Chemical Engineering
Mikhail Iakovlev, Research Scientist at Thomaston, GA Biorefinery of API

ii
©2017 Asif Masih Sharazi
All Rights Reserved

SO2-ALCOHOL-WATER FRACTIONATION OF SUGARCANE STRAW
By Asif Masih Sharazi
Dissertation Advisor: Dr. Adriaan R.P. van Heiningen
An Abstract of the Dissertation Presented
in Partial Fulfillment of the Requirements for the
Degree of Doctor of Philosophy
(in Chemical Engineering)
August 2017
Climate change resulting from fossil fuels combustion is motivating researchers to explore feasible routes to convert
renewable biomass into biofuels and biochemicals for a sustainable society. Typically, biofuel is produced from corn
or sugarcane but both feedstocks compete with human food supply. Thus, lignocellulosics as renewable feedstock
represent a more ethical and ecofriendly approach. Sugarcane straw (SCS) is a cheap and abundantly available
feedstock which potentially can be used for biofuels/biochemicals production. It can also help to mitigate
environmental and health problems resulting from conventional practice of SCS burning in the fields.
There are different biomass conversion technologies for production of biofuels/biochemicals. The
biochemical route offers advantages of high selectivity and conversion and can also produce widely different products.
Prior to fermentation, it requires a fractionation process that can produce monomeric hemicellulose sugars and a
cellulosic solid residue that is easily accessible to enzymes. The SO2-ethanol-water (SEW) or AVAP® process meets
these requirements. However, the viability of this process is highly dependent on efficient solvent recovery and full
utilization of sugars. The SEW process produces a spent liquor stream that has only about 50% sugars as monomers.
Only ethanol has been used in this process as solvent so far, and no data is available regarding alcoholysis reactions
that consume solvent and potentially decrease the monomeric sugar yield.
In the present thesis, the SEW process is evaluated for SCS fractionation and associated potential losses of
carbohydrates and ethanol as alkyl pyranosides and by lignin alkylation. This study also investigates the effect of two
other alcohols, methanol and isopropanol besides ethanol on the fractionation potential of SCS. It is the first time that
a secondary alcohol is being used in the SO2-Alcohol-Water (SAW) process. The fractionation efficiency is poor using

methanol but it generates methyl xylosides at a high yield. The fractionation potential of isopropanol is comparable to
ethanol, however less health and safety regulations and its low process pressure make isopropanol more attractive.
The kinetics of alkyl pyranoside hydrolysis in SAW liquor after solvent evaporation are measured to establish the
conditions for full sugar and solvent recovery.

iii
ACKNOWLEDGEMENTS
First, I would like to thank my advisor Dr. Adriaan van Heiningen for being an amazing and wonderful
mentor. His support and guidance in a friendly and courteous environment is unforgettable. His untiring efforts to
encourage me and get me through difficult situations will always be appreciated. This great achievement of my life
would not have been possible without him. He has always been very quick to respond to my questions and emails
throughout these four years. I appreciate him for providing me tremendous opportunities to travel, participate in
different conferences, meet new people and colleagues of diverse backgrounds. I am also grateful to him for providing
me assistance through summer interns and letting me borrow his books. I would also like to pay my gratitude to his
gracious wife, Magriet van Heiningen who always has a smile on her face whenever we have a gathering.
Now I would like to pay my sincere gratitude to other committee members including Dr. Clayton Wheeler,
Dr. Peter van Walsum, Dr. Barbara Cole and Dr. Mikhail Iakovlev. Their guidance and insightful comments serve as
a guiding light at each stage of my doctoral research. They are strong pillars of this great accomplishment. Their help
and support will always have a special place in my heart.
Very special thanks go to International Fulbright Program and USEFP (United States Education Foundation
in Pakistan) that provided me the great opportunity of my life to get a doctoral degree in a USA institution. This
program not only helped me financially for last four years but also organized enrichment seminars to adjust in this
new culture. I had wonderful opportunity to visit a few other states through these enrichment seminars. Fulbright
indeed brought a wonderful twist in my life that would stay with me forever. Financial help from UMaine Ober Chair
and UMaine graduate school through International Tuition Scholarship Award is greatly appreciated. I owe a huge
gratitude to Thomaston, GA Biorefinery of API, a copartner of Granbio, for providing feedstock material for this
research. This project wouldn’t have been accomplished without their support.
Giovane Zago and Natalia Blumer Souza, two summer interns, deserve huge appreciation for their assistance
in performing experiments for me. Their questions helped me to better understand many experimental procedures. I
wish them good luck in their future. I highly appreciate Sefik Tunc, Christa Meulenberg and Yurui Zhen for training
me on various equipment to safely accomplish the experimental tasks. They deserve a special appreciation for
equipping me with strong analytical skills. I also appreciate Amos Cline and Nick Hill for troubleshooting equipment

iv
and their technical help. Amy Luce’s help is greatly appreciated for sending our samples for inorganic content analysis.
Two other wonderful ladies, Angel Hildreth and Cathy Dunn deserve many thanks for making chemical deliveries
and all related purchase orders very efficient. Their efforts to accelerate the progress of this research work are
undeniable. I am also very thankful to Suzanne Perron (assistant chemist, soil lab UMO) for doing inorganic element
analysis for us. The help from Antje Potthast, Markus Bacher and Ivan Sumerskii from University of Natural
Resources and Life Sciences, Vienna, BOKU is greatly appreciated for conducting NMR and alcoxy groups
measurement analysis on lignin samples. Martin Lawoko from Royal Institute of Technology, Stockholm also
deserves special appreciation for performing lignin MWD for us.
Simon Naseem, Raheel Samuel, David Paul, Azar Taufique and Shahbaz Altaf are my amazing friends from
Pakistan who encouraged and helped me at each step of my academic career. I deeply appreciate their efforts and time
towards my Fulbright scholarship journey. Erin Gillespie, Brian Gillespie, Tashawna Spellen, John Larsen, Gloria Ge
Wan, Dongmei Xie, Guoyan Zhu, Hamdane Bordji, Andrea Mercado and Asif Iqbal, are special people in my life who
been always around to motivate and cheer me up. My partner, Samantha Brown deserves special thanks as being a
very supportive and uplifting person as I finish this chapter of my life. Her unwavering love and belief in me helped
me a lot throughout this challenging part of my life.
Finally, I would like to dedicate this thesis to my mom who holds a very precious place in my heart. Her
support and prayers have always been with me. Her unconditional love is the greatest thing in the world for me.
Without her struggles, I would not be where I am today. I am very grateful to my dad and siblings for their love and
support as well. Each of them played a special role at each stage of my education. My success indeed is their success
and a great honor for my parents and siblings. At the end, I want to pay my deep gratitude to my high school teacher,
Shokat Ali Rashid who is a catalyst for my academic career. My academic career would have been ended at high
school if his moral and financial support was not there. I am very thankful to him for transforming my life and bringing
me to this successful day of my life.

v
TABLE OF CONTENTS
ACKNOWLEDGEMENTS ........................................................................................................................................ iii
LIST OF TABLES.......................................................................................................................................................ix
LIST OF FIGURES .....................................................................................................................................................xi
LIST OF EQUATIONS .............................................................................................................................................xvi
1. INTRODUCTION ................................................................................................................................................ 1
1.1 Motivation .................................................................................................................................................... 1
2. LITERATURE REVIEW ..................................................................................................................................... 5
2.1 Woody biomass and global demands ........................................................................................................... 5
2.2 Agriculture residues and their applications .................................................................................................. 6
2.3 Sugarcane straw ........................................................................................................................................... 8
2.4 Structural characteristics .............................................................................................................................. 9
2.4.1 Cellulose .............................................................................................................................................. 9
2.4.2 Hemicellulose ...................................................................................................................................... 9
2.4.3 Lignin ................................................................................................................................................ 10
2.4.4 Extractives ......................................................................................................................................... 11
2.4.5 Inorganics .......................................................................................................................................... 11
2.5 Fractionation of SCS and challenges ......................................................................................................... 12
2.6 Fractionation methods ................................................................................................................................ 13
2.6.1 Alkaline fractionation ........................................................................................................................ 13
2.6.2 Acidic fractionation ........................................................................................................................... 14
2.6.3 Organosolv fractionation ................................................................................................................... 14

vi
2.6.4 SAW fractionation ............................................................................................................................. 15
2.7 SAW process parameters ........................................................................................................................... 17
2.7.1 Feedstock material ............................................................................................................................. 17
2.7.2 SO2 concentration .............................................................................................................................. 18
2.7.3 Alcohols & their concentrations ........................................................................................................ 19
2.7.4 pH of cooking liquor ......................................................................................................................... 20
2.7.5 Liquor to feedstock ratio ................................................................................................................... 21
2.7.6 Cooking temperature & duration ....................................................................................................... 22
3. MATERIAL AND METHODS .......................................................................................................................... 23
3.1 Feedstock material ..................................................................................................................................... 23
3.2 Chemical composition of SCS ................................................................................................................... 24
3.3 Fractionation of SCS .................................................................................................................................. 26
3.4 Processing of fractionated SCS .................................................................................................................. 27
4. SCS FRACTIONATION: EFFECT OF DIFFERENT ALCOHOLS ................................................................. 28
4.1 Introduction ................................................................................................................................................ 28
4.2 Kappa-lignin correlations ........................................................................................................................... 28
4.3 Delignification kinetics .............................................................................................................................. 31
4.4 Xylan removal kinetics .............................................................................................................................. 37
4.5 Cellulose hydrolysis kinetics ...................................................................................................................... 41
4.6 Conclusions ................................................................................................................................................ 46
5. CARBOHYDRATES IN SPENT LIQUORS AND SUGARS MASS BALANCE ........................................... 48
5.1 Introduction ................................................................................................................................................ 48
5.2 pH of spent liquors ..................................................................................................................................... 49

vii
5.3 Carbohydrates in spent liquors ................................................................................................................... 50
5.3.1 Combined severity factor (CSF) ........................................................................................................ 50
5.3.2 Monomeric and total sugars .............................................................................................................. 50
5.4 Sugar degradation products ........................................................................................................................ 57
5.5 Conclusions ................................................................................................................................................ 58
6. ALKYL PYRANOSIDES FORMATION .......................................................................................................... 59
6.1 Introduction ................................................................................................................................................ 59
6.2 Alkyl xylosides quantification ................................................................................................................... 61
6.3 Effect of solvent on alkyl xylosides formation........................................................................................... 64
6.4 Effect on monomeric xylose ...................................................................................................................... 69
6.5 Effect on xylo-oligomer and humins .......................................................................................................... 70
6.6 Solvent and xylose losses ........................................................................................................................... 73
6.7 Conclusions ................................................................................................................................................ 74
7. SUGARS AND SOLVENT RECOVERY.......................................................................................................... 76
7.1 Introduction ................................................................................................................................................ 76
7.2 Washing and handling losses ..................................................................................................................... 76
7.3 Alkyl pyranosides hydrolysis ..................................................................................................................... 77
7.3.1 SO2 and alcohol removal ................................................................................................................... 77
7.3.2 Heat treatment of EVAP liquors ........................................................................................................ 79
7.4 Ethyl pyranosides hydrolysis ..................................................................................................................... 80
7.5 Isopropyl pyranosides hydrolysis ............................................................................................................... 86
7.6 Conclusions ................................................................................................................................................ 90
8. LIGNIN MODIFICATIONS: EFFECT OF SOLVENTS................................................................................... 91

viii
8.1 Introduction ................................................................................................................................................ 91
8.2 Lignin separation and analysis ................................................................................................................... 92
8.3 Lignin sulfonation ...................................................................................................................................... 93
8.4 Molecular weight distribution of SAW lignin ............................................................................................ 96
8.5 2D HSQC NMR analysis of precipitated lignin ......................................................................................... 99
8.6 Conclusions .............................................................................................................................................. 107
9. CONCLUSIONS AND RECOMMENDATIONS............................................................................................ 108
10. REFERENCES ................................................................................................................................................. 112
11. APPENDIX A. SMW PULPS AND SPENT LIQUORS ................................................................................. 124
12. APPENDIX B. SEW PULPS AND SPENT LIQUORS ................................................................................... 125
13. APPENDIX C. SPW PULPS AND SPENT LIQUORS ................................................................................... 126
14. BIOGRAPHY OF THE AUTHOR ................................................................................................................... 127

ix
LIST OF TABLES
Table 2.1: Trends in global forest area ......................................................................................................................... 6
Table 3.1: Chemical composition of sugarcane straw (SCS) .......................................................................................25
Table 4.1: Protein in fractionated SCS ........................................................................................................................30
Table 4.2: Bulk delignification rate constants and activation energies ........................................................................34
Table 4.3: Xylan removal (bulk phase) rate constants with activation energy data .....................................................39
Table 4.4: Delignification selectivity over xylan removal ...........................................................................................40
Table 4.5: Rate constant and activation energy values for cellulose hydrolysis ..........................................................45
Table 4.6: Delignification selectivity over cellulose hydrolysis ..................................................................................46
Table 5.1: pH of SMW, SEW and SPW spent liquors at different fractionation conditions .......................................49
Table 5.2: Sugars and dehydration products concentrations in fresh & hydrolyzed SL at CSF=2.4±0.1 ....................53
Table 5.3: Total sugars mass balance at CSF= 2.4±0.1 ...............................................................................................55
Table 6.1: Xylosides preparation from xylose-alcohol mixtures .................................................................................63
Table 6.2: Rate constants for D-xylose methanolysis (adapted from Bishop & Cooper, 1963) ..................................67
Table 6.3: Xylan in pulp and its equivalent amount in different components of SL at CSF=2.4±0.1 .........................72
Table 6.4: Effect of CSF on xylo-oligomer and humins formation in SEW fractionation of SCS ..............................73
Table 7.1: Effect of water washing on pulp properties ................................................................................................76
Table 7.2: Evaporative handling mass losses during SAW fractionation of SCS ........................................................77
Table 7.3: Rotovap and lignin precipitation ................................................................................................................78
Table 7.4: Effect of washings and rotary evaporation on spent liquors contents ........................................................79
Table 7.5: Kinetic paraments of alkyl xylosides hydrolysis ........................................................................................81

x
Table 7.6: Non-xylose sugars mass and molar balance for fresh and hydrolyzed spent liquors ..................................86
Table 8.1: Sulfonation of lignin in SAW fractionation of SCS ...................................................................................95
Table 8.2: Temperature effect on lignin sulfonation....................................................................................................96
Table 8.3: Average molecular weights and polydispersity of SAW lignin ..................................................................98
Table 8.4: Alcoxy groups in precipitated lignin (mM/g lignin) ...................................................................................98
Table 8.5: Assignments of the lignin 13C-1H correlation signals in the HSQC spectra of SAW
lignin from SCS .........................................................................................................................................................102
Table 8.6: Assignments of the carbohydrates 13C-1H correlation signals in the HSQC spectra of SAW
lignin from SCS .........................................................................................................................................................106
Table A.1: Properties of pulps and spent liquors from SMW fractionation of SCS ..................................................124
Table B.1: Properties of pulps and spent liquors from SEW fractionation of SCS ...................................................125
Table C.1: Properties of pulps and spent liquors from SPW fractionation of SCS ....................................................126

xi
LIST OF FIGURES
Figure 2.1: World production of major crops (FAO, 2014) ........................................................... 7
Figure 2.2: Lignin/phenolics-carbohydrate complex in wheat straw [adapted from
(Sun, et al., 1997)]......................................................................................................................... 12
Figure 2.3: Sulfonation of lignin in acid sulfite cooking .............................................................. 21
Figure 3.1: Ash in different fractions of SCS ............................................................................... 23
Figure 3.2: Elemental ash analysis of SCS fractions .................................................................... 24
Figure 3.3: Preparation of cooking liquor ..................................................................................... 26
Figure 3.4: Alcohol and water washing of fractionated SCS........................................................ 27
Figure 4.1: Kappa vs ash free acid insoluble lignin relations (unmodified) for SMW,
SEW and SPW pulps. Color coding shows three different temperatures.
Green (135°C), Blue (145°C) and Red (155°C) ........................................................................... 29
Figure 4.2: Kappa vs lignin relations (modified) for SMW, SEW and SPW pulps.
Color coding shows different temperatures. Green (135°C), Blue (145°C) and
Red (155°C). Blue dotted line represents the average of the SMW, SEW and SPW
correlations .................................................................................................................................... 31
Figure 4.3: Natural logarithm of residual lignin (g/100 g SCS) vs cooking duration for
SMW pulping ................................................................................................................................ 32

xii
Figure 4.4: Natural logarithm of residual lignin (g/100 g SCS) vs cooking duration for
SEW pulping ................................................................................................................................. 32
Figure 4.5: Natural logarithm of residual lignin (g/100 g SCS) vs cooking duration for
SPW pulping ................................................................................................................................. 33
Figure 4.6: Typical structures of lignin units ................................................................................ 36
Figure 4.7: Arrhenius plot (delignification kinetics) for SMW, SEW and SPW .......................... 36
Figure 4.8: Natural logarithm of residual xylan vs cooking time for SMW pulping of SCS ....... 38
Figure 4.9: Natural logarithm of residual xylan vs cooking time for SEW pulping of SCS ........ 38
Figure 4.10: Natural logarithm of residual xylan vs cooking time for SPW pulping of SCS ...... 38
Figure 4.11: Arrhenius plot (xylan removal kinetics) for SMW, SEW and SPW ........................ 40
Figure 4.12: Methanol (SMW), ethanol (SEW) and isopropanol (SPW) pulps viscosity at
135°C ............................................................................................................................................ 42
Figure 4.13: Methanol (SMW), ethanol (SEW) and isopropanol (SPW) pulps viscosity at
145°C ............................................................................................................................................ 42
Figure 4.14: Methanol (SMW), ethanol (SEW) and isopropanol (SPW) pulps viscosity at
155°C ............................................................................................................................................ 42
Figure 4.15: Cellulose hydrolysis kinetics in SMW pulping system ............................................ 44
Figure 4.16: Cellulose hydrolysis kinetics in SEW pulping system ............................................. 44

xiii
Figure 4.17: Cellulose hydrolysis kinetics in SPW pulping system ............................................. 44
Figure 4.18: Arrhenius plot (cellulose hydrolysis kinetics) for SMW, SEW and SPW ............... 45
Figure 5.1: Monomeric and total dissolved sugars in SEW spent liquors as a function of
temperature and time. Color coding shows different temperatures. Green (135°C),
Blue (145°C) and Red (155°C) ..................................................................................................... 51
Figure 5.2: Monomeric and total sugars in SEW spent liquors .................................................... 52
Figure 5.3: Monomeric and total sugars in SMW spent liquors ................................................... 52
Figure 5.4: Monomeric and total sugars in SPW spent liquors .................................................... 52
Figure 6.1: Hydrolysis of SCS xylan and formation of alcohol xylosides in acidic media
(R=alcohol group i.e. CH3O, C2H5O or C3H7O) ........................................................................... 60
Figure 6.2: Xylosides chromatograms on BIO-RAD Aminex HPX-87K HPLC column ........... 61
Figure 6.3: HPLC chromatograms showing the effect of adding H2O2 in fresh SEW
cooking liquor. Red color shows chromatograms for fresh SEW cooking liquor while
black after H2O2 addition. SO2 elution time is 12.6 minutes ........................................................ 62
Figure 6.4: Methyl xylosides calibration curves from standards .................................................. 64
Figure 6.5: Ethyl xylosides calibration curves from standard and laboratory prepared
sample. .......................................................................................................................................... 64
Figure 6.6: Isopropyl xylosides calibrations from laboratory prepared sample ........................... 64
Figure 6.7: Alpha ethyl xyloside (aEX) formation in SEW fractionation of SCS ........................ 65

xiv
Figure 6.8: Beta ethyl xyloside (bEX) formation in SEW fractionation of SCS .......................... 65
Figure 6.9: Kinetics of alpha xyloside (aX) formation in SMW, SEW and SPW
fractionation .................................................................................................................................. 66
Figure 6.10: Kinetics of beta xyloside (bX) formation in SMW, SEW and SPW
fractionation .................................................................................................................................. 66
Figure 6.11: Alpha xyloside (aX) and beta xyloside (bX) equilibrium in spent liquors .............. 67
Figure 6.12: Xylosides concentration in SMW, SEW and SPW spent liquors ............................. 68
Figure 6.13: Concentration of monomeric xylose in SMW, SEW and SPW spent liquors .......... 69
Figure 6.14: Xylosides formation by an equilibrium reaction ...................................................... 70
Figure 6.15: Xylose & alcohol bound as alkyl xylosides in SAW spent liquors .......................... 74
Figure 7.1: Ethyl xylosides (EX) hydrolysis at different temperatures ........................................ 80
Figure 7.2: Kinetics of ethyl xylosides (EX) hydrolysis............................................................... 81
Figure 7.3: Xylose release from ethyl xylosides (EX) hydrolysis ................................................ 82
Figure 7.4: Ethanol release from ethyl xylosides (EX) hydrolysis ............................................... 84
Figure 7.5: Content of methoxy, ethoxy and isopropoxy functional groups in
SAW lignins .................................................................................................................................. 85
Figure 7.6: Isopropyl xylosides (PX) hydrolysis at different temperatures .................................. 87
Figure 7.7: Kinetics of isopropyl xylosides (PX) hydrolysis ........................................................ 88

xv
Figure 7.8: Xylose release from isopropyl xylosides (PX) hydrolysis ......................................... 89
Figure 7.9: Isopropanol (IPA) release from isopropyl xylosides (PX) hydrolysis ...................... 89
Figure 8.1: Precipitated lignin from SMW fractionation .............................................................. 92
Figure 8.2: Precipitated lignin from SEW fractionation ............................................................... 92
Figure 8.3: Precipitated lignin from SPW fractionation ............................................................... 92
Figure 8.4: Molecular weight distribution of SMW, SEW and SPW lignin................................. 97
Figure 8.5: 2D-HSQC spectrum of SMW lignin from SCS fractionation ...................................100
Figure 8.6: 2D-HSQC spectrum of SEW lignin from SCS fractionation ....................................100
Figure 8.7: 2D-HSQC spectrum of SPW lignin from SCS fractionation ....................................101
Figure 8.8: Typical structures of identified aromatic units in SAW lignin
[structures adapted from (She, et al., 2012; Santos, et al., 2015)] ...............................................104

xvi
LIST OF EQUATIONS
[𝐿𝑖𝑔𝑛𝑖𝑛] = 0.134×kappa ×𝑃𝑢𝑙𝑝 𝑌𝑖𝑒𝑙𝑑 (1)
−𝑑[𝐿𝑖𝑔]
𝑑𝑡= 𝑘′
𝐿𝑖𝑔 (𝑇) [𝐿𝑖𝑔]𝑎 [𝐻3𝑂+]𝑏 = 𝑘𝐿𝑖𝑔 (𝑇) [𝐿𝑖𝑔] (2)
𝛿 = √[(∆𝐻 − 𝑅𝑇)𝜌
𝑀𝑊] (3)
𝑋𝑦𝑙𝑎𝑛 = 𝑋𝑦𝑙𝑜𝑠𝑒 (132
150) + 𝑈𝐴 (0.6) (
132
176) (4)
−𝑑[𝑋𝑦𝑙]
𝑑𝑡= 𝑘′
𝑋𝑦𝑙 (𝑇) [𝑋𝑦𝑙]𝑎 [𝐻3𝑂+]𝑏 = 𝑘𝑋𝑦𝑙 (𝑇) [𝑋𝑦𝑙] (5)
𝐷𝑃𝑣 = (1.65[𝜂] − 116[𝐻𝑒𝑚𝑖]𝑝𝑢𝑙𝑝
[𝐶𝑒𝑙]𝑝𝑢𝑙𝑝
)
1.111
(6)
1
𝐷𝑃−
1
𝐷𝑃0
= 𝑘′𝐶𝑒𝑙 (𝑇) [𝐻3 𝑂
+]𝑡 = 𝑘𝐶𝑒𝑙 (𝑇) 𝑡 (7)
CSF = log {t (min) * eT (°C) -100
14.7 } - pH (8)
Anhydro-pentose = Pentose x (132/150) (9)
Anhydro-hexose = Hexose x (162/180) (10)
𝐻2𝑂2 + 𝑆𝑂2 → 𝐻2𝑆𝑂4 (11)
𝐶7𝐻14𝑂5 + 𝐻2𝑂 ↔ 𝐶2𝐻5𝑂𝐻 + 𝐶5𝐻10𝑂5 (12)
𝐶8𝐻16𝑂5 + 𝐻2𝑂 ↔ 𝐶3𝐻7𝑂𝐻 + 𝐶5𝐻10𝑂5 (13)

1
Chapter 1
1. INTRODUCTION
1.1 Motivation
The interest in the synthesis of bio-based products and biofuels from lignocellulosic biomass is increasing
continuously. This interest stems from the fact that fossil fuels are non-renewable and their combustion releases
greenhouse gases which negatively impact the air quality. On the other hand, the lignocellulosic materials are
renewable, abundant and minimize the impact on climate change caused by greenhouse gases. Lignocellulosic biomass
includes wood, agriculture residues, water plants, grasses and other plant substances (Rowell, et al., 2000). Bioethanol
is the world’s most produced biofuel so far from lignocellulosic biomass (Chovau, et al., 2013). Typically, it is
produced from corn or sugarcane (Goldemberg, 2007) but both renewable feedstocks compete with human food supply
because they require prime agricultural land. On the other hand, trees can be grown on marginal land, thus eliminating
the conflict with food production when considering woody biomass as a feedstock for biofuels. However, presently
the trees are mostly used for lumber and other construction materials as well as for pulp and paper production (FAO,
2014). Pulp and paper demand varies depending upon the degree of development of the region. However, during the
last decade pulp demand in developed countries is stagnant or decreasing, while demand is still increasing in
developing nations. The latter results in a shortage of wood and gradual deforestation in developing countries. For this
reason, non-woody materials are being considered as feedstock for pulping and paper making products in those regions
(Moryia, et al., 2007).
Agricultural residues are one of the non-woody biomass that is abundantly available in many countries. The
high growth rate and adaptability to various soil types makes agriculture fibers a good alternative to wood as raw
material for pulping/fractionation (Rocero, et al., 2003). Sugarcane straw (SCS) is one of the abundantly available
agriculture residues. The biomass that is removed before sugarcane is crushed is known as SCS (Moryia, et al., 2007;
Saad, et al., 2008). It consists of fresh and dried leaves including the tip of the plant (Saad, et al., 2008; Neto, 2005).
Food and agriculture organization (FAO) statistics shows that the annual production of sugarcane worldwide in 2014
is nearly 1900 MMT (Million Metric Ton) (FAO, 2014). Since 140-150 kg of SCS is produced from one ton of
cultivated sugarcane (Saad, et al., 2008), nearly 285 MMT SCS is being produced annually around the world. Brazil
is the foremost sugarcane producing country with 84 MMT of SCS annual production (Canilha, et al., 2012).

2
Traditionally it is burnt in the field, thereby destroying a potential lignocellulosic feedstock as well as causing
environmental pollution. Nowadays, in Brazil, burning of SCS is strictly controlled by a specific federal law (Decree
2661/98) and in the state of Sao Paulo by an even more restrictive law (State law 11.241/02) (Chagas, 2014).
Therefore, it is logical to consider SCS for production of renewable products such as pulps, biofuels and renewable
chemicals.
Although SCS is a cheap raw material to produce bio-based products, successful commercialization is highly
dependent on the choice of biomass conversion technology. The fundamental difference between conversion
technologies is the primary catalysis system (Foust, et al., 2008). Thermochemical conversion processes rely on heat
and physical catalyst to produce an intermediate gas or liquid stream followed by conversion to biofuel. In contrast,
biochemical processes use biocatalysts such as enzyme or other microbes to convert a mixed sugar stream, produced
from biomass fractionation, into biofuels (Foust, et al., 2009). High selectivity and conversion efficiencies are clear
advantages of biochemical processes (Himmel, et al., 2007), while thermochemical processes can handle different
types as well as all components of biomass feedstocks (Hallen, et al., 1998). Foust and his team (Foust, et al., 2009)
show that both conversion technologies are very similar within marginal error in terms of overall cost, efficiency and
environmental impact. However, biochemical processes seem to be well suited for herbaceous biomass and pose
serious challenges for thermochemical processes due to high inorganic (ash) content. Separation of lignocellulosic
biomass, including SCS, into its basic components (cellulose, hemicellulose and lignin) is the first step in biochemical
conversion processes. This step is frequently referred to as fractionation. However, alternative terms such as
pretreatment and pulping, are used to describe the same phenomenon in this thesis.
Fractionation/pulping of lignocellulosic biomass, including SCS, is achieved employing different chemical and
mechanical processes. Kraft (sulfate) and AS are the two well-known chemical pulping processes. However,
organosolv pretreatments are considered environmentally friendly because they use relatively benign solvents and
does not produce odorous pollutants as in the kraft pulping process. Typically, such fractionation/pretreatment
processes use highly volatile organic compounds (methanol, ethanol, acetone, ethyl acetate, etc.) in view of their
simple recovery by distillation (Rodríguez & Jiménez, 2008). The most commonly used solvents in organosolv
processes are low molecular weight aliphatic alcohols. Methanol and ethanol are of particular interest for commercial
processes because of their low cost (Oliet, et al., 2002). Alcell (ethanol+ water), Organocell (methanol/ethanol+alkali)

3
and ASAM (alkaline+sulfite+anthraquinone+methanol) are three well known organosolv processes tested at
commercial or demonstration scale that use either methanol or ethanol (Pye & Lora, 1991; Young, 1992; Black, 1991).
Methanol has advantages of very low cost and simple recovery because of its low boiling point and formation of some
methanol (1020-1330 mg L-1) from the biomass during the fractionation process (Zhu, et al., 1999). However, its
higher toxicity and flammability make it less desirable. Ethanol in comparison is more expensive but less toxic and
volatile. A disadvantage of both methanol and ethanol is the high process pressure during fractionation leading to high
capital cost (Aziz & Sarkanen, 1989). The use of isopropanol is not very common in pulping but a few previous studies
show that addition of isopropanol to cooking sulfite liquor improves the pulping process. For example, the addition
of 40-50% isopropanol to magnesium bisulfite liquor improves pulp strength, increases pulp yield and increases the
delignification rate (Sakai, et al., 1983; Sakai & Uprichard, 1987). The explanation given is that addition of
isopropanol reduces the dissolution of hemicelluloses due to reduction in acidity, while it increases the solubility of
high molecular weight lignin fragments. The advantage of isopropanol is its lower volatility and fewer regulations
compared to ethanol.
High solvent loss is another major obstacle for full scale implementation of organosolv processes. These losses
are related to chemical reaction of alcohol with dissolved carbohydrates (Hu, et al., 2012; Drouet, et al., 1994; Grisel,
et al., 2014; Hu, et al., 2014), lignin (Bauer, et al., 2012; Lancefield, et al., 2017) and formed acids (Bublitz & Wilson,
1983) in addition to mechanical or vapors losses associated with washing of the produced pulp fibers. It is also worth
mentioning that organosolv processes are not effective for fractionating softwood feedstocks (Paszner & Cho, 1989;
Foust, et al., 2009).
A variant of organosolv pulping, the so called SO2–Alcohol-Water (SAW) process was recently investigated
in much detail at Aalto University in Finland (Iakovlev, 2011a; Yamamoto, 2014a; Sklavounos, 2014; You, et al.,
2016). The process was referred as SO2-Ethanol-Water (SEW) because ethanol was used in fractionation liquor. It can
efficiently fractionate all type of lignocellulosic biomass including softwood feedstocks. Successful fractionation of
spruce, beech and wheat straw was achieved with SEW (Iakovlev, et al., 2011b). Yamamoto (2014a) evaluated the
enzymatic hydrolysis potential of SEW pulps produced from hardwood and softwood forest biomass. In two parallel
studies Sklavounos (2014) and Jurgens et al. (2012) determined the recovery pathway and ABE fermentation potential
respectively of SEW spent liquors. Most recently the SEW process was applied to SCS using a relatively low

4
ethanol/water mass ratio of 22.5/65.5 (You, et al., 2016). However, no clear delignification kinetics were presented
because of high data scatter. Overall this process has distinct advantages of a short cooking time, lower fractionation
temperature than kraft pulping, less sulfur consumption than acid sulfite (AS) cooking, simple recovery of the solvent
and SO2 by evaporation, and reduced formation of sticky lignin (Primakov, et al., 1979; Iakovlev, 2011a). However,
toxicity and flammability of ethanol, high fractionation pressure and release of SO2 to the atmosphere are some
important safety concerns. Solvent losses during mechanical handling of fractionated biomass and chemical reactions
of the solvent with lignin and carbohydrates are still crucial hurdles for implementation of this technology.
All above mentioned SAW studies focus mostly on using wood materials and ethanol with SO2 (Iakovlev, 2011a;
Sklavounos, 2014; Yamamoto, 2014a). Efficient fractionation of spruce (Iakovlev, 2011a), production of
enzymatically digestible pulp from SW and HW biomass (Yamamoto, 2014a), spent liquor conditioning for ABE
fermentation (Sklavounos, 2014) and effect of ethanol concentration on SCS fractionation (You, et al., 2016) were
main issues addressed in these studies. Only ethanol was used in all these studies and the process (SEW) was not
evaluated for alcoholysis reactions and solvent recovery. Therefore, the present study is undertaken to evaluate the
process for different solvents and their interactions in SCS fractionation. Two other fully water miscible alcohols,
methanol and isopropanol in comparison to ethanol are employed to investigate the fractionation potential of
abundantly available agriculture residue SCS using the SAW process. SO2–Methanol-Water, SO2-Ethanol-Water and
SO2–isopropanol-Water fractionation systems are designated as SMW, SEW and SPW in this study. Methanol and
ethanol are used because of above mentioned advantages while isopropanol is considered because of its low health
and safety regulations. Low fractionation pressure is another positive aspect of isopropanol. Another interesting aspect
of isopropanol is that it will show how SAW fractionation systems behave when a secondary alcohol rather than
primary alcohols (methanol and ethanol) are used. Complete water miscibility and high solubility of SO2 are two other
important parameters which were considered in the selection of alcohols in the present study.

5
Chapter 2
2. LITERATURE REVIEW
2.1 Woody biomass and global demands
Global population level, food demand, consumption of lignocellulosic biomass and fossil fuels are very closely
interlinked. The rapidly increasing world population leads to increasing demand of food and textile fibers (Pimentel,
2007; Nellemann, et al., 2009). On the other hand, rising crude oil prices and environmental concerns calls for the
replacement of fossil fuels by biofuels (Agbogbo & Coward-Kelly, 2008; IEA, 2012). Many authors have reported on
the production of ethanol, butanol and isopropanol from lignocellulosic biomass (Survase, et al., 2013; Nigam, 2001;
Agbogbo & Coward-Kelly, 2008; Canilha, et al., 2010; Jurgens, et al., 2012; Moryia, et al., 2007; Silva, et al., 2010;
Survase, et al., 2011; Biswas, et al., 2013). Forests have been cleared for cultivation of crops to meet the increasing
food requirements. But at the same time the food supply chain needs large scale paper and board production from
lignocellulosics. Recent FAO data (FAO, 2014) show that wrapping and packaging accounted for about half of the
total paper and pulp production in 2013.
Lignocellulosics consist of different biomass species including wood, agriculture residues, water plants,
grasses and other plant substances (Rowell, et al., 2000). Conventionally wood has been used to produce a wide variety
of biomass products as well as functions as an energy source (FAO, 2014). The enormous increase in the use of fossil
fuels over the last 100 years has not only changed the world economics but also affected air quality. At the same time,
many forests have been cleared out for agriculture land and timber production (WWF, 2017). The Forest Resource
Assessment (FRA) of the FAO (FAO, 2015) has documented a significant decrease in forest area from 1990-2015 as
shown in Table 2.1. There has been a large loss in forest area in Africa and South America in the last two decades
(1990-2000, 2001-2010), although the net forest area loss in the second decade is slowing down in these regions.
Deforestation, including uncontrolled conversion of forests to agriculture land, seems to be major factor for this loss.
The loss in Oceania, Asia, North and Central America regions is comparatively much smaller especially in North
America, while the forest area changed from a loss to a large increase in Asia in the second decade due to new forest
plantations that make 7% of forest area (or 264 million ha) (FAO, 2010).

6
Table 2.1: Trends in global forest area
Annual net change
Year Forest (million ha) Period Area (million ha) % Change
1990 4128
2000 4056 1990-2000 -7.3 -0.18
2005 4033 2000-2005 -4.6 -0.11
2010 4016 2005-2010 -3.4 -0.08
2015 3999 2005-2015 -3.3 -0.08
2.2 Agriculture residues and their applications
The large portion of forest landmass has already turned into cultivated agricultural land and the availability of
arable land is limited and even decreasing because of soil degradation (desertification, salinization) (Pimentel, 2007;
Nellemann, et al., 2009). To meet the global food, fibers and fuel demands in a sustainable manner, agriculture residues
can be a good option because of following reasons;
• Agriculture residues are abundantly available
• The use of agriculture residues for fuel and fibers doesn’t affect food supply as for example it does when
corn is used for ethanol production
• It helps with environmental protection because conventionally agriculture residues are burnt in open fields
• It helps to preserve forests
Agriculture residues include a wide variety of biomass including sugarcane bagasse (SCB), sugarcane straw
(SCS), wheat straw (WS) and rice straw (RS). These materials are abundantly available throughout the world and their
availability depends on the production of the respective crop and production region. FAO major crops production data
(2010-2014) show that sugarcane, maize, wheat and rice are the most abundantly cultivated crops throughout the
world (Figure 2.1). The world production of sugarcane has been over 1800 MMT/year since 2011. Global production
of wheat and rice at about 700 MMT/y each, and maize has now surpassed 1000 MMT/y. Regarding the availability
of biomass, a recent study of US Department of energy depicts that the available biomass in 2030 for industrial
bioprocessing in the US would be between 1.1 and 1.6 billion tons (U.S. Department of Energy, 2011). Of this total,
agriculture residues and wastes represent 404 million dry tons. Therefore, above mentioned agriculture crops can
provide an enormous amount of residual biomass that can be used to produce chemicals, pulps and biofuels without
affecting the food supply chain.

7
Figure 2.1: World production of major crops (FAO, 2014)
Normally most of the agriculture residues are burnt in the open field to clear the arable land. This practice is
harmful for the environment, produces greenhouse gases as well as creates severe respiratory problems. Some of the
conventional uses of these residues include animal feed, feedstock for the paper industry and use as organic fertilizer
(Vlasenko, et al., 1997; Goncalves, et al., 2005; Ereno, 2008). The use of agricultural residues for pulp and alcohol
production provides different substrates and helps to mitigate the above described pollution problems (Sun, et al.,
2003). Pulp obtained from the processing of SCB is used in the manufacturing of diverse products including facial
and toilet tissue, a variety of writing and printing papers, bag and wrapping papers, corrugating medium, and
linerboard. These represent only a small fraction of the total SCB produced (Rowell & Keany, 1991). Pulps from SCS
and RS may be used for similar products. Motivated by the availability (Figure 2.1) and high cellulose content of SCS,
some researchers have focused on developing textile fibers from this residue (Costa, et al., 2013). This technology is
under development and may give an innovative and non-polluting application of this feedstock. Other products for
which SCS has been evaluated include lyocell fiber and ethanol (Costa, et al., 2015), enzymes (Singh & Suman, 2008),
bio-oil and bio-electricity (Azad, et al., 2014), and reinforcement of polypropylene and polyurethane (Luz, et al., 2010;
Miléo, et al., 2011). The use of rice straw for value added products such as ethanol and other chemicals has been
widely studied. In search for feasible alternatives, California rice cultivators have considered straw as a source for
liquid fuels and energy. Rice straw contains 60% carbohydrates by weight, and therefore has been considered a
0
200
400
600
800
1000
1200
1400
1600
1800
2000
2010 2011 2012 2013 2014
MM
T
Sugarcane Wheat Rice paddy Maize

8
significant feedstock for fermentation products (Vlasenko, et al., 1997; Sun & Cheng, 2002). In Thailand, SCB and
RS are abundant agriculture residues. Biofuels and bio-based materials can be produced from cellulose and
hemicelluloses obtained from these agro-residues by so called biorefinery processes (Sakdaronnarong &
Jonglertjunya, 2012).
2.3 Sugarcane straw
SCS is the material that is removed from the stalk before the sugarcane is crushed (Moryia, et al., 2007; Saad,
et al., 2008). It consists of the fresh and dried leaves including the tip of the plant (Neto, 2005; Saad, et al., 2008).
140-150 kg of SCS is produced from one ton of cultivated sugarcane (Saad, et al., 2008) . In a view of the total
sugarcane production (Figure 2.1), especially in Brazil, enormous amounts of SCS are potentially available for pulping
and biofuels production.
The composition of feedstocks is important for process development and understanding the effect of process
parameters. Like all lignocellulosic biomass, SCS is composed of the three main macromolecular components:
cellulose, hemicelluloses and lignin (Lu, et al., 2009). The composition of SCS depends on the material collection
site, climate conditions, stage of plant development and variety (Gómez, et al., 2010; Santos, et al., 2012). Costa et al.
(2015) has compared the chemical composition of SCS, reported in many earlier publications, and concludes that
typically it contains 32.4-44.4% cellulose, 24.2-30.8% hemicelluloses, 12.0-36.1% lignin, 2.4-7.8% ash and 2.5-
10.6% extractives. Characterization of different parts of sugarcane (stalk, straw and residual bagasse) provides
important details of its structure. Several studies (Triana, et al., 1990; Neto, 2005; Canilha, et al., 2012) show large
variations in the moisture content of the sugarcane material, varying from 13.5% (in dry leaves) up to 82.3% (in the
tops); but the values of ash, fixed carbon, and volatile matter vary little among green leaves, dry leaves and straw,
with a lower amount of ash for bagasse. Also, all components have practically the same elemental composition of
carbon (∼45%), hydrogen (∼6%), nitrogen (0.5–1%), oxygen (∼43%), and sulfur (∼0.1%); mineral composition for
alkalis and phosphorus shows some variation among the three components of the SCS, indicating that its content
increases from the dry leaves to the tops, and is significantly higher than bagasse. Azad et al. (2014) performed
proximate, ultimate and mineral analysis of three individual parts of sugarcane and found similar results.

9
2.4 Structural characteristics
Structural characteristics of agriculture residues, including SCS, play a crucial role in the fractionation process
and end use of products obtained. Therefore, it is essential to review the structural characterization of the
hemicelluloses, cellulose and lignin, the three major components of lignocellulosics
2.4.1 Cellulose
Many industrial products (paper, fibers, films, additives etc.) are made from cellulose. It is isolated from
wood through a well-known process called pulping. The characteristics of pulp obtained depend on the chemicals used
for pulping, operating environment (acidic, neutral, or alkaline) and operating conditions like pressure and temperature
(Fengel & Wegener, 1984). Cellulose is the most abundant component in SCS (Costa, et al., 2015). The
anhydroglucopyranose units join to form a molecular chain of cellulose. Therefore, cellulose can be considered as a
linear glucan polymer. The anhydroglucopyranose units are linked together by -(14) glycosidic linkages and thus
cellulose chains have a reducing and non-reducing end. The behavior of these end groups during pulping is determined
by their chemical properties. The –OH group on C1 position is an aldehyde hydrate group deriving from ring formation
by an intramolecular hemiacetal linkage. This group is identified by its reducing properties, while the –OH group on
the C4 position is an alcoholic hydroxyl and shows non-reducing behavior (Fengel & Wegener, 1984).
In cellulose, molecules form long linear chains (10,000-15,000 DP) and have a strong tendency to form intra
and intermolecular hydrogen bonds. These bonds result in the formation of microfibrils that are building blocks of the
cell wall. Microfibrils form both highly crystalline regions, as well as amorphous regions. The high crystallinity of
cellulose imparts high tensile strength to cellulose and makes it insoluble in water and many other solvents. This high
crystalline nature is also responsible for its highly recalcitrant nature towards many chemicals during pulping
(Sjöström, 1993; Alén, 2000).
2.4.2 Hemicellulose
Hemicelluloses are also called polyoses, which differ from cellulose in three distinct ways (i) by composition
of different sugar units, (ii) by much shorter molecular chains, and (iii) by branching of the chain molecules. Polyoses
are the basis of a variety of commercial and industrial important products such as ethanol, yeast, xylitol, mannitol,
emulsifiers, resin polymers, acrylates, esters, polyurethanes, nylon, etc. (Fengel & Wegener, 1984). Hemicelluloses
are heteropolysaccharides with either linear or branched chains. They consist of hexose (D-glucose, D-galactose and

10
D-mannose) as well as pentose (D-xylose and D-/L-arabinose) sugar units. These units are linked together at different
molar ratios. Moreover, xylans contain uronic acids as a side chain group. Hemicelluloses are not crystalline and their
DP is much lower (100-200) as compared to cellulose. The low crystallinity is responsible for their low thermal and
chemical stability as well as easy dissolution in pulping/pretreatment processes (Alén, 2000).
The composition of hemicellulose varies from species to species. Softwood (SW) contains more mannose
and galactose while hardwood (HW) is rich in xylan and acetylated hydroxyl groups (Koch, 2006). Xylan is also the
dominant anhydrous sugar unit in agriculture residues. HWs have normally somewhat higher hemicellulose (30-35%)
content than SWs (25-30%). SW xylan contains no acetyl groups while there are about 6% acetyl groups in
galactoglucomannan of SW. Glucomannan of HW is not acetylated while the amount of acetyl groups in
glucuronoxylan varies from 8 to 17% (Alén, 2000). Some hemicelluloses, such as arabinogalactans in larch dissolve
in water easily and most of them are easily hydrolyzed (Sjöström, 1993; Alén, 2000).
2.4.3 Lignin
Lignin is a polymer that consists of repeating units of phenylpropane (Sjöström, 1981). In contrast to other
natural polymers, such as cellulose and protein, lignin is a complex three-dimensional polymer (Buranov & Mazza,
2008). Various investigations show that p-coumaryl alcohol, coniferyl alcohol and sinapyl alcohol are the major
precursors and building units of lignins (Freudenberg, 1965; Bartuska, et al., 1980; Fengel & Wegener, 1984). These
lignin precursors lead to formation of so-called H (p-hydroxyphenyl), G (guaiacyl) and S (syringyl) phenylpropanoid
units. These units show different abundancies depending on their origin (Hage, et al., 2009). The -aryl ether bond
(-O-4) is the most abundant inter unit linkage in all lignins (Alder, 1977). Breaking this linkage is also the central
aspect of industrial processes, such as kraft pulping, and of many analytical methods because it is most easily cleaved
chemically. There are five other linkages called -5, -, 5-5, 5-O-4 and -1. They are comparatively more resistant
to chemical degradation. In acid sulfite pulping α-O-4 is the most important linkage which is hydrolyzed. These bonds
represent only 6-8% of total polymeric linkages in lignin but their breakage and sulfonation is sufficient for lignin
dissolution in the aqueous pulping solution. Lignin is so complex that its structure is not yet completely understood.
Also, it has no structural regularity. In contrast to most of other natural polymers, which have a single inter-monomeric
linkage, lignin contains many different carbon-to-carbon and ether linkages. It is almost impossible to isolate lignin

11
in pure form because of strong physical and chemical linkages between lignin and the cell wall polysaccharides
(Holtmam, et al., 2003).
The composition of lignin differs from species to species. HW lignin consist mainly of guaiacyl and syringyl
units in nearly equally amounts, while, guaiacyl is the major unit in SW. Grass lignins contain p-coumaryl alcohol
derived units along with sinapyl and coniferyl (Alén, 2011). The lignin content varies greatly between species.
Generally, SWs contain 26-32% and HWs 20-28% lignin (Sjöström, 1981), while the lignin content of agricultural
residues is comparable to that of HW. Also, substantial structural differences exist between SW and HW lignins. For
example, SW lignin is more branched, cross-linked and condensed and has a higher molecular weight and higher share
of C-C bonds (Sjöström, 1981; Achyuthan, et al., 2010). These differences are important from a delignification point
of view.
2.4.4 Extractives
Extractives are non-cell wall components, and can be easily removed from biomass using solvents such as
water, acetone, ethanol and benzene. However, they pose problems in pulping of lignocellulosic biomass. Extractives
include resin acids, fats, terpenes, tannins and wide variety of phenolic compounds (Alén, 2000). Phenolic compounds
tend to form cross-links with lignin and cause impaired delignification in acid sulfite pulping. Long storage of biomass
decreases and changes the composition of extractives and in this way, their adverse effects in pulping process can be
minimized (Sjöström, 1981). Polyphenolic substances are very soluble in alkaline solutions (Fengel & Wegener, 1984)
but not soluble in common organic solvents (Jensen, et al., 1963; Hergert, et al., 1965; Dietrichs, et al., 1978).
2.4.5 Inorganics
Potassium, calcium and magnesium are the most common inorganic elements in HW and SW. Some inorganics
are very important for plant growth and thus critical from fertilization and soil conservation point of view. On the
other hand, they are harmful in pulping and energy production processes because of scaling, reaction with pulping
chemicals, and bleaching problems. Forest residues and bark contain more inorganics as compared to wood (Fengel
& Wegener, 1984). Sometimes harvest and logging procedures result in entrainment of materials such as sand and
increase the amount of inorganics in the biomass (Jurgens, et al., 2012). Silicon is the predominant inorganic
compound in SCS ash. SCS contains up to 5% (by weight) of sand and debris as impurities. This is one of the major
12
reasons that alkaline pulping processes, such as soda and kraft, cannot handle agriculture residues. These impurities
are the result of different transport and harvesting procedures of sugarcane (Gómez, et al., 2010).
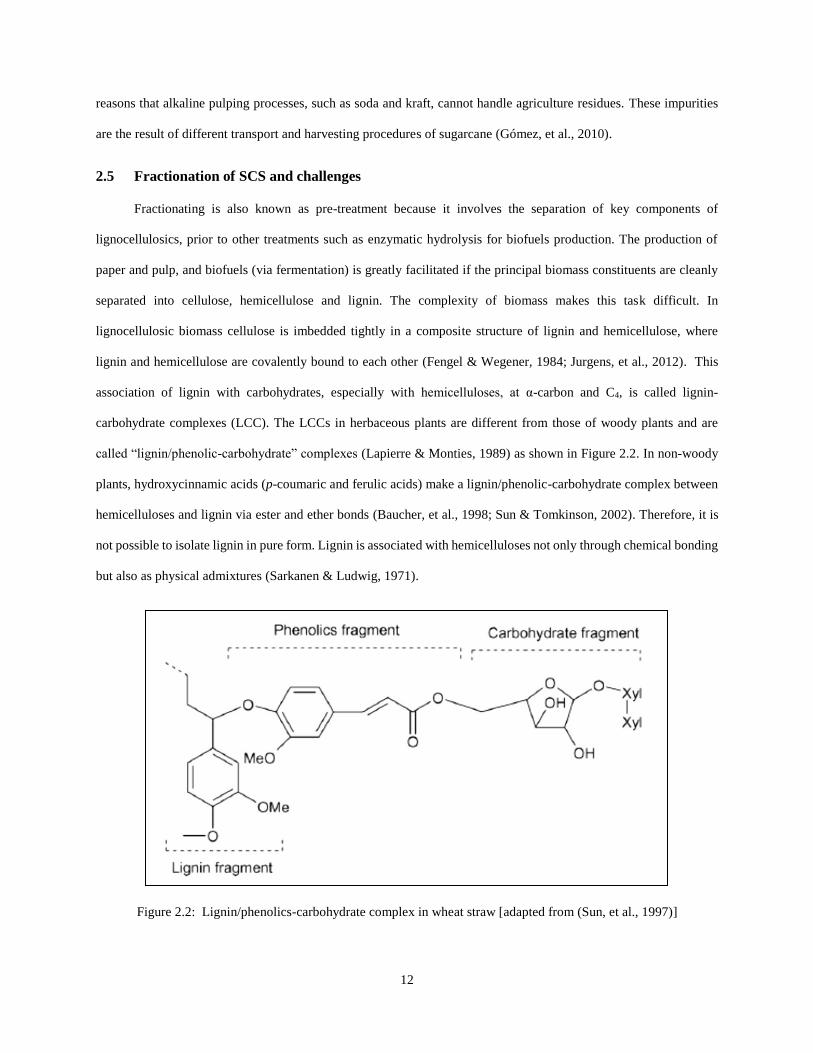
2.5 Fractionation of SCS and challenges
Fractionating is also known as pre-treatment because it involves the separation of key components of
lignocellulosics, prior to other treatments such as enzymatic hydrolysis for biofuels production. The production of
paper and pulp, and biofuels (via fermentation) is greatly facilitated if the principal biomass constituents are cleanly
separated into cellulose, hemicellulose and lignin. The complexity of biomass makes this task difficult. In
lignocellulosic biomass cellulose is imbedded tightly in a composite structure of lignin and hemicellulose, where
lignin and hemicellulose are covalently bound to each other (Fengel & Wegener, 1984; Jurgens, et al., 2012). This
association of lignin with carbohydrates, especially with hemicelluloses, at α-carbon and C4, is called lignin-
carbohydrate complexes (LCC). The LCCs in herbaceous plants are different from those of woody plants and are
called “lignin/phenolic-carbohydrate” complexes (Lapierre & Monties, 1989) as shown in Figure 2.2. In non-woody
plants, hydroxycinnamic acids (p-coumaric and ferulic acids) make a lignin/phenolic-carbohydrate complex between
hemicelluloses and lignin via ester and ether bonds (Baucher, et al., 1998; Sun & Tomkinson, 2002). Therefore, it is
not possible to isolate lignin in pure form. Lignin is associated with hemicelluloses not only through chemical bonding
but also as physical admixtures (Sarkanen & Ludwig, 1971).
Figure 2.2: Lignin/phenolics-carbohydrate complex in wheat straw [adapted from (Sun, et al., 1997)]

13
There is almost 5% ferulic acid in straw lignins and a large portion of ferulic acid residues ester-linked to
polysaccharides can also form an ether bond with phenylpropane units creating a bridge between wall polysaccharides
and lignin, reducing the carbohydrate availability. Lignin and ferulic acid residue are released when alkali attacks the
ester linkages of such bridges, producing a small amount (1-4.3%) of ferulic acid (Lam, et al., 1992; Sun & Tomkinson,
2002). The three main macromolecular components of lignocellulosic materials (cellulose, hemicelluloses and lignin)
can be isolated by chemical, physical or biological treatment. Pulp and paper industries use mostly chemical processes
to accomplish the task (Smook, 1992; Biermann & Christopher, 1996; Rocha, 2000).
2.6 Fractionation methods
Pulping processes disintegrate the lignocellulosic biomass into its principal components by removing,
solubilizing and/or fragmenting the lignin. An ideal delignification achieves 100% isolation of lignin without chemical
disruption of polysaccharides. Unfortunately, no delignification procedure meets this requirement. The isolation of
lignin in unaltered form and its exact structure determination is not possible yet because of its complex molecular
structure and localization within cell wall. All methods of lignin removal either result in changing its native structure
or provide only partial isolation in pure form (Fengel & Wegener, 1984). Biopulping is an alternative for fractionation
of biomass that focusses on minimizing the problems associated with chemical (pollution, high cost, and low yield)
and mechanical (high energy consumption, low mechanical strength) pulping processes (Akhtar, et al., 1998; Messner,
et al., 1998; Ferraz, et al., 2008). The basic objective in chemical pulping is to separate hemicelluloses and lignin from
the lignocellulosics material while leaving cellulose intact. This is a very difficult task and compromises must be made
because 100% separation is not possible (Bajpai, 2012). Chemical pulping methods can be alkaline, acidic or
organosolv.
2.6.1 Alkaline fractionation
The alkaline Kraft pulping process, also known as the sulfate pulping process, is globally the most dominant
pulping process. The process derives its name from the makeup chemical sodium sulfate which is added in the recovery
cycle to compensate for chemical losses. In this process, white liquor (cooking liquor) consists of sodium hydroxide
(NaOH) and sodium sulfide (Na2S). One major advantage of alkaline pulping is that it can be applied to HWs as well
as SWs, while the soda process that uses only sodium hydroxide is limited to HWs (Bajpai, 2012). In alkaline pulping
carbohydrates undergo severe degradation and result in the formation of hydroxycarboxylic acids which are difficult

14
to recover (Carvalheiro, et al., 2008). Complex process of alkali recovery, production of pulps with a relative high
lignin content, synthesis of foul smelling chemicals, scaling during evaporation of black liquor and carbohydrates
degradation are very common problems associated with alkaline pulping. Sometimes alkaline pulping is modified by
addition of anthraquinone (AQ) to limit carbohydrate degradation and improve delignification (Blain, 1993). For
example, improved SCS fractionation have been reported employing 0.15% AQ with 16% Na2O (straw to liquor ratio
of 1:12 m/v%) in the soda/AQ process (Luz & Gonçalves, 2001).
2.6.2 Acidic fractionation
In acid fractionation processes, acidic conditions are provided by addition of an acid to cooking liquor and/or
by formation of acids during cooking. One advantage of acid addition is reduced cooking temperature, but it is
accompanied by serious corrosion problems (Iakovlev, 2011a). The main sulfite fractionation processes are acid sulfite
(AS), bisulfite (magnefite), neutral sulfite semi chemical (NSSC) and alkaline sulfite. Acid sulfite (AS) is the most
well-known acid pulping process. It employs SO2 with M(HSO3)n where M is monovalent or divalent cation (sodium,
ammonium, calcium, magnesium) and n=1 or 2. Contrary to the Kraft process, the sulfite process can be operated at
any pH by changing the amount and composition of chemicals (Biermann & Christopher, 1996; Smook, 1992). A
major drawback of the AS process is its high overall cooking time (around 12 hours) due to very slow impregnation
of the cooking chemicals (Rydholm, 1965; Fengel & Wegener, 1989; Sixta, et al., 2006). Also 10-20% of the
carbohydrates are converted to aldonic acids. Ethanol, xylitol, acetic acid and lignosulfonic acids are some valuable
byproducts of the AS process (Sixta, et al., 2006). The pulp produced by the sulfite process has poorer tear strength
properties compared to Kraft and organosolv pulps (Johansson, et al., 1987) but this pulp can be used for specialty
grade paper, tissue paper and especially dissolving pulp (Fengel & Wegener, 1989). At present AS fractionation of
softwoods is the only commercially operated fractionation process which utilizes dissolved polyoses for ethanol
production (Jurgens, et al., 2012).
2.6.3 Organosolv fractionation
Organosolv fractionation processes commonly use alcohol-water (for example the Alcell process) or
carboxylic acid-water mixtures such as acetic acid and formic acid. Typically, organosolv processes use low boiling
point organic solvents (acetone, ethanol, methanol, dioxane, ethyl acetate etc.) so that they can be easily recovered by
distillation (Rodríguez & Jiménez, 2008). Alcohol based fractionation was first introduced in 1931 (Kleinert &

15
Tayenthal, 1931). The presence of alcohol (ethanol) in water-alcohol mixture results in fast impregnation of
lignocellulosics due to the Marangoni effect (Sternling & Scriven, 1959) and reduces the overall time of fractionation.
Paszner and Cho (1989) research shows that primary alcohols give the highest fractionation efficiency among all
alcohols. Moriya et al. (2007) used an ethanol/water mixture for pulping of SCS and studied the effect of temperature
and time on delignification. Cooking SCS at 200ºC for 2 hour with 50% (w/w) ethanol-water mixture and 1:10 (m/v)
straw to solvent ratio resulted in a weak pulp of only 3.14 cP viscosity and high lignin content (58 kappa number). In
another study Goncalves et al. (2008) fractionated SCS using the acetosolv process. They used 93% (w/w) acetic acid
and 0.3% (w/w) hydrochloric acid as a catalyst and straw to liquid ratio of 1:16 (m/v) with two hours cooking time at
115+5ºC. Another similar kinetic study of acetosolv fractionation of SCS was performed at varying time (0-5 h) and
high acetic acid concentration (73-93%). The catalyst (HCl) concentration and temperature were maintained at 0.3 %
(w/w) and 115+5ºC respectively. After one hour treatment, the observed pulp yields were 45-50% (Saad, et al., 2008).
Organosolv processes also use mixtures of organic solvents to improve pulp and paper quality. For example, Jiménez
et al. (2002) produced pulps from wheat straws using ethanol-acetone mixtures. The pulp produced not only had a
high yield, but also higher tear strength as compared to pulps produced using acetone or ethanol separately.
Although organosolv processes do not produce malodorous compounds as in the Kraft process (Xu, et al.,
2007; Zhang, et al., 2007) these processes unfortunately have limitations regarding the feedstocks they can handle.
For instance, SWs pose problems for many organosolv processes (Paszner & Cho, 1989). Among organosolv
processes only the MILOX (peroxyformic acid) process is capable of pulping softwoods (Sundquist, 2000).
2.6.4 SAW fractionation
SO2-alcohol-water (SAW) processes use SO2 dissolved in an aqueous mixture of alcohol for lignocellulosics
fractionation. This process is a fusion of acid sulfite (AS) and alcohol-water pulping processes. The process was
introduced for the first time by Schorning (1957). He dissolved 5.5% SO2 in a 50% mixture of alcohol-water and
conducted the experiment at 110-135ºC for 5 hours. He used mostly methanol, but also employed ethanol and n-
propanol in his experiments. The process has essentially the same advantages over the Kraft process as does the AS
process: higher carbohydrate yields, lower cooking temperatures, and a pulp of higher brightness and bleachability
(Primakov, 1961).

16
SO2-ethanol-water (SEW) is one of the SAW processes that employ ethyl alcohol. Primakov (1979) and
Iakovlev (2014) identified distinct advantages of this process: it is superior to the AS process in terms of higher
biomass utilization and higher operational performance. For example, the overall cooking time is significantly reduced
due to fast transportation of cooking liquor to the reaction sites because it eliminates the impregnation step, low energy
need due to low cooking temperature, ability to handle wide variety of biomass, absence of formation of sticky lignin,
simple recovery of the pulping chemicals (SO2 and ethanol), and ability to treat “green” as well as dry feedstocks.
Moreover, ethanol proved to be better solvent for lignin and lignosulfonates as compared to water (Primakov, et al.,
1979) and methanol (Puumala, 1991). In his research, Primakov (1961) demonstrated that ethanol could be easily
recovered from SEW cooking.
The mechanism of SAW fractionation process is similar to that of sulfite pulping. Sulfite delignification
follows a two-step mechanism. The first step is fast sulfonation of lignin at the alpha position, and the second step
involves the slow hydrolysis and dissolution of the sulfonated lignin (Hägglund, 1951). In their study on extraction of
lignin from sugarcane bagasse and Pinus taeda, Pasquini et al. (2005) demonstrate that for efficient lignin removal a
strong nucleophilic agent plus a mixture with a high dissolution capacity of lignin fragments is needed. That’s why
the delignification yield with 100% ethanol is less than that with a mixture of 50% ethanol – water in the Alcell pulping
process. The addition of water increases the delignification rate because of the higher effective acidity in water, but
the capacity of lignin to dissolve in an aqueous solution is reduced. SO2 is a moderately strong nucleophile (Fengel &
Wegener, 1989) and this species can sulfonate lignin although at a lower rate than the much stronger nucleophile, the
bisulfite anion (Eliashberg, et al., 1955). In acidic cooking liquors, like acid sulfite and SAW, the main agents
responsible for lignin sulfonation are hydrates and solvates of SO2 and HSO3- anions. The nature of sulfonating agent
has always been a question and no consensus has been reached yet (Iakovlev, 2011a). HSO3- is a stronger nucleophile
than SO2 hydrates and solvates (Gierer, 1970) so a higher sulfonation rate can be expected with this species. However,
in a system like SAW sulfonation is mostly carried out by SO2 species because the concentration of bisulfite anions
is not significant. The rate of lignin sulfonation by SO2 hydrates and solvates are also assumed equal (Iakovlev & van
Heiningen, 2011c).
In SAW pulping, it is reported that about half of the dissolved hemicelluloses are monomeric sugars (Iakovlev
& van Heiningen, 2012a) while the remaining dissolved hemicelluloses are in oligomeric form. The high fraction of

17
oligomeric hemicellulose is surprising considering the high acidity (pH about 1) and high temperature (135°C), and
in the present thesis it will be shown that most of the oligomers are ethylated sugar monomers. After separation of
sulfonated lignin, the monomeric sugars can be used as raw material for production of ethanol/butanol or biochemicals.
It is evident from SEW pulping experiments on spruce, beech and wheat straw that bulk delignification follows pseudo
first order kinetics in lignin, while hemicellulose removal and cellulose degradation can be described as first order and
zero order kinetics (Iakovlev, et al., 2011b). The SEW process also has potential to produce rayon grade pulps and
thus might potentially replace AS pulping (Sixta, et al., 2013). Some of the issues regarding the SEW process are SO2
losses and atmospheric emissions, flammability and losses of the employed alcohol, and corrosiveness of the cooking
liquor. High process pressure and toxicity of ethanol are other major concerns from a health and safety point view.
Some of these problems can be overcome by employing less volatile and toxic alcohol (like isopropanol). However,
it will decrease the efficiency of solvent recovery.
2.7 SAW process parameters
2.7.1 Feedstock material
The chemical structure as well as morphology of biomass species plays a crucial rule in a pulping process
especially the hydrolysis of polysaccharides. For example, it is hard to remove lignin from softwood because of its
condensed nature (Sjöström, 1981; Achyuthan, et al., 2010). However, the bulk delignification rate of hardwood,
softwood and straws in SEW fractionation are very close, while residual delignification is comparatively slower for
hardwoods than softwoods (Iakovlev, 2011a). Moreover, at constant kappa number the lignin and ash free yield for
these species increases in the order: straws < hardwood < softwood (Iakovlev, et al., 2011b). High ash content of
straws leads to high overall yield of pulps (including ash and lignin) from this species when compared to hardwood
and softwood species (Iakovlev, et al., 2011b). The external morphology has relatively weak effects on SAW
fractionation compared to the internal morphology of lignocellulosics. For example, Iakovlev et al. (2009) have shown
that pulp yield, kappa number and viscosity are not affected by particle size, which is an indication that pulping is
governed by chemical reaction rather than by diffusion. Iakovlev (2011a) also fractionated spruce wood chips using
the SEW process (12% SO2, 80 min, 135ºC) and found that both green (dry matter content 48.9%) and air-dried (dry
matter content 92.8%) wood chips resulted in nearly the same pulp and hydrolysate properties when the amount of
cooking liquor used per unit mass of biomass was adjusted for wood chips moisture content. Iakovlev’s suggested
explanation for this observation was the so-called Marangoni effect.

18
In SAW fractionation carbohydrates undergo acid hydrolysis. Their composition in the biomass feedstock
and extent of chemical linkage to other components affects the hydrolysis kinetics. The rate of hydrolysis of the
glycosidic bond at the reducing end of cellulose is slightly slower than that at the non-reducing end (Feather & Harris,
1967) leading to a higher rate of monosaccharide produced than calculated based on uniform cleavage (Sjöström,
1981, p. 83). Similarly, hemicellulose chains are also hydrolyzed but the rate at which pentoses, hexoses and hexuronic
acids are hydrolyzed is different. The rates are estimated from acid hydrolysis of methyl pyranosides of common
biomass monosaccharides. It shows that relative rate for -D-glucose, -D-mannose, α-D-galactose, -D-xylose and
α-D-glucuronic acid are 1.0, 3.0, 2.7, 4.8 and 0.2 respectively (Feather & Harris, 1965). It is also worth considering
that xylan is more prone to acid hydrolysis than glucomannan, and this results in relatively lower substrate yield for
xylan-rich hardwood species compared to glucomannan-rich softwoods (Rydholm, 1965, p. 540; Sixta, et al., 2006,
p. 110).
2.7.2 SO2 concentration
As described earlier, the SAW fractionation mechanism is similar to that of AS pulping. The first step is fast
sulfonation of lignin. SO2 in the cooking liquor is responsible for sulfonation of lignin and the degree of sulfonation
is expressed as the S/C9 molar ratio. In SEW cooking liquor SO2 is mostly present as hydrates and solvates because
no base is added, and these species are likely responsible for sulfonation. A very small amount of SO2 is present in
HSO3- form because of the equilibrium reaction, and is called combined SO2 (Iakovlev, 2011a). The applied amounts
of SO2 and HSO3- in acid sulfite pulping are determined by the Kaufmann diagram (Rydholm, 1965, p. 467) which
shows that unacceptable condensation of lignin (leading to so called “black cooks”) can be avoided in AS pulping if
the SO2 concentration is 12% (w/w) or higher irrespective of the HSO3- concentration. Since the effective acidity is
lower in SEW pulping due to the presence of ethanol, lignin condensation is also not expected to be a significant
problem in SEW pulping at moderate temperatures (135 °C) and relatively high SO2 concentrations. Iakovlev and van
Heiningen (2012b) highlight that in SEW cooking the rate of delignification increases linearly with SO2 concentration
up to 12% and then increases further at a lower rate. Sixta et al. (2006, pp. 459-460) shows that for acid sulfite cooking
at constant total SO2 charge an increase in combined SO2 results in lower acidity and decreases the delignification
rate. In contrast, at constant HSO3- concentration, delignification increases with increase in free SO2. Eliashberg et al.
(1960) and Primakov (1961) also demonstrated that increasing SO2 concentration at 135ºC increases the SEW
delignification. Lignin condensation is an undesirable phenomenon in pulping process because it forms non-cleavable

19
C-C bonds and prevent delignification. High acidity and high temperature promotes lignin condensation (Rozenberger,
1961). Therefore, it is advisable to operate the SAW process at lower temperature and high SO2 concentrations to
avoid condensation reactions.
The concentration of SO2 also affects the hydrolysis of hemicelluloses. Iakovlev et al. (2012a) describes that
increasing the concentration of SO2 results in higher monosaccharide concentrations in the hydrolysate, likely due to
higher acidity of the cooking liquid. On the other hand, at fixed SO2 concentration, increasing cooking duration doesn’t
increase the dissolved monosaccharide fraction as compared to the total amount of dissolved carbohydrates. This
anomaly is further addressed in the present thesis. Cellulose hydrolysis, i.e. depolymerization, increases only slightly
with increasing SO2 concentration because the acidity increase is small. Cellulose is completely retained in solid phase
for SEW fractionation of spruce at 3, 6 and 12% SO2 (Iakovlev & van Heiningen, 2012b) because the cellulose DP
remains high in all cases.
2.7.3 Alcohols & their concentrations
SAW cooking liquor contains SO2 dissolved in an alcohol water mixture. The composition of the alcohol
aqueous solution as well as the amount of cooking liquor employed (liquid to feedstock ratio) have a pronounced
effect on the fractionation of lignocellulosic biomass. The concentration of alcohol in cooking liquor determines its
impregnation potential (Marangoni effect). Impregnation is a very important step in fractionation of biomass.
Generally, in AS cooking of wood chips impregnation is a very slow process that takes around 6 hours (Rydholm,
1965, p. 444; Fengel & Wegener, 1989). A higher difference between surface tension of alcohol-water mixture and
water retained in the cell walls of lignocellulosics promotes the mass flow into the chips and hence decreases the
impregnation time and thus the overall cooking time. The presence of alcohol in cooking liquor eliminates the need
of a separate impregnation step (Iakovlev, 2011a, p. 7). Alcohol also affects the pH of the mixture and hence has a
pronounced effect on carbohydrate hydrolysis and lignin condensation. Sierra-Alvarez & Tjeerdsma (1995) showed
that increasing the ethanol concentration decreases the acidity of cooking liquor, and thus at very high ethanol
concentrations the pH is too high to initiate fractionation. On the other hand, at low ethanol concentration the acidity
is high resulting in carbohydrates hydrolysis and lignin condensation. Therefore, a moderate level of alcohol
concentration is required for effective fractionation.

20
The type of alcohol used in cooking liquor preparation affects the solubility of lignin. Sixta (2006) and
Schuerch (1952) suggest that the solubility parameter (δ-value) and hydrogen potential of solvents can be used to
describe dissolution of lignin in different solvents including alcohols. In general, polymers show the highest solubility
in solvents which have a δ-value close to that of the polymer. In addition, the lignin dissolution potential increases
with an increase in hydrogen bonding potential of the solvent when the solvent has the optimum δ-value. Typical
lignin δ -value reported in the literature is about 28-30 (MPa)1/2 (Ni & Hu, 1995; Quesada-Medina, et al., 2010; Wang,
et al., 2011; Ye, et al., 2014). Also, lignin is better removed with less polar solvents (ethanol, dioxane) while
hemicelluloses are more soluble in more polar solvents like water thereby providing further motivation to use alcohol-
water mixtures of a certain optimal composition for biomass fractionation (Iakovlev, 2011a).
2.7.4 pH of cooking liquor
The pH of SAW cooking liquor is dependent on the alcohol and SO2 concentration in the solution. SO2 is
responsible for lignin sulfonation. Analysis of S/C9 ratio of AS and ethanol-AS solid and liquid samples indicates that
lignin sulfonation is not directly dependent of ethanol presence (Iakovlev & van Heiningen, 2012b). Lignin sulfonation
follows the SN1 substitution mechanism. Figure 2.3 shows the mechanism of lignin sulfonation in acidic environment.
Lignin unit can be phenolic (R=H) as well as non-phenolic (R=lignin). The attack of the hydroxonium ion on the alpha
position of lignin is the rate limiting step in this mechanism (Sixta, et al., 2006). Sulfonation of lignin gives rise to
formation of lignosulfonic acids. In the subsequent step lignin get dissolved in the solvent because of fragmentation
and ionic nature of lignosulfonic acids. Iakovlev et al. (2012b) shows that the rate of sulfonation is controlled by the
amount of bound SO2 (HSO3- anion) rather than the acidity. Vishnevskaya (1981) and Primakov (1979) report that
lignosulfonic acids, formed by lignin sulfonation, are more soluble in ethanol than in water. The formation of
lignosulfonic acids during fractionation decreases the pH of the pulping liquor, while the presence of ethanol off sets
this effect thereby reducing carbohydrates hydrolysis.

21
Figure 2.3: Sulfonation of lignin in acid sulfite cooking
Some of the most important monosaccharide reactions in acidic pulping systems are dehydration and
oxidation. It is known that these reactions depend on temperature as well as acidity. Lower pH promotes dehydration
while higher pH is responsible for oxidation reactions (Slávik, 1961; Sixta, et al., 2006, p. 419). HMF and furfural are
products of dehydration reactions, with the former being further decomposed to levulinic acid and formic acid
(Rydholm, 1965, p. 520). Aldonic acids are formed due to oxidation of monosaccharides, and in AS cooking HSO3-
anions are responsible for this reaction. It is reported that oxidation of pentoses is a much faster reaction than hexoses
oxidation (Larsson & Samuelson, 1969). The insignificant concentration of dehydration and oxidation products in the
SEW process is related to the very low amount of bisulfite anions (due to absence of base) (Iakovlev, 2011a).
2.7.5 Liquor to feedstock ratio
Cooking liquor to feedstock ratio (L/F) is usually expressed in mL of cooking liquor/g of feedstock or L kg-
1. L/F is very important from an economical operation point of view. Using cooking liquor in higher quantities makes
a fractionation process costly, so there is always an effort to use as little fresh cooking liquor as possible without
compromising fractionation efficiency. Generally, in sulfite fractionation process a 1:3 liquid to wood ratio is used at
cooking temperatures of 120-140ºC and 5-20 hours of reaction time (Sarkanen & Ludwig, 1971). Iakovlev (2011a)
describes that neither the fractionation rate nor the relative composition of the resulting streams change when
decreasing L/F from 6 to 3 L kg-1. However, a further decrease results in somewhat slower delignification due to SO2
depletion and/or accumulation of lignosulfonic acids (Iakovlev, 2011a, p. 106).

22
2.7.6 Cooking temperature & duration
Cooking temperature and cooking time are inversely related. Increasing cooking temperature in acidic pulping
systems allows cooking of lignocellulosics materials in a shorter time. Also, improper increase in temperature leads
to condensation of lignin. Usually in AS systems firstly the lignocellulosics are impregnated at 110-120ºC for uniform
distribution of the cooking liquor in the biomass structure. If the temperature is raised before impregnation is complete,
undesirable lignin condensation reactions occur. After impregnation, the actual cooking is performed at 125-150ºC
(Sjöström, 1981, p. 108; Sixta, et al., 2006). Lignin condensation is truly related to pH of cooking liquor and cooking
temperature and it is promoted at high temperature and lower pH (Rozenberger, 1961). In SAW, the pH of the cooking
liquor is determined by the concentration of alcohol and SO2 present in the mixture. Schorning (1957) reports slower
delignification of beech due to condensation and warns not to operate at temperatures higher than 130ºC at SO2
concentration of 5.5%. However, some contrary reports (Eliashberg, et al., 1960; Primakov, 1961) indicate that
increasing cooking temperature up to 155ºC at 5-15% SO2 considerably increases SEW delignification.

23
Chapter 3
3. MATERIAL AND METHODS
3.1 Feedstock material
SCS was obtained from the Thomaston, GA, biorefinery of API, which again obtained this material from its
Brazilian partner Granbio. The material was size reduced using a Munson mill grinder with a 6.35 mm screen. Then
the shredded material was screened through 1400 (sieve no. 14) and 710 microns (sieve no. 25) standard sieves on a
mechanical Humboldt shaker. Straw fractions retained on each sieve and in the pan, were analyzed for yield and ash
(Figure 3.1). The fraction collected in the pan was not included in the fractionation feedstock because of its high ash
content. Each fraction was analyzed for Ca, Fe, K, Mg and SiO2 on ICP-AES using EPA 200.7 method “Trace elements
in water, solids and biosolids by inductively coupled plasma-atomic emission spectrometry”. Elemental ash analysis
revealed that the fraction retained in the pan was mostly composed of silica (Figure 3.2). SCS fractions retained on
//14 and //25 were mixed (see Figure 3.2), stored in a plastic bag and later used for the fractionation experiments. The
moisture content of the SCS was 6-8%. SCS in all later experiments and discussions refers to the mixture of fractions
retained on //14 and //25 (Figure 3.2).
Figure 3.1: Ash in different fractions of SCS
0
10
20
30
40
50
60
Sieve 14 Sieve 25 Pan
SC
S r
eta
ined
(g
/10
0 g
SC
S)
Retained
Ash

24
Figure 3.2: Elemental ash analysis of SCS fractions
3.2 Chemical composition of SCS
SCS was ground using a Wiley mill and analyzed for chemical composition. The acetone extractives in SCS
were determined according to SCAN-CM 49:03 “Content of acetone-soluble matter”. Lignin and carbohydrate content
of Wiley mill ground SCS (extractive free) were determined according to NPEL/TP 510-42618 “Determination of
structural carbohydrates and lignin in biomass” after double stage hydrolysis (72% H2SO4, 1 h, 30°C, then 4% H2SO4,
1 h, 121°C). Klason lignin was corrected for ash by burning it at 525°C for 24±6 hours in a muffle furnace. Acid
soluble lignin (ASL) was determined by measuring the ultraviolet (UV) absorbance of liquor (at 205nm and extinction
coefficient of 110 L/g.cm) from the hydrolyzed SCS. Scott’s method was employed for uronic anhydride
determination and hence for the quantification of 4-O-methylglucuronic acid (4-OMGA) (Scott, 1979). A high
performance anion exchange chromatography with pulse amperometric detection (HPAEC-PAD) was used for
separation of the monosugars (Davis, 1998). The instrument was equipped with Dionex CarboPac PA1 (4 x 250 mm)
column (30°C), CarboPac PA1 (4 x 50 mm) guard column, IonPac NG1 (4 x 35 mm) guard column, GP50 Pump,
ED40 Detector (gold electrode), and an AS50 Autosampler. The eluent flowrate was 1.0 mL min-1 (degassed H2O at
0.7 mL min-1 + 300 mM NaOH from the post column at 0.3 mL min-1). Acetic acid in the SCS hydrolysate was
1
10
100
Pan Mixed Sieve 14 Sieve 25
pp
m x
10
3(a
s re
ceiv
ed b
asi
s)
Ca Fe K Mg Si

25
determined by high performance liquid chromatography (HPLC) using a refractive index detector and BIO-RAD
Aminex HPX-87K column (Bio-RAD laboratories; Hercules, CA, USA). The mobile phase used was H2SO4 (5 mM,
0.6 mL min-1) and the oven temperature was 45ºC. SCS was also analyzed for nitrogen content by dry combustion.
The protein content was determined by multiplying the nitrogen content by a factor of 5.6 (Mariotti, et al., 2008). The
composition of the two mixed fractions of SCS used in pulping experiments is shown in Table 3.1.
Table 3.1: Chemical composition of sugarcane straw (SCS)
Component Current study (You, et al., 2016) (Szczerbowski, et al., 2014)
Arabinan 3.0±0.2 2.8 2.57±0.64
Galactan 0.9±0.1 0.8 0.97±0.28
Glucan 35.7±0.4 35.7 32.76±0.51
Xylan 21.2±0.6 20.1 20.47±0.74
Mannan 0.6±0.2 0.4 1.01±0.03b
ASL 3.8±0.4 2.7 0.71±0.03
KL 19.8±0.2c 17.5c 20.57±0.19
Ash 6.1±0.2 8.5 (4.9a) 6.23±0.20
Extractives 3.5±0.4d 2.1d 3.50±0.06e
Acetyl groups 2.9±0.1 - 3.26±0.07
4-OMGA 1.1±0.0 - -
Protein 2.3f - 3.72±0.11
Total 100.9±1.1 90.6 95.77±1.18
(a)-Acid insoluble ash, (b)-Unidentified anhydroushexose (glucans), (c)-Corrected for ash, (d)-Acetone soluble
extractives, (e)-Extracted with a sequence of different organic solvents, (f)-Based on nitrogen analysis and using Jones
factor of 5.6 (Mariotti, et al., 2008)
The SCS compositional analysis shows that it is rich in carbohydrates containing 61.4% anhydrous sugars.
Xylan is the most abundant hemicellulose sugar, while galactan and mannan are present at less than 1%. It contains
3.8% ASL and nearly same amount of acetone soluble extractives. Like other agriculture residues it has a significant
amount of ash that adds 6.1% to its dry weight. Ash free Klason lignin is 19.8% and this value likely also includes a
significant amount of protein which is present in SCS at 2.24%. The composition of SCS depends on the collection
site, climate conditions, stage of plant development and variety (Gómez, et al., 2010; Santos, et al., 2012). The SCS
in our study is from the same source as the SCS batch III that You et al. (2016) employed in their research. It had
59.9% carbohydrates, 20.2% lignin but less extractives (2.1%) and more ash (8.5%). However, You et al. (2016) did
not analyze it for protein and no information were provided regarding screening process. A comprehensive description
of the composition of sugarcane residues including SCS was reported by Costa (Costa, et al., 2015). However, this
reference did not contain information on protein content either. In a more recent reference it is reported that SCS

26
contains 3.72% proteins (Szczerbowski, et al., 2014), with the rest of the composition very similar to SCS used in
current study (Table 3.1).
3.3 Fractionation of SCS
Three water miscible alcohols, namely methanol, ethanol and isopropanol, were used for fractionation of SCS.
SAW cooking liquors were prepared by injecting SO2 in alcohol-water mixtures (50 w/w %) as shown in Figure 3.3.
Reagent grade methanol (purity >99%), ethanol (95 v/v. %) and isopropanol (purity >99.9%) were purchased from
Fisher Scientific (Suwanee GA, USA). Compressed SO2 was purchased from Matheson Tri-Gas (Bangor ME, USA)
for cooking liquor preparation. The amount of SO2 dissolved in aqueous alcohol mixtures was determined by
monitoring the increase in weight of solution. Undissolved escaping SO2 was captured in a vessel containing hydrogen
peroxide. The concentration of SO2 in each cooking liquor was 12% (by weight). Thus, the final composition of each
fresh cooking liquor used in fractionation experiments was SO2/Alcohol/Water = 12/44/44 (w/w %).
Stainless steel cooking digesters (220 mL) were filled with 24.4 g air dried (or 22.6 g o.d.) SCS and cooking
liquor was added at a feedstock ratio of 4 L kg-1 which also accounts for the SCS moisture content. The digesters were
immersed in a hot multi digester oil bath (MDOB) (manufactured in-house) containing polyethylene glycol as a
heating media at a temperature setting of 135, 145 or 155°C (±1°C). The digesters rotated 180 degrees at 2 revolutions
per minute during cooking. After completion of pulping (20-120 minutes), which included an effective heat-up time
of about 10 minutes (Iakovlev, 2011a), the digesters were put into an ice bath to quench and stop further reaction. The
digester content was quantitatively transferred into a nylon bag (mesh size 75) and the solid pulp was obtained after
manually squeezing out the spent liquor.
Figure 3.3: Preparation of cooking liquor

27
3.4 Processing of fractionated SCS
The pulp obtained from fractionated SCS was washed twice with 50% (w/w) aqueous alcohol solution (L/F =
2 L kg-1) at 60°C and then washed twice with DI water (L/F = 20 L kg-1) at room temperature (Figure 3.4). Finally,
the pulp slurry was disintegrated, filtered through Whatman quantitative grade ashless filter paper and transformed
into a pulp pad. Pulp pads were dried overnight at room temperature and then stored into plastic bags for further
analysis. Methanol, ethanol and isopropanol based fractionation systems were designated as SMW, SEW and SPW
respectively. The same corresponding abbreviations were used for resulting pulps, spent liquors and washings.
Figure 3.4: Alcohol and water washing of fractionated SCS
Pulp Disintegration
20 ºC, 5min
DI water
L/F = 20
Washing
Twice
Washing
Water
60 ºC, 5 min
50% w/w alcohol
L/F = 2
Washing
Twice
Alcohol
Washing
Liquor
SAW
Pulping
Hydrolyzate
Cooking
Liquor

28
Chapter 4
4. SCS FRACTIONATION: EFFECT OF DIFFERENT ALCOHOLS
4.1 Introduction
The main goal of biomass fractionation is to efficiently separate it into the main constituents i.e. cellulose,
hemicellulose and lignin. The success of fractionation was measured in terms of degree of delignification,
hemicellulose removal and cellulose hydrolysis. Delignification and xylan removal kinetics were developed by
quantification of residual lignin and residual xylan in treated SCS respectively using the same methods as described
earlier for SCS composition analysis (see section 3.2). Pulps kappa number was determined by SCAN-C 1:00 method
“Chemical pulp: Kappa number”. Cellulose hydrolysis was investigated by measuring the viscosity of bleached pulps
dissolved in cupriethylenediamine (CED) solution (SCAN-CM 15:99 method “Pulps: Viscosity in
cupriethylenediamine solution”). All pulps were bleached with sodium chlorite following Tappi Suggested Method
T230 su-66 “Viscosity of pulp (capillary viscometer method)” before viscosity determination.
4.2 Kappa-lignin correlations
SCS was subjected to fractionation at three different temperatures 135, 145 and 155°C with cooking duration
ranging from 20 to 120 minutes. All cooking times include about 10 minutes for heat-up of the biomass to reach
pulping temperature. Pulps produced under these conditions did not have any apparent rejects except for some of the
SMW pulps with kappa >70. Acid insoluble or Klason lignin content of pulps after standard two step hydrolysis were
determined, and corrected for acid insoluble ash because SCS contains a significant amount of acid insoluble
inorganics, mostly silica (see section 3.1). Linear correlations between kappa number and ash free acid insoluble lignin
content of SMW, SEW, and SPW pulps were obtained with intercepts of 4.64, 4.69 and 4.26 respectively at zero kappa
number as shown in Figure 4.1. The results show that the lignin-kappa correlations are only a function of cooking
solvent, but not of cooking temperature. The highest Klason lignin content at a fixed kappa number is seen for
methanol, followed by ethanol and finally isopropanol.

29
Figure 4.1: Kappa vs ash free acid insoluble lignin relations (unmodified) for SMW, SEW and SPW pulps. Color
coding shows three different temperatures. Green (135°C), Blue (145°C) and Red (155°C)
Many correlations between kappa number and Klason/total lignin content of pulps have been reported in
literature. However, no such correlation was ever reported for SCS. In a recent study on SEW fractionation of SCS
(You, et al., 2016), the kappa number and lignin content for various pulps were reported, but no correlation was
presented due to large variability of the data. Iakovlev et al. (2011c) reported that the proportionality constant in the
linear kappa vs lignin correlations depends on species and fractionation process. Most of the correlations were
developed for wood species, starting with Tasman and Berzins (Tasman & Berzins, 1957) in the late 50’s for beech,
birch, spruce and pine. In later studies (Li & Gellerstedt, 1998; Kyrklund & Strandell, 1969) slightly different
proportionality constants were found depending on wood specie and pulping process, but interestingly the intercept
was always found to be zero. However, for annual fiber biomass such as barley straw, a high intercept value (3.5-6.5
w/w %) was found for the correlation between Klason lignin and kappa covering a narrow range of total lignin content
(Oreopoulou, 1988). The high value of the intercept in the latter study was attributed to the presence of shives, knots
and permanganate non-oxidizable components in the unscreened pulp. For SEW pulping of spruce, beach and wheat
straw Iakovlev et al. (2011c) also reported intercepts of the Klason lignin-kappa correlations of nearly zero for wood
species, while for wheat straw it was 1.27% (w/w).
y = 0.1503x + 4.64 (SMW)
y = 0.1341x + 4.69 (SEW)
y = 0.1173x + 4.26 (SPW)
4
6
8
10
12
14
16
18
0 10 20 30 40 50 60 70 80
Pu
lp a
cid
in
solu
ble
resi
du
e (g
/10
0 g
o.d
pu
lp)
Kappa
SMW
SEW
SPW

30
Thus, it is apparent that pretreated/pulped annual fibers are characterized by Klason lignin-kappa correlations
with a high intercept even after correcting Klason lignin for acid insoluble ash present in it. This may indicate the
presence of a significant amount of permanganate non-oxidizable matter in acid insoluble ash corrected Klason lignin.
Recent studies show that there are 3.72% proteins (Szczerbowski, et al., 2014) and significant amounts of lipids present
in SCS (del Río, et al., 2015). Such components may possibly contribute to high intercept values in Klason lignin-
kappa correlations in SAW pulping of SCS. To investigate whether protein could be responsible for the permanganate
non-oxidizable matter, different kappa number pulps were analyzed for protein content (A factor of 5.6 used to convert
nitrogen content to protein content (Mariotti, et al., 2008). The data in Table 4.1 shows that these pulps contain a
significant percentage (8.7-29.3%) of the protein present in the original SCS (2.24% on original SCS). Pulps with
higher kappa number retain comparatively more protein. This suggests that a significant amount of protein ends up in
the Klason lignin, and may contribute (in part) to the permanganate non-oxidizable matter in SAW pulps. Lipids (not
determined in this study) are another possible contributing factor to high intercepts in lignin-kappa correlations.
Table 4.1: Protein in fractionated SCS
SMW SEW SPW
Pulp Kappa 45.8 44.7 27.8 22.6 22.6 20.4
Nitrogen (% Pulp) 0.26 0.22 0.21 0.11 0.12 0.09
Protein* (% Pulp) 1.46 1.24 1.15 0.62 0.66 0.51
Pulp Yield (%SCS) 45.1 41.1 42.3 38.3 41.4 37.9
Protein (% SCS) 0.66 0.51 0.49 0.24 0.27 0.19
Protein retained in Pulp, % 29.3 22.8 21.7 10.6 12.2 8.7
*A factor of 5.6 was used to calculate protein content based on (Mariotti, et al., 2008)
Consequently, we corrected the acid insoluble lignin content of pulps not only for ash but also for
permanganate non-oxidizable matter such as lipids and proteins. This was done by subtracting the intercept values at
zero kappa in Figure 4.1 from ash free Klason lignin for each corresponding pulp. The Klason lignin content corrected
for ash and permanganate non-oxidizable matter for all pulps is plotted against Kappa number in Figure 4.2. It shows
that the lignin content vs kappa relationship is not affected much by the type of solvent or pulping temperature. As
expected, the intercepts of the modified correlations are now close to zero, like the Klason lignin-kappa correlations
for wood species (Kyrklund & Strandell, 1969; Li & Gellerstedt, 1998; Iakovlev & van Heiningen, 2011c). Hence this
suggests that the ash and permanganate non-oxidizable matter (including protein) corrected Klason lignin represent
the real amount of lignin in pulps. Considering the scatter in the data, and that the correlations in Figure 4.2 for the
SMW, SEW and SPW pulps do not differ much, it was considered appropriate to represent all the lignin-kappa data

31
by a single straight-line correlation which passes through the origin with a slope of 0.134. This overall correlation of
the data is also seen in Figure 4.2.
Figure 4.2: Kappa vs lignin relations (modified) for SMW, SEW and SPW pulps. Color coding shows different
temperatures. Green (135°C), Blue (145°C) and Red (155°C). Blue dotted line represents the average of the SMW,
SEW and SPW correlations
4.3 Delignification kinetics
The delignification kinetics were determined for the three SAW pulping series with temperature (135-155°C)
and time as variables. The lignin content of the pulps based on original SCS was calculated from the kappa number
using the following equation
[𝐿𝑖𝑔𝑛𝑖𝑛] = 0.134×kappa ×𝑃𝑢𝑙𝑝 𝑌𝑖𝑒𝑙𝑑 (1)
Shown in Figures 4.3-4.5 are the thus calculated [lignin] expressed in % on original SCS plotted against cooking time
for pulping with methanol (SMW), ethanol (SEW) and isopropanol (SPW) respectively. In accordance with first order
delignification kinetics, a logarithmic scale is used for [lignin] on the vertical axis, while pulping time on the horizontal
axis is a linear scale. This plot is selected based on pseudo first order delignification kinetics found for SEW cooking
(Iakovlev, et al., 2009) because the proton concentration is approximately constant during delignification as:
y = 0.1503x - 0.0007 (SMW)
y = 0.1341x + 0.0043 (SEW)
y = 0.1173x - 0.098 (SPW)
0
2
4
6
8
10
12
14
0 10 20 30 40 50 60 70 80Pu
lp a
cid
in
solu
ble
lig
nin
(g
/10
0 g
o.d
pu
lp)
Kappa
SMW
SEW
SPW
y = 0.134x
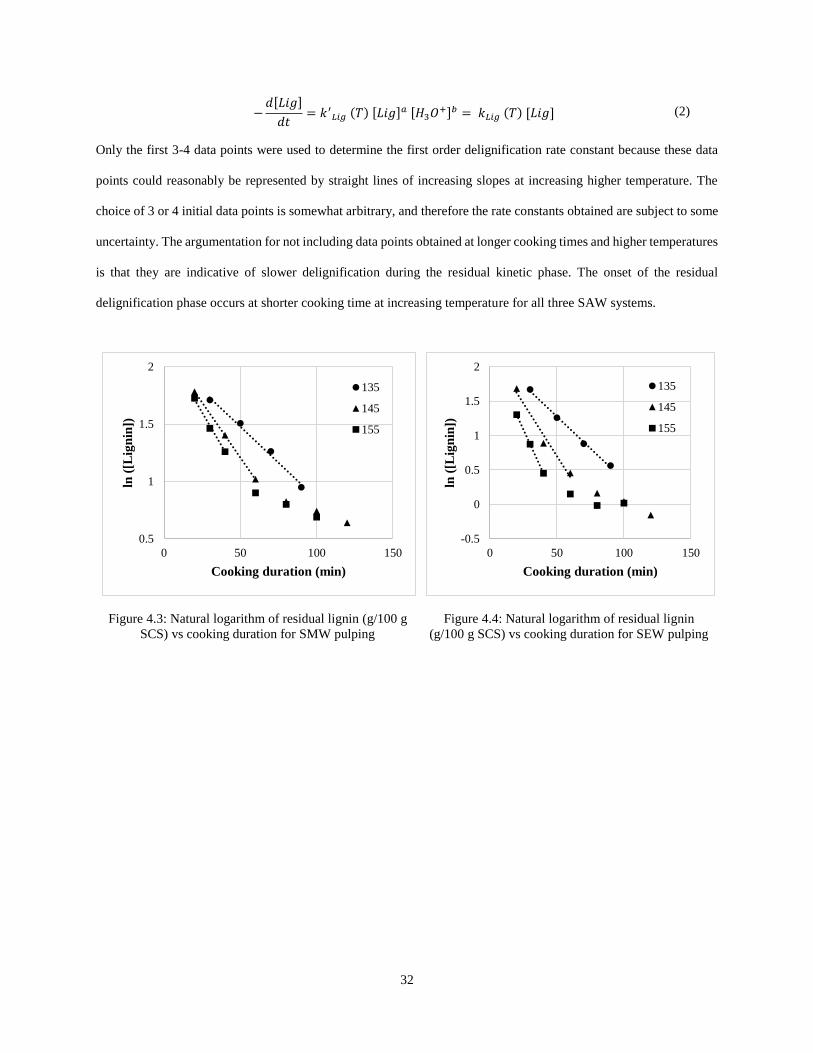
32
−𝑑[𝐿𝑖𝑔]
𝑑𝑡= 𝑘′
𝐿𝑖𝑔 (𝑇) [𝐿𝑖𝑔]𝑎 [𝐻3𝑂+]𝑏 = 𝑘𝐿𝑖𝑔 (𝑇) [𝐿𝑖𝑔] (2)
Only the first 3-4 data points were used to determine the first order delignification rate constant because these data
points could reasonably be represented by straight lines of increasing slopes at increasing higher temperature. The
choice of 3 or 4 initial data points is somewhat arbitrary, and therefore the rate constants obtained are subject to some
uncertainty. The argumentation for not including data points obtained at longer cooking times and higher temperatures
is that they are indicative of slower delignification during the residual kinetic phase. The onset of the residual
delignification phase occurs at shorter cooking time at increasing temperature for all three SAW systems.
Figure 4.3: Natural logarithm of residual lignin (g/100 g
SCS) vs cooking duration for SMW pulping
Figure 4.4: Natural logarithm of residual lignin
(g/100 g SCS) vs cooking duration for SEW pulping
0.5
1
1.5
2
0 50 100 150
ln (
[Lig
nin
])
Cooking duration (min)
135
145
155
-0.5
0
0.5
1
1.5
2
0 50 100 150
ln (
[Lig
nin
])
Cooking duration (min)
135
145
155

33
Figure 4.5: Natural logarithm of residual lignin (g/100 g
SCS) vs cooking duration for SPW pulping
Since the (ash and protein corrected) [lignin] in SCS is 17.6% while the extrapolated [lignin] at 10 minutes
cooking time (i.e. after heat-up) is 7-9% on original SCS, almost 50-60% of the SCS lignin is dissolved during the
heat-up time for SMW, SEW and SPW. You et al. (2016) also reported the same behavior during the initial phase of
SCS delignification using SEW but at a different pulping liquor composition (12:22.5:65.5 w/w %) versus the present
SAW composition of 12:44:44 w/w%. Iakovlev et al. (2011b) identified two phases of delignification (bulk and
residual phase) without an initial phase when pulping spruce, beech and wheat straw using SEW. In Kraft and SEW
delignification of wood species, most lignin is removed in the bulk phase (Iakovlev, 2011a, p. 22). However, for SCS
delignification most lignin is removed during the initial phase. This can be related to the high percentage of total lignin
in the middle lamella of annual plants than for wood fibers (Zhai & Lee, 1989). As it is easier to remove lignin from
middle lamella (being amorphous and more porous) than S2 layer so lignin is mostly removed in the initial phase for
annual plants. On the other hand, for wood species most of the lignin is in S2 layer so very little amount is removed
in the initial phase but most of the lignin is removed in the bulk phase. Also, the structure of annual fibers is more
porous than that of wood species and these characteristics may explain the faster delignification rate during the initial
stage of cooking of annual fibers (Huang, et al., 2007).
The delignification indicated in Figures 4.3-4.5 by dotted lines is called bulk delignification. It follows
pseudo first order kinetics as seen by the straight-line relationship between ln[lignin] and pulping time. At 135°C the
-0.5
0
0.5
1
1.5
2
0 50 100 150
ln (
[Lig
nin
])
Cooking duration (min)
135
145
155

34
bulk phase extends to 90 minutes, while at higher temperatures (145 and 155°C) it lasts shorter before transition to
the residual phase of delignification which is characterized by a slower delignification rate. The residual phase for
SEW and SPW starts when the lignin content based on original SCS reaches 1.5%, while for SMW it starts at about
3% lignin. At 145 and 155°C the residual phase begins after 60 and 40 minutes of cooking (includes 10 min heat-up
time) both for SEW and SPW. The onset of the residual delignification phase for SMW occurs after 60 and 50 minutes
at 145 and 155°C, respectively. Iakovlev et al. (2011b) showed that for beech and spruce the SEW residual
delignification phase appears when the lignin content decreases below 1% (on original wood), while the threshold for
wheat straw is around 2.3% (kappa 30), the latter value without correcting for lipid/protein content. The onset of the
residual phase at higher lignin content in SCS is not clear, but several differences between lignin structure in annual
plants and wood could be responsible for the effect.
The amount of lignin at the onset of residual delignification phase is higher for SMW than SEW and SPW
(see Figure 4.3, 4.5 and 4.6). The higher amount of lignin at the onset of residual delignification for SMW may be
explained by the lower solubility of lignin in 50% methanol compared to that in 50% ethanol and isopropanol based
on their solubility parameters (δ values). Puumala (Puumala, 1991) also reported that ethanol provides better
delignification than methanol. We also observed that SMW pulps were darker in color than corresponding SEW and
SPW pulps indicating their high lignin content and possibly more condensation because of less solubility in methanol.
Bulk delignification rate constants were determined from the slopes of the straight lines in Figure 4.3, 4.4
and 4.5 are shown in Table 4.2. The delignification rate constants for SPW are highest followed by SEW and SMW
at each temperature. The rate constants for each solvent system increases with increase in temperature. A 20°C increase
in temperature (135°C to 155°C) results in 1.8, 2.3 and 2.4 times increase in delignification rate for SMW, SEW and
SPW respectively. The maximum rate constant value achieved was 46.7±2.8 x 10⁻³ min-1 at 155°C for SPW
delignification.
Table 4.2: Bulk delignification rate constants and activation energies
Rate Constant kLig x 103 (min-1) Activation Energy (kJ mol-1)
135°C 145°C 155°C
SMW 12.6±0.1 19.0±0.0 23.3±0.2 44.7±1.4
SEW 18.5±0.2 30.7±0.9 42.5±0.0 60.5±0.7
SPW 19.0±0.4 33.6±0.3 46.5±2.8 65.1±1.3

35
At similar pulping conditions Iakovlev et al. (2011a, p. 60) reported bulk delignification rate constants for
three biomass species (at 135°C 30.9 x 10⁻³ min-1 for spruce, 39.9 x 10⁻³ min-1 for beech and 31.1 x 10⁻³ min-1 for
wheat straw; and at 145°C and 155 °C the values are 64 x10-3 min-1 and 135 x10-3 min-1 for spruce respectively. At
135°C the present SEW rate constants for SCS are a factor 1.7 lower than those of spruce and wheat straw while at
155 °C the difference increases to a factor of 3.2. The low delignification rate constants in SAW pulping of SCS might
be related to the high ash content in SCS (Table 3.1) which lowers the acidity of the pulping system.
The bulk delignification rate constants of the pulping solvents follow the sequence SPW > SEW > SMW.
This sequence agrees with the lignin dissolution properties of cooking liquor of SPW > SEW > SMW. The lignin
dissolution capacity of the cooking liquors may be estimated from the Hildebrand solubility parameter (δ) given by
following equation (Schuerch, 1952):
𝛿 = √[(∆𝐻 − 𝑅𝑇)𝜌
𝑀𝑊] (3)
where ΔH is heat of vaporization in J mol-1, T is normal boiling point in Kelvin, MW is molecular weight in kg mol-1
and ρ is density in kg m-3. Based on the above equation the δ-values of fresh SMW, SEW and SPW cooking solvents
were calculated as 37.03, 36.46 and 34.60 (MPa)1/2 respectively. The presence of SO2 in the cooking liquor had an
insignificant effect on the δ-value. The δ-value of lignin can be determined based on knowledge of the atomic and
functional group contributions in the phenylpropane unit. δ-values of 27.73, 29.12 and 36.49 (MPa)1/2 were obtained
for typical structures of G, S and H phenylpropane units respectively (Figure 4.6). Thus, the weighted average
solubility parameter of SCS lignin based on G:S:H of 68:28:4 (del Río, et al., 2015) was 28.47 (MPa)1/2. According
to the Hildebrand solubility parameter theory the closer the δ-values of the polymer and solvent are, the greater will
be the polymer solubility in that solvent (Hildebrand & Scott, 1950). By comparing δ-values of the cooking liquors
with δ-value of SCS lignin (28.47), it can be concluded that the SPW liquor is the best SCS lignin solvent, while SMW
cooking liquor is the poorest solvent. It also shows that the H lignin units have a poorer solubility in the cooking
liquors than the G and S units.

36
CH3O
O
OH
O
CH3 CH3
O
O O
OHOH
O
OH
O
O
O
G S H
Figure 4.6: Typical structures of lignin units
Rate constants at 135°C, 145°C and 155°C from Table 4.2 were used to determine activation energies using
the Arrhenius plot shown in Figure 4.7. The activation energy values for SAW delignification (see Table 4.2) are
much lower than those for SEW pulping of wood species like spruce (108 kJ mol-1) and beech (102 kJ mol-1) (Iakovlev,
et al., 2011b). Many other researchers have also found low activation energies of delignification for different straws
at different pulping conditions compared to those for wood species (Huang, et al., 2007; Huang & Shi, 1986; El-
Sakhawy, et al., 1996; Huang, et al., 2006; Ho, et al., 2011). The lower activation energies may be explained by the
high porosity of SCS where lignin is more easily accessible as compared to hardwood and softwood species.
Figure 4.7: Arrhenius plot (delignification kinetics) for SMW, SEW and SPW
0
0.5
1
1.5
2
2.5
3
3.5
4
4.5
2.32 2.34 2.36 2.38 2.4 2.42 2.44 2.46
ln (
k x
10
3)
T-1 x10³, K-1
SMW
SEW
SPW

37
4.4 Xylan removal kinetics
Xylan is the most abundant hemicellulose in SCS constituting nearly 22% of its total weight (Table 3.1).
Galactan and mannan are present in very small amount, 0.9 and 0.6% respectively. SCS also contains 3% arabinan,
but these units are quickly removed during the initial cooking phase because of high reactivity of furanosidic bonds
in an acidic environment (Shafizadeh, 1963). Iakovlev (2011a, p. 72) shows that 70 and 100% dissolution of arabinan
takes place during heat-up period at 135 and 165°C respectively in SEW pulping. Therefore, we addressed in our
study only the kinetics of xylan removal.
Two phases of xylan removal were observed in SMW, SEW and SPW pulping of SCS, initial xylan dissolution
followed by first order xylan removal, as can be seen in Figures 4.8, 4.9 and 4.10 respectively. By comparison of the
xylan content obtained by extrapolation to the heat-up time at 10 minute with the xylan content in fresh SCS, it can
be seen that about 50% of xylan is removed in the first phase called “initial phase”. You et al. (2016) reported that 2/3
of SCS xylan was removed in the initial phase. The higher percentage xylan removal by You et al. (2016) can be
explained by the more acidic environment used due to a lower ethanol concentration with SO2/ethanol/water of
12/22.5/65.5 (w/w%). As 50-60% of the SCS lignin was also removed during the initial phase, it may be suggested
that most of the xylan and lignin were removed covalently bound to each other as lignin-carbohydrate complex (LCC).
The xylan content of the solid residue was calculated by considering the uronic anhydride (UA) content just as is done
for hardwoods (Genco, et al., 1990) as:
𝑋𝑦𝑙𝑎𝑛 = 𝑋𝑦𝑙𝑜𝑠𝑒 (132
150) + 𝑈𝐴 (0.6) (
132
176) (4)
Because xylan dissolution occurs after acid hydrolysis following SN1 substitution, the kinetics of xylan can be
described by following equation (Iakovlev, 2011a):
−𝑑[𝑋𝑦𝑙]
𝑑𝑡= 𝑘′
𝑋𝑦𝑙 (𝑇) [𝑋𝑦𝑙]𝑎 [𝐻3𝑂+]𝑏 = 𝑘𝑋𝑦𝑙 (𝑇) [𝑋𝑦𝑙] (5)
where [Xyl] is xylan content of pulp (% SCS); 𝑘′𝑋𝑦𝑙 and 𝑘𝑋𝑦𝑙 real and composite rate constants for xylan removal;
[H3O+] hydronium ion concentration; T is reaction temperature; a and b are reaction orders in xylan and hydronium
ion concentration.

38
When the hydronium concentration is constant, and the reaction is first order in xylan, the above formula implies a
linear relationship between the natural logarithm of [Xyl] (%SCS) and cooking duration. This is seen for SMW, SEW
and SPW pulps in Figure 4.8, 4.9 and 4.10 respectively.
Figure 4.8: Natural logarithm of residual xylan vs
cooking time for SMW pulping of SCS
Figure 4.9: Natural logarithm of residual xylan vs
cooking time for SEW pulping of SCS
Figure 4.10: Natural logarithm of residual xylan vs
cooking time for SPW pulping of SCS
The rate of xylan removal in the 2nd phase called bulk phase is indicated by straight dotted lines in Figures
4.8-4.10. Pseudo first order rate constants determined from their slopes are listed in Table 4.3. All the rate constants
are nearly identical, indicating the same xylan removal rate for the three solvent systems at 145°C. This implies that
the hydronium ion concentration in each pulping system is nearly the same, as was confirmed experimentally with
-0.5
0
0.5
1
1.5
2
2.5
3
3.5
0 50 100 150
ln[X
yla
n]
(g/1
00
g S
CS
)
Cooking duration (min)
SCS
135
145
155
-0.5
0
0.5
1
1.5
2
2.5
3
3.5
0 50 100 150
ln[X
yla
n]
(g/1
00
g S
CS
)
Cooking duration (min)
SCS
135
145
155
0
0.5
1
1.5
2
2.5
3
3.5
0 50 100 150
ln[X
yla
n]
(g/1
00
g S
CS
)
Cooking duration (min)
SCS
135
145
155

39
spent liquors pH values ranging from 0.9 to 1.2. The maximum difference in pH values at similar pulping conditions
was only 0.05 units. The present rate constant value at 135°C for SEW of 10.9 x 10⁻³ min-1 agrees with that of 11.6 x
10-3 min-1 determined by Iakovlev et al. (2011b) for SEW pulping of beech at the same temperature and fresh cooking
liquor composition. This confirms the similar nature of xylan in SCS and hardwood species. Rate constant values for
xylan removal were reported by You et al. (2016) for SEW pulping of SCS at a lower ethanol content (12:22.5:65.5
for S:E:W). The authors reported 8.74 x 10⁻³ min-1, 20.5 x 10⁻³ min-1 and 39.8 x 10⁻³ min-1 xylan removal rate constants
at 135°C, 145°C and 155°C respectively. The higher rate constants at the two higher temperatures may be related to
the higher effective acidity of the cooking liquor in the You et al. (2016) study. It indicates that type of alcohol used
in SAW fractionation and its concentration change the proton activity and hence the hydrolysis rate. This will be
addressed further below.
Table 4.3: Xylan removal (bulk phase) rate constants with activation energy data
Rate Constant kXyl x 103 (min-1) Activation Energy (kJ mol-1)
135°C 145°C 155°C
SMW 9.6±0.2 14.6±0.1 25.4±0.3 70.6±0.7
SEW 10.9±0.2 15.6±0.2 28.5±0.3 69.6±1.7
SPW 6.5±0.8 16.0±0.2 26.5±0.3 102.3±2.2
The rate constants increase with temperature, and were used to determine the activation energy through an Arrhenius
plot seen in Figure 4.11. The activation energies based on Arrhenius plot are listed in Table 4.3 with rate constants. It
can be seen from Table 4.3 that activation energy values of SMW and SEW are nearly same (70 kJ mol-1). However,
the SPW pulping system has a significantly higher activation energy of xylan removal (102 kJ mol-1). Alcoholysis
reactions are anticipated based on this activation energy data. Iakovlev et al. (2011a, p. 79) reported an activation
energy of 110 kJ mol-1 for xylan removal from spruce in SEW pulping. No activation energy data of xylan removal
from beech and wheat straw was reported in that study. The high activation energy for spruce species may be related
to the fact that softwood xylan contains twice the amount of 4-O-methylglucuronic acid (4-OMGA) units per xylose
unit than that in hardwood xylan (Sjöström, 1981, pp. 61-63) and contains arabinose side chains (Fengel & Wegener,
1984). It is known that the presence of 4-OMGA partially stabilizes against xylan hydrolysis (Meier, 1962) at lower
temperatures. You et al. (2016) reported a high activation energy of 106.6 kJ mol-1 for SEW pulping of SCS (plotted
in Figure 4.11). The low activation energy for SEW (69.6 kJ mol-1) in our case is related to the high ethanol
concentration (22.5% vs 44%) which affects the effective acidity of the pulping system and thus reaction rate. The

40
rate increase is higher using comparatively less polar solvent (isopropanol). Therefore, higher xylan removal rate is
anticipated with isopropanol if same concentration is employed as You et al. (2016). Similar effects are seen for
cellulose hydrolysis in the next section.
Figure 4.11: Arrhenius plot (xylan removal kinetics) for SMW, SEW and SPW
The ratio of the reaction rate constants for delignification and xylan removal are listed in Table 4.4. It shows that the
delignification/xylose removal selectivity is highest for the SPW pulping system, and that the highest selectivity and
thus pulp yield at the same lignin content or kappa number can be obtained at low temperatures. This agrees with the
finding of Iakovlev et al. (2011a, pp. 76-80).
Table 4.4: Delignification selectivity over xylan removal
kLig/kXyl
135°C 145°C 155°C
SMW 1.3 1.3 0.9
SEW 1.7 2.0 1.5
SPW 2.9 2.1 1.8
-5.5
-5
-4.5
-4
-3.5
-3
-2.5
-2
0.00225 0.0023 0.00235 0.0024 0.00245 0.0025
ln (
k)
T-1, K-1
SEW (You et al. 2016) SEW SMW SPW

41
4.5 Cellulose hydrolysis kinetics
Cellulose DP was calculated by measuring the intrinsic viscosity of pulp in cupriethylenediamine (CED)
solution. The viscosity average DP of cellulose is nearly equal to the weight average DP (Evans & Wallis, 1989). In
the current study, we used the pulp viscosity ([η]), hemicellulose content ([Hemi]) and cellulose content ([Cel]) in the
following equation to determine the cellulose DP (da Silva Perez & van Heininen, 2015).
𝐷𝑃𝑣 = (1.65[𝜂] − 116[𝐻𝑒𝑚𝑖]𝑝𝑢𝑙𝑝
[𝐶𝑒𝑙]𝑝𝑢𝑙𝑝
)
1.111
(6)
Kappa vs viscosity relationships for SMW, SEW and SPW pulps are shown in Figure 4.12, 4.13 and 4.14
at 135, 145 and 155 °C respectively. It can be observed that the intrinsic viscosity remained high (>800 mL g-1) at
135°C down to a kappa number of 30 for SEW and SPW (see Figure 4.12). At 145°C in Figure 4.13, however, the
viscosity drops rapidly for SMW pulping below kappa 45, while the same occurs for SEW and SPW below kappa 25.
At 155 °C these sharp drops occur at even higher kappa numbers of 50 and 30 respectively (see Figure 4.14). Hence
at lower kappa numbers SMW pulp shows the lowest viscosity while for SEW and SPW the values are nearly equal.
As xylan removal rate is about the same in three solvent systems (at 145°C), it indicates that cellulose hydrolysis is
more sensitive to hemicellulose removal than delignification. Thus, SEW and/or SPW fractionation of SCS at 145°C
for 60 minutes can produce a paper grade quality pulp with 800-850 cP viscosity and kappa number of about 25 while
SMW pulps have a much higher lignin content in this viscosity range.

42
Figure 4.12: Methanol (SMW), ethanol (SEW) and
isopropanol (SPW) pulps viscosity at 135°C
Figure 4.13: Methanol (SMW), ethanol (SEW) and
isopropanol (SPW) pulps viscosity at 145°C
Figure 4.14: Methanol (SMW), ethanol (SEW) and
isopropanol (SPW) pulps viscosity at 155°C
The inverse of DP was plotted against cooking time to evaluate the rate of cellulose hydrolysis in the three
different fractionation systems (see Figure 4.15, 4.16 and 4.17). The linear relationship between DP-1 and time shows
that cellulose hydrolysis is zero order in cellulose and obeys the following equation under the assumption of constant
hydronium ion concentration.
200
400
600
800
1000
10 30 50 70
Intr
insi
c v
isco
sity
(m
L g
-1)
Pulp kappa number
SMW
SEW
SPW
200
400
600
800
1000
10 30 50 70
Intr
insi
c v
isco
sity
(m
L g
-1)
Pulp kappa number
SMW
SEW
SPW
200
400
600
800
1000
10 30 50 70
Intr
insi
c v
isco
sity
(m
L g
-1)
Pulp kappa number
SMW
SEW
SPW

43
1
𝐷𝑃−
1
𝐷𝑃0
= 𝑘′𝐶𝑒𝑙 (𝑇) [𝐻3 𝑂
+]𝑡 = 𝑘𝐶𝑒𝑙 (𝑇) 𝑡 (7)
Rate constants for cellulose hydrolysis were calculated from the slopes of the straight lines and are shown in Table
4.5. The rate constants for SEW pulping are 1.14 x 10⁻⁶ min-1, 2.99 x 10⁻⁶ min-1 and 3.84 x 10⁻⁶ min-1 at 135°C, 145°C
and 155°C respectively (see Table 4.5). The corresponding rate constants reported in You et al. (2016) for SCS at a
lower ethanol concentration than in the present study (22.5% vs 44% ) are 1.59 x 10⁻⁶ min-1, 5.86 x 10⁻⁶ min-1 and 17.0
x 10-6 min-1 respectively, i.e cellulose hydrolysis rate constants which are 1.4, 2.0 and 4.4 times higher respectively.
Again this shows that the effective acidity is higher at lower ethanol concentrations, and that effect becomes more
pronounced at higher temperatures. Iakovlev et al. (2011a, p. 86) who employed SEW liquor of essentially the same
composition as the present study (12:43.5:44.5 vs 12:44:44) for pulping of spruce and beech, found rate constants of
1.51 x 10⁻⁶ min-1 (135°C), 4.76 x 10⁻⁶ min-1 (145°C) and 15.4 x 10⁻⁶ min-1 (155°C) for spruce and 1.04 x 10⁻⁶ min-1
(125°C), 2.75 x 10⁻⁶ min-1 (135°C) and 7.80 x 10⁻⁶ min-1 (145°C) for beech.. The mostly lower rate constants in the
present SCS study compared to those obtained for wood species may be related to the presence of a significant amount
of ash in SCS (Table 3.1) which decreases the effective acidity of the pulping system.

44
Figure 4.15: Cellulose hydrolysis kinetics in SMW
pulping system
Figure 4.16: Cellulose hydrolysis kinetics in SEW
pulping system
Figure 4.17: Cellulose hydrolysis kinetics in SPW
pulping system
The Arrhenius equation was applied to determine the sensitivity of the rate constants to reaction temperature
(Figure 4.18). Activation energy of cellulose hydrolysis for SMW, SEW and SPW were found to be 77±4, 88±8 and
130±10 kJ mol-1 respectively (Table 4.5). These activation energies are similar to many other agricultural materials
used for pulping however much lower than for wood species (160-180 kJ mol-1) reported in the literature.
1
2
3
4
5
6
0 20 40 60 80 100 120 140
DP
-1x 1
04
Cooking duration (min)
135
145
155
1
2
3
4
5
6
0 20 40 60 80 100 120 140
DP
-1 x
10
4
Cooking duration (min)
135
145
155
1
2
3
4
5
6
0 20 40 60 80 100 120 140
DP
-1x 1
04
Cooking duration (min)
135
145
155

45
Table 4.5: Rate constant and activation energy values for cellulose hydrolysis
Rate Constant kCel x 106 (min-1) Activation Energy (kJ/mol)
135°C 145°C 155°C
SMW 1.26±0.03 2.68±0.13 3.64±0.04 77±4
SEW 1.14±0.01 2.99±0.15 3.84±0.08 88±8
SPW 0.76±0.03 2.96±0.24 4.46±0.09 130±10
Generally, the low activation energies of SCS cellulose hydrolysis may be related to differences in the physical
structure of biomass; i.e. degree of polymerization and crystallinity. Crystallinity values have been reported which
vary from 73% for cotton linter to 23% for corn maize (Aberuagba, 1997; Ghose, 1977). Millett et al. (1954) shows
that wood cellulose hydrolyzes twice as quickly as cotton cellulose. Low activation energies of cellulose hydrolysis
for agricultural biomass have been reported in literature which range from 34 kJ mol-1 for rice husk (Ajani, et al.,
2011) to 80.34 kJ mol-1 for corn cobs (Eken-Saracoglu, et al., 1998). For SEW pulping of spruce (Iakovlev, et al.,
2009) and beech (Iakovlev, et al., 2011b) activation energy values of 166 kJ mol-1 and 135 kJ mol-1 were reported
respectively. You et al. (2016) also found an activation energy of 166 kJ mol-1 for SCS cellulose hydrolysis. Since the
ethanol concentration in our cooking liquor (SEW) is 44% (w/w), which is almost twice that of You et al. (2016)
(22.5%), it appears that doubling the ethanol concentration reduces the activation energy for cellulose hydrolysis by
about half ( Figure 4.18).
Figure 4.18: Arrhenius plot (cellulose hydrolysis kinetics) for SMW, SEW and SPW
-15
-14
-13
-12
-11
-10
-9
0.00225 0.0023 0.00235 0.0024 0.00245 0.0025
ln (
k)
T-1, K-1
SEW (You et al.2016) SEW SMW SPW

46
SPW pulping has a higher activation energy for cellulose hydrolysis compared to SMW and SEW (Figure 4.18 and
Table 4.5). This may be explained in terms of the effect of solvent on the proton activity which is responsible for the
cellulose hydrolysis. Earlier it was reported (Philipp, et al., 1979; Lai, 2000) that the addition of ethanol, n-propanol
or methylethylketone (MEK) to water increases the cellulose degradation by decreasing the proton hydration or
cellulose swelling. Similarly, it may be expected that the proton hydration becomes weaker employing less polar
solvents. As isopropanol is less polar in comparison to methanol and ethanol, it results in high rate increase in cellulose
hydrolysis with increasing temperature (Figure 4.18). The hydrolysis rate increase is about same for methanol and
ethanol. Comparing these results with You et al. (You, et al., 2016) indicates that ethanol effects are more pronounced
at high temperatures. Therefore, two factor are responsible for cellulose hydrolysis: 1. Higher alcohol/water ratio
decreases the hydrolysis rate due to decrease in effective acidity (You, et al., 2016); 2. Less polar solvent (i.e.
isopropanol) increases the rate faster because of less swelling properties/increasing proton activity. This suggests that
effective acidity increase with temperature is higher for less polar solvents.
The delignification selectivity expressed as the ratio of the delignification and cellulose degradation rate
constants, kLig/kCel, is listed in Table 4.6. It shows that pulping with isopropanol in the SAW process at low temperature
provides the highest selectivity among the three employed solvents.
Table 4.6: Delignification selectivity over cellulose hydrolysis
(kLig/kCel) x 103
135°C 145°C 155°C
SMW 10.0 7.1 6.4
SEW 16.2 10.3 11.1
SPW 25.0 11.4 10.4
4.6 Conclusions
SCS was fractionated into cellulose, hemicellulose and lignin by the SAW process using methanol, ethanol or
isopropanol. Delignification kinetics for SCS were developed for the first time by correcting Klason lignin for ash
(mostly silica) and permanganate non-oxidizable material (proteins identified as one of the contributing factors). In
terms of delignification, SPW is the most effective pulping system because of its highest lignin dissolution capacity,
while SMW has the lowest delignification rate. The low activation energy values for SCS relative to wood species
indicate the ease of delignification for highly porous agricultural residues such as SCS. The residual delignification

47
phase for SEW and SPW starts when the lignin content reaches about 1.5% (on original SCS), while for SMW it starts
at about 3%. This compares to less than 1% for beech and spruce using SEW fractionation. Thus, the residual lignin
content of SAW produced SCS pulp is relatively high compared to that of SEW wood pulp. The rate increase of xylan
removal and cellulose hydrolysis is highest for SPW fractionation system. The xylan removal and cellulose hydrolysis
rate is nearly the same for all three solvent systems at 145°C, but the activation energy is highest for the SPW pulping
system. It indicates that proton activity increase with temperature is comparatively higher for less polar solvent (i.e.
SPW) in SCS fractionation. Also, alcoholysis reactions in SAW fractionation are anticipated based on different
activation energy values. Cellulose hydrolysis is more affected by hemicellulose removal than lignin removal. It is
possible to produce a paper grade quality SCS pulp of 800-850 cP viscosity and kappa number of about 25 using SEW
or SPW pulping at 145 °C for 60 minutes, while SMW pulps have a much higher lignin content in this viscosity range.

48
Chapter 5
5. CARBOHYDRATES IN SPENT LIQUORS AND SUGARS MASS BALANCE
5.1 Introduction
Spent liquors from SAW fractionation of SCS were obtained by manually squeezing the fractionated biomass
in a nylon bag (75 mesh size). No more than 70% (based on volume of initially charged cooing liquor) spent liquor
could be squeezed out. Spent liquors from SAW fractionation of SCS using methanol, ethanol or isopropanol were
designated as SMW, SEW and SPW respectively. The effect of fractionation time and temperature on spent liquor
composition will described in this chapter for the three fractionation systems.
The spent liquors were analyzed for total sugars, monosaccharides and sugar degradation products. The
monomeric sugars in the fresh spent liquors were determined using HPAEC-PAD with fucose as internal standard. To
prepare samples for HPAEC injection, fresh spent liquor (1 mL) was treated with NaOH (0.1 M, 10 mL) and then
diluted with Milli-Q water (dilution factor = 400). To determine the total carbohydrates, spent liquors were first
subjected to rotary evaporation at 40°C. Rotary evaporation was done by adding acetone (1 mL) to fresh liquor (1 mL)
and then evaporating the mixture to dryness. The samples were then treated with 72% H2SO4 (1.5 mL) at 30°C for
one hour under continuous stirring. The hydrolyzed samples were then diluted by adding DI water (43 mL) and
subjected to a 2nd hydrolysis step at 121°C for 1 hour. After the two step hydrolysis procedure the samples were
centrifuged, filtered through a 0.45µm filter and finally analyzed by HPAEC-PAD using fucose as an internal standard,
and reported as anhydrous sugars as originally present in SCS.
Fresh and hydrolyzed spent liquors were also analyzed for sugars degradation components (HMF and furfural)
for mass balance calculations. The fresh/hydrolyzed spent liquors were diluted with deionized water (dilution factor
= 42) and then analyzed on HPLC using a refractive index detector and BIO-RAD Aminex HPX-87K column. The
mobile phase used was H2SO4 (5 mM, 0.6 mL min-1) and the oven temperature was 45ºC.

49
5.2 pH of spent liquors
The acidity of biomass fractionation systems was indirectly estimated from the pH of spent liquors. An Oakton
pH meter RS-232 with recorder output was used to determine pH at room temperature. Table 5.1 shows the pH of
spent liquors from SMW, SEW and SPW fractionation of SCS at different temperatures and cooking durations. The
pH of spent liquors is measured at room temperature and it does not provide information about the true acidity at
fractionation temperatures (135, 145 and 155°C). However, this pH data is important for relative analysis of three
solvent systems. The pH decreases with increasing time from an initial value of about 1.2 to about 0.9 at the highest
temperature and time. However, the pH values of all spent liquors are very close at the same fractionation conditions
(differences of generally less than 0.1 unit). These small differences suggest the same level of acidity and hence
carbohydrates hydrolysis in the SEW, SMW and SPW fractionation systems. However, high rate increase was seen
for SPW fractionation system (Chapter 4) indicating increased proton activity with temperature.
Table 5.1: pH of SMW, SEW and SPW spent liquors at different fractionation conditions
Temperature Time (min) SMW SEW SPW
135°C
30 1.20 1.20 1.22
50 1.21 1.17 1.16
70 1.14 1.13 1.08
90 1.03 1.13 1.06
145°C
20 1.04 1.23 1.16
40 1.03 1.13 1.01
60 1.01 1.10 0.98
80 1.00 1.07 0.94
100 1.00 1.04 0.93
120 0.98 1.00 0.89
155°C
20 1.06 1.10 1.20
30 1.05 1.04 1.10
40 1.06 0.99 1.04
60 1.00 0.97 0.96
80 0.97 0.92 -
100 0.93 0.90 -
Note: pH is measured at room temperature
Hydrolysis of biomass carbohydrates (cellulose and hemicellulose) breaks down long chain molecules into
short length oligomers and finally monomers. Hemicelluloses with a low degree of polymerization (DP) are more
easily to hydrolyze and dissolve in water as compared to highly crystalline and high DP cellulose. The extent of
hydrolysis is highly dependent on the acidity or more specifically effective acidity of the system which apparently
increases with temperature for SMW, SEW and SPW fractionation systems as indicated by the pH values.

50
As will be shown in Chapter 6, the monomeric sugars in the spent liquors also react with the alcohols at the pulping
conditions to form in particular alkyl/alcohol xylosides. Therefore, the spent liquors were also analyzed for alkyl
furanosides and pyranosides (for details on the identification and quantification of these compounds, see chapter 6).
5.3 Carbohydrates in spent liquors
5.3.1 Combined severity factor (CSF)
Spent liquors were obtained from SCS fractionation at different temperatures (135-155°C) and varying
cooking duration (20-120 minutes). To reduce the number of independent parameters and compare the three
fractionation systems on the same basis a composite parameter called “Combined Severity Factor” (CSF) was
introduced. The CSF is an empirical correlation that describes the severity of a reaction systems as a combined effect
of temperature T (°C), cooking duration t (min) and pH. This so-called CSF parameter for SMW, SEW and SPW
fractionation systems was calculated using the severity factor defined by (Overend & Chornet, 1987; Garrote, et al.,
1999) which was modified to include the effect of pH (taken from Table 5.1);
CSF = log {t (min) * eT (°C) -100
14.7 } - pH (8)
5.3.2 Monomeric and total sugars
Monomeric and total sugars in SEW spent liquors at different fractionation conditions are shown in Figure
5.1. The concentrations are strong function of fractionation temperature and duration. The monomeric and total
dissolved sugars yields increase with temperature and cooking duration but decrease at severe conditions (145°C, t>80
min and 155°C, t>60 min). This decrease is related to further sugars conversion to HMF, furfural and humins. The
same data for SEW spent liquors is replotted in Figure 5.2 using equation 8 in terms of CSF. It can be seen from Figure
5.2 that CSF approach works very well to describe monomeric and total dissolved sugars yield. Therefore, all three
fractionation systems (SMW, SEW and SPW) can be compared on CSF basis. Following the same approach as for
SEW spent liquor, the monomeric and dissolved sugars results for SMW and SPW are plotted in Figure 5.3 and 5.4
respectively. All the sugars were measured as monosaccharides but described here as anhydrous sugars on original
SCS basis. Monomeric and total sugars in SEW, SMW and SPW spent liquors as a function of CSF are reported as
anydrosugars in Figure 5.2, 5.3 and 5.4 respectively. The amount of monomeric and total sugars in each of the spent
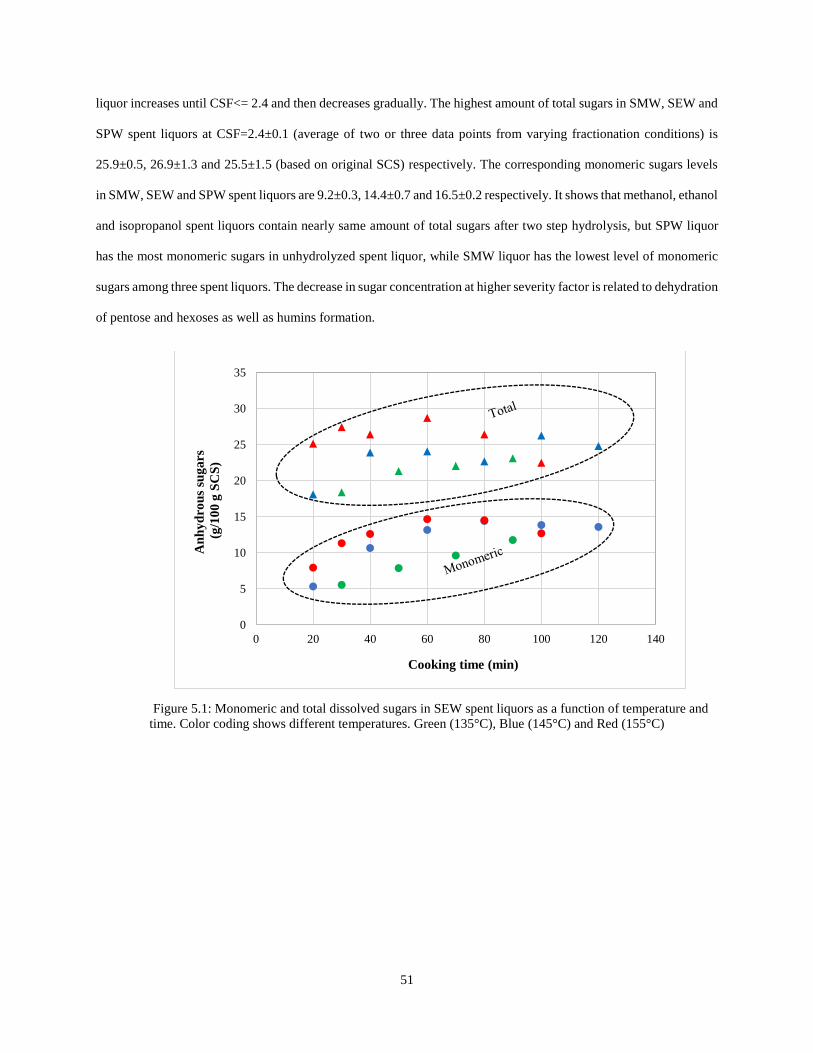
51
liquor increases until CSF<= 2.4 and then decreases gradually. The highest amount of total sugars in SMW, SEW and
SPW spent liquors at CSF=2.4±0.1 (average of two or three data points from varying fractionation conditions) is
25.9±0.5, 26.9±1.3 and 25.5±1.5 (based on original SCS) respectively. The corresponding monomeric sugars levels
in SMW, SEW and SPW spent liquors are 9.2±0.3, 14.4±0.7 and 16.5±0.2 respectively. It shows that methanol, ethanol
and isopropanol spent liquors contain nearly same amount of total sugars after two step hydrolysis, but SPW liquor
has the most monomeric sugars in unhydrolyzed spent liquor, while SMW liquor has the lowest level of monomeric
sugars among three spent liquors. The decrease in sugar concentration at higher severity factor is related to dehydration
of pentose and hexoses as well as humins formation.
Figure 5.1: Monomeric and total dissolved sugars in SEW spent liquors as a function of temperature and
time. Color coding shows different temperatures. Green (135°C), Blue (145°C) and Red (155°C)
0
5
10
15
20
25
30
35
0 20 40 60 80 100 120 140
An
hy
dro
us
sug
ars
(g/1
00
g S
CS
)
Cooking time (min)

52
Figure 5.2: Monomeric and total sugars in SEW spent
liquors
Figure 5.3: Monomeric and total sugars in SMW spent
liquors
Figure 5.4: Monomeric and total sugars in SPW spent liquors
Concentrations of each individual sugar in spent liquor are determined at 2.4±0.1 CSF and shown in Table
5.2. The concentration of total sugars in each spent liquor is nearly the same at 26% on SCS or 60 g L-1. Xylan is the
most prominent sugar in these spent liquors at a level of approximately 16.5% on SCS or 38 g L-1. The total
concentration of glucan in each spent liquor is about 5.4% on SCS or 12 g L-1, which is high considering that cellulose
0
5
10
15
20
25
30
1.0 1.5 2.0 2.5 3.0
An
hy
dro
us
sug
ars
(g
/10
0 g
SC
S)
CSF
0
5
10
15
20
25
30
1.0 1.5 2.0 2.5 3.0
An
hy
dro
us
sug
ars
(g
/10
0 g
SC
S)
CSF
0
5
10
15
20
25
30
1.0 1.5 2.0 2.5 3.0
An
hy
dro
us
sug
ars
(g
/10
0 g
SC
S)
CSF
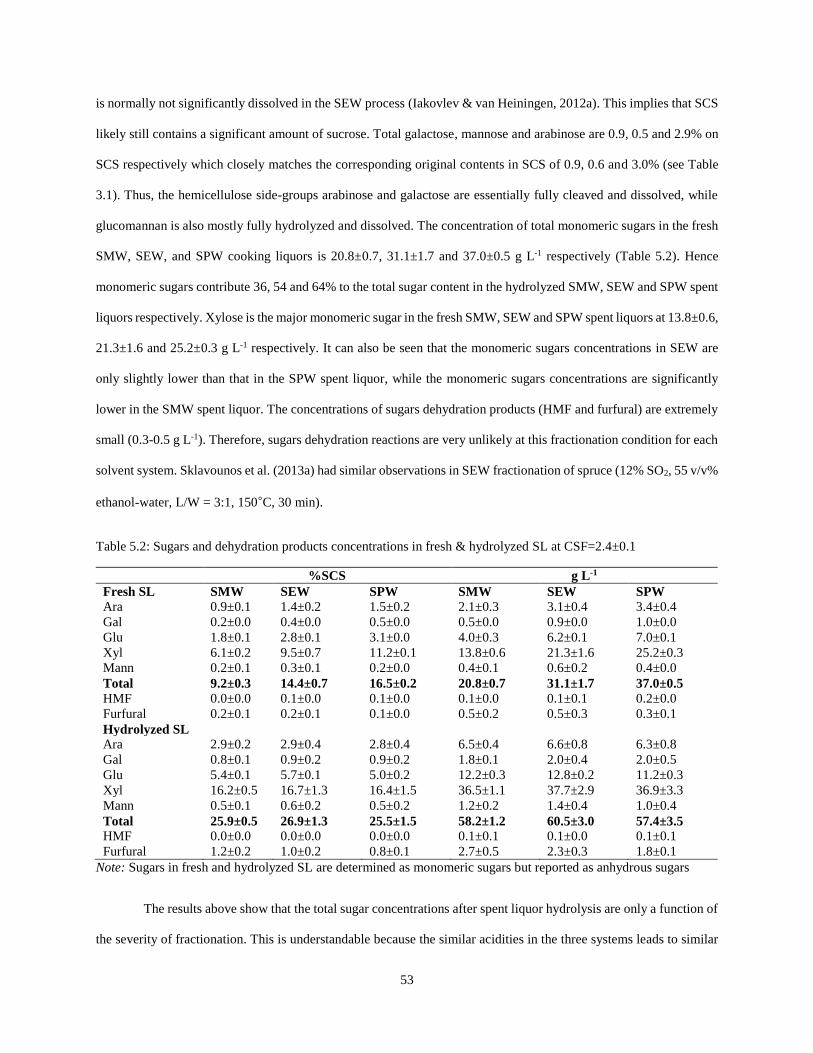
53
is normally not significantly dissolved in the SEW process (Iakovlev & van Heiningen, 2012a). This implies that SCS
likely still contains a significant amount of sucrose. Total galactose, mannose and arabinose are 0.9, 0.5 and 2.9% on
SCS respectively which closely matches the corresponding original contents in SCS of 0.9, 0.6 and 3.0% (see Table
3.1). Thus, the hemicellulose side-groups arabinose and galactose are essentially fully cleaved and dissolved, while
glucomannan is also mostly fully hydrolyzed and dissolved. The concentration of total monomeric sugars in the fresh
SMW, SEW, and SPW cooking liquors is 20.8±0.7, 31.1±1.7 and 37.0±0.5 g L-1 respectively (Table 5.2). Hence
monomeric sugars contribute 36, 54 and 64% to the total sugar content in the hydrolyzed SMW, SEW and SPW spent
liquors respectively. Xylose is the major monomeric sugar in the fresh SMW, SEW and SPW spent liquors at 13.8±0.6,
21.3±1.6 and 25.2±0.3 g L-1 respectively. It can also be seen that the monomeric sugars concentrations in SEW are
only slightly lower than that in the SPW spent liquor, while the monomeric sugars concentrations are significantly
lower in the SMW spent liquor. The concentrations of sugars dehydration products (HMF and furfural) are extremely
small (0.3-0.5 g L-1). Therefore, sugars dehydration reactions are very unlikely at this fractionation condition for each
solvent system. Sklavounos et al. (2013a) had similar observations in SEW fractionation of spruce (12% SO2, 55 v/v%
ethanol-water, L/W = 3:1, 150°C, 30 min).
Table 5.2: Sugars and dehydration products concentrations in fresh & hydrolyzed SL at CSF=2.4±0.1
%SCS g L-1
Fresh SL SMW SEW SPW SMW SEW SPW
Ara 0.9±0.1 1.4±0.2 1.5±0.2 2.1±0.3 3.1±0.4 3.4±0.4
Gal 0.2±0.0 0.4±0.0 0.5±0.0 0.5±0.0 0.9±0.0 1.0±0.0
Glu 1.8±0.1 2.8±0.1 3.1±0.0 4.0±0.3 6.2±0.1 7.0±0.1
Xyl 6.1±0.2 9.5±0.7 11.2±0.1 13.8±0.6 21.3±1.6 25.2±0.3
Mann 0.2±0.1 0.3±0.1 0.2±0.0 0.4±0.1 0.6±0.2 0.4±0.0
Total 9.2±0.3 14.4±0.7 16.5±0.2 20.8±0.7 31.1±1.7 37.0±0.5
HMF 0.0±0.0 0.1±0.0 0.1±0.0 0.1±0.0 0.1±0.1 0.2±0.0
Furfural 0.2±0.1 0.2±0.1 0.1±0.0 0.5±0.2 0.5±0.3 0.3±0.1
Hydrolyzed SL
Ara 2.9±0.2 2.9±0.4 2.8±0.4 6.5±0.4 6.6±0.8 6.3±0.8
Gal 0.8±0.1 0.9±0.2 0.9±0.2 1.8±0.1 2.0±0.4 2.0±0.5
Glu 5.4±0.1 5.7±0.1 5.0±0.2 12.2±0.3 12.8±0.2 11.2±0.3
Xyl 16.2±0.5 16.7±1.3 16.4±1.5 36.5±1.1 37.7±2.9 36.9±3.3
Mann 0.5±0.1 0.6±0.2 0.5±0.2 1.2±0.2 1.4±0.4 1.0±0.4
Total 25.9±0.5 26.9±1.3 25.5±1.5 58.2±1.2 60.5±3.0 57.4±3.5
HMF 0.0±0.0 0.0±0.0 0.0±0.0 0.1±0.1 0.1±0.0 0.1±0.1
Furfural 1.2±0.2 1.0±0.2 0.8±0.1 2.7±0.5 2.3±0.3 1.8±0.1
Note: Sugars in fresh and hydrolyzed SL are determined as monomeric sugars but reported as anhydrous sugars
The results above show that the total sugar concentrations after spent liquor hydrolysis are only a function of
the severity of fractionation. This is understandable because the similar acidities in the three systems leads to similar

54
hemicellulose dissolution with increasing cooking severity as shown earlier in Chapter 4 (see section 4.4). However,
the concentration of monomeric sugars in each spent liquor is dependent on the type of alcohol used for SAW cooking
as well as the severity factor, with the monomeric sugars representing 36, 54 and 64% to the total sugar content in the
hydrolyzed SMW, SEW and SPW spent liquors respectively. Earlier studies have also shown that the monomeric
sugars concentration in spent liquor is only a fraction of the total sugars concentration. For example, Iakovlev and van
Heiningen (2012a) showed that the monomeric fraction increased with the SO2 concentration in cooking liquors of 3,
6 and 12% SO2 from 10-25% to 35-45% and 45-50% at SEW fractionation of spruce at 135°C and 6 L kg-1. In a
similar study, 42.1% monosugars are reported (3% SO2, 150°C, 120 min, 6 L Kg-1) (Sklavounos, et al., 2011). In
these studies, the difference between the unhydrolyzed monomeric and hydrolyzed total sugar concentration was
identified as oligomeric (i.e. not fully hydrolyzed) sugars. Using the same concept, the present results may be
interpreted that the oligomeric sugar fraction decreases in the order SMW>SEW>SPW. Since hydronium ions are
responsible for oligomer hydrolysis these results could be interpreted that the effective acidity of the systems increase
in the order SMW<SEW<SPW. The same concept is suggested based on literature (Lai, 2000; Mellmer, et al., 2014)
where less polar solvents enhance the effective acidity for strong acids (like lignosulfonic acids) because of less
shielding of the hydronium ion. Therefore it is more likely that the fraction of sugars is wrongly identified as oligomers
but are actually monomeric sugars which have reacted with the solvent to form xylosides and glycosides, and that
their yield decreases in the order of methanol>ethanol>isopropanol. This would explain the lower monomeric sugars
content in SMW compared to SEW and finally SPW spent cooking liquors. Formation of glycosides and xylosides in
acidic organosolv treatments have been earlier reported in literature (Grisel, et al., 2014; Zhang, et al., 2016). The
presence of alkyl pyranosides (especially xylosides) in spent liquors from SAW fractionation systems was confirmed,
and their quantification will be reported on in in Chapter 6.
Sugar mass balances are crucial for evaluation and practical implementation of fractionation processes. It
also helps to quantify and compare the different carbohydrate reactions in the solvent systems. Sugars mass balances
(as anhydrous sugars) for the SMW, SEW and SPW fractionation systems at CSF of 2.4±0.1 are shown in Table 5.3.
Spent liquor sugars are measured as monomeric sugars but reported as anhydrous sugars using the following equations;
Anhydro-pentose = Pentose x (132/150) (9)

55
Anhydro-hexose = Hexose x (162/180) (10)
Furfural and HMF are also described as anhydro-pentose and anhydro-hexose respectively in sugars mass balance.
Multiplication factors of 1.375 and 1.284 are used for furfural and HMF respectively to determine their equivalent
amount of anhydrous pentose and hexose sugars. The sum of anhydrous sugars in pulps and spent liquors of SMW,
SEW or SPW fractionation systems is equal to 61.0±0.7, 61.1±1.4 and 59.7±1.7 % on SCS respectively (Table 5.3).
These numbers are very close to the total anhydrous sugars in the original SCS showing excellent sugars mass balance
(considering standard deviations) for each of the fractionation system. The excellent mass balance of sugars shows
that the presence of alcohols suppresses the formation of humins in SAW fractionation system. This is in agreement
with sugars mass balance for SEW fractionation of softwood and hardwood species (Yamamoto, et al., 2014b;
Iakovlev & van Heiningen, 2012a), forest biomass (Yamamoto, et al., 2011) and oil palm empty fruit bunch
(Sklavounos, et al., 2013b) and spruce (Iakovlev & van Heiningen, 2012a; Sklavonous , et al., 2013a).
Table 5.3: Total sugars mass balance at CSF= 2.4±0.1
SMW SEW SPW
Pulp SCS
Ara 0.0±0.0 0.0±0.0 0.0±0.0 3.0±0.2
Gal 0.0±0.0 0.0±0.0 0.0±0.0 0.9±0.1
Glu 31.1±0.1 30.4±0.3 30.6±0.8 35.7±0.4
Xyl 2.2±0.3 2.2±0.4 2.4±0.1 21.2±0.6
Man 0.1±0.0 0.1±0.0 0.1±0.0 0.6±0.2
Total in pulp 33.4±0.3 32.7±0.5 33.1±0.8 -
Spent Liquor -
Ara 2.9±0.2 2.9±0.4 2.8±0.5 -
Gal 0.8±0.1 0.9±0.2 0.9±0.2 -
Glu 5.4±0.1 5.7±0.1 5.0±0.2 -
Xyl 16.2±0.5 16.7±1.3 16.4±1.6 -
Man 0.5±0.1 0.6±0.2 0.5±0.2 -
HMFa 0.0±0.0 0.1±0.0 0.0±0.0 -
Furfuralb 1.7±0.3 1.4±0.2 1.1±0.1 -
Total in SL 27.6±0.6 28.4±1.3 26.6±1.5 -
Sum 61.0±0.7 61.1±1.4 59.7±1.7 61.4±0.8
CSF =2.4±0.1 refers to SCS fractionation at 145°C, 100-120 min for SEW and SMW and 100 min for SPW, 4 L kg-1,
12% SO2 or 155°C, 60 min, 4 L kg-1, 12% SO2
(a)-Anhydo-hexose, (b)-Anhydro-pentose
The total amount of arabinose, xylose, galactose, mannose, furfural and HMF in spent liquors (as anhydrous
sugars, %SCS) represents the dissolution and dehydration of hemicelluloses in SAW fractionation of SCS. Table 5.3

56
shows that for SMW, SEW and SPW spent liquors this equals to 22.1±0.6, 22.5±1.4 and 21.7±1.7% respectively. The
sum of these sugars in the original SCS produces a value of 25.7±0.6. Thus, most of the hemicellulose (>85%) are
dissolved in SAW fractionation of SCS. All the three SAW pulps contain about 2.3% xylan and no arabinan indicating
that arabinan units are completely cleaved from arabinoxylan of SCS. This is confirmed by arabinan units in SAW
spent liquors that show 3.0% arabinan (with experimental error), an amount equals to that is in original SCS. Similarly,
galactan units are also completely cleaved from galactoglucumannan while some mannan is found in the solid residues.
SCS glucomannan contains 0.4% glucan (glucan = mannan/1.6) that is possibly removed with other hemicellulose
units as indicated by high glucan in spent liquors (5.0-5.7%). Iakovlev (2011a, p. 85) also describes that in SEW
fractionation of spruce (12% SO2, 135-155°C) all arabinan units are removed in 15-30 minutes of cooking. However,
mannan and small amount of galactan are found in the solid residue due to their high initial content in spruce (2.19%
galactan vs 1.8% mannan). Yamamoto et al. (2014b) shows 74% and 84% hemicellulose dissolution of HW and SW
biomass in SEW fractionation (150°C, L/F = 6 L kg-1, S:E:W = 12:43.5:44.5, 20-30 minutes). In another study
(Sklavounos, et al., 2013a), about 82 and 87% hemicellulose removal is also seen in SEW fractionation of spruce and
softwood biomass respectively with no arabinan in the pulp (150°C, L/F = 3 L kg-1, SO2 = 12%, ethanol/water =
55v/v%, 30 minutes). It can be concluded that in SAW fractionation arabinan is completely removed because of high
reactivity of furanosidic bonds towards acid hydrolysis as indicated by Shafizadeh (1963). It is shown that cellulose
in the SEW fractionation process is almost completely retained in the solid residue because of its high crystallinity
and resistance towards acid hydrolysis (Iakovlev & van Heiningen, 2012a; Sklavounos, et al., 2013a; Yamamoto, et
al., 2014b). However, in the present study a high decrease is seen in SCS glucan content (~5%) in the fractionation
process. This decrease in glucan content is attributed to dissolution of sucrose from SCS.
The total amount of anhydrous sugars based on original SCS in SMW, SEW and SPW spent liquors is
27.6±0.6, 28.4±1.3 and 26.6±1.5 respectively. This account for nearly 45% of the total amount of sugars in original
SCS. Iakovlev et al. (2012a) (spruce, 135°C, 120 min, 6 L kg-1, 12% SO2) and Sklavounos et al. (2011) (spruce, 150°
C, 120 min, 6 L kg-1, 3% SO2) describe that one third of spruce sugars are dissolved in SEW fractionation. High
concentration of total sugars in the present study can be related to biomass structure and high severity conditions (145
°C, 120 min, 4 L kg-1, 12% SO2 or 155°C, 60 min, 4 L kg-1, 12% SO2). The dissolution of sucrose, not present in wood
species, is also a major factor of high % sugars in SCS spent liquors. In terms of total sugars distribution, SMW, SEW

57
and SPW spent liquors are very identical indicating negligible effect of employed alcohols on carbohydrates
dissolution amount. Some pentose sugars are dehydrated to furfural in acid hydrolysis of spent liquors in sugars
analysis. No significant amount of HMF is found in the hydrolyzed spent liquor indicating high resistance of hexose
sugars towards acid hydrolysis.
5.4 Sugar degradation products
Furfural and HMF are two major sugar degradation products in acidic fractionation processes that affect the
downstream processing of spent liquor for bioethanol production and other saccharification processes. The lowest
inhibitory levels of furfural and HMF concentrations in SEW spent liquors specified for fermentation by C.
acetobutylicum are 1.0 and 1.5 g L-1 respectively (Jurgens, et al., 2012). Furfural and HMF levels in spent liquors are
shown in Table 5.2. In Table 5.2 fresh liquors refer to spent liquors from fractionation of SCS without any further
hydrolysis, while hydrolyzed spent liquors are obtained after hydrolyzing (two step hydrolysis with H2SO4) rotary
evaporated spent liquors (see section 5.1). The concentration of HMF in fresh SMW, SEW and SPW liquors are
0.1±0.0, 0.1±0.1 and 0.2±0.0 g L-1 respectively (Table 5.2). These results agree with previous results obtained for
SEW fractionation of spruce (Iakovlev & van Heiningen, 2012a; Sklavounos, et al., 2011) and OPEFB (Sklavounos,
et al., 2013b). The concentration of furfural in fresh SMW, SEW and SPW spent liquors is 0.5±0.2, 0.5±0.3 and
0.3±0.1 g L-1 (Table 5.2). It represents 0.2±0.1, 0.2±0.1 and 0.1±0.0% (based on SCS) furfural in SMW, SEW and
SPW spent liquors respectively. The furfural concentration levels in SEW spent liquors also very like Sklavounos et
al. (2011; 2013b) findings. The low furfural content (0.01%) reported by Iakovlev and van Heiningen (2012) is related
to low temperature treatment (135°C) in comparison to other studies. Sklavonounos et al. (2011) fractionated spruce
wood at 150°C using SEW cooking liquor (3% SO2, 120 min, 6 L kg-1). The comparatively high concentration of
furfural versus HMF in the spent liquors indicate that the hexoses are more stable towards acid dehydration in SAW
fractionation. The results in Table 5.3 show a significant increase in furfural concentration after sulfuric acid
hydrolysis (4% w/w H2SO4, 121°C, 1 h) while no significant increase in HMF was observed. Some HMF may be
converted into levulinic and formic acid during spent liquors hydrolysis but their concentration were below detection
limits. The increase in pentose sugar degradation in processed spent liquors can be related to the increased acidity in
rotary evaporation step due to increased concentration of lignosulfonates and the near absence of the solvent.
Comparing furfural levels in processed spent liquors indicates that pentose degradation is about same within

58
experimental errors. It should be kept in mind that spent liquors are hydrolyzed with H2SO4 only to establish mass
balances but no mineral acid treatment is required in processing of liquor for biofuels production such as ABE
fermentation process. Thus, the concentrations of furfural and HMF in SMW, SEW and SPW spent liquors are below
the inhibitory limits as indicated by Jurgens et al. (2012) and can be successfully employed in ABE fermentation by
C. acetobutylicum.
5.5 Conclusions
SMW, SEW and SPW fractionation systems successfully remove 85% hemicelluloses from SCS, dissolves any
sucrose present in SCS, and leaves most of the cellulose intact. Thus, spent liquors are potentially an excellent source
of dissolved sugars. The concentration of dissolved sugars increases with severity of fractionation, expressed as CSF.
The amount of total dissolved sugars and monosaccharides attains a maximum value at CSF of 2.4±0.1. More severe
fractionation conditions (CSF>2.4) decreases the spent liquor sugar content due to degradation reactions. SMW, SEW
and SPW spent liquors contain nearly equal amount of total sugars (27.5% on original SCS basis) at CSF of 2.4±0.1
in agreement with the very similar pH in in each fractionation system. However, the fresh spent liquors of the three
fractionation systems are quite different in monosaccharides composition. The concentration of monomeric sugars in
SMW, SEW and SPW spent liquors are 20.8±0.7, 31.1±1.7 and 37.0±0.5 g L-1 respectively. This represents 36%, 54%
and 64% of the total sugars in hydrolyzed SMW, SEW and SPW spent liquors respectively. The different levels of
monosaccharides with nearly similar amount of total sugars in these spent liquors points to the formation of alkyl
xylosides and glucosides by monosugar alcoholysis. This will be discussed in the next chapter. The excellent sugars
mass balance for SMW, SEW and SPW fractionation systems shows that sugars can be fully recovered in SAW
process. Spent liquors also contain HMF and furfural but their concentrations are below inhibitory limits for ABE
fermentation.

59
Chapter 6
6. ALKYL PYRANOSIDES FORMATION
6.1 Introduction
Fractionation of SCS with SMW, SEW or SPW provides cellulose rich pulp and a spent liquor that is rich in
sugars especially xylose. The produced spent liquor has great potential for bio-based products such as bioethanol and
xylitol. However, the viability of the process highly relies on effective recovery of the solvent. Also, biochemical
conversion technology requires a spent liquor stream that is rich in monomeric sugars with few sugar degradation
products. In organosolv fractionation systems, alcohol is consumed in esterification reactions (for example with acetic
acid) leading to solvent losses (Bublitz & Wilson, 1983). However, alcohol could also be consumed in other reactions
than esterification, and this need to be quantified.
The most common reactions consuming alcohol in organosolv systems are thought to be alcoholysis based
on some earlier and recent literature. These reports show that in reaction systems involving alcohol the
carbohydrates/sugars undergo alcoholysis in acidic media (Drouet, et al., 1994; Hu, et al., 2012; Grisel, et al., 2014;
Hu, et al., 2014; Lancefield, et al., 2017). In such systems pentose and hexose sugars react with alcohol forming alkyl
pyranosides and furanosides. Organosolv (with or without acid addition) and SAW fractionation are examples of such
systems where dissolved sugars may react with the employed alcohol. However, only recently it has been shown that
alkyl pyranosides and furanosides are formed in 95% methanol and 94% ethanol treated using 40 mM H2SO4 as
catalyst with the objective to generate furan derivatives (Grisel, et al., 2014), and in 95% n-butanol with 0.2 M HCl
as catalyst for production of unmodified lignin (Lancefield, et al., 2017). In SAW fractionation, the dissolution of
hemicellulose during fractionation results in significant concentrations of xylan oligomers/xylose and other
hemicellulose sugars in the spent liquors (Iakovlev & van Heiningen, 2012a) (also see Chapter 5). No severe
carbohydrate side reactions such as dehydration and oxidation are reported. However, at the prevailing acidic
conditions it is likely that xylan hydrolysis proceeds together with the formation of alkyl xylosides (methyl, ethyl or
isopropyl), furfural and humins as shown in the proposed scheme (Figure 6.1).

60
Figure 6.1: Hydrolysis of SCS xylan and formation of alcohol xylosides in acidic media (R=alcohol group i.e.
CH3O, C2H5O or C3H7O)
When formed, alkyl xylosides decrease the amount of free monomeric xylose and solvent (methanol, ethanol
or isopropanol) in the spent liquor, and these must be hydrolyzed for full xylose and ethanol recovery (Chapter 7). In
different SEW fractionation studies not more than about 50% (based on dissolved carbohydrates) free sugars are found
in the spent liquor stream (Iakovlev & van Heiningen, 2012a; Sklavounos, et al., 2013b). In a recent review of
organosolv pretreatment of plant biomass, alkyl xylosides formation has been attributed as the most likely cause for
poor xylan mass balances (Zhang, et al., 2016). The formation of alkyl xylosides is also confirmed in a recent study
of the solubilized hemicellulose fraction of biomass after treatment with 95% alcohol (ethanol or n-butanol) and HCl
as catalyst (Lancefield, et al., 2017). However, the amount of alkyl xylosides and the effect of the severity of process
conditions on alkyl xyloside formation are not quantified as is required for scale-up of a viable biochemical conversion
technology.
This chapter focuses on quantifying the yield of xylan hydrolysis products such as xylan-oligomers, monomeric
(free) xylose, furfural and humins, and particularly that of alkyl xylosides which are formed by reaction of alcohol
with xylose during SAW fractionation at different severity conditions. Methyl xylosides, ethyl xylosides and isopropyl
xylosides in SMW, SEW and SPW spent liquors are designated as MX, EX and PX respectively.
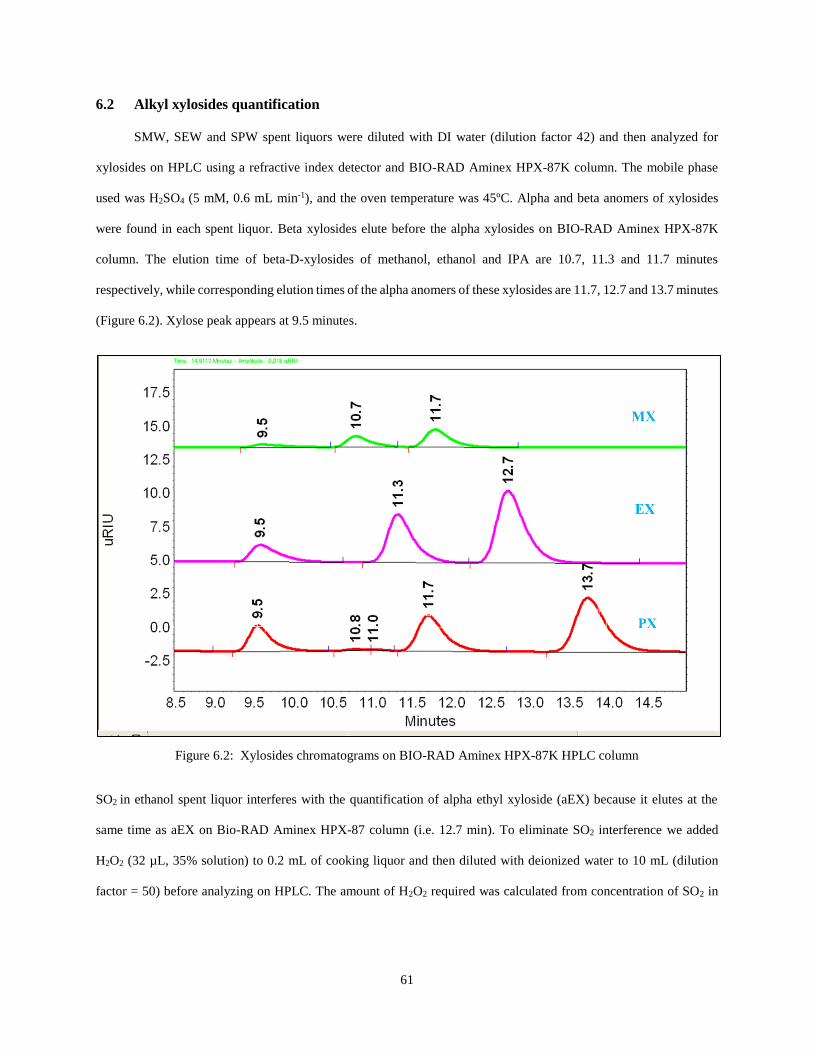
61
6.2 Alkyl xylosides quantification
SMW, SEW and SPW spent liquors were diluted with DI water (dilution factor 42) and then analyzed for
xylosides on HPLC using a refractive index detector and BIO-RAD Aminex HPX-87K column. The mobile phase
used was H2SO4 (5 mM, 0.6 mL min-1), and the oven temperature was 45ºC. Alpha and beta anomers of xylosides
were found in each spent liquor. Beta xylosides elute before the alpha xylosides on BIO-RAD Aminex HPX-87K
column. The elution time of beta-D-xylosides of methanol, ethanol and IPA are 10.7, 11.3 and 11.7 minutes
respectively, while corresponding elution times of the alpha anomers of these xylosides are 11.7, 12.7 and 13.7 minutes
(Figure 6.2). Xylose peak appears at 9.5 minutes.
Figure 6.2: Xylosides chromatograms on BIO-RAD Aminex HPX-87K HPLC column
SO2 in ethanol spent liquor interferes with the quantification of alpha ethyl xyloside (aEX) because it elutes at the
same time as aEX on Bio-RAD Aminex HPX-87 column (i.e. 12.7 min). To eliminate SO2 interference we added
H2O2 (32 µL, 35% solution) to 0.2 mL of cooking liquor and then diluted with deionized water to 10 mL (dilution
factor = 50) before analyzing on HPLC. The amount of H2O2 required was calculated from concentration of SO2 in

62
the cooking liquor (120-130 g L-1) and later confirmed by HPLC analysis with no SO2 peak (see Figure 6.3). SO2
reacts with H2O2 to form H2SO4 (Equation 11).
𝐻2𝑂2 + 𝑆𝑂2 → 𝐻2𝑆𝑂4 (11)
Therefore, all SEW spent liquors were treated with H2O2 for aEX quantification in similar manner as we did for fresh
liquor however, less dilution was used for spent liquor samples (dilution factor 40). We did not measure alkyl
pyranosides and furanosides of other sugars than xylose in the SAW spent liquors.
Figure 6.3: HPLC chromatograms showing the effect of adding H2O2 in fresh SEW cooking liquor. Red color shows
chromatograms for fresh SEW cooking liquor while black after H2O2 addition. SO2 elution time is 12.6 minutes
α-D-Methyl xyloside (aMX) purchased from Pfaltz & Bauer (Waterbury CT, USA) and ß-D-methylxyloside
(bMX) (>99%) from Sigma Aldrich (St. Louis MO, USA) were used for quantification of methyl xylosides (MX) in
SMW spent liquors. ß-D-ethyl xyloside (bEX) (>98%) purchased from Carbosynth (Berkshire, UK) was used for
quantification of this monomer in SEW spent liquors. Alpha ethyl xyloside (aEX) and isopropyl xylosides (PX) are
not commercially available. Therefore, we prepared these xylosides (EX and PX) by reacting about 100 mg xylose
(1.6 g L-1) and alcohol (725 g L-1) at 121°C for one hour at acidic conditions (4% H2SO4). The final reaction mixture

63
contained unreacted xylose, unreacted alcohol, alpha xyloside, beta xyloside, furfural and humins. The amount of
humins formed was estimated from two degradation experiments; one involving only xylose and H2SO4, and one
involving xylose, methanol and H2SO4 at the reaction conditions given above. In both cases the amount of humins
formed was determined based on a xylose mass balance before and after reaction involving xylose, furfural and methyl
xylosides (for which standards were available), all expressed as xylose equivalent amount. Based on the calculated
amount of humins, expressed as equivalent amount of xylose, the humins/furfural ratio was found to be 0.50 and 0.49
g/g in these two experiments respectively (see Table 6.1).
Table 6.1: Xylosides preparation from xylose-alcohol mixtures
Reaction Xylose
inlet
Furfural Unreacted
xylose
Humins Humins /
Furfural
Xylosides
Xylose + H2SO4 99.4 8.8 86.2 4.4a 0.50 NA
Xylose + H2SO4 + MeOH 99.8 5.7 8.1 2.8b 0.49 83.2
Xylose + H2SO4 + EtOH 99.6 6.3 10.1 3.1 0.50 80.1c
Xylose + H2SO4 + IPA 99.8 11.4 15.3 5.6 0.50 67.5d
All quantities are expressed as mg of xylose equivalent.
a, b, c and d are based on xylose mass balance
The HPLC calibration curves for aMX and bMX are seen in Figure 6.4. The calibration curves are almost
identical. Based on the reaction scheme in Figure 6.1 and the fact that the humins/furfural ratio is not affected by the
presence of methanol in the second experiment, this ratio was also assumed to be 0.50 in the two degradation
experiments with ethanol and isopropanol mixed with xylose and H2SO4 thereby allowing the amount of humins to
be estimated. Then the amount of ethyl and isopropyl xylosides formed in these respective mixtures could be
calculated based on a xylose mass balance involving xylose, furfural, humins and xylosides all expressed in equivalent
amount of xylose, and assuming that the HPLC response for the alpha and beta form of the ethyl and isopropyl
xylosides are identical. The mass balances for these two experiments are also shown in Table 6.1. The calibration
curves for the alpha and beta form of the ethyl and isopropyl xylosides based on the chromatograms and the xylose
mass balances are seen in Figure 6.5 and Figure 6.6 denoted as EX-Lab and PX-Lab respectively. Figure 6.5 also
includes the calibration curve obtained with the purchased ß-D-ethyl xyloside (bEX-Std), and this curve exactly
coincides with the bEX-Lab curve. This further confirms the mass balance approach for establishing the calibration
curves as well as that the HPLC response of the alpha and beta forms of the xylosides are the same. The experimentally

64
determined calibration lines for aPX and bPX are shown in Figure 6.6 and were used to determine the amount of these
xylosides in SPW spent liquors.
Figure 6.4: Methyl xylosides calibration curves from
standards
Figure 6.5: Ethyl xylosides calibration curves from
standard and laboratory prepared sample
Figure 6.6: Isopropyl xylosides calibrations from laboratory prepared sample
6.3 Effect of solvent on alkyl xylosides formation
Spent liquors from SMW, SEW and SPW fractionation of sugarcane straw contain methyl, ethyl and isopropyl
xylosides respectively. The yield of xylosides formation in each fractionation system depends on cooking temperature
and duration. Figure 6.7 and Figure 6.8 show the concentration of aEX and bEX respectively in the SEW spent liquors
aMX
y = 0.00000660x
R² = 0.99
bMX
y = 0.00000647x
R² = 0.99
0
0.2
0.4
0.6
0.8
1
0 50000 100000 150000
Co
nce
ntr
ati
on
(g
L-1
)
Integration area
aMX Std bMX Std
aEX-Lab
y = 0.00000667x
R² = 0.99
bEX-Lab
y = 0.00000688x
R² = 0.99
bEX-Std
y = 0.00000708x
R² = 0.99
0.0
0.2
0.4
0.6
0.8
1.0
0 50000 100000 150000
Co
nce
ntr
ati
on
(g
L-1
)
Integration area
aEX-Lab bEX-Lab bEX- Std
aPX-Lab
y = 0.00000785x
R² = 0.99
bPX-Lab
y = 0.00000792x
R² = 0.990
0.0
0.2
0.4
0.6
0.8
1.0
0 50000 100000 150000
Co
nce
ntr
ati
on
(g
L-1
)
Integration area
aPX-Lab bPX-Lab

65
as a function of fractionation temperature and cooking duration. The concentration of aEX and bEX increase with
increase in temperature but under severe fractionation conditions a gradual decrease is observed at 145 and 155°C.
The maximum concentration of both anomers is achieved in 60 minutes at 155°C and in 80 minutes at 145°C. The
maximum concentration of aEX and bEX in SEW spent liquor under these conditions was nearly 9 g L-1 and 5 g L-1
respectively.
Figure 6.7: Alpha ethyl xyloside (aEX) formation in
SEW fractionation of SCS
Figure 6.8: Beta ethyl xyloside (bEX) formation in SEW
fractionation of SCS
Following the same kinetic approach as is used in section 5.3 using equation 8, the EX formation results are replotted
versus CSF. The aEX and bEX concentrations in Figure 6.7 and Figure 6.8 are replotted against CSF on the horizontal
axis in Figure 6.9 and Figure 6.10 respectively. Also, included in these figures are the alpha and beta xyloside
concentrations in the methanol (SMW) and isopropanol (SPW) spent liquors. The concentration of alpha xylosides is
higher than that of beta xylosides at the same CSF for each system (Figure 6.9 and Figure 6.10). For each alcohol
system, the maximum concentration of alpha and beta xylosides is observed at CSF of 2.4±0.1. The maximum
concentration of the alpha anomer of methyl, ethyl and isopropyl xylosides is 14.2±0.3, 7.6±0.7 and 6.3±1.5 g L-1
respectively, while the respective concentrations of the beta anomers are 7.8±0.5, 4.6±0.3 and 3.5±0.9 g L-1. The
amount of alpha xylosides in SMW, SEW and SPW spent liquors based on original SCS are 6.3±0.1, 3.4±0.3 and
2.8±0.7 g/100 g respectively. The corresponding level of beta anomers are 3.5±0.2, 2.1±0.1 and 1.5±0.4 g/100 g SCS.
0
1
2
3
4
5
6
7
8
9
0 50 100 150
aE
X (
g L
-1)
Cooking duration (min)
aEX-135 aEX-145 aEX-155
0
1
2
3
4
5
6
0 50 100 150
bE
X (
g L
-1)
Cooking duration (min)
bEX-135 bEX-145 bEX-155

66
This agrees with Hu et al. (2012) who also reported formation of more alpha xylopyranoside than beta xylopyranoside
in acidic methanolysis of xylose.
Figure 6.9: Kinetics of alpha xyloside (aX) formation in
SMW, SEW and SPW fractionation
Figure 6.10: Kinetics of beta xyloside (bX) formation
in SMW, SEW and SPW fractionation
To better understand the alpha and beta xyloside formation results, it is good to review the two studies by
Bishop and Cooper (1962; 1963). These studies on methanolic hydrogen chloride treatment of sugars showed that D-
xylose is rapidly converted to methyl xylofuranosides, followed by a two order of magnitude slower conversion of the
methyl furanosides in methyl xylopyranosides. Thus, after sufficient reaction time the final products are almost solely
methyl alpha and methyl beta D xylopyranosides. The methyl-alpha-D-xylopyranoside (or aMX) is in equilibrium
with methyl-beta-D-xylopyranoside (bMX) with an equilibrium constant of 2.2 at 25°C (Bishop & Cooper, 1963)
(Table 6.2). This value compares rather well to the aMX/bMX ratio of 1.84±0.08 (CSF > 2.0) obtained in the present
study for the SMW system as can be seen in Figure 6.11. A constant ratio for ethanol and isopropanol spent liquors
shows that alpha xyloside/beta xyloside equilibrium ratio (aX/bX) is independent of solvent system. A high scatter in
aX/bX data at low CSF in Figure 6.11 is expected as the concentrations of xylosides at low CSF are relatively small.
In the present study, we did not detect any xylofuranosides. Therefore, while it is likely that also in the present
fractionation systems the alkylation of xylose proceeds through formation of the two alkyl-D-xylofuranoside anomers,
these are very rapidly further converted into the corresponding alkyl-D-xylopyranoside anomers. Hu et al. (2012) also
reported negligible formation of xylofuranosides in acid-catalyzed conversion of xylose in methanol-rich medium.
0
2
4
6
8
10
12
14
16
1.0 1.5 2.0 2.5 3.0
aX
(g
L-1
)
CSF
SMW SEW SPW
0
1
2
3
4
5
6
7
8
9
1.0 1.5 2.0 2.5 3.0
bX
(g
L-1
)
CSF
SMW SEW SPW

67
Table 6.2: Rate constants for D-xylose methanolysis (adapted from Bishop & Cooper, 1963)
k1 k2 k1 + k2 K
1. Pentose → Furanosides 57 - - -
2. Furanosides: α ↔ ß 49 29 78 1.69
3. Furanosides ↔Pyranosides 0.12 0.0004 - 320
4. Pyranosides: ß ↔α 0.031 0.014 0.04 2.2
Figure 6.11: Alpha xyloside (aX) and beta xyloside (bX) equilibrium in spent liquors
The sum of the alpha and beta xylosides concentrations in the three fractionation systems follow a similar
pattern (Figure 6.12). In each system, the concentration increases slowly until a maximum at a CSF of 2.4±0.1 and
then decreases. Under mild fractionation conditions (CSF of 1.5±0.1) the concentration of EX and PX is nearly zero
while the MX concentration is around 1.0 g L-1. The decrease in xylosides concentration at severe fractionation
conditions (CSF>2.4) can be explained by decomposition of xylose to furfural and humins (Hu, et al., 2012) which
leads to hydrolysis of the xylosides due to its equilibrium with xylose. At the same CSF, the MX concentration is the
highest among the three systems, i.e. SMW > SEW > SPW. The average highest concentration of the sum of the two
anomeric xylosides occurs at 2.4±0.1 CSF, and are 22.0±0.9, 12.3±1.0, 9.7±2.4 g L-1 or 9.8±0.4, 5.4±0.5 and 4.3±1.1
g/100 g original SCS in SMW, SEW and SPW spent liquors respectively. These values are obtained by averaging the
two or three data points in the CSF range of 2.4±0.1 at the three different temperatures (135, 145, 155°C). It shows
that the maximum MX concentration is almost double that of EX and PX, with the last having the lowest concentration.
0.0
0.5
1.0
1.5
2.0
2.5
3.0
3.5
1.0 1.5 2.0 2.5 3.0
aX
/bX
CSF
SMW SEW SPW

68
Figure 6.12: Xylosides concentration in SMW, SEW and SPW spent liquors
The present results agree with earlier findings (Drouet, et al., 1994; Grisel, et al., 2014). Drouet et al. (1994)
enzymatically prepared alkyl beta-D-xylosides at 40°C using a mixture of xylose and methanol, ethanol or propanol
and Trichoderma reesei beta-xylosidase. It took more than six days to reach equilibrium. Drouet et al. (1994) results
show that longer chain alcohols are less likely to form alkyl xylosides. Similarly, more methyl glucosides were formed
than ethyl glucosides during acid (30 mM H2SO4) catalyzed alcoholysis of wheat straw with methanol and ethanol
(Grisel, et al., 2014). The high temperature of 200°C used in the Grisel et al. (2014) led to a final liquor pH of 1.5 after
30 minutes which corresponds to a CSF value of 2.93 (equation 8) which is significantly higher than that for the
maximum xylosides formation of 2.4 found in the present study. Therefore, the xylosides in the Grisel et al. (2014)
are mostly degraded to furfural and humins, while cellulose is mostly hydrolyzed and then converted into glucosides,
alcoxymethylfurfural and levulinates. At much milder conditions below 130°C and with Amberlyst 70 as catalyst Hu
et al. (2012) found that most of the xylose in aqueous methanol (methanol/water mass ratio of 4.5) was converted into
MX with negligible humins formation, similarly to the present results in Table 6.1. However, at temperatures above
150°C dehydration of xylose resulted in significant amounts of humins together with furfural and 2-
(dimethoxymethyl) furan formation. Iakovlev and van Heiningen (2012a) evaluated the spent liquors obtained from
SEW fractionation of spruce at 135°C (12% SO2). However, they did not analyze it for ethyl pyranosides and
furanosides. Therefore, this is the first SAW study whereby alkyl xylosides are quantified.
0
5
10
15
20
25
1.0 1.5 2.0 2.5 3.0
Xy
losi
des
(g
L-1
)
CSF
MX EX PX
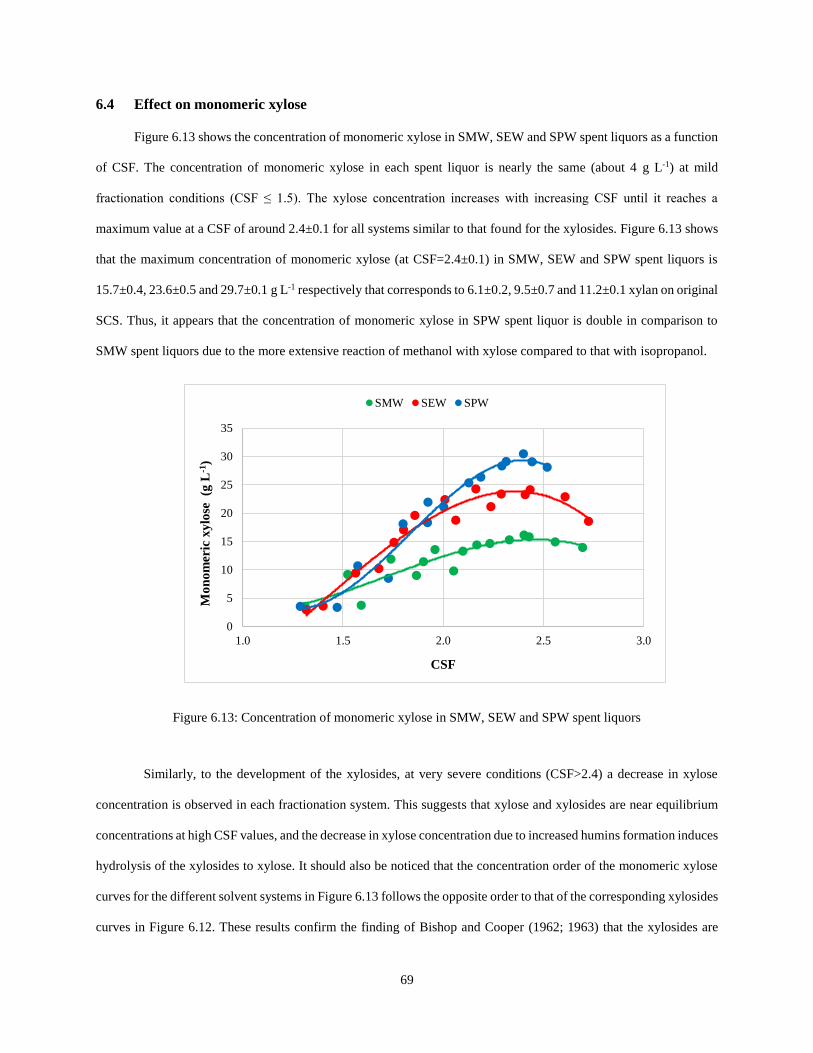
69
6.4 Effect on monomeric xylose
Figure 6.13 shows the concentration of monomeric xylose in SMW, SEW and SPW spent liquors as a function
of CSF. The concentration of monomeric xylose in each spent liquor is nearly the same (about 4 g L-1) at mild
fractionation conditions (CSF ≤ 1.5). The xylose concentration increases with increasing CSF until it reaches a
maximum value at a CSF of around 2.4±0.1 for all systems similar to that found for the xylosides. Figure 6.13 shows
that the maximum concentration of monomeric xylose (at CSF=2.4±0.1) in SMW, SEW and SPW spent liquors is
15.7±0.4, 23.6±0.5 and 29.7±0.1 g L-1 respectively that corresponds to 6.1±0.2, 9.5±0.7 and 11.2±0.1 xylan on original
SCS. Thus, it appears that the concentration of monomeric xylose in SPW spent liquor is double in comparison to
SMW spent liquors due to the more extensive reaction of methanol with xylose compared to that with isopropanol.
Figure 6.13: Concentration of monomeric xylose in SMW, SEW and SPW spent liquors
Similarly, to the development of the xylosides, at very severe conditions (CSF>2.4) a decrease in xylose
concentration is observed in each fractionation system. This suggests that xylose and xylosides are near equilibrium
concentrations at high CSF values, and the decrease in xylose concentration due to increased humins formation induces
hydrolysis of the xylosides to xylose. It should also be noticed that the concentration order of the monomeric xylose
curves for the different solvent systems in Figure 6.13 follows the opposite order to that of the corresponding xylosides
curves in Figure 6.12. These results confirm the finding of Bishop and Cooper (1962; 1963) that the xylosides are
0
5
10
15
20
25
30
35
1.0 1.5 2.0 2.5 3.0
Mo
no
mer
ic x
ylo
se
(g L
-1)
CSF
SMW SEW SPW

70
formed by equilibrium reactions from D-xylose, and that the equilibrium is shifted furthest towards xylosides for the
SMW fractionation system followed by SEW and finally SPW. Figure 6.14 shows that ratio of xylosides to xylose as
a function of CSF for the three spent liquors. The ratio increases with increasing CSF and reaches a constant, but
different values for the three fractionation systems at CSF>1.8. The constant ratios are 1.4, 0.5 and 0.3 for methanol,
ethanol and isopropanol fractionation respectively. This supports that at a higher severity of CSF>1.8 the xylosides
concentrations are in equilibrium with the xylose concentrations, and that the equilibrium constant increases from
isopropanol to ethanol to methanol.
Figure 6.14: Xylosides formation by an equilibrium reaction
6.5 Effect on xylo-oligomer and humins
Table 6.3 shows the xylose mass balance for the three fractionation systems for pulps and liquors produced at
a CSF of 2.4±0.1. In terms of equivalent amounts of anhydroxylose (or xylan), the sum of xylose, xylosides and
furfural quantified in the fresh spent liquor add up in all three systems to about 14% based on original SCS. After
hydrolysis of the spent liquor by treatment with H2SO4 (see section 5.1) the analyzed xylose represents approximately
16.5% xylan based on original SCS. Thus, the hydrolysis leads to a significant increase in xylose concentration due
to hydrolysis of both xylo-oligomers and xylosides. It is important to notice that xylosides were not present in
detectable amounts in the spent liquor after the hydrolysis step. With the addition of furfural (as anhydroxylose) in the
0.0
0.5
1.0
1.5
1.0 1.5 2.0 2.5 3.0
Xy
losi
des
/Xy
lose
CSF
SMW SEW SPW
71
hydrolyzed liquor, the total amount of xylan accounted for is equal to about 18% based on original SCS. This compares
well to total amount of dissolved xylan (about 19%) calculated from the difference of xylan in SCS (21.4±0.6) and in
pulps. The difference of 0.9-1.3% (on original SCS) is the xylan mass balance loss due to degradation to mostly
humins. It should be noted that the calculated xylan mass balance difference is generally within the experimental error,
and thus confirms that partial replacement of water by alcohol suppresses humins formation (Hu, et al., 2012; Grisel,
et al., 2014). Finally, the amount of xylo-oligomers is calculated as the difference between the total recovered xylan
in the hydrolyzed liquor and the total amount of xylan identified in the untreated spent liquor. It shows that about 3-
4% of xylan is present as oligomers in the SMW, SEW and SPW spent liquors. It accounts for 16-23% of the total
xylan present in spent liquors, and is about 1.7 to 3.6 times smaller than the equivalent amount of xylan identified as
monomeric xylose in the untreated spent liquor. Iakovlev and van Heiningen (2012a) reported for spent liquor from
SEW fractionation of spruce (12% SO2) that the amount of dissolved oligomeric hemicellulose was about the same as
the sum of the monomeric hemicellulose compounds (i.e. mannose, xylose, etc.) independent of fractionation
operating conditions. They overestimated the amount of dissolved hemicellulose oligomers because the ethyl
pyranosides were accounted for as hemicellulose oligomers by calculating the oligomers from the difference in sugar
concentration between the hydrolyzed and untreated spent liquor. Our results for monomeric xylose in SEW spent
liquor agree with their results. It can also be seen that the amount of furfural in the spent liquor is very small (0.3-
0.4% on SCS) which again is an indication that the presence of alcohol suppresses sugar degradation reactions.

72
Table 6.3: Xylan in pulp and its equivalent amount in different components of SL at CSF=2.4±0.1
Fractionation system SMW SEW SPW
SCS 21.2±0.6 21.2±0.6 21.2±0.6
Pulp 2.2±0.3 2.2±0.4 2.4±0.1
Xylosides (Spent liquor) 7.9±0.3 4.0±0.3 3.0±0.7
Monomeric (Spent liquor) 6.1±0.2 9.5±0.7 11.2±0.1
Furfural (Spent liquor) 0.3±0.1 0.3±0.2 0.2±0.1
Identified in Spent Liquor 14.3±0.4 13.8±0.8 14.4±0.7
Xylose (after hydrolysis of spent liquor) 16.2±0.5 16.7±1.3 16.4±1.6
Furfural (after hydrolysis of spent liquor) 1.7±0.3 1.4±0.2 1.1±0.1
Total recovered (xylose + furfural) 17.9±0.6 18.1±1.3 17.5±1.6
Total Dissolved (SCS-Pulp) 19.0 ±0.7 19.0 ± 0.7 18.8 ± 0.6
Xylo-oligomers (Total Recovered-Identified in spent liquor) 3.6±0.7 4.3±1.5 3.1±1.7
Xylan mass balance loss (Total dissolved – Total recovered) 1.1±0.9 0.9±1.5 1.3±1.7
The effect of CSF on the xylan mass balance and xylo-oligomer formation for the SEW process is seen in
Table 6.4. The concentration of dissolved xylose in spent liquor increases with CSF. A 4% increase in xylan
dissolution is seen with 0.7 units increase in CSF. SCS contains 21.2% xylan and 20.3±0.7 xylan is dissolved in spent
liquor leaving nearly 1.0% in residual pulp at CSF of 2.7±0.1. Only 0.4% xylan is reduced to furfural at this high
severity factor, but the xylan mass loss is comparatively high (~4.0%). Xylan mass loss at CSF of 2.0±0.1 and 2.4±0.1
are within experimental error equal to zero, indicating a complete xylan mass balance. This indicates that under severe
fractionation conditions (CSF of 2.7) xylan is converted to humins leading to significant xylan mass balance losses.
Grisel (Grisel, et al., 2014) also observed high xylan losses at severe cooking conditions. In that study a loss of more
than 40% was reported when wheat straw was ethylated at 2.79 CSF (175°C, 120 min, 40 mM H2SO4, pH 1.5 of final
liquor). More severe conditions (170°C, 120 min, 50 mM H2SO4, CSF is around 3.1 assuming pH of final liquor 1)
resulted less furfural and xylosides yields and consequently higher humins. Comparison with this acid catalyzed
ethylation study of wheat straw suggests that xylan losses are significantly lower using SO2 as catalyst in SEW
fractionation of SCS but H2SO4 as catalyst gives higher furfural yields.

73
Table 6.4: Effect of CSF on xylo-oligomer and humins formation in SEW fractionation of SCS
CSF 2.0±0.1 2.4±0.1 2.7±0.1
SCS 21.2±0.6 21.2±0.6 21.2±0.6
Pulp 4.9±0.4 2.2±0.4 0.9±0.3
EX (Spent liquor) 3.4±0.2 4.0±0.3 3.6±0.7
Monomeric (Spent liquor) 8.0±0.6 9.5±0.7 8.9±1.3
Furfural (Spent liquor) 0.0±0.1 0.3±0.2 0.4±0.2
Identified in Spent Liquor 11.4±0.6 13.8±0.8 12.9±1.5
Xylose (after hydrolysis of spent liquor) 15.8±2.1 16.7±1.3 14.8±1.8
Furfural (after hydrolysis of spent liquor) 1.2±0.1 1.4±0.2 1.3±0.0
Total recovered (xylose + furfural) 17.0±2.1 18.1±1.3 16.1±1.8
Total Dissolved (SCS-Pulp) 16.3±0.7 19.0 ± 0.7 20.3±0.7
Xylo-oligomers (Total Recovered-Identified in spent liquor) 5.6±2.2 4.3±1.5 3.2±2.3
Xylan mass balance loss (Total dissolved – Total recovered) -0.7±2.2 0.9±1.5 4.2±1.9
6.6 Solvent and xylose losses
The alpha and beta xylosides in the spent liquor represent a significant amount of chemically bound xylose and
alcohol which could interfere with alcohol recovery and complete utilization of xylose. Figure 6.15 shows the amount
of xylose and solvent bound in the form of alkyl xylosides based on original SCS. SMW spent liquor contains nearly
10 g/100 g SCS MX (alpha 6.3 g/100 g and beta 3.5 g/100 g) accounting for 1.9% methanol and 9% xylose on SCS.
SEW spent liquor contains nearly 6.0 g EX /100 g SCS (3.4 g alpha /100 g SCS and 2.1 g beta /100 g SCS) or 1.4 g
ethanol /100 g SCS and 4.6 g xylose/100 g SCS. Similarly, SPW spent liquor contains the smallest amount of xylosides
(2.8 g alpha/100 g SCS, 1.5 g beta/100g SCS) binding 1.3 g isopropanol/100 g SCS with 3.4 g xylose/100 g SCS.

74
Figure 6.15: Xylose & alcohol bound as alkyl xylosides in SAW spent liquors
Considering that only a few percent (based on dry biomass feedstock) of alcohol may be lost during solvent recovery
for an economic viable fractionation process, the chemically bound solvent in alkyl xylosides represents a significant
loss unless the alkyl xylosides are hydrolyzed or recovered and sold as an additional product. This applies even more
to xylose chemically bound in the alkyl xylosides because of its higher potential value and significant larger mass
percentage based on dry biomass. It may be very interesting to separate alkyl xylosides as a byproduct of the
fractionation process and find their commercial/industrial applications. In the next chapter, we described process
conditions which allow hydrolysis of the alkyl xylosides so that both the alcohol and xylose can be recovered and used
for production of biofuels and biochemicals. For example, the hydrolyzed spent liquor from SEW process might be
most suitable for ethanol production.
6.7 Conclusions
SAW fractionation of SCS results in simultaneous hydrolysis of xylan and formation of alkyl xylosides. Xylan
hydrolysis and xylosides formation is significantly influenced by the alcohol used in the acidic organosolv
fractionation/SAW process. Alkyl xylosides and xylo-oligomers are dominant in SMW spent liquors while SPW spent
liquors are rich in monomeric xylose. Monomeric xylose and alkyl xylosides are in equilibrium in the spent liquor
stream at a combined severity factor (CSF) of >1.8 and their maximum concentrations are observed at 2.4±0.1 CSF
0
1
2
3
4
5
6
7
8
9
10
SMW SEW SPW
g/1
00
g S
CS
Xyloside
Xylose
Alcohol

75
because of further conversion of xylose to furfural and humins. The concentration of monomeric xylose in SPW and
SEW spent liquor are 3.0 and 1.9 times higher than their corresponding xylosides. On the other hand, SMW spent
liquor contains 1.4 times more methyl xylosides than monomeric xylose. The amount of oligomeric xylose in the SEW
spent liquor is about three times as small as the xylose concentration (both as xylan), contrary to earlier reports that
these amounts were approximately the same. However, the latter reports did not consider the formation of xylosides.
The very small amounts of furfural and humins in the spent liquors indicate that the presence of ethanol and SO2
suppress the xylose degradation to furfural and humins as compared to aqueous H2SO4 catalyzed fractionation
processes. With additional hydrolysis of the SEW spent liquors after ethanol (and SO2) recovery, the SEW process
might be most suitable for ethanol or ABE production from biomass.

76
Chapter 7
7. SUGARS AND SOLVENT RECOVERY
7.1 Introduction
Since the maximum amount of xylose in SAW spent liquor is obtained at CSF of 2.4±0.1, it is optimal to stop
the fractionation treatment of SCS at this CSF value. A CSF value of 2.4±0.1 is obtained by pulping SCS for 100-120
minutes at 145°C in the present SMW, SEW or SPW system (SAW as 12/44/44%). The same CSF can be achieved
by SAW treatment of SCS at 155°C for one hour. In this chapter the latter conditions were employed to fractionate
SCS and obtain spent liquors which then were subjected to different severities of hydrolysis to study the recovery of
the solvent and sugars. Liquid to feedstock ratio, alcohol and SO2 concentration were kept the same as described
earlier (see section 3.3 ). The only modification was a change in the water washing step of the fractionated biomass to
minimize the amount of water introduced (less water needs to be evaporated in the solvent recovery step). This time
the solid residue was washed three times with DI water (L/F = 2 L kg-1) after alcohol washing (see for Figure 3.4 for
comparison). This modification did not have a significant effect on pulp kappa number as can be seen from Table 7.1.
The SMW system was not studied for solvent and sugar recovery because the high yield of methyl xylosides may
make it more valuable as a byproduct. Spent liquor, alcohol washings and water washings were added together forming
a dilute mixture called MSAW (Mixed SO2-Alcohol-Water) liquor. The MSEW (Mixed SO2-Ethanol-Water) and
MSPW (Mixed SO2-Isopropanol-Water) liquors were further investigated for alkyl or alcohol xylosides hydrolysis
kinetics to study the recovery of sugars and the solvents.
Table 7.1: Effect of water washing on pulp properties
Process Original Washing Scheme Modified Washing Scheme
Pulp Yield Pulp Kappa Pulp Yield Pulp Kappa
SEW 38.3 22.6 38.9±0.2 22.4±0.6
SPW 37.9 20.4 37.3±0.5 20.1±0.9
7.2 Washing and handling losses
SAW fractionation employs highly volatile solvents for easy solvent recovery. However, the high volatility
also results in serious evaporation mass losses during handling of the fractionated biomass as shown in Table 7.2. An
overall mass loss of 68.2 and 73% (based on SCS) was observed for the SEW and SPW fractionation system without

77
any washings. Even higher mass loss occurred when fractionated biomass was washed with aqueous alcohol and DI
water in the subsequent processing steps (Table 7.2). All the spent liquor separations and solid residue washings were
done under an exhaust hood. Therefore, these losses are attributed to evaporation of solvent and SO2 when handling
fractionated biomass in open vessels. However, such handling losses can be eliminated to a large extent by performing
solid residue (pulp) separations and washings in closed containers.
Table 7.2: Evaporative handling mass losses during SAW fractionation of SCS
SEW Fractionation SPW Fractionation
No Washing With Washings No Washing With Washings
Mass
(in)
SCS 24.0 24.0 24.0 24.0
Cooking liquor 86.8 86.7 85.4 84.4
Alcohol washings - 82.2 - 80.9
Water washings - 135 - 135
Total mass in 110.8 327.9 109.4 324.3
Mass
(out)
Spent liquor 67.4 67.2 65.0 64.3
Alcohol washings - 72.4 - 71.1
Water washings - 130.5 - 127.7
Wet Pulp 28.0 25.3 27.9 25.9
Total mass out 95.4 295.4 92.9 289.0
Loss % Mass lossa 68.2 144.8 73 156
All values are described as mass of material in grams
(a)-Based on oven dried SCS (~22.6 g)
7.3 Alkyl pyranosides hydrolysis
7.3.1 SO2 and alcohol removal
The addition of alcohol and water washings to the spent liquor resulted in substantial lignin precipitation.
This is called precipitate I in this thesis. The precipitated lignin was separated from the MSAW liquor, vacuum dried
(25°C) and then gravimetrically quantified (Table 7.3). The amount of lignin precipitate I was corrected for covalently
bound sugars (17-21%), determined by subjecting the solids to double stage hydrolysis (72% H2SO4, 30°C, 1h and
4% H2SO4, 121°C, 1h), and for ash content (4-7%). Thus, precipitate I represents 34-38% of total lignin in original
SCS. It should be noted that the alcohol concentration in the MSAW liquors was 25-28%. After precipitate I removal,
the MSAW liquors were subjected to alcohol and SO2 evaporation in a Heidolph rotary evaporator equipped with a
Maxima vacuum dryer. The water bath temperature was set at 80°C for rotary evaporation. It took about 40-60 minutes
to achieve ~65-75% mass reduction of the MSAW liquors. The removal of alcohol from MSAW liquors by rotary
evaporation also formed precipitated lignin designated as precipitate II. The precipitate II amounts were comparable

78
to precipitate I except that their content of sugars was much lower (3-7%). The resultant liquor is called EVAP in
accordance with nomenclature in earlier studies (Sklavounos et al. 2013a, You et al. 2017b). Precipitate II was
separated from the EVAP liquors (EVAPE for ethanol and EVAPP for isopropanol) by centrifugation (4000 rpm, 15
min). The dissolved lignin concentration in the EVAP liquors is 66-84% lower than that in the MSAW liquors. This
decrease in lignin content due to removal of precipitated lignin (I and II) is comparable to75% reduction in lignin
content reported by Sklavounos et al. (2013a) who used the same treatment for spruce MSEW spent liquor. Our results
also agree with You et al. (2017b) who found only 2-3% dissolved lignin in EVAPE liquor after rotary evaporation of
MSEW liquors obtained from SCS fractionation (155°C, 58 min, SEW liquor composition 12:44:44 w/w%). It
indicates that lignin removal from spent liquors by precipitation depends on alcohol dilution/depletion level
irrespective of lignocellulosic biomass.
Table 7.3: Rotovap and lignin precipitation
Fractionation process SEW SPW
Lignin in SCSa 19.8 19.8
Lignin in Pulpb 1.2 1.1
Lignin MSAW (SCS – Pulp) 18.6 18.7
Precipitate I 7.5 6.8
Dissolve I* 11.1 11.9
Lignin in EVAP
Precipitate II 7.9 5.5
Dissolve II* 3.2 6.4
All values are based on % SCS
a-Ash free Klason lignin
b-Calculated based on equation 1 and Table 7.1
*Calculated as numerical difference “Lignin in MSAW – Precipitate I/II”
Table 7.4 shows the comparison of fresh (SAW), mixed (MSAW) and rotovap (EVAP) spent liquors obtained
after SEW and SPW fractionation of SCS. A 3-4% increase in monomeric xylose content is seen while adding alcohol
and DI water washings to fresh SEW and SPW spent liquors. Similarly, washing removes an additional 2.5-3.5%
lignin from fractionated SCS. Some alkyl xylosides are also removed from the solid residue (or pulp) in the washing
process. These findings agree with Iakovlev et al. (2009) and Sklavounos et al. (2013a) that alcohol/water washing
removes a significant amount of lignin and carbohydrates from fractionated biomass. Very small changes in
monomeric xylose and xylosides content (SCS basis) occur when MSAW liquors are subjected to rotary evaporation
at 80°C indicating that xylosides and oligomer hydrolysis are not significant at this temperature. The small difference
in free xylose content in EVAP and MSAW liquors agrees with the amount of xylose found in precipitate II (0.3-0.6%

79
on SCS). The concentrations of ethanol (EtOH) and isopropanol (IPA) in EVAPE and EVAPP liquors are very low at
0.1 g L-1 (~0.02-0.03 g/100 g SCS). Thus, more than 99% of the alcohol present in the MSAW liquors is removed in
the rotovap step. However, alcohol chemically bound to carbohydrates or lignin remains in the EVAP liquor. The
fresh spent liquors have a high acidity (pH ~1.0) due to the presence of lignosulfonic acids. As expected the pH
increases to 1.2-1.3 due to dilution with lignosulfonic acid and SO2 free washing liquor. The pH again slightly goes
down when SO2 and alcohol are removed from the liquors by rotary evaporation because the increase in acidity due
to concentration is only partly balanced by the removal of SO2.
Table 7.4: Effect of washings and rotary evaporation on spent liquors contents
SEW fractionation SPW fractionation
SEW MSEW EVAPE SPW MSPW EVAPP
Monomeric xylose 9.9 (29.1) 12.8(10.0) 12.2 (43.6) 10.5 (32) 14.5 (11.5) 14.3 (38.1)
Xylosides 5.8 (18.5) 7.0 (5.7) 6.8 (24.6) 2.7 (9.3) 4.7 (3.9) 4.7 (12.5)
Alcohol 129 (429) 328 (272) 0.03 (0.1) 113 (385) 274 (235) 0.02 (0.1)
Lignin 15.8(52.5) 18.6(15.4) 3.2 (16.0) 15.3 (52.1) 18.7 (16.4) 6.4 (23.6)
pH 0.97 1.23 1.15 0.96 1.32 1.08
Mass concentration factor (mi/mf) 4.1 and 3.0 were used for SEW and SPW respectively in the calculations of EVAP
(g/100 g SCS). The numbers in parenthesis shows the concentrations in g L-1.
7.3.2 Heat treatment of EVAP liquors
EVAP liquors obtained after rotary evaporation and separation of precipitate lignin II were subjected to heat
treatment for xylosides hydrolysis at 100, 110 and 121°C in small vials placed in a stainless-steel vessel containing
polyethylene glycol (PEG) as a heating media. For the xylosides hydrolysis experiments we placed 1 mL EVAP liquor
in a 2.5 mL HPLC vial, closed it tightly and immersed in preheated PEG. The vials were weighed before and after the
reaction to monitor any mass loss due to leakage. The xylosides hydrolysis duration ranged from 10-130 minutes
including about 2-3 minutes for heat up of the vial content. After heat treatment, the samples were filtered (0.45 µm)
and analyzed for monomeric (free) xylose on HPAEC-PAD using fucose as internal standard. HPAEC injection
samples were prepared by adding fucose (1 g L-1, 1 mL) to the hydrolyzed liquor samples (0.1 mL) and then diluted
to 10 mL with NaOH (0.1M).
The amount of alcohol (ethanol or isopropanol) in all liquor samples was determined by HPLC. The HPLC
operating conditions were the same as described earlier (see section 3.2). Samples for HPLC analysis were prepared
by taking 0.1mL (0.45 µm filtered) liquor sample and diluting it with deionized water (dilution factor =10). The
amount of ethyl xylosides (EX) was determined by treating the 0.2 mL liquor with H2O2 (6.4 µL, 35%) and diluting

80
it with water (DF = 4-5). Only a small amount of hydrogen peroxide was added as SO2 is almost completely removed
during rotary evaporation (Sklavounos, et al., 2011). It was experimentally confirmed that a large excess of H2O2
(relative to SO2) did not affect the determination of the exact amount of EX in EVAPE and the corresponding heat
treated samples. Isopropyl xylosides (PX) in EVAPP and corresponding hydrolyzed liquors were estimated using the
calibration curves developed earlier (Chapter 6). However, isopropanol samples were analyzed without any H2O2
addition as SO2 elution does not interfere with PX anomers analysis (see Figure 6.2 and Figure 6.3 in Chapter 6). In
the EVAP and hydrolyzed spent liquor samples, all dilutions were performed with DI water at lower dilution factors
(4-6) to keep the xyosides concentrations at measurable detection levels.
7.4 Ethyl pyranosides hydrolysis
EVAPE spent liquor contains 6.8% EX on SCS (Table 7.4). Figure 7.1 shows the hydrolysis of EX (sum of α and β
ethyl pyranosides) during heat treatment at different temperatures. At 100°C a gradual disappearance in EX is seen
over a period of about 2 hours. The rate of disappearance increases with temperature and negligible EX remains after
70 minutes at 121°C.
Figure 7.1: Ethyl xylosides (EX) hydrolysis at different temperatures
Plotting the natural logarithm of the EX molar concentration vs reaction time (Figure 7.2) produces straight
lines. The data points after 70 minutes at 121°C are not included in the kinetic analysis as it produces inaccurate results
0.0
1.0
2.0
3.0
4.0
5.0
6.0
7.0
8.0
0 20 40 60 80 100 120 140
EX
(g
/10
0 g
SC
S)
Time (min)
EX-100
EX-110
EX-121

81
because of very low EX concentration. Thus, hydrolysis follows first order kinetics in EX. The first order rate constants
were determined from the slopes of the straight lines in Figure 7.2 and are listed in Table 7.5. An activation energy
for EX hydrolysis of 66 kJ mol-1 is determined from the rate constants based on the Arrhenius equation. The rate
constant data show that hydrolysis is two times faster at 110°C than at 100°C and another 1.5 times faster at 121°C.
The PX hydrolysis results will be discussed later in this chapter.
Figure 7.2: Kinetics of ethyl xylosides (EX) hydrolysis
Table 7.5: Kinetic paraments of alkyl xylosides hydrolysis
khyd x 102 (min-1) Activation Energy (kJ mol-1)
100°C 110°C 121°C
EX 1.68 3.49 5.23 66
PX 2.13 5.97 20.06 130.7
1 mole of EX hydrolysis produces 1 mol of xylose and ethanol (see equation 12).
𝐶7𝐻14𝑂5 + 𝐻2𝑂 ↔ 𝐶2𝐻5𝑂𝐻 + 𝐶5𝐻10𝑂5 (12)
The EVAPE liquor initially has 6.8 g EX (per 100 g SCS) corresponding to 38 mMol (per 100 g SCS) of EX. It also
contains 12.2 g xylose (or 81.2 mMol) which is subtracted from the total xylose content measured after EX hydrolysis.
The development of the molar concentration of the newly formed xylose at different hydrolysis conditions is plotted
in Figure 7.3. The rate of xylose release increases dramatically as the temperature is increased from 100°C to 121°C.
-8.00
-7.00
-6.00
-5.00
-4.00
-3.00
-2.00
0 20 40 60 80 100 120 140
ln E
X (
mo
l/1
00
g S
CS
)
Time (min)
EX
EX-100
EX-110
EX-121

82
Figure 7.1 suggests that complete EX hydrolysis requires more than 2 hours at 100°C, while the same can be achieved
in 70 minutes at 121°C. A similar heat treatment method is patented by Retsina and Pylkkanen (2013) to recover lignin
from SEW spent liquors. In the patented process, it is claimed that heat treatment of SEW spent liquors produces water
insoluble lignin while also all “oligomeric sugars” are converted to monomers. However, based on Chapter 6 findings
it is clear now that the described “hydrolysis of oligomeric sugars” in the patent, involves mostly the hydrolysis of
EX. In the current heat treatment of EVAPE liquors no additional acid catalyst, such as H2SO4, is needed for EX
hydrolysis because the SAW process produces its own strong soluble acid catalyst, lignosulfonic acid. The addition
of an acid catalyst promotes sugars dehydration reactions leading to reduced sugar yield as is seen in earlier studies
(Grisel, et al., 2014). Grisel et al. (2014) encounter high sugar losses in organosolv (94% EtOH or 95% MeOH)
treatment of wheat straw with mineral acid (H2SO4) as catalyst. The reported losses of more than 25% are attributed
to humins formation.
Figure 7.3: Xylose release from ethyl xylosides (EX) hydrolysis
Heat treatment of EVAPE liquor also releases EtOH as is shown in Figure 7.4. This is expected based on
reaction (12). After rotary evaporation of MSEW the resultant liquor (EVAPE) still has liquor ~0.1 g L-1 (Table 7.4)
EtOH. This corresponds to 0.7 mMol EtOH per 100 g SCS. This amount is subtracted from the EtOH concentration
in the hydrolyzed liquor, and the corrected EtOH concentrations are plotted in Figure 7.4. Based on the stoichiometry
of reaction (12) and the results in Figure 7.4 it can be calculated that the maximum EtOH concentration after complete
0
5
10
15
20
25
30
35
40
45
0 20 40 60 80 100 120 140
Xy
lose
(m
Mo
l/1
00
g S
CS
)
Time (min)
121
110
100
83
EX hydrolysis would be 38 mMol. However, the maximum EtOH concentration in the heat-treated liquors reaches a
value of about 78 mMol which is almost twice as high (see Figure 7.4). The EtOH concentration at complete EX
hydrolysis point (121°C, 70 min) is still higher than expected value (70 mMol vs 38 mMol). Other possible sources
of EtOH are ethylated lignin and/or ethyl pyranosides/furanosides of sugars other than xylan. We did not measure
ethyl pyranosides of other sugars (arabinose, galactose, glucose, mannose) in MSEW liquors but their presence is
likely, albeit at much lower concentrations in comparison to EX. Thus, the most likely source for the additional EtOH
is ethylated-lignin. Bauer et al. (2012) shows that acidic organosolv treatment of Miscanthus with EtOH (95% EtOH,
0.2 M HCL, 8 h reflux) results in modification of the lignin structure. Under these conditions, EtOH behaves as a
nucleophile and ethoxylates the α-hydroxyl group of the lignin propane side units containing a ß-O-4 linkage. The α-
ethoxylation is the only major lignin modification seen in this ethanolsolv pretreatment process. Similar findings have
been reported by Lancefield et al. (2017) for organosolv treatment (10 mL g-1, 0.2 M HCL, Alcohol/water: 95:5
ROH/H2O, 6 h reflux) of different lignocellulosic biomass (beech, Walnutshell and Douglas Fir). Interestingly, nearly
96% of the propane side units containing a ß-O-4 linkage are α-ethylated for all these species at 110°C, while a lower
degree of ethoxylation is observed under reflux conditions at the azeotropic boiling point of 78.15°C (65% beech,
71% walnutshell, 84% Douglas fir) indicating that lignin ethoxylation occurs at relatively low temperatures.
Hydrolysis of these α-ethoxylated linkages are reported to occur under relatively mild acidic conditions (0.1M HCL,
2:1 dioxane/water, 100°C, 4 h) to produce native-like lignin (Lancefield, et al., 2017). Thus, heat treatment of SAW
liquor not only leads to xylosides hydrolysis but also to lignin de-ethoxylation which is a very important finding for
commercial implementation of organosolv processes since full EtOH recovery is needed for a viable biochemical
conversion technology. The advantage of the SAW technology is that there is no need to add any additional
mineral/organic acids since the inherently present lignosulfonic acid provides the required acidity for the hydrolysis
reactions.

84
Figure 7.4: Ethanol release from ethyl xylosides (EX) hydrolysis
To confirm lignin ethoxylation, the lignin from fresh spent liquor was precipitated and then subjected to
NMR analysis (more details in Chapter 8). The precipitated lignin samples were prepared by removing alcohol and
SO2 from spent liquor through rotary evaporation and then adding DI water (see section 8.2). The degree of
ethoxylation was quantified by analyzing the precipitated lignin samples using headspace-isotope dilution (HS-ID)
GC-MS method based on hydroiodic acid cleavage of alcoxy groups (Sumerskii, et al., 2017). The NMR data (see
section 8.5) confirms that soluble lignin produced during SEW fractionation undergoes alcoholysis reaction as
described in earlier studies (Bauer, et al., 2012; Lancefield, et al., 2017). The alcoxy (methoxy, ethoxy and iso
propoxy) groups chemically bound to lignin produced in the three SAW processes were quantified and are shown in
Figure 7.5. The lignin precipitate is corrected for sugars retained in the samples (~5%), and the molecular weight of
lignin is taken as 204.24. Molar weight (MW) of 204.24 g mol-1 is used for SCS lignin based on typical structures of
G, S and H phenylpropane units and their weight distribution as described in section 4.3. As expected all three lignin
samples contain a significant amount of methoxy groups as it is composed of mostly guaiacyl and syringyl units. The
methoxyl content is higher in SMW lignin because of methoxylation of lignin in the SMW fractionation process.
0
10
20
30
40
50
60
70
80
90
0 20 40 60 80 100 120 140
EtO
H (
mM
ol/
10
0 g
SC
S)
Time (min)
121
110
100

85
Figure 7.5: Content of methoxy, ethoxy and isopropoxy functional groups in SAW lignins
Based on Figure 7.5 it can be calculated that nearly 0.18 mol ethoxy groups are present per mol of SEW
lignin. Hence, there are total 16.4 mMol ethoxy groups (per 100 g SCS) chemically bound to dissolved SEW lignin
(based on 18.6% lignin, Table 7.3). Complete hydrolysis of these linkages produces 16.4 mMol EtOH/100 g SCS, so
the maximum amount of EtOH produced by EX and SEW lignin hydrolysis is 54.4 mMol of EtOH/100 g SCS (38
from EX + 16.4 from lignin). Since this is still smaller than the maximum of 70 mMol EtOH/100 g SCS at complete
EX hydrolysis (see Figure 7.1), it was investigated whether the difference of 15.6 (70-54.4) mMol EtOH/100g SCS
could be produced from hydrolysis of ethyl pyranosides/furanosides of other sugars in the spent liquor.
Hydrolysis converts all pyranosides/furanosides as well as sugar oligomers into monomeric sugars. Table 7.6
shows the concentration of non-xylose monosaccharides in EVAPE and EVAPP spent liquors before and after
hydrolysis. Non-xylose monomeric sugars in fresh EVAPE are measured and compared with their corresponding
quantities in the completely hydrolyzed liquor (121°C, 70 min). Similar analysis is done for fresh EVAPP and
hydrolyzed liquor (121°C, 30 min) discussed later in this chapter (section 7.5). The increase in non-xylose sugar
content after hydrolysis indicates the contribution from hydrolysis of corresponding pyranosides/furanosides and
oligomers in fresh spent liquors. When neglecting the contribution from oligomers (only glucomannan) it can be
calculated that the maximum increase in monosugars caused by hydrolysis of pyranosides/furanosides could be 15.2
mMol of EtOH/100 g SCS, which is nearly the same as the earlier identified difference of 15.6 mMol/100 g SCS.
0.00
0.10
0.20
0.30
0.40
0.50
0.60
0.70
0.80
0.90
1.00
SMW SEW SPW
Alc
oxy
/C9
Methoxy Ethoxy isopropoxy

86
However, for unequivocal verification that the additional ethanol (15.2 mMol) is coming from the non-xylose
pyranoside/furanosides quantification is needed of the pyranosides/furanosides of all other sugars than xylose.
Table 7.6: Non-xylose sugars mass and molar balance for fresh and hydrolyzed spent liquors
EVAPE EVAPP
Fresh Hydrolyzed Pyr/Fur Fresh Hydrolyzed Pyr/Fur
Arabinose 2.4 (16.0) 3.2 (21.3) 0.8 (5.3) 2.5 (16.6) 2.8 (18.8) 0.3 (2.2)
Galactose 0.5 (2.8) 0.7 (4.1) 0.2 (1.3) 0.6 (3.1) 0.6 (3.6) 0.0 (0.5)
Glucose 3.5 (19.4) 4.7 (26.3) 1.2 (6.9) 4.4 (24.4) 4.7 (25.9) 0.3 (1.5)
Mannose 0.4 (2.0) 0.7 (3.7) 0.3 (1.7) 0.5 (2.6) 0.7 (3.8) 0.2 (1.2)
Total 6.8 (40.2) 9.3 (55.4) 2.5 (15.2) 8.0 (46.7) 8.8 (52.1) 0.8 (5.4)
Quantities are reported as g/100 g SCS. The numbers in brackets shows concentration as mMol/100 g SCS
7.5 Isopropyl pyranosides hydrolysis
EVAPp contains 4.7 g PX (per 100 g SCS) as shown earlier in Table 7.4. This represents 3.7 g of the equivalent
xylose. Comparing this with isopropyl xylosides in fresh SPW spent liquors and MSPW (Table 7.4) indicates that
addition of the wash liquors increases the amount of PX confirming that PX is washed out of the cooked SCS. Table
4.7 also shows that rotovap treatment of MSPW liquor at 80°C to produce EVAPP is unable to hydrolyze PX at this
temperature as was also found for EX. Subsequently the EVAPP liquors which are essentially free of SO2 and IPA are
subjected to heat treatment at temperature >80°C. The effect of heat treatment temperature on PX hydrolysis is shown
in Figure 7.6. The PX hydrolysis rate increases with increasing temperature and complete hydrolysis is achieved in
about 30 minutes at 121°C. It takes about 100 minutes at 110°C for complete hydrolysis but EVAPP still has about
0.3 g or 6.4% PX remaining after 2 h heat treatment at 100°C.

87
Figure 7.6: Isopropyl xylosides (PX) hydrolysis at different temperatures
The initial PX content of EVAPP of 4.7 g/100 g SCS is equivalent to 25 mMol/100 g SCS. As for EX, a natural
logarithm plot of the molar concentration of PX in the heat-treated liquors vs reaction time at different temperatures
is shown in Figure 7.7. The straight lines again indicate a first order hydrolysis reaction for PX as is found for EX.
The first order reaction rate constants calculated from the slopes of straight lines (Figure 7.7) are listed in Table 7.5.
It shows that the PX hydrolysis rate constants are higher than those of EX at 100, 110 and 121°C, and the PX hydrolysis
is 10 times faster at 121°C than at 100°C. This is reflected by the high activation energy of PX hydrolysis (130.7 kJ
mol-1) which is about two times higher than that of EX. This high activation energy might be related to steric hindrance
offered by the isopropyl groups. Therefore, it is more efficient to perform heat treatment on EVAPP at high
temperatures for complete IPA recovery and xylose release.
0.0
0.5
1.0
1.5
2.0
2.5
3.0
3.5
4.0
4.5
5.0
0 20 40 60 80 100 120 140
PX
(g
/10
0 g
SC
S)
Time (min)
PX-100
PX-110
PX-121

88
Figure 7.7: Kinetics of isopropyl xylosides (PX) hydrolysis
The maximum amount of xylose released during heat treatment of EVAPP at different temperatures is 22
mMol as shown in Figure 7.8. This is slightly smaller than the initial amount of 25 mMole PX/100 g SCS. However,
the maximum molar amount of IPA formed is significantly larger than 25 mMole/100 g SCS at 110 and 121°C as can
be seen in Figure 7.9. Based on the stoichiometry of the PX hydrolysis reaction:
𝐶8𝐻16𝑂5 + 𝐻2𝑂 ↔ 𝐶3𝐻7𝑂𝐻 + 𝐶5𝐻10𝑂5 (13)
Complete hydrolysis of PX should produce 25 mMol of xylose and IPA per 100 g SCS. The maximum 22 mMol of
xylose obtained suggests that a small amount of xylose is dehydrated/condensed to furfural and humins respectively.
This is supported by the finding that about 4 mMol furfural was present in heat-treated liquor after 130 minutes at
121°C.
-9.0
-8.0
-7.0
-6.0
-5.0
-4.0
-3.0
0 20 40 60 80 100 120 140
ln P
X (
mo
l/1
00
g S
CS
)
Time (min)
PX
PX-100
PX-110
PX-121

89
Figure 7.8: Xylose release from isopropyl xylosides
(PX) hydrolysis
Figure 7.9: Isopropanol (IPA) release from isopropyl
xylosides (PX) hydrolysis
As with EX hydrolysis, the concentrations of IPA higher than 25 mMol suggests that the solvent is also
covalently bound to lignin and other sugars than xylose. EVAPP liquor treated at 121°C for 30 minutes contains 32
mMol IPA, i.e. 7 mMol (or 28%) more than expected from PX hydrolysis stoichiometry. Figure 7.5 shows that SPW
lignin contains 0.22 mol isopropoxy units per mol of lignin. This isopropoxy/C9 ratio is similar to ethoxy/C9 suggesting
that lignin alcoholysis is determined by the reactivity of lignin and not the solvent. This data implies that complete de-
isopropoxylation of dissolved lignin from SPW fractionation will produce 20 mMol IPA. Thus, complete hydrolysis
of PX and lignin produces 45 mMol IPA which is more than the maximum (32 mMol) found in EVAPP heat treated
liquor (121°C, 30 min). This can be related to comparatively slower de-alcoxylation of isoproxylated than ethoxylated
lignin in the presence of lignosulfonic acids. The argument is supported by Lancefield et al. (2017) who reports better
de-etherification of ethanol than butanol lignins in acidic media (0.1 M HCL in 2:1 dioxane/water at 100°C).
We have not analyzed isopropyl pyranosides/furanosides of non-xylose sugars in MSPW liquors for two
reasons; (1) No standard compounds are available for quantification, (2) the concentrations of non-xylose isopropyl
pyranosides/furanosides are likely much lower than the corresponding ethyl compounds because of the smaller extent
of this reaction with longer chain alcohols (Drouet, et al., 1994). However, an analysis of hydrolyzed and fresh EVAPP
liquors from Table 7.6 suggests that hydrolysis of pyranosides/furanosides of non-xylose sugars can produce no more
than 5.4 mMol IPA. This amount might have contributed to extra IPA found in the hydrolyzed EVAPP liquors.
0
5
10
15
20
25
0 50 100 150
Xy
lose
rele
ase
(m
Mo
l/1
00
g S
CS
)
Time (min)
121
110
100
0
5
10
15
20
25
30
35
40
0 50 100 150
IPA
ele
ase
(m
Mo
l/1
00
g S
CS
)
Time (min)
121
110
100
90
7.6 Conclusions
Spent liquors from SEW and SPW fractionation of SCS containing significant amounts of ethyl xylosides (EX)
and isopropyl xylosides (PX) respectively are subjected to heat treatment to recover alcohol and chemically bound
xylose. The kinetics of alcohol xylosides hydrolysis shows that EX and PX are completely hydrolyzed to xylose and
their respective alcohols. The hydrolysis does not require addition of any mineral acids since lignosulfonic acids,
present in the spent liquors, provide the required acidity for the alcohol xylosides hydrolysis reaction. The rate of
hydrolysis is higher for PX than EX at temperatures of 100 °C or higher, while the hydrolysis does not or only slightly
occur at 80°C. At 121°C the hydrolysis is complete after 30 or 70 minutes respectively. Longer times at this
temperature promotes xylose dehydration reactions. Higher concentrations of alcohols (EtOH or IPA) are obtained
than the stoichiometric amounts expected from hydrolysis of the respective alcohol xylosides. It is argued that the
additional alcohol is mostly coming from hydrolysis of ethoxylated (or isopropoxylated) lignin and of alcohol
pyranosides of other sugars than xylose (i.e. arabinose, galactose, glucose and mannose) which were not quantified in
the current study. SEW and SPW lignins contains 16.4 and 20 mMol ethoxy or isopropoxy groups (per 100 g SCS)
respectively and their molar ratio suggests that lignin alcoholysis is determined by the reactivity of lignin and not the
solvent. These alcoxy groups are most likely linked to alpha position of ß-O-4 linkages in lignin based on earlier
literature. The present study reveals that alcohol and monomeric sugars are completely recoverable from the SAW
process by simple heat treatment of the solvent-depleted spent liquor at 100 to 121 °C.
91
Chapter 8
8. LIGNIN MODIFICATIONS: EFFECT OF SOLVENTS
8.1 Introduction
Lignin is the 2nd most abundant renewable material on earth with cellulose being the first (Hu, et al., 2011;
Min, et al., 2013; Kuhad & Singh, 2007). In contrast to most of other natural polymers, which have single inter-
monomeric linkage, lignin contains many different carbon-to-carbon and ether linkages. It is almost impossible to
isolate lignin in pure form because of strong physical and chemical linkages between lignin and the cell wall
polysaccharides (Holtmam, et al., 2003). That’s why it is hardly being used for making value added products despite
its high availability. Lignin can be separated from lignocellulosic biomass by mechanical or chemical means. Milled
wood lignin (MWL) is considered native-like lignin that is extracted from finely ball milled biomass using aqueous
dioxane (Bjorkman, 1954; 1956). Some modification in MWL, including cellulolytic enzymatic lignin (CEL) (Chang,
et al., 1975) and enzymatic mild acidolysis lignin (EMAL) (Wu & Agrypopoulos, 2003) are included to decrease the
amount of carbohydrates contamination. These separation technologies produce lignin at low yields and are energy
intensive because biomass milling process extends hours to weeks (Guerra, et al., 2006). Kraft and acid sulfite are two
well-known chemical pulping processes that produce cellulosic pulp and a spent liquor stream rich in lignin. In the
Kraft process, lignin undergoes major modifications and the lignin containing spent liquor is burnt in a chemical
recovery cycle to meet energy requirements and recover the inorganic pulping chemicals (Kouisni, et al., 2011). Kraft
lignin can be recovered from the spent pulping liquor by acid precipitation (Kouisni, et al., 2011) However, Kraft
lignin is not as reactive as sulfite lignin, called lignosulfonates, has many applications such as surfactants, dispersants,
binder, emulsion agent etc. (Yang, et al., 2007). The number of mills producing lignosulfonates has reduced over time
because of the difficulty to compete with Kraft pulp. In contrast to Kraft and acid sulfite, organosolv pulping processes
are suggested as a route to produce pure and sulfur-free lignin as a byproduct. Such lignin without major chemical
modifications is referred to as native lignin. It is reported that SO2-ethanol-water (SEW) produces pure lignin that can
be easily separated from spent liquor stream without further acidification by simple evaporation of ethanol (Retsina
& Pylkkanen, 2013). However, the lignin obtained from SEW fractionation contains sulfonate groups just as sulfite
lignin. The degree of sulfonation of spruce SEW lignin has been reported (Iakovlev & van Heininhen, 2012b) but no
mention was made of possible modifications such as ethoxylation of the lignin. In view of recent findings that lignin

92
was modified during organosolv fractionation (Bauer, et al., 2012; Lancefield, et al., 2017), SAW lignin obtained from
SCS fractionation was further analyzed, and the effect of the solvent used (methanol, ethanol and isopropanol) on
lignin modification was studied.
8.2 Lignin separation and analysis
SCS was fractionated for 1 hour at 155°C. The cooking liquor composition and other pulping conditions have
been described earlier (see Chapter 3 and Chapter 5). Fresh spent liquors (SMW, SEW and SPW) were subjected to
rotary evaporation to remove SO2 and alcohol. After 50-60% mass reduction of the spent liquors by rotary evaporation,
the remaining suspension was transferred into 50 mL Corning vials and DI water (30-35 mL) added to further
precipitate the lignin. The precipitated lignin was separated by centrifugation (4000 rpm, 10 minutes). The obtained
samples were freeze dried (-80°C) and then put into a vacuum oven dryer (vacuum ~10-4 Torr) for at least 48 hours.
The final lignin samples obtained after processing of SMW, SEW and SPW spent liquors are shown in Figure 8.1, 8.2
and 8.3 respectively. The obtained SPW lignin after above mentioned processing was lighter in color in comparison
to SMW and SEW lignins. One of the reasons may be less lignin condensation reactions in SPW fractionation or
removal of certain chromophores in the washing step. The precipitated lignin samples shown in Figures 8.1-8.3 were
analyzed for sulfur, molecular weight distribution and degree of alcoholysis/alkylation.
Figure 8.1: Precipitated lignin from
SMW fractionation
Figure 8.2: Precipitated lignin from
SEW fractionation
Figure 8.3: Precipitated lignin from
SPW fractionation
The amount of lignin remaining in the pulp was calculated from the kappa number and pulp yield (see equation
1, Chapter 4). The amount of lignin in the spent liquors was calculated from the difference between the original lignin
content in SCS and that in the pulp. Original SCS and pulps were ground in a Wiley mill before total sulfur analysis.

93
The amount of sulfur in these solids and in the precipitated lignin samples was determined after digesting the solids
following the EPA-3051 method and then analyzing for sulfur using ICP-AES.
Molecular weight distributions of the dissolved lignin samples were obtained by dissolving 5 mg of lyophilized
samples in a 2 mL of DMSO+0.5% LiBr (w/w) solution. After filtration of the samples through 0.45 µm PTFE filters,
size exclusion chromatography (SEC) was performed with SEC 1260 Infinity (Polymer Standard Services, Germany).
The equipment consisted of an isocratic pump (G1310B), a micro degasser (G1379B) and a standard autosampler
(G1329B). The detection system included a UV detector (G1314B) in series with a refractive index detector
(G1362A). The mobile phase was DMSO+0.5% LiBr set to a constant flow rate of 0.5 mL min-1 for a total run time
of 65 minutes. The injection volume was 100 µL. The separation system consisted of PSS GRAM Precolumn, PSS
GRAM 100 Å and PSS GRAM 10 000 Å analytical columns thermostated at 60°C and connected in series. The
pullulan standards with nominal masses of 708 kDa, 337 kDa, 194 kDa, 47.1 kDa, 21.1 kDa, 9.6 kDa, 6.1kDa, 1.08
kDa and 342 Da were used for standard calibration.
2D-NMR was performed on the precipitated lignin samples dissolved in DMSO: Pyridine = 4:1. All spectra
were acquired on a Bruker Avance II 400 MHz with a BBFO broadband probe head with z-gradients. HSQC spectra
were acquired in the edited mode to get information about the different carbon bonds visualized in plots with different
colors: CH + CH3 blue and CH2 in red. The relaxation delay in the HSQC was set to 0.5 s. Methoxy, ethoxy and
isopropoxy functional groups in SMW, SEW and SPW precipitated lignin samples were quantified using a recent
method developed based on headspace-isotope dilution (HS-ID) GC-MS (Sumerskii, et al., 2017). This method
employs an isotopically labeled internal standard 4-(methoxy-d3)-benzoic acid and 4-(ethoxy-d5)-benzoic acid,
which, together with lignin, undergoes standard hydroiodic acid cleavage of methoxyl and ethoxyl groups, followed
by headspace GC-MS analysis of the respective deuterated and non-deuterated iodomethanes and iodoethanes.
8.3 Lignin sulfonation
The degree of sulfonation of SCS lignin for the three SO2-organosolv pulping processes is shown is Table 8.1.
The results from other recent studies conducted on SEW fractionation of spruce, softwood and hardwood biomass and
SCS (Iakovlev & van Heiningen, 2012b; Sklavounos, et al., 2013a; Yamamoto, et al., 2014b) are also included in
Table 8.1. The degree of sulfonation is expressed as the S/C9 ratio for the pulp lignin and the precipitated lignin. Molar
weight (MW) of 204.24 g mol-1 is used for SCS lignin based on typical structures of G, S and H phenylpropane units

94
(see section 4.3) and their weight distribution (G:S:H of 68:28:4) (del Río, et al., 2015; Quesada-Medina, et al., 2010).
All other studies cited in Table 8.1 employ a lignin MW of 190 for different biomass species for S/C9 determination,
however using same MW for SCS makes insignificant difference (0.01). The yield of precipitated lignin was 30-45%
(based on total dissolved lignin) for 50-60% spent liquor mass reduction by rotary evaporation. The precipitated lignins
also contained 4.5-8.0% sugars that were corrected for sulfur and latter alcoxy groups analysis. It can be seen in Table
8.1 that the S/C9 ratio of residual lignin for the three SAW fractionation systems is the same (about 0.17) within
experimental error. You et al. (2017a) reports same findings for SEW fractionation of SCS. This shows that the solvent
has no effect on the degree of lignin sulfonation, in agreement with Iakovlev and van Heiningen (2012b) who found
the same S/C9 ratio for AS and ethanol-AS pulping systems and concluded that the presence of ethanol does not affect
lignin sulfonation. The percentage sulfur on oven dried feedstock (odf) basis in the three residual lignins is also same.
The higher sulfur content in SEW pulps (0.03 vs 0.06 %odf) reported by You et al. (2017a) can be explained by sulfur
present in the original SCS that does not participate in sulfonation process. Despite the same S/C9 and percentage
sulfur (%odf), SMW pulp has higher lignin content (2.11%). The difference in percentage residual lignin can be
explained by solubility of lignin in methanol, ethanol and isopropanol cooking liquors (see section 4.3). The
comparison of δ-values of the cooking liquors with δ-value of SCS lignin (28.47 MPa1/2) shows that the SPW liquor
is the best SCS lignin solvent among three solvents, while SMW cooking liquor is the poorest one. Iakovlev and van
Heiningen (2012b) suggest that less degree of sulfonation at which lignosulfonates dissolution become possible, is
required in a cooking liquor of significantly higher solubility (water vs ethanol-water). Therefore, a high degree of
sulfonation is required to dissolve lignin in methanol in comparison to ethanol and isopropanol. The S/C9 comparison
of residual lignin from SEW fractionation of SCS with other biomass species indicates the ratio is slightly higher for
SCS lignin. These small differences may be related to variations in the lignin structures of SCS and wood biomass.
One major difference between wood and annual plant lignin is that the latter contains all three lignin units (G, S and
H) and significant amount of hydroxycinnamic acids (Lam, et al., 1992). Also, straw lignin is more susceptible towards
sulfonation and condensation due to presence of more phenolic groups in comparison to wood species.

95
Table 8.1: Sulfonation of lignin in SAW fractionation of SCS
Fractionation Residual
lignin Sulfur in pulp
Sulfur in
precipitated lignin
Feedstock Process % odf % odf S/C9 % odf S/C9
SCS SMW 2.11±0.49 0.05±0.02 0.14±0.03 0.10±0.00 0.10±0.00
SCS SEW 1.06±0.09 0.03±0.01 0.18±0.01 0.10±0.02 0.09±0.00
SCS SPW 0.95±0.07 0.03±0.00 0.17±0.02 0.09±0.00 0.08±0.00
SCSa SEW 0.06 0.15 0.22 0.13
Spruceb SEW 3.33 0.07 0.12 n.m n.m
Sprucec SEW 3.06±0.34 0.05 0.09 n.m n.m
SWd SEW 8.7 0.16 0.11 n.m n.m
HWe SEW 2.0 0.04 0.11 n.m n.m
SWf SEW 9.7 0.13 0.08 n.m n.m
Spruceg SEW 5.0 0.08 0.10 n.m n.m
n.m – not measured
a- (You, et al., 2017a) (L/F = 4 L kg-1, 155°C, 68 min, 12% SO2)
b- (Iakovlev & van Heiningen, 2012b) (L/F = 4.8 L kg-1, 135°C, 80 min, 12% SO2)
c- (Iakovlev & van Heiningen, 2012b) (L/F = 6 L kg-1, 135°C, 80 min, 12% SO2)
d,e- (Yamamoto, et al., 2014b) (L/F = 6 L kg-1, 150°C, 30 min, 12% SO2)
f,g- (Sklavounos, et al., 2013a) (L/F = 3 L kg-1, 150°C, 30 min, 12% SO2)
Table 8.1 also shows the amount of sulfur in the precipitated lignin. About same amount of sulfur (0.10%
odf) is found in methanol, ethanol and isopropanol precipitated lignins and their S/C9 values are also nearly identical
(~0.09). Again, this confirms that degree of lignin sulfonation is independent of the solvent used. Iakovlev and van
Heiningen (2012) report that highly sulfonated lignin is preferentially dissolved in SEW fractionation but the S/C9
values of the current SCS precipitated lignin is two times smaller than its corresponding residual lignin (0.09 vs 0.18).
It means that dissolved lignin is composed of highly sulfonated and less sulfonated lignin and the sulfur lean lignin
get precipitated upon solvent removal. Therefore, the lignin is not evenly sulfonated in SAW fractionation. This agrees
with earlier studies on SEW fractionation of different biomass species including SCS (Iakovlev & van Heiningen,
2012b; Sixta, et al., 2013; You, et al., 2017a). However, nearly same S/C9 for pulp and precipitated lignin reported
by You et al. (2017a) seems doubtful based on this analysis. The consumption of sulfur by lignin (residual +
precipitated) in three solvent systems is same indicating that the choice of solvent in SAW fractionation does not affect
the SO2 recovery process. The cooking liquor in SCS fractionation has a high initial concentration of SO2, (~125 g L-
1) but sulfonation degree is low for each system. It indicates that only small amount of SO2 is consumed in the

96
fractionation process and the rest can be recovered by distillation as suggested by Iakovlev and van Heiningen (2012b)
and You et al. (2017a).
The high residual lignin in pulps of biomass other than SCS is also seen in Table 8.1, indicating that SCS
lignin is more easily removed than wood species. The amount of sulfur in the pulp based on original feedstock is high
for SW biomass (Table 8.1). However, the corresponding amounts in pulps from other species including SCS are one
order of magnitude smaller (% odf). Yamamoto et al. (2014b) attributes this to high inorganics (especially sulfur) in
the original feedstock. The SW and HW biomass used in Yamamomo et al. (2014b) had 0.03 and 0.01 (%odf) sulfur
respectively. SCS used in the current study has high sulfur content (0.06%) but the amount of sulfur in SEW pulp is
0.04% similar to spruce and HW pulps. Therefore, the initial amount of sulfur in feedstock may change the sulfur
content of pulp but it does not significantly affect the lignin sulfonation.
The effect of fractionation temperature on degree of lignin sulfonation is shown in Table 8.2. The S/C9 values
for SMW, SEW and SPW pulp lignin are the same irrespective the temperature and fractionation system (within
experimental error). Comparison with the results obtained in other SEW studies (Table 8.1) show that the type of
feedstock and severity of fractionation have only minor influence on the S/C9 ratio (values of about 0.1-0.2). However,
these values are smaller than those obtained in acid sulfite process (S/C9 of 0.34 for pulp) which confirms that the
absence of bisulfite anions in SMW, SEW and SPW fractionation process leads to a much lower lignin sulfonation
degree (Iakovlev & van Heiningen, 2012b).
Table 8.2: Temperature effect on lignin sulfonation
Temperature Lignin Sulfur in pulp
°C %odf %odf S/C9
SMW 145 2.82 0.07 0.16
155 2.67 0.07 0.17
SEW 145 1.58 0.05 0.19
155 1.16 0.03 0.19
SPW 145 1.25 0.04 0.20
155 1.03 0.03 0.19
8.4 Molecular weight distribution of SAW lignin
The physiochemical properties of lignin are very important in polymer product development. The molecular
weight of lignin is a key parameter that affects its physiochemical properties. The data from Figure 8.4 and Table 8.3
suggest that SAW lignin possess characteristics of many other organosolv lignins and therefore may find applications
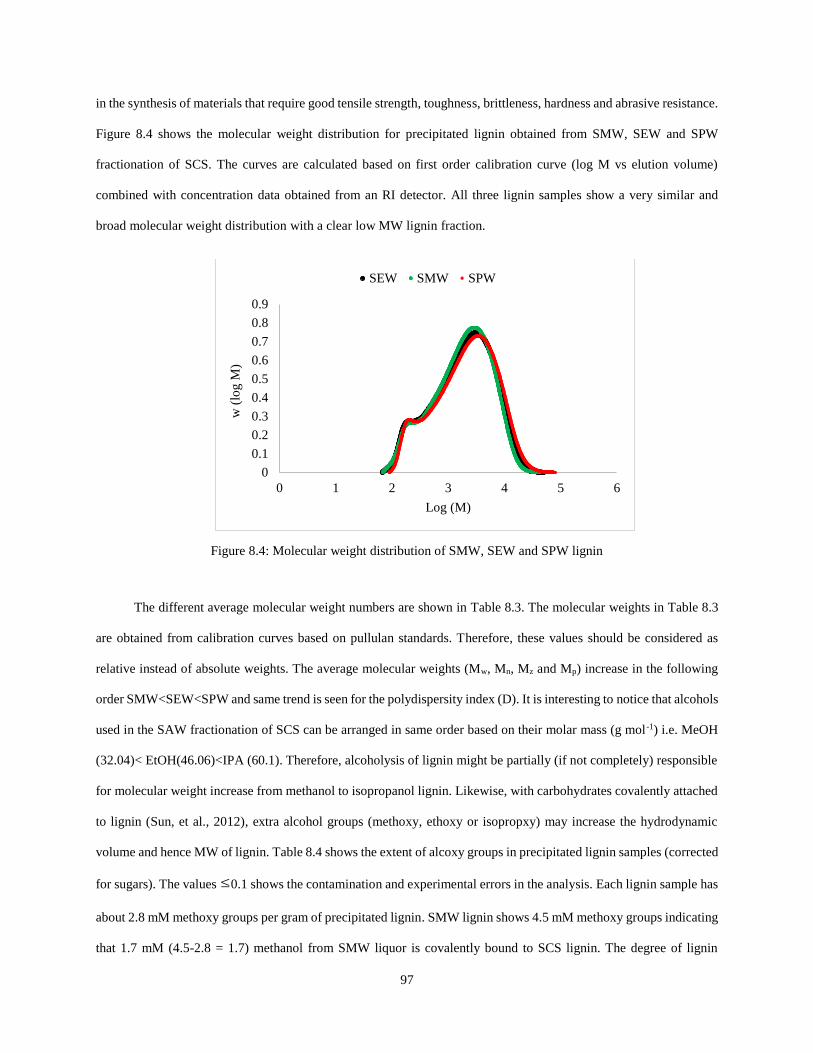
97
in the synthesis of materials that require good tensile strength, toughness, brittleness, hardness and abrasive resistance.
Figure 8.4 shows the molecular weight distribution for precipitated lignin obtained from SMW, SEW and SPW
fractionation of SCS. The curves are calculated based on first order calibration curve (log M vs elution volume)
combined with concentration data obtained from an RI detector. All three lignin samples show a very similar and
broad molecular weight distribution with a clear low MW lignin fraction.
Figure 8.4: Molecular weight distribution of SMW, SEW and SPW lignin
The different average molecular weight numbers are shown in Table 8.3. The molecular weights in Table 8.3
are obtained from calibration curves based on pullulan standards. Therefore, these values should be considered as
relative instead of absolute weights. The average molecular weights (Mw, Mn, Mz and Mp) increase in the following
order SMW<SEW<SPW and same trend is seen for the polydispersity index (D). It is interesting to notice that alcohols
used in the SAW fractionation of SCS can be arranged in same order based on their molar mass (g mol-1) i.e. MeOH
(32.04)< EtOH(46.06)<IPA (60.1). Therefore, alcoholysis of lignin might be partially (if not completely) responsible
for molecular weight increase from methanol to isopropanol lignin. Likewise, with carbohydrates covalently attached
to lignin (Sun, et al., 2012), extra alcohol groups (methoxy, ethoxy or isopropxy) may increase the hydrodynamic
volume and hence MW of lignin. Table 8.4 shows the extent of alcoxy groups in precipitated lignin samples (corrected
for sugars). The values ≤0.1 shows the contamination and experimental errors in the analysis. Each lignin sample has
about 2.8 mM methoxy groups per gram of precipitated lignin. SMW lignin shows 4.5 mM methoxy groups indicating
that 1.7 mM (4.5-2.8 = 1.7) methanol from SMW liquor is covalently bound to SCS lignin. The degree of lignin
0
0.1
0.2
0.3
0.4
0.5
0.6
0.7
0.8
0.9
0 1 2 3 4 5 6
w (
log M
)
Log (M)
SEW SMW SPW

98
alcoxylation for SPW is lower than SMW but higher than SEW {SEW (0.9)<SPW (1.1)<SMW (1.7)} therefore higher
Mw for SPW lignin is plausible. Sulfonation also changes the MW (Fredheim, et al., 2003) but same degree of
sulfonation is seen for the three lignins (see Table 8.1). Therefore, difference in MW of SMW, SEW and SPW lignin
because of sulfonation is not convincing.
Table 8.3: Average molecular weights and polydispersity of SAW lignin
g mol-1 SMW SEW SPW
Mn 798±20 868±57 912±0
Mw 2807±351 3368±122 3831±16
Mz 5994±903 7559±402 9447±69
D (Mw/Mn) 3.5±0.4 3.9±0.1 4.2±0.0
Mp 2091±195 2368±58 2561±21
Table 8.4: Alcoxy groups in precipitated lignin (mM/g lignin)
Lignin/Alcoxy group Methoxy Ethoxy Isopropoxy
SMW 4.5+0.1 0.0+0.0 0.1+0.0
SEW 2.9+0.1 0.9+0.0 0.1+0.0
SPW 2.7+0.1 0.0+0.0 1.1+0.1
Determined using HS-ID GC-MS method (Sumerskii, et al., 2017)
The weight average molecular weight (Mw) of SMW, SEW and SPW lignin is within the range (500-4000) of
organosolv lignins in contrast to lignosulfonates which have one order of magnitude higher Mw (20,000-50,000)
(Espinoza-Acosta, et al., 2016). The high Mw of lignosulfonates is attributed to their high sulfur content (5%) as
described by Espinoza-Acosta et al. (2016) while this is significantly lower for SAW lignins (0.1%). Polydispersity
index values of SAW lignins are also similar to organosolv lignin (1.3-4.0) (Delmas, et al., 2011; Espinoza-Acosta,
et al., 2016). A comparatively high Mw (5715) and plausible polydispersity (2.96) are reported for organosolv lignin
obtained from Miscanthus when treated with ethanol (50%) and H2SO4 (0.5% w/w) at 150°C for 60 minutes (Obama,
et al., 2012). In contrast, She et al. (2012) reports low values of Mw (1248-1462) for lignins obtained from organosolv
treatment of rice straw with methanol, ethanol, n-propanol, and butanol at low temperature treatment (75°C, 3 h, L/F
= 25). No clear correlation between MW of wheat straw lignin and the employed solvent is seen in that study. It is
anticipated that no lignin alcoxylation occurs at low temperature treatment. Tolbert et al. (2014) relates all these
differences to physiochemical properties of the lignin that depend on biomass source, pretreatment conditions and
separation method.

99
8.5 2D HSQC NMR analysis of precipitated lignin
The three precipitated SAW lignin samples were analyzed by NMR to identify the structural modifications in
SCS lignin when subjected to SAW fractionation using methanol, ethanol and isopropanol. The HSQC spectra for
SMW, SEW and SPW lignin were acquired in edited mode to get information about different carbon types. The final
HSQC spectra for SMW, SEW and SPW lignin are shown in Figure 8.5, 8.6 and 8.7 respectively. In the HSQC plots
CH +CH3 carbons are shown in blue while CH2 is in red. Lignin and carbohydrates correlation assignments based on
the earlier literature (Rencoret, et al., 2011; She, et al., 2012; Bauer, et al., 2012; Santos, et al., 2015; Lancefield, et
al., 2017) are shown in Table 8.5 and Table 8.6 respectively. The HSQC 2D NMR spectra show three regions
corresponding to aliphatic (δC/δH 10-50/0.5-3.0 ppm), side chain (oxygenated aliphatic) and sugar anomerics (δC/δH
50-110/3.0-5.8 ppm) and aromatic/olefinic 13C-1H (δC/δH 90-150/5.5-8.0 ppm) correlations for SMW, SEW and SPW
lignins. The aliphatic region shows high intensities of a wide variety of saturated aliphatic moieties. Strong signals
observed in the aliphatic region (δH 0.8 and 1.2-1.3) are assigned to extractives, mainly of lipid nature in accordance
with earlier literature (Balakshin, et al., 2003; Martin-Sampedro, et al., 2011). For SEW and SPW lignins, signals at
1.0-1.2 ppm correspond to alcoholic groups (i.e. ethoxy or iso-propoxy) introduced by lignin reaction with employed
alcohol in the SCS fractionation process confirmed by HMBC and HSQC-TOCSY experiments.

100
Figure 8.5: 2D-HSQC spectrum of SMW lignin from SCS fractionation
Figure 8.6: 2D-HSQC spectrum of SEW lignin from SCS fractionation

101
Figure 8.7: 2D-HSQC spectrum of SPW lignin from SCS fractionation

102
Table 8.5: Assignments of the lignin 13C-1H correlation signals in the HSQC spectra of SAW lignin from SCS
Labels δC/δH ppm Assignment
Cß 53.5/3.46 Cß-Hß in phenylcoumaran substructures (C)
Bß 55.0/3.05 Cß-Hß in resinol substructures (B)
-OMe 55.9/3.73 C-H in methoxyls
Aγ/A′γ 59.3/3.46 and 3.70 Cγ-Hγ in ß-O-4 substructures (A/A′)
Cγ 62.5/3.72 Cγ-Hγ in phenylcoumaran substructures (C)
A-OEt 63.6/3.32 C-H in α-OEt ß-O-4 substructures A′
Bγ 71.0/3.83 and 4.19 Cγ-Hγ in resinol substructures (B)
Aα 71.1/4.88 Cα-Hα in ß-O-4 substructures (A)
A′α 79.9/4.61 and 81.2/4.76 Cα-Hα in ß-O-4 substructures (A′)
A′ß(G) 82.1/4.39 and 83.1/4.30 Cß-Hß in ß-O-4 linked to G units (A′)
Aß(G) 83.5/4.28 Cß-Hß in ß-O-4 linked to G units (A)
A′ß(S) 84.4/4.20 and 84.6/4.11 Cß-Hß in ß-O-4 linked to S units (A′)
Bα 84.2/4.7 Cα-Hα in resinol substructures (B)
Aß(S) 85.8/4.11 Cß-Hß in ß-O-4 linked to S units (A)
Cα 86.8/5.53 Cα-Hα in phenylcoumaran substructures (C)
S2,6 103.8/6.7 C2,6-H2,6 in etherified syringyl units (S)
S′2,6 104.2/7.37 C2,6-H2,6 in oxidized (Cα = O) phenolic syringyl units (S′)
S′′2,6 104.5/7.03 C2,6-H2,6 in oxidized (CαOOH) phenolic syringyl units (S′′)
G2 110.8/6.96 C2-H2 in guaiacyl units (G)
H3,5 115.2/6.74 C3,5-H3,5 in p-hydroxyphenyl units (H)
FE2 110.8/7.30 C2-H2 in ferulic ester (FE)
G5 115.5/6.84 C5-H5 in guaiacyl units (G)
G6 119.0/6.77 C6-H6 in guaiacyl units (G)
FE6 122.4/7.09 C6-H6 in ferulic ester (FE)
H2,6 129.7/7.02 C2,6-H2,6 in p-hydroxyphenyl units (H)
pCE2,6 129.82/7.48 C2,6-H2,6 in p-coumaroylated substructures (A′′)
pCEα 144.1/7.47 Cα-Hα in p-coumaroylated substructures (A′′)
Assignments are based on (Rencoret, et al., 2011; She, et al., 2012; Bauer, et al., 2012; Santos, et al., 2015;
Lancefield, et al., 2017)
In the side chain region, methoxylated lignin (-OMe) was prominent and detected at δC/δH 55.9/3.73 ppm.
Different interunit linkages present in SAW lignin and carbohydrates were also observed in this region. The
carbohydrates were distinct in two differentiated regions of the spectra: side chain region and anomeric carbohydrates
region. All spectra showed prominent signals for ß-O-4 ether units (substructure A, see Figure 8.8). The Cα-Hα, Cß-
Hß and Cγ-Hγ correlations in in ß-O-4 substructures were seen at δC/δH 71.1/4.88 ppm, δC/δH 83.4-85.9/4.10-4.29 ppm
and δC/δH 59.3/3.46-3.70 ppm respectively. However, these Cß-Hß, correlations showed overlapping signals for
structures linked to G or S lignin units. Likewise, Cγ-Hγ in ß-O-4 substructure overlapped with other signals. Some
additional α-ethoxylated ß-O-4 substructures (A′) were also seen in SEW lignin samples by comparing its 13C-1H

103
correlations with recent literature (Bauer, et al., 2012; Lancefield, et al., 2017). The Cα-Hα correlations for this
substructure were detected at δC/δH 79.9/4.61 and δC/δH 81.2/4.76 ppm. Bauer et al. (2012) showed that Cß-Hß
correlations for α-ethoxylated ß-O-4 substructures appeared at δC/δH 82.1/4.39 ppm and δC/δH 83.1/4.30 ppm when
linked to G lignin units while the corresponding chemical shifts for S units were 84.4/4.20 and 84.6/4.11 ppm. No
change in chemical shift for Cγ-Hγ correlations was reported when ß-O-4 substructures were ethoxylated at the α-
position (Bauer, et al., 2012). No signals were detected for Cß-Hß correlations for α-ethoxylated ß-O-4 substructures
when linked to S units however, low intensity cross peaks could be found for G units. The signals for CH2 in α-OEt
ß-O-4 substructures A′(δC/δH 63.6/3.32) could overlap with X5 signals (δC/δH 63.2/3.26 and 3.95 ppm) in ß-O-4-
xylopyranoside (see Figure 8.6). Therefore, a clear distinction was not possible. However, current analysis and
comparison with earlier findings show that SCS lignin has undergone some degree of ethoxylation during SEW
fractionation as three different types of ethoxy groups were identified in SEW lignin. Ether type ethoxy groups were
found at 63.8/3.30-3.50 ppm as well as at 14.8/1.10 ppm. These linkages are most likely α-OEt ß-O-4. Other ether
type ethoxy groups were seen at chemical shift of 62.4/3.60-3.75 and 14.8/1.10 ppm. Ester-type ethoxy groups
appeared at 59.5-60.2/4.0-4.15 and 13.7/1.10-1.20 ppm. SPW lignin also showed signals for two different type of
linkages with isopropoxy groups. These linkages were ether (69.3/3.80 ppm and 23.2/1.10 ppm) and ester (67.4/4.90
ppm and 21.4/1.10 ppm) type. Therefore, alcoholysis reactions are certain when biomass is treated with alcohols (i.e.
methanol, ethanol, isopropanol) in acidic media. The hydroiodic acid cleavage quantification of methoxy, ethoxy and
isopropoxy groups in SMW, SEW and SPW lignin samples also supports this argument (see Table 8.4). However, it
was hard to confirm alcoxy linkages with HMBC as well as HSQC-TOCSY as sugars obscured the signals from lignin
side chains.

104
Figure 8.8: Typical structures of identified aromatic units in SAW lignin [structures adapted from (She, et al., 2012;
Santos, et al., 2015)]
Besides the major ß-O-4 substructures, other linkages such as ß-ß (B, resinol) and ß-5′(C, phenylcoumaran)
were also found in the side chain region of all lignin samples (model compounds shown in Figure 8.8 ). The Cα-Hα
and Cß-Hß correlations for resinol (B) were observed at δC/δH 84.2/4.7 ppm and 55.0/3.05 ppm respectively however

105
no signals were detected for Cγ-Hγ at δC/δH 71.0/3.83 and 4.19. Similarly signals at 86.8/5.53, 53.5/3.46 and 62.5/3.72
ppm corresponded to Cα-Hα, Cß-Hß and Cγ-Hγ correlations in phenycoumaran (C) substructures. B substructures were
relatively low in comparison to C substructures as shown by low intensity of their corresponding signals for Cα-Hα.
The Cß-Hß and Cγ-Hγ correlations for these structures were difficult to compare because of the overlapping signals
with other structures. It proves that ß-ß and ß-5′linkages remain stable in SAW fractionation of SCS and solvent has
no apparent effect on these linkages.
All the lignin samples also contained sugars that are shown as cross peak signals in the δC/δH 67-75/3.0-3.8
ppm region. The C-H correlations for anomeric carbohydrate were reflected by δC/δH signals in the 90-110/4.0-5.5
region as shown in Table 8.6. No signals were detected for anomeric (14)-ß-D-galactopyranoside and (14)-ß-D-
glucopyranoside in this region. The SMW lignin was different because it showed cross peaks for (14)-ß-D-
mannopyranoside (M1 at δC/δH 101.2/4.69) that was absent in SEW and SPW lignin samples. The SEW lignin was
different from the SPW in respect of α-L-Arabinofuranoside (T) (Ar1(T) at δC/δH 108.3/4.91) cross peaks appearing in
SMW and SEW samples only. No 13C-1H cross peaks were identified for α-L-Arabinofuranoside (Ar1 at δC/δH
107.3/5.05 ppm) for any of the lignin samples. The presence of carbohydrates especially xylan in SAW lignins shows
that a certain proportion of carbohydrates was removed as lignin carbohydrate complex (LCC) in SAW fractionation
of SCS.

106
Table 8.6 Assignments of the carbohydrates 13C-1H correlation signals in the HSQC spectra of SAW lignin from SCS
Labels δC/δH ppm Assignments
αX1(R) 92.5/5.02 α-D-xylopyranoside (R) [α-D-Glucopyranoside (R)]
ßX1(R) 97.7/4.39 ß-D-xylopyranoside (R) [ß-D-Glucoopyranoside (R)]
U1 97.7/5.32 4-O-Methyl-α-D-GlcUA
M′1 99.1/4.78 2-O-Acetyl-ß-D-mannopyranoside
X′1 99.8/4.58 2-O-Acetyl-ß-D-xylopyranoside
M1 101.2/4.69 (14)- ß-D-mannopyranoside
Gl1 103.3/4.41 (14)- ß-D-glucopyranoside
Ga1 105.6/4.40 (14)- ß-D-galactopyranoside
Ar1 107.3/5.05 α-L-Arabinofuranoside
Ar1(T) 108.3/4.91 α-L-Arabinofuranoside (T)
(R)- Reducing end; (T)- Terminal (non-reducing) end
Assignment are based on Rencoret et al., 2011
In the HSQC spectra of SWM, SEW and SPW lignin, the main signals at δC/δH 100-150/6.0-8.0 corresponded
to aromatic ring based lignin units. In all three lignin samples tricin could be detected. The chemical shifts of 94.0/6.1
and 98/4.2 ppm in Figure 8.5-8.7 corresponded to these structures. The S lignin units showed a dominant signal for
C2,6–H2,6 correlations at 103.8/6.7 ppm. The overlapping signals for oxidized C2,6–H2,6 syringyl units (S′ and S′′) were
observed at 104.5/7.32 and 104.5/7.03 ppm. The G units gave different correlations for C2-H2 (δC/δH 110.8/6.96 ppm),
C5-H5 (δC/δH 115.5/6.84 ppm) and C6-H6 (δC/δH 119/6.77 ppm). Cross peaks for p-hydroxyphenyl units (H) were also
detected in the HSQC spectra at 115.2/6.74 ppm and 129.7/7.02 ppm corresponding to C3,5-H3,5 and C2,6-H2,6
correlations respectively. The C2,6-H2,6 signals of H units were partially overlapped with esterified p-coumarates (pCE)
signals that had C2,6-H2,6 correlations at δC/δH 129.8/7.48 ppm. Besides the p-coumarates, ferulates ester (FE) were
also found in SAW lignin. Two different peaks at 110.8/7.30 ppm and 122.4/7.09 belonged to 2-position and 6-position
in ferulic ester (FE) respectively. The presence of ferulates (FE) and p-coumarates (pCE) in SCS suggests the
association of lignin with polysaccharides through these linkages (Kim & Ralph, 2010). These linkages typically
acylate arabinoxylans in grasses with higher degree of acylation with ferulates (Lam, et al., 2001; Kim & Ralph, 2010).
She et al. (2012) suggests that ferulates are also involved in lignification, cross linking with lignin monomers and
oligomers. The presence of FE and pCE in SAW precipitated lignin samples again confirms that a certain portion of
lignin is removed as LCC in the SAW fractionation process.

107
8.6 Conclusions
SCS lignin is easily separated from SAW spent liquor because its low degree of sulfonation renders the lignin
insoluble in a more aqueous environment after alcohol evaporation and wash water addition. Despite the high initial
concentration of SO2, (~125 g L-1) in the cooking liquors, sulfonation degree is low for SMW, SEW and SPW
fractionation systems. The degree of sulfonation (S/C9) of residual lignin is also low (0.1-0.2) in comparison to the
AS process (S/C9 = 0.34) and this agrees with earlier studies on SEW fractionation of different species. The use of
methanol, ethanol or isopropanol in SAW pulping leads to the same degree of lignin sulfonation. However less lignin
dissolves in SMW because of the poorer solubility of sulfonated lignin in this liquor. The fractionation temperature
does not affect the lignin sulfonation. Moreover, the amount of sulfur in feedstock material hardly change the degree
of sulfonation. The MWD of SAW lignin shows that it has characteristics like many other organosolv lignins with a
Mw of ~3000 g mol-1 and polydispersity index of ~4.0. The SEW and SPW lignins have slightly higher MW’s than
SMW lignin, possibly because of lignin alcoholysis in acidic media in accordance with the recent literature. The HSQC
spectra of precipitated SAW lignins show that it contain different ether-type and ester-type covalently bound alcoxy
groups. The HSQC-NMR spectra and quantification of alcoxy groups by hydroiodic acid cleavage confirm lignin
alcoholysis reactions in SAW fractionation of SCS. However, we do not have absolute remarks regarding alcoxy cross
linkages with lignin side chains as these signals are obscured by sugars in HMBC or HSQC-TOCSY spectra. Some
sugars, ferulates esters and esterified p-coumarates are present in precipitated SAW lignin samples, a typical
characteristic of grass and straw lignins. It indicates that some lignin is removed as LCC in SAW fractionation of SCS
retaining the linkages between lignin and carbohydrates present in native lignin.

108
Chapter 9
9. CONCLUSIONS AND RECOMMENDATIONS
The SO2-Alcohol-Water (SAW) process was evaluated in terms of solvent effects on sugarcane straw (SCS)
fractionation. The fractionation experiments were conducted using methanol, ethanol or isopropanol in a cooking
liquor of fixed composition (SO2:Alcohol:Water = 12:44:44 w/w%) and liquor to feedstock ratio (4 L kg-1). SCS was
successfully fractionated into cellulosic pulp, dissolved hemicelluloses and lignin using either of the solvents.
Delignification kinetics were developed by correcting Klason lignin for acid insoluble ash and permanganate non-
oxidizable material. SCS delignification kinetics can be described by three phases; initial, bulk and residual. About
50-60% lignin was removed in the initial phase. The bulk delignification was pseudo 1st order in lignin, while the
residual phase showed very slow delignification like wood species. In terms of delignification, isopropanol showed
the most promising results because of its higher lignin dissolution characteristics. The delignification rate constants
for ethanol at each temperature (135, 145 and 155°C) were close to that of isopropanol, while methanol resulted in
slower delignification. The delignification activation energy data indicated that temperature had a more pronounced
effect with ethanol and isopropanol (Ea = 60-65 kJ mol-1) than with methanol (Ea = 35 kJ mol-1). Overall the bulk
delignification rate constants for present SEW fractionation system were lower in comparison to wood species (spruce
and beech) and this was attributed to decreased effective acidity because of the high inorganics content of SCS (6.1%).
Xylan was the most abundant hemicellulose found in SCS (21.2%) and its removal proceeded in two phases;
initial and bulk phase. About 50% xylan was removed in the initial phase most probably in the form as lignin
carbohydrate complex (LCC). The bulk xylan removal phase followed pseudo 1st order kinetics for each solvent
system. The xylan removal rate was the lowest with isopropanol at low temperature (135°) in comparison to methanol
and ethanol. However, at higher temperatures (145, 155°) the rate difference became negligible leading to
comparatively high activation energy for the isopropanol system. This could be explained by high increase in proton
activity with temperature and less polar solvents i.e. isopropanol. Also, the delignification vs xylan removal selectivity
decreased with increasing temperature for each solvent system. Therefore, the process temperature affects the product
properties.
Although cellulose was almost completely retained in the solid phase, it underwent hydrolysis as indicated by
its decrease in degree of polymerization. Ethanol and isopropanol pulps showed a sharp decrease in intrinsic viscosity

109
at kappa number around 25, while the same trend was observed at much higher lignin content for methanol pulps
(kappa ~45). The slow hydrolysis in the first phase was attributed to lignin and carbohydrates providing a protective
barrier reducing cellulose accessibility. It was concluded that cellulose hydrolysis was more influenced by
hemicellulose removal than delignification. Cellulose hydrolysis followed zero order kinetics, and the rate constants
for cellulose hydrolysis at different temperatures (i.e. their activation energies) showed a trend very similar to the
xylan removal kinetic parameters. The activation energy for cellulose hydrolysis was highest with isopropanol (130
kJ mol-1) in comparison to methanol and ethanol (80 kJ mol-1) and it was explained by increased hydronium ion
activity with temperature and isopropanol. The selectivity of delignification vs cellulose hydrolysis was highest for
isopropanol at low temperature. Therefore, isopropanol was recommended as the most suitable solvent to produce
high viscosity and low lignin content pulp especially at lower temperatures. High viscosity pulp could also be produced
using ethanol but with comparatively less selectivity. The use of methanol for paper grade pulp production was not
suggested as lower viscosity (<900 mL g-1) was observed even at high kappa number values (~45).
The spent liquors produced from SMW, SEW and SPW fractionation of SCS were composed of dissolved
lignin, monomeric and oligomeric sugars and alkyl pyranosides. Carbohydrates oxidation, dehydration and
degradation products were insignificant in the spent liquor streams. The product distribution was highly dependent on
the severity of fractionation designated as CSF. The highest concentration of total carbohydrates in the spent liquors
(27.5% w/w SCS or 60 g L-1) was obtained at CSF of 2.4±0.1 (145°C, 100-120 min and/or 155°C, 60 min). It was
recommended to stop the fractionation at CSF of 2.4±0.1 because at higher severity carbohydrates degradation
reactions resulted in decreased dissolved sugars yield. The maximum level of monomeric sugars in SMW, SEW and
SPW spent liquors were 20.8±0.7, 31.1±1.7 and 37.0±0.5 g L-1 respectively. This represented 36%, 54% and 64% of
the total sugars in the respective spent liquors. The spent liquors were analyzed for alkyl xylosides being the most
prominent alkyl pyranosides in SMW, SEW and SPW spent liquors. The maximum concentrations of alkyl xylosides
and monomeric xylose were also found at same CSF (2.4±0.1) indicating that they are in equilibrium at the
fractionation operating conditions. The concentration of monomeric xylose in SPW and SEW spent liquor were 3.0
and 1.9 times more than respective alkyl xylosides. On the other hand, SMW spent liquor contained 1.4 times more
methyl xylosides than monomeric xylose. In view of these results it was suggested that SMW fractionation process
could generate a high yield byproduct i.e. methyl xylosides. However, the pulp obtained would not be suitable for

110
paper production because of its low viscosity and high lignin content (η~850 with kappa 45 or η ~500 with kappa 36)
instead it might be further hydrolyzed for biofuel production.
SEW and SPW spent liquors were further subjected to heat treatment after alcohol and SO2 evaporation to
recover chemically bound xylose and alcohol from alkyl xylosides. The kinetics of alkyl xylosides hydrolysis showed
that the ethyl xylosides (EX, sum of alpha and beta) and isopropyl xylosides (PX, sum of alpha and beta) were
completely hydrolyzed to xylose and respective alcohols at each temperature (100, 110, 121°C). At 121°C, PX and
EX were completely hydrolyzed in about 30 and 70 minutes respectively while hydrolysis was slower at 100 and 110
°C. The hydrolysis of alkyl xylosides was performed without addition of any mineral acid as the acidity provided by
lignosulfonic acids formed during fractionation was sufficient for alkyl xylosides hydrolysis. The rates of alkyl
xylosides hydrolysis and activation energy were higher for PX in comparison to EX. The alkyl xylosides hydrolysis
rate constants for PX were 1.3 times and 3.8 times higher than corresponding EX rate constants at 100°C and 121°C
respectively. In both cases, alkyl xylosides hydrolysis followed 1st order kinetics with activation energies of 66 and
130.7 kJ mol-1 for EX and PX respectively. The hydrolysis was much faster at high temperature treatment (121°C) but
it also promoted xylose dehydration to furfural. Therefore, low temperature treatment (100, 110°C) of spent liquor
was recommended for alkyl xylosides hydrolysis. More alcohol (ethanol or isopropanol) was obtained than the
stoichiometric from hydrolysis of the respective alkyl xylosides. It was suggested that hydrolysis of alkyl pyranosides
of non-xylose sugars (mostly glucose) and some lignin de-etherification were responsible for the excess alcohol
release.
Lignin analysis revealed that only a small amount of sulfur was consumed in SAW fractionation of SCS for each
solvent system indicating the potential of nearly complete recovery of SO2. The same degree of sulfonation was found
for residual lignin (in pulp) and precipitated (from spent liquor) lignin for the methanol, ethanol and isopropanol
systems. Therefore, lignin sulfonation is not affected by the nature of the solvent, but the high residual content of
methanol pulps suggests that lignin dissolution is highly affected by solvent solubility properties. The molecular
weight distribution (MWD) curves of SCS lignin precipitated after SMW, SEW or SPW fractionation showed, like
many other organosolv lignins, a Mw of ~3000 g mol-1 and polydiversity index of ~4.0. However, SEW and SPW
lignins showed a slightly higher MW’s than SMW lignin that was attributed to lignin alcoholysis in acidic media in
accordance with the recent literature. An effort was made to identify extra alcoxy groups in SAW lignin through 2D

111
NMR analysis. Lignin alcoholysis was confirmed by identifying different types (ether and ester) of alcoxy linkages in
HSQC spectra of precipitated lignin samples. The hydroiodic acid cleavage quantification of methoxy, ethoxy and
isopropoxy groups also supported the lignin alcoholysis argument. However, no absolute conclusions were possible
regarding alcoxy group linked to lignin side chains because of interfering signals from sugars in HMBC or HSQC-
TOCSY spectra. 2D HSQC spectra also indicated the presence of remaining sugars, ferulates esters and esterified p-
coumarates in SMW, SEW and SPW lignin samples. It confirmed that some lignin was removed as LCC in SAW
fractionation of SCS.
High mass losses (65-160 %SCS) were observed while handling fractionated SCS in open containers. These
losses mostly resulted from escaping SO2 and highly volatile solvent used in the fractionation process. Therefore, it is
suggested to perform all washings and handlings in closed vessels to prevent evaporative losses. Also, SAW
fractionation appears to be well suited for biofuel productions (ABE or IBE) where solid residues (containing residual
solvent) and spent liquor would be enzymatically hydrolyzed to produce biofuel. Another important recommendation
is to heat treat the evaporated spent liquor stream to hydrolyze the solvent pyranosides as well as the solvent
etherified/esterified lignin, In that case, the solid residue stream (rich in cellulose) would be utilized to produce
biofuel/solvent and the spent liquor stream, rich in xylose, would be directed towards synthesis of xylose based
products such as xylitol. The lignin produced in SAW fractionation process had properties similar to the lignin
produced from other organosolv process and could find applications in the production of adhesives and high strength
materials. However, further research would be required in this area.

112
10. REFERENCES
Aberuagba, F.(1997) The kinetics of acid hydrolysis of wastes cellulose from maize cobs and groundnut shells. In:
Proceedings of the 27th annual conference of the Nigerian Society of Chemical Engineers, pp. 15-18.
Achyuthan, K.E., Achyuthan, A.M., Adams, P.D., Dirk, S.M., Harper, J.C., Simmons, B.A., Singh, A.K. (2010)
Supramolecular self-assembled chaos: Polyphenolic lignin's barrier to cost effective lignocellulosic biofuels.
Molecules 15: 8641-8688.
Agbogbo, F.K., Coward-Kelly, G. (2008) Cellulosic ethanol production using the naturally occuring xylose-
fermenting yeast, Pichia stipitis. Biotechnol. Lett. 30:1515-1524.
Ajani, A.O., Agarry, S.E., Agbede, O.O. (2011) A comparative study of acidic hydrolysis of wastes cellulose from
agriculture derived biomass. J. Appl. Sci. Environ. Manage. 15:531-537.
Akhtar, M., Blanchette, R.A., Myers, G., Kirk, T.K. An overview of biomechanical pulping. Wiley, New York, 1998.
Alder, E. (1977) Lignin chemistry: Past, present and future. Wood Sci. Technol. 11:169-218.
Alén, R. (2000) Structure and chemical composition of wood. In: Forest Products Chemistry. Eds. P. Stenius. Fapet
Oy, Jyväskylä. pp. 11-57.
Alén, R. (2011) Structure and chemical composition of biomass feedstocks. In: Biorefining of Forest Resources. Eds.
P. Stenius. Paper Engineer's Association, Helsinki. pp. 17-54.
Azad, M.A.K., Islam, M.S., Amin, L. (2014) Straw Availability, Quality, Recovery, and Energy Use of Sugarcane. In:
Biomass and Bioenergy. Eds. Hakeem, K.R., Jawaid, M., Rashid, U. Springer International Publishing, Swizerland.
pp. 275-287.
Aziz, S., Sarkanen, K. (1989) Organosolv pulping - a review. Tappi J. 72:169-175.
Bajpai, P. (2012) Brief Description of the Pulp and Paper Making Process. In: Biotechnology for Pulp and Paper
Processing. Springer, Patiala. pp. 7-13.
Balakshin, M.Y., Capanema, E.A., Chen, L., Gracz, H. S. (2003) Eclucidation of the structures of residual and
dissolved pine kraft lignins using an HMQC NMR technique. J. Agric. Food Chem. 51:6116-6127.
Bartuska, V.J., Maciel, G.E., Bolker, H.I., Flemin, B.I. (1980) Structural studies of lignin isolation procedures by
carbon-13 NMR. Holzforschung 34:214-217.
Baucher, M., Monties, B., Montagu, M.V., Boerjan, W. (1998) Biosynthesis and genetic engineering of lignin. Crit.
Rev. Plant Sci. 17:125-197.
Bauer, S., Sorek, H., Mitchell, V.D., Ibanez, A.B., Wemmer, D.E. (2012) Characterization of Micanthus giganteus
lignin isolated by ethanol organosolv process under reflux conditions. Agric. Food. Chem. 60:8203-8212.
Biermann, Christopher, J. Handbook of Pulping and Papermaking. Academic Pulisher, San Diego, 1996b.
Bishop, C.T., Cooper, F.P. (1962) Glycosidation of sugars: Formation of methyl-D-xylosides. Can. J. Chem. 40:224-
232.

113
Bishop, C.T., Cooper, F.P. (1963) Glycosidation of Sugars II. Methanolysis of D-xylose, D-arabinose, D-lyxose and
D-ribose. Can. J. Chem . 41:2743-2758.
Biswas, R., Uellendahl, H., Ahring, B. (2013) Conversion of C6 and C5 sugars in undetoxified wet exploded bagasse
hydrolysates using Scheffersomyces (Pichia) stipitis CBS6054. AMB Express 3:p.42.
Bjorkman, A. (1954) Isolation of lignin from finely divided wood with neutral solvents. Nature 174:1057-1058.
Bjorkman, A. (1956) Studies on finely divided wood. Part 1: Extraction of lignin with neutral solvents. Papperstidn.
59:477-485.
Black, P. (1991) ASAM Alkaline sulfite pulping process shows potential for large scale application. Tappi J. 74:87-
93.
Blain, T.J. (1993) Anthraquinone pulping. Tappi J. 76:137-146.
Bublitz, W.J., Wilson, K.P. (1983) The role of methanol in methanol acid sulfite pulping process. In: Tappi Pulping
Conference Proceedings, pp. 423-427.
Buranov, A.U., Mazza, G. (2008) Lignin in straw of herbacious crops. Ind. Crop. Prod. 28:237-259.
Canilha, L., Carvalho, W., de Almeida Felipe, M. das G., de Almeida e Silva, J.B., Giulietti, M. (2010). Ethanol
production from sugarcane bagasse hydrolysate using Pichia stipitis. Appl. Biochem. Biotechnol. 161: 84-92.
Canilha, L., Chandel, A.K., Milessi, T.S. dos S, Antunes, F.A.F., Freitas, W.L. da C., Felipe, M. das G.A., da Silva,
S.S. (2012) Bioconversion of biomass into ethnaol: An overview about composition, prettreatment methods,
detoxification of hydrolysates, enzymatic saccharification, and ethnaol fermentation. Biomed. Tech. 2012:1-15.
Carvalheiro, F., Duarte, L.C., Girio, F.M. (2008) Hemicellulose biorefineries: a review on biomass pretreatments.
J.Sci.Ind.Res. 67:849-864.
Chagas, A.L.S. (2014) Socio-economic and ambient impacts of sugarcane expansion in Brazil: Effects of second
generation ethanol production. In: Biofuels in Brazil: Fundamental Aspects, Recent Developments, and Future
Perspectives. Eds. da Silva, S.S., Chandel, A.K. Springer International Publishing , Swizerland. pp. 69-83.
Chang, H., Cowling, E., Brown, W. (1975) Comparative studies on cellulolytic enzyme lignin and milled lignin of
sweetgum and spruce. Holzforschung 29:153-159.
Chovau, S., Degrauwe, D., Van der Bruggen, B. (2013) Critical analysis of techno-economic estimates for the
production cost of lignocellulosic bio-ethanol. Renew. Sust. Energ. Rev. 26:307-321.
Costa, S.M., Aguiar, A., Luz., S.M., Pessoa, A., Costa, S.A. (2015) Sugarcane straw and its cellulosic fraction as raw
materials for obtainment of textile fibers and other bioproducts. In: Polysaccharides:Biotechnology and Bioactivity.
Eds. Ramawat K.G., Merillon, J-M. Springer, Swizerland. pp. 513-533.
Costa, S.M., Mazzola, P.G., Silva, J.C.A.R., Pahlc, R., Pessoa, Jr., Costa, S.A. (2013) Use of sugarcane straw as a
source of cellulose for textile fiber production. Ind. Crop. Prod. 42:189-194.
da Silva Perez, D., van Heininen, A. (2015) Prediction of alkaline pulping yield: Equation derivation and validation.
Cellulose 22:3967-3979.

114
Davis, M.W. (1998) A rapid modified method for compositional carbohydrate analysis of lignocellulosics by high pH
anion exchange chromatography with pulsed amperiometric detection (HPAEC-PAD). J. Wood Chem. Technol.
18:235-252.
del Río, J.C., Lino, A.G., Colodette, J.L., Lima, C.F., Gutiérrez, A., Martínez, A.T., Lu, F., Ralph, J., Rencoret, J.
(2015) Differences in the chemical structure of the lignins from sugarcane bagasse and straw. Biomass Bioenerg.
81:322-338.
del Río, J.C., Marques, G., Linoa, A.G., Lima, C.F., Colodette, J.L., Gutiérrez, A. (2015) Lipophilic phytochemicals
from sugarcane bagasse and straw. Ind. Crop. Prod. 77:992-1000.
Delmas, G.H., Benjelloun-Mlayah, B., Bigot, Y.L., Delmas, M. (2011) Funtionality of wheat straw lignin extracted in
organic acidic media. J. Appl. Polym. Sci. 121:491-501.
Dietrichs, H.H., Garves, K., Behrensdorf, D., Sinner, M. (1978) Untersuchungen uberdie kohlenhydrate der rinden
einheimischer holzarten. Holzforschung 32:60-67.
Drouet, P., Zhang, M., Legoy, M.D. (1994) Enzymatic synthesis of alkyl B-D-xylosides by transxylosylation and
reverse hydrolysis. Biotechnol. Bioeng. 43:1075-1080.
Eken-Saracoglu, N., Mutlu, S., Dilmac, G., Cavusoglu, H. (1998) A comparative kinetic study of acidic hemicellulose
hydrolysis in corn cob and sunflower seed hull. Bioresour.Techol 65:29-33.
Eliashberg, M.G., Parfenova, A.I., Tikhomirova, E.V. (1955) The theory of sulfite pulping and its practical
importance. Bumazhnaya Promyshlennost 30:9-13.
Eliashberg, M.G., Parfenova, A.I., Primakov, S.F. (1960) The delignification of wood with SO2 solutions not
containing bisulfite. Trudy Leningrad. Lesotekh. Akad. im. S. M. Kirova. 91:235-245.
El-Sakhawy, M., Lonnberg, B., Ibrahim, A. A., Fahmy, Y. (1996) Organosolv pulping. 4. Kinetics of alkaline ethanol
pulping of wheat straw. Cell. Chem. Technol. 30:281-296.
Ereno, D. (2008) New techniques transform straw of sugarcane into bio-oil, siderurgical coal, silicon carbide and, in
the future, ethanol. Science and Technology in Brazil, Pesquisa FAPESP. 154:95-96.
Espinoza-Acosta, J.S., Torres-Chavez, P.I., Ramirez-Wong, B., Lopez-Saiz, C.M., Montario-Leyva, B.M. (2016)
Antioxidant, antimicrobial, and antimutagenic properties of technical lignins and their applications. Bioresources
11:5452-5481.
Evans, R., Wallis, A.F.A. (1989) Cellulose molecular weights determined by viscometry. J. Appl. Polym. Sci.
37:2331-2340.
FAO ( 2010). Gobal Forest Resources Assessment 2010: Main Report. FAO Forestory Paper. ISBN 978-92-5-106654-
6
FAO ( 2014) Global Forest Products Facts and Figures. Avaiable from http://www.fao.org/3/a-bc092e.pdf (accessed
Novermber 6, 2016).
FAO (2015). Forest Resource Assesment. ISBN 978-92-5-108826-5
Feather, M.S., Harris, J.F. (1965) The acid-catalyzed hydrolysis of glycopyranosides. J. Org. Chem. 30: 153-157.

115
Feather, M.S., Harris, J.F. (1967) Partial hydrolysis and acetolysis of cellotriose-1-C14. J. Am. Chem. Soc. 89:5661-
5664.
Fengel, D., Wegener, G. Wood - Chemistry, Ultrastructure, Reactions. Walter de Gruyter, Berlin, 1984.
Fengel, D., Wegener, G. Wood - Chemistry, Ultrastructure, Reactions. Berlin: Walter de Gruyter, Berlin, 1989.
Ferraz, A., Guerra, A., Mendonça, R., Masarin, F., Vicentin, M.P., Aguiar, A., Pavan, P.C. (2008) Technological
advances and mechanistic basis for fungal biopulping. Enzym. Microb. Tech. 43:178–185.
Foust, T.D., Ibsen, K., Dayton, D.C., Hess, J.R., Kenney, K.E. (2008) The Biorefinery. In: Biomass Recalcitrance,
Demonstrating the Cell Wall for Biorefinery. Eds. Himmel, E.D. Blackwell Publishing.
Foust, T.D., Aden, A., Dutta, A., Phillips, S. (2009) An economical and environmental comparison of a biochemical
and a thermochemical lignocellulosic ethanol conversion processes. Cellulose 16:547-565.
Fredheim, G.E., Braaten, S.M., Christensen, B.E. (2003) Comparison of molecular weight and molecular weight
distributions of softwood and hardwood lignosulfonates. J. wood Chem. Technol. 23:197-215.
Freudenberg, K. (1965) Lignins: Its constitution and formation from p-hydroxycinnamyl alcohols. Science 148: 595-
600.
Garrote, G., Parajo, J.C., Dominguez, H. (1999) Hydrothermal processing of lignocellulosic materials. Holz. Roh.
Werkst. 57:191-202.
Genco, J.M., Busayasakul, N., Medhora, H.K., Robbins, W. (1990) Hemicellulose retention during kraft pulping.
Tappi J. 73:223-233.
Ghose, T.K. (1977) Cellulase biosynthesis and hydrolysis of cellulosic substances. Adv. Biochem. Eng. 6:39-76.
Gierer, J. (1970) Reactions of lignin during pulping. Description and comparison of conventional pulping processes.
Sven. Papperstidn. 73:571-596.
Goldemberg, J. (2007) Ethanol for a Sustainable Energy Future. Science, 315:808-810.
Gómez, E.O., Souza, R.T.G., Rocha, G.J.M., Almeida, E., Cortez, L.A.B. (2010). The sugarcane trash as feedstock
for the second generation processes. In: Sugarcane Bioethanol-R&D for Productivity and Sustainability. Eds. Cortez,
L.A.B. Edgar Blaucher, Sao Paulo. pp. 636-659.
Goncalves, A.R., Benar, P., Costa, S.M. (2005) Integrated processes for use of pulps and lignins obtained from
sugarcane bagasse and straw. Appl. Biochem. Biotechnol. 5:121-124.
Goncalves, A.R., Moriya, R., Oliveira, L., Saad, M. (2008) Xylanase recycling for the economical biobleaching of
sugarcane bagasse and straw pulps. Enzym. Microb. Tech. 43:157-163.
Grisel, R., van der Waal, J., de Jong, E., Huijgen, W. (2014) Acid catalysed alcoholysis of wheat straw: Towards
second generation furan-derivatives. Catal. Today 223:3-10.
Guerra, A., Filipponen, I., Lucia, L.A., Saquing, C., Baumberger, S., Argyropoulos, D.S. (2006) Towards a better
understanding of the lignin isolation process from wood. J.Agric. Food. Chem. 54:5939-5947.
Hage, R.E., Brosse, N., Chrusciel, C., Sanchez, P., Sannigrahi, P., Ragauskas, A. (2009) Characterization of milled
wood lignin and ethanol organosolv lignin from miscanthus. Polym. Degrad. Stabil. 94:1632-1638.

116
Hägglund, E. Chemistry of Wood. Academic Press Inc., New York, 1951.
Hallen, R.T., Sealock, L.T., Cuello, R., Bridgwater, A.V. Research in thermochemical biomass conversion. Elsevier,
London, 1998.
Hergert, H.L., Van-Blarican, L.E., Steinberg, J.C., Grasy, K.R. (1965) Isolation and properties of dispersants from
Western Hemlock Bark. Forest Prod. J. 15: 485-491.
Hildebrand, J.H., Scott, R.L. The Solubility of Nonelectrolytes. Rheinhold, New York, 1950.
Himmel, M.E., Ding, S.Y., Johnson, D.K., Adney, W.S., Nimlos, M.R., Brady, J.W., Foust, T.D. (2007) Biomass
recalcitrance: Engineering plants and enzymes for biofuels productions. Science, 315:804-807.
Ho, C.-L., Wu, K.-T., Wang, E.I.-C., Su, Y.-C. (2011) Delignification kinetics study on the tetrahydrofurfuryl
alcohol/HCl pulping of rice straw. Ind. Eng. Chem.Res. 50:3849-3857.
Holtmam, K.M., Chang, H.M., Jameel, H., Kadla, J.F. (2003) Elucidation of lignin structure through degradative
methods: Comparison of modified DFRC and thioacidolysis. J. Agric. Food Chem. I51:3535-3540.
Huang, G., Shi, J.X., Langrish, T.A (2007) NH4OH-KOH pulping mechanisms and kinetics of rice straw.
Bioresour.Techol, 98:218-1223.
Huang, G., Shi, Y. (1986) Mechanism and kinetics of rice straw pulping. Zhongguo Zaozhi (China Pulp Pap.) 5:35-
40.
Huang, G., Zhang, C., Chen, Z. (2006) Pulping of wheat straw with caustic potash-ammonia aqueous solutions and
its kinetics. Chin. J. Chem. Eng. 14:729-733.
Hu, L., Pan, H., Zhou, Y., Zhang, M. (2011) Methods to improve lignin's reactivity as a phenol substitute and as a
replacement for other phenolic compunds: A brief review. Bioresources 6:3515-3525.
Hu, X., Lievens, C., Li, C.-Z. (2012) Acid-catalyzed conversion of xylose in methanol-rich medium as part of
biorefinery. ChemSusChem 5:1427-1434.
Hu, X., Westerhof, R.J.M., Dong, D., Wu, Liping., Li, C.-Z. (2014) Acid-catalyzed conversion of xylose in 20
solvents: Insight into interactions of the solvents with xylose, furfural, and the acid catalyst. ACS Sustainable Chem.
Eng. 14:2562-2575.
Iakovlev, M., Paakkonen, T., van Heiningen, A. (2009) Kinetics of SO2-ethanol-water pulping of spruce.
Holzforschung 63:779-784.
Iakovlev, M. SO2-ethanol-water (SEW) fractionation of lignocellulosics, Aalto University Publication, Espoo,
Helsinki, 2011a.
Iakovlev, M., Sixta, H., van Heiningen, A. (2011b) SO2-Ethanol-Water (SEW) Pulping: II. Kinetics for spruce, beech,
and wheat Straw. J. Wood Chem. Technol. 31:250-266.
Iakovlev, M., van Heiningen, A. (2011c) SO2-Ethanol-Water (SEW) Pulping: I. Lignin determination in pulps and
liquors. J. Wood Chem. Technol. 31:223-249.
Iakovlev, M., van Heiningen, A. (2012a) Efficient fractionation of spruce by SO2-ethanol-water: Closed mass balances
for carbohydrtaes and sulfur. ChemSusChem 5:1625-1637.

117
Iakovlev, M., van Heiningen, A. (2012b) Kinetics of fractionation by SO2-ethanol-water (SEW) treatment:
Understanding the deconstruction of spruce wood chips. RSC. Adv. 2:3057-3068.
Iakovlev, M., You, X., van Heiningen, A., Sixta, H. (2014) SO2-ethanol-water (SEW) fractionation of spruce: Kinetics
and conditions for paper and viscous grade dissolving pulp. RSC. Adv. 4:1938-1950.
IEA. World Energy Outlook 2012. International Energy Agency, Paris, 2012.
Jensen, W., Kremer, K.E., Sieril, P., Vartiovaara, V. (1963) The chemistry of bark. In: The Chemistry of Wood. Eds.
Browing, B.L. Interscience Publishers, New York. pp. 587-666.
Jiménez, L., Pérez, I., López, F., Ariza, J., Rodríguez, A. (2002) Ethanol/acetone pulping of wheat straw. Influence of
the cooking and the beating of the pulps on the properties of the resulting paper sheets. Bioresour.Techol. 83:139-143.
Johansson, A., Aaltonen, O., Ylinen, P. (1987) Organosolv pulping – methods and pulp properties. Biomass 13:45-
65.
Jurgens, G., Survase, S., Berezina, O., Sklavounos, E., Linnekoski, J., Kurkijarvi, A., Vakeva, M., van Heiningen, A.,
Granstrom, T. (2012) Butanol production from lignocellulosics. Biotechnol. Lett. 34:1415-1434.
Kim, H., Ralph, J. (2010) Solution-state 2D NMR of ball-milled plant cell wall gels in DMSO-d6/pyridine-d5. Org.
Biomol. Chem. 8:576-591.
Kleinert, T., Tayenthal, K. (1931) Separation of cellulose and incrusting substances in different woods. Angew.
Chemie. 44.788-791.
Koch, G. (2006) Raw material for pulp. In: Handbook of Pulp. Eds. Sixta, H. Wiley-VCH, Weinheim, 2006. pp. 21-
68.
Kouisni, L., Fang, Y., Paleologou, M., Ahvazi, B., Hawari, J., Zhang, Y., Wang, X-M. (2011) Kraft lignin recovery
and its use in the preparation of lignin-based phenol formaldehyde resins. Cellul. Chem. Technol. 45:515-520.
Kuhad, R., Singh, A. Lignocellulose biotechnology: Future prospects. Anshanal Publisher, New Delhi, India, 2007.
Kyrklund, B., Strandell, G. (1969) Applicability of the chlorine number for evaluation of the lignin content of pulp.
Pap. Puu. 51:299-305.
Lai, Y.-Z. (2000) Chemical degradation. In: Wood and Cellulose Chemistry. Eds. Hon, D.N., Shiraishi, N. Marcel
Dekkar, Inc., New York. pp. 443-505.
Lam, T.B.T., Liyama, K., Stone, B.A. (1992) Cinnamic acid bridges between cell wall polymers in wheat and phalaris
internodes. Phytochemistry 31:2655-2658.
Lam, T.T., Kadoya, K., Liyama, K. (2001) Bonding of hydroxycinnamic acids to lignin: Ferulic and p-coumaric acids
are predominantly linked at the benzyl position of lignin, not the β-position, in grass cell walls. Phytochemistry 57:
987-992.
Lancefield, C.S., Panovis, I., Deuss, P.J., Barta, K.,Westwood, N.J., (2017) Pretreatment of lignocellulosic feedstocks
using biorenewable alcohols; Towards complete biomass valorization. Green Chem. 19:202-214.
Lapierre, C., Monties, B. (1989) Structural information gained from the thioacidolysis of grass lignin and their relation
with alkali solubility. Tappi Proceedings Annex 3-2. pp. 615-621.

118
Larsson, K., Samuelson, O. (1969) Uronic and aldonic acid groups in two-stage cooked spruce sulfite pulp. Sven.
Papperstidn 72:97-100.
Li, J., Gellerstedt, G. (1998) Kinetics and mechanism of kappa number determination. Nord. Pulp Pap. Res. J. 13:147-
152.
Lu, X., Zhang, Y., Angelidaki, I. (2009) Optimization of H2SO4-catalyzed hydrothermal pretreatment rapeseed straw
for bioconversion to ethanol: Focusing on pretreatment at high solids content. Bioresour.Techol. 100:3048-3053.
Luz, S. M., Gonçalves, A.R. (2001) Evaluation of soda/AQ pulping for sugarcane bagasse and straw. In: 7th Brazilian
Symposium on the Chemistry of Lignins and Other Wood Components. Belo Horizonte, Brazil, 2001. pp. 141.
Luz, S.M., Gonçalves, A.R., Del’Arco, A.P.Jr., Leão, A.L., Ferrão, P.M.C., Rocha, G.J.M. (2010). Thermal properties
of polypropylene composites reinforced with different vegetable fibers. Adv. Mater. Res. 123:1199-1202.
Mariotti, F., Tome, D., Mirand, P.P. (2008) Converting nitrogen into protein-beyond 6.25 and Jones' factors. Crit.
Rev. Food Sci. Nutr. 48:177-184.
Martin-Sampedro, R., Capanema, E.A., Hoeger, I., Villar, J.C., Rojas, O.J. (2011) Lignin changes after steam
explosion and laccase-mediator treatemnet of eucalyptus wood chips. J. Agric. Food Chem. 59:8761-8769.
Meier, H. (1962) The behaviour of wood hemicelluloses under different pulping conditions. Sven. Papperstidn.
65:299-306.
Mellmer, M.A., Sener, C., Gallo, J.M.R., Luterbacher, J.S., Alonso, D.M., Dumesic, J.A. (2014) Solvent effects in
acid catalyzed biomass conversion reactions. Angew. Chemie. Int.Ed. 53:11872-11875.
Messner, K., Koller, K., Wall, M.B., Akhtar, M., Scott, G.M. (1998). Fungal treatment of wood chips for chemical
pulping. In: Environmental Friendly Technologies for Pulp and Paper Industry. Eds. Young, R., Akthar, M. Wiley
Publisher, New York. pp. 385-419
Miléo, P.C., Mulinari, D.R., Baptista, C.A.R.P., Rocha, G.J.M., Gonçalves, A.R. (2011) Mechanical behaviour of
polyurethane from castor oil reinforced sugarcane straw cellulose composites. Procedia Eng. 10: 2068-2073.
Millett, M.A., Moore, W.E., Saeman, J.F. (1954) Preparation and properties of hydrocelluloses. J.Ind. Eng. Chem.
46:1493-1507.
Moryia, R.Y., Goncalves, A.R., Duarte, M.C.T. (2007) Ethanol/water pulps from sugarcane starw and their
biobleaching with xylanase from bacillus pumilus. Appl. Biochem. Biotechnol, 137:pp. 501-513.
Nellemann, C., MacDecette, M., Manders, T., Eickhout, B., Svihus, B., Prins, A.G., Kaltenborn, B.P. The
Environmental Food Crisis:The environment’s role in averting future food crisis. UNEP/Earthprint, Norway, 2009.
Neto, M. (2005) Characterization of sugarcane trash and bagasse in biomass power generation. In: Sugarcane Bagasse
and Trash. Eds. Hassuani, S.J., Leal, M.L.R.V., Macedo, I.C. PUND and CTC Publisher, Piracicaba, pp. 24.
Nigam, J. N. (2001) Ethanol production from hardwood spent sulfite liqor using an adapted strain of Pichia stipitis. J.
Ind. Microbiol. Biot. 26:145-150.
Ni, Y., Hu, Q. (1995) Alcell ® lignin solubility in ethanol-water mixtures. J. Appl. Polym. Sci., 57:1441-1446.

119
Obama, P., Ricochon, G., Muniglia, L., Brosse, N. (2012) Combination of enzymatic hydrolyis and ethanol organosolv
pretreatments: Effect on lignin structures, delignification yields and cellulose to glucose conversion. Bioresour.
Technol. 112:156-163.
Oliet, M., Garcia, J., Rodriguez, F., Gilarrranz, M.A. (2002) Solvent effects in autocatalyzed alcohol-water pulping.
Comparative study between ethanol and methanol as delignifying agents. Chem. Eng. J. 87:157-162.
Oreopoulou, V. (1988) Relationship between kappa number and lignin content of unscreened straw pulp. Cellul.
Chem. Technol. 22:53-57.
Overend, R. P., Chornet, E. (1987) Fractionation of lignocellulosics by steam-aqueous pretreatments [and discussion].
Phlos. Trans. R. Soc. Lond. 321:523-536.
Pasquini, D., Pimenta, M.T.B., Ferreira, L.H., Curvelo, A.A. (2005) Extraction of lignin from sugar cane bagasse and
pinus taeda wood chips using ethanol-water mixtures and carbon dioxide at high pressures. J. Supercrit. Fluids 36:31-
39.
Paszner, L., Cho, H. J. (1989) Organosolv pulping: Acidic catalysis options and their effect on fiber quality and
delignification. Tappi J. 72:135-142.
Philipp, B., Jacopian, V., Loth, F. (1979) Influence of cellulose physical structure on thermohydrolytic, hydrolytic,
and enzymatic degradation of Cellulose. In: Hydrolysis of Cellulose: Mechanisms of Enzymatic and Acid Catalysis.
Eds. Brown, R.D., Jr., L.J. ACS Publisher, Washington DC. pp. 127-143.
Pimentel, M.H. Food, Energy and Society. 3rd ed., CRC Press, Boca Raton, Florida, 2007.
Primakov, S. F. (1961) Delignification of larch with water-alcohol solutions of sulfur dioxide. Nauchn. Tr. Vses.
Nauchn.-Issled. Inst. Tsellyulozn.-Bumazhn. Prom. 46:83-118.
Primakov, S.F., Tsarenko, I.M., Zaplatin, V.P. (1979) Delignification of wood by aqueous-alcohol solutions of sulfur
dioxide. Kiev. Politekh. Inst., Kiev, USSR. Koksnes Kimija 6:39-42.
Puumala, R. Organosolv pulping and a preliminary vapor-liquid equilibrium study of a sulfur dioxide-ethanol-water
system. Master Thesis, Michigan Technological University, 1991.
Pye, E. K., Lora, J.H. (1991) The Alcell process: A proven alternative to Kraft pulping. Tappi J. 74:113-118.
Quesada-Medina, J., Lopez-Cremades, F.J., Olivares-Carrillo, P. (2010) Organosolve extraction of lignin from
hydrolyzed almond shells and application of the δ-value theory. Bioresour. Technol. 101:8252-8260.
Rencoret, J., Gutierrez, A., Nieto, L., Jimenez-Barbero, J., Faulds, C.B., Kim, H., Ralph, J., Martinez, A.T., del Rio,
J.C. (2011) Lignin composition and structure in young versus adult eucalyptus glogulus plants. Plant Physiol.155:667-
682.
Retsina, T., Pylkkanen, V. (2013) Separation of lignin from hydrolyzate. US, Patent No. 8,585,863 B2.
Rocero, M.B., Torres, A.L., Colom, J.F., Vidal, T. (2003) TCF bleaching of wheat straw pulp using ozone and
xylanase. Part A: Paper quality assessment. Bioresour. Technol. 87:305-314.
Rocha, G.J.M. Sugarcane bagasse oxygen assisted delignification. PhD Thesis, University of Sao Paulo, 2000.
Rodríguez, A., Jiménez, L. (2008) Pulping with organic solvents other than alcohols. Afinidad, 65:188-196.

120
Rowell, R.M., Han, J.S., Rowell, J.S. (2000) Characterization and factors affecting fiber properties. In: Natural
Polymers and Agrofibers Based Composites. Eds. Frollini,, E., Leao, A.L., Mattoso, L.H.C. Embrapa Agricultural
Instrumentation, San Carlos, Brazil. pp. 115-134.
Rowell, R.M., Keany, F.M. (1991) Fiberboards made from acetylated bagasse fiber. Wood Fiber Sci. 23:15-22.
Rozenberger, N.A. (1961) Rapid sulfite pulping. Bum. Prom-st. 36: 3-7.
Rydholm, S.A. Pulping Processes. John Wiley & Sons Inc., London, 1965.
Saad, M.B.W., Oliveira, L.R.M., Candido, R.G., Quintana, G., Rocha, G.J.M., Goncalves, A.R. (2008) Preliminary
studies on fungal treatment of sugarcane straw for organosolve pulping. Enzym. Microb. Tech. 43:220-225.
Sakai, K., Mun, S.P., Fakuda, J., Imamura, H., (1983) Delignification with sulfites and an organic solvent-
semichemical and chemical pulping of sugi (Japanese cedar). In: 2nd International Symposium on Wood and Pulping
Chemistry. Tsukuba Science City, Japan.
Sakai, K., Uprichard, J.M. (1987). Isopropanol-sulphite pulping studies on radiata pine. Appita, 40:193-200.
Sakdaronnarong, C., Jonglertjunya, W. (2012) Rice straw and sugarcane bagasse degradation mimicking
lignocellulose decay in nature: An alternative approach to biorefinery. J. Sci. Soc. Thailand 38:364-372.
Santos, FA., Queiróz, J.H., Colodette, J.L., Fernandes, A.S., Guimarães, V.M., Rezende, S.T. (2012) Potential of
sugarcane straw for ethnaol production. Quim. Nova (modern chemistry) 35:1004-1010.
Santos, J.I., Martin-Sampedro, R., Fillat, U., Olivia, J.M., Negro, M.J., Ballesteros, M., Eugenio, M.E., Ibarra, D.
(2015) Evaluating lignin rich residues from biochemical ethanol production of wheat straw and olive tree pruning by
FTIR and 2D-NMR. Int. J. Polym. Sci. 2015:p.11.
Sarkanen, K.V., Ludwig, C.H. Lignins: Occurence, Formation, Structure and Reactions. Wiley-Interscience, New
York, 1971.
Schorning, P. (1957) Base-free sulfite pulping of wood. Faserforsch. Textiltech. 8:487-494.
Schuerch, C. (1952) The solvent properties of liquids and their relation to the solubility, swelling, isolation, and
fractionation of lignin. J. Am. Chem. Soc. 74:5061-5070.
Scott, R.W. (1979) Colorimetric determination of hexuronic acids in plant materials. Anal.Chem. 51:936-941.
Shafizadeh, F. (1963) Acidic hydrolysis of glycosidic bonds. Tappi J. 46:381-393.
She, D., Nie, X.N., Xu, F., Geng, G.C., Jia, H.T., Jones, G.L., Baird, M.S. (2012) Physio-chemical characterization of
different alcohol soluble lignins from rice straw. Cellulose Chem. Technol. 46:207-219.
Sierra-Alvarez, R., Tjeerdsma, B. (1995) Organosolv pulping of juvenile poplar wood. In: 8th Symposium on Wood
and Pulping Chemistry, Helsinki, pp. 207-211.
Silva, J.P.A., Mussatto, S.I., Roberto, I.C. (2010) The infulence of Initial xylose concentration, agitation, and aeration
on ethanol production by Pichia stipitis from rice straw hemicellulosic hydrolysate. Appl. Biochem. Biotechnol.
162:1306-1315.
Singh, P., Suman, A. (2008) Biological pretreatment of sugarcane trash for its conversion to fermentable sugars. World
J. Microbiol. Biotechnol. 24:667-673.

121
Sixta, H., Potthast, A., Krotschek, A.W. (2006) Chemical pulping processes. In: Handbook of Pulp. Eds. Sixta, H.
WILEY-VCH, Weinheim, pp. 109-509.
Sixta, H., Iakovlev, M., Testova, L., Roselli, A., Hummel, M., Borrega, M., vanHeiningen, A., Froschauer, C.,
Schottenberger, H. (2013) Novel concepts in dissolving pulp production. Cellulose 20:1547-1561.
Sjöström, E. Wood Chemistry: Fundamentals and Applications. Academic Press, New York, 1981.
Sjöström, E. Wood Chemistry: Fundamentals and Applications. 2nd ed. Academic Press, New York, 1993.
Sklavounos, E., Iakovlev, M., Yamamoto, M., Teräsvuor, L., Jurgens, G., Granström, T., van Heiningen, A. (2011)
Conditioning of SO2-ethanol-water spent liquor from spruce for the production of chemicals by ABE fermentation.
Holzforchung, 65:551-558.
Sklavonous, E., Iakovlev, M., van Heiningen, A. (2013a) Study on SO2-ethanol-water spent liquor from spruce
chips/softwood biomass for ABE fermentation. Ind. Eng. Chem. Res. 52:4351-4359.
Sklavounos, E., Iakovlev, M., Survase, S., Granstrom, T., van Heiningen, A. (2013b) Oil palm fruit bunch to biofuels
and chemicals via SO2-ethanol-water fractionation and ABE fermentation. Bioresour.Techol. 147:102-109.
Sklavounos, E. Conditioning of SO2-ethanol-water (SEW) spent liquor from lignocellulosics for ABE fermentation to
biofuels and chemicals. Aalto University Publication, Espoo, Helsinki, 2014.
Slávik, I. (1961) Über die Zersetzung des Schwefeldioxyds unter Bedingungen der Sulfitkochung. Sven. Papperstidn.
64:427-437.
Smook, G.A. Handbook for Pulp & Paper Technologists. 2nd ed., Angus Wilde Publications, Vancouver ,1992.
Sternling, C.V. Scriven, L.E. (1959) Interfacial turbulence. AIChE J. 5: 514-523.
Sumerskii, I., Zweckmair, T., Hettegger, H., Zinovyev, G., Bacher, M., Rosenau, T., Potthast, A. (2017) Fast track
for accurate determination of methoxy and ethoxy groups in lignin. RSC. adv. 7:22974-22982
Sundquist, J. (2000) Organosolv pulping: In: Chemical Pulping, Papermaking Science and Technology Book 6B. Eds.
Gullichsen, J., Fogelholm, C.J. Fapet Oy, Helsinki. pp.411-427
Sun, J.X., Sun, X.F., Flower, P., Baird, M.S. (2003) Inhomogeneities in the chemical structure of sugarcane bagasse
lignin. J. Agric. Food Chem.51:6719-6725.
Sun, R., Tomkinson, J. (2002) Comparative study of lignins isolated by alkali and ultrasound-assisted alkali
extarctions from wheat starw. Ultrason. Sonochem. 9:85-93.
Sun, S.N., Li, M.F., Yuan, T.Q., Xu, F., Sun, R.C. (2012) Sequential extractions and structure characterization of
lignin with ethanol and alkali from bamboo (Neosinocalamus affinis). Ind. Crop Prod. 212:51-60.
Sun, Y., Cheng, J. (2002) Hydrolysis of lignocellulosic materials for ethanol production: A review. Bioresour.
Technol. 83:1-11.
Survase, S.A., Jurgens, G., van Heiningen, A., Granstrom, T. (2011) Continuous production of isopropanol and
butanol using Clostridium beijerinckii DSM6423. Appl. Microbiol. Biotechnol. 91:1305-1313.
Survase, S.A., van Heiningen, A., Granstrom, T. (2013) Wood pulp as an immobilization matrix for the continuous
production of isopropanol and butanol. J. Ind. Microbiol. Biot. 40:209-215.

122
Szczerbowski, D., Pitarelo, A.P., Zandona Filho, A., Ramos, L.P. (2014) Sugarcane biomass for biorefineries:
Comparative composition of carbohydrate and non-carbohydrate components of bagasse and straw. Carbohydr.
Polym. 14:95-101.
Tasman, J., Berzins, V. (1957) The permanganate consumption of pulp materials. III. The relationship of the kappa
number to the lignin content of pulp materials. Tappi J. 40:699-704.
Tolbert, A., Akinosho, H., Khunsupat, R., Naskar, A.K., Ragauskas, A.J. (2014) Characterization and analysis of the
molecular weight of lignin for biorefining studies. Biofuels Bioprod. Bioref. 8:836-856.
Triana, O., Leonard, M., Saavedra, F., Acan, I.C., Gracia, O.L., Abril, A. Atlas of Sugarcane Bagasse. Geplacea and
ICID, Mexico, 1990.
U.S. Department of Energy. U.S. Billion-Ton Update: Biomass Supply for a Bioenergy and Bioproducts Industry.
Oak Ridge National Laboratory, Tennesse, 2011.
Vishnevskaya, S.S., Boyarskaya, R.K., Tsypkina, M.N. (1981) Sulfonation and dissolution of lignin in sulfite
pulpingpulping. 2. Factors determining the dissolution of lignin. Koksnes Kim. 1:23-28.
Vlasenko, E.Y., Ding, H., Labavith, J.M., Shoemaker, S.P. (1997) Enzymatic hydrolysis of pretreated rice straw.
Bioresour.Techol. 59:109-119.
Wang, Q., Chen, K., Li, J., Yang, G., Liu, S., Xu, J. (2011) The solubility of lignin from bagasse in a 1,4-butadiol/water
system. Bioresources 6:3034-3043.
Wu, S., Agrypopoulos, D. (2003) An improved method for isolating lignin in high yield and purity. J. Pulp Pap. Sci.
29:235-240.
WWF (2017) Global Forest Conversion. Avaiable from
http://wwf.panda.org/about_our_earth/deforestation/deforestation_causes/forest_conversion/ (accessed on April, 4,
2017)
Xu, Y.J., Li, K.C., Zhang, M.Y. (2007) Lignin precipitation on the pulp fibers in the ethanol-based organosolv pulping.
Colloids Surf. 301:255-263.
Yamamoto, M., Iakovlev, M., van Heiningen, A. (2011) Total mass balance of SO2-ethanol-water (SEW) fractionation
of forest biomass. Holzforschung 65:559-565.
Yamamoto, M. SO2-ethanol-water fractionation and enzymatic hydrolysis of forest biomass. Aalto University
publication, Espoo, Helsinki, 2014a.
Yamamoto, M., Iakovlev, M., van Heiningen, A. (2014b) Kinetics of SO2–ethanol–water (SEW) fractionation of
hardwood and softwood biomass. Bioresour. Technol.155:307-313.
Yang, D., Qiu, X., Zhou, M., Lou, H. (2007) Properties of sodium lignosulfate as dispersant of coal water slurry.
Energ. Convers. Manage. 48: 2433-2438.
Ye, Y., Liu, Y., Chang, J. (2014) Application of solubility parameter theory to organosolv extraction of lignin from
enzymatically hydrolyzed cornstalks. Bioresources 9:3417-3427.
Young, J. (1992) Commercial Organocell process comes online at Kelheim Mill. J. Pulp pap. Sci. 66:99-102.

123
You, X., van Heiningen, A., Sixta, H., Iakovlev, M. (2016) Kinetics of SO2-ethanol-water (AVAP) fractionation of
sugarcane straw. Bioresour. Technol. 212:111-119.
You, X., van Heiningen, A., Sixta, H., Iakovlev, M. (2017a) Sulfur balance of sulfur dioxide-ethanol-water
fractionation of sugarcane straw. Bioresour. Technol. 241:998-1002.
You, X., van Heiningen, A., Sixta, H., Iakovlev, M. (2017b) Lignin and ash balances of sulfur dioxide-ethanol-water
fractionation of sugarcane straw. Submitted to Bioresourc. Technol. BITE-D-17-04514
Zhai, H.M., Lee, Z.Z. (1989) Ultrastructure and topochemistry of delignification in alkaline pulping of wheat straw.
Wood Chem. Technol. 9:387-406.
Zhang, M.Y., Xu, Y.J., Li, K.C. (2007) Removal of residual lignin of ethanol-based organosolv pulp by an alkali
extraction process. J. Appl. Polym. Sci. 106: 630-636.
Zhang, Z., Harrison, M.D., Rackemann, D.W., Doherty, W.O.S., O’Hara, I.M. (2016) Organosolv pretreatment of
plant biomass for enhanced enzymatic saccharification. Green Chem. 18:360-381.
Zhu, J.Y., Chai, X.S., Dhasmana, B. (1999) Formation of volatile organic compounds (VOCs) during pulping. J. Pulp
pap. Sci. 25:256-263.

124
11. APPENDIX A
SMW PULPS AND SPENT LIQUORS
Table A.1: Properties of pulps and spent liquors from SMW fractionation of SCS
Process parameters Spent liquor Pulp properties
Temperature Duration pH Pulp yield Pulp kappa Pulp viscosity Cellulose DP
°C minutes % SCS mL g-1
135
30 1.20 58.9 69.9 919 6817
50 1.21 52.4 64.2 917 5934
70 1.14 48.6 54.1 882 5303
90 103 44.5 43.3 843 4466
145
20 1.04 57.7 88.1 879 6240
40 1.03 48.6 62.4 919 5213
60 1.01 45.1 45.8 827 4385
80 1.00 43.1 39.4 719 3636
100 1.00 41.5 37.7 608 2961
120 0.98 39.8 35.5 503 2282
155
20 1.06 53.6 78.1 994 6521
30 1.05 48.1 66.9 919 5390
40 1.06 46.3 56.7 827 4430
60 1.00 41.1 44.7 719 3553
80 0.97 40.8 40.7 608 2741
100 0.93 36.8 40.3 503 2234
SO2/MeOH/H2O = 12:44:44 (w/w%), L/F = 4 L kg-1. Cooking duration includes 10 min of heat-up.

125
12. APPENDIX B
SEW PULPS AND SPENT LIQUORS
Table B.1: Properties of pulps and spent liquors from SEW fractionation of SCS
Process parameters Spent liquor Pulp properties
Temperature Duration pH Pulp yield Pulp
kappa
Pulp
viscosity
Cellulose
DP
°C minutes % SCS mL g-1
135
30 1.20 57.7 68.5 915 6341
50 1.17 50.3 52.2 939 5580
70 1.13 46.3 38.9 863 4911
90 1.13 44.2 29.6 848 4429
145
20 1.23 57.0 70.5 910 6155
40 1.13 45.8 39.6 919 5049
60 1.10 42.3 27.8 827 4209
80 1.07 39.7 22.1 719 3339
100 1.04 38.7 20.1 608 2832
120 1.00 36.5 17.4 503 2105
155
20 1.10 49.3 55.6 935 5594
30 1.04 44.2 40.4 919 5067
40 0.99 41.6 28.2 827 4196
60 0.97 38.3 22.6 719 3342
80 0.92 36.4 20.1 608 2635
100 0.90 34.9 21.7 503 2044
SO2/EtOH/H2O = 12:44:44 (w/w%), L/F = 4 L kg-1. Cooking duration includes 10 min of heat-up.

126
13. APPENDIX C
SPW PULPS AND SPENT LIQUORS
Table C.1: Properties of pulps and spent liquors from SPW fractionation of SCS
Process parameters Spent liquor Pulp properties
Temperature Duration pH Pulp yield Pulp kappa Pulp viscosity Cellulose DP
°C minutes % SCS mL g-1
135
30 1.22 57.7 64.8 873 6072
50 1.16 48.6 50.2 940 5506
70 1.08 45.1 33.7 922 4979
90 1.06 44.5 27.6 921 4581
145
20 1.16 56.4 63.5 863 5575
40 1.01 45.9 35.4 919 4919
60 0.98 41.4 22.6 827 4254
80 0.94 40.4 20.2 719 3493
100 0.93 38.2 17.4 608 2692
120 0.89 35.6 15.2 503 2070
155
20 1.20 51.2 60.0 953 5521
30 1.10 45.2 35.1 914 4901
40 1.04 42.5 28.6 817 4035
60 0.96 37.9 20.4 620 2838
80 0.89 38.0 18.2 - -
100 0.85 36.0 18.4 - -
SO2/IPA/H2O = 12:44:44 (w/w%), L/F = 4 L kg-1. Cooking duration includes 10 min of heat-up.
127
14. BIOGRAPHY OF THE AUTHOR
Asif Masih Sharazi was born in Toba Tek Singh, Punjab, Pakistan on August 20, 1988. He was raised in Toba Tek
Singh, Pakistan where he completed his elementary, high school and pre-engineering (community college) education.
In 2005, he moved to Lahore, the 2nd biggest city in Pakistan. Four years later he graduated with Bachelor of Chemical
Engineering from the University of Engineering and Technology (UET) Lahore, Pakistan in 2009. Upon graduation,
Asif enrolled in UET graduate school where he pursued his Master of Science in Chemical Engineering. In summer
2012, he was awarded a Fulbright International Scholarship to continue his studies in the United States. He entered
the chemical engineering graduate program at The University of Maine Orono in the fall of 2012. He has published
one article in Tappi Journal and another one in Holzforschung as a first author. Currently he has one article as a first
author under peer review. He has presented his doctoral research at two conferences to audiences of his peers. He is a
member of the Technical Association of Pulp and Paper Industry (TAPPI). Asif loves snow related activities including
skating and skiing. He also greatly enjoys playing cricket and tennis. Asif is a candidate for the Doctor of Philosophy
in Chemical Engineering from the University of Maine in August 2017.