smart technologies inc.vault.smarttech.com/annualreport/pdfs/20120605 - smart...page 4 report of...
TRANSCRIPT
Page 1
Consolidated Financial Statements of
SMART Technologies Inc.
Years ended March 31, 2012, 2011 and 2010

Page 2
INDEPENDENT AUDITORS’ REPORT
To the Shareholders and Board of Directors of SMART Technologies Inc. We have audited the accompanying consolidated financial statements of SMART Technologies Inc., which comprise the consolidated balance sheets as at March 31, 2012 and March 31, 2011, the consolidated statements of operations, shareholders’ deficit and cash flows for each of the years ended in the three year period ended March 31, 2012, and notes, comprising a summary of significant accounting policies and other explanatory information. Management’s Responsibility for the Consolidated Financial Statements Management is responsible for the preparation and fair presentation of these consolidated financial statements in accordance with U.S. generally accepted accounting principles, and for such internal control as management determines is necessary to enable the preparation of consolidated financial statements that are free from material misstatement, whether due to fraud or error. Auditors’ Responsibility Our responsibility is to express an opinion on these consolidated financial statements based on our audits. We conducted our audits in accordance with the standards of the Public Company Accounting Oversight Board (United States) and Canadian generally accepted auditing standards. Those standards require that we comply with ethical requirements and plan and perform the audit to obtain reasonable assurance about whether the consolidated financial statements are free from material misstatement. An audit involves performing procedures to obtain audit evidence about the amounts and disclosures in the consolidated financial statements. The procedures selected depend on our judgment, including the assessment of the risks of material misstatement of the consolidated financial statements, whether due to fraud or error. In making those risk assessments, we consider internal control relevant to the entity’s preparation and fair presentation of the consolidated financial statements in order to design audit procedures that are appropriate in the circumstances. An audit also includes evaluating the appropriateness of accounting policies used and the reasonableness of accounting estimates made by management, as well as evaluating the overall presentation of the consolidated financial statements. We believe that the audit evidence we have obtained in our audits is sufficient and appropriate to provide a basis for our audit opinion. Opinion In our opinion, the consolidated financial statements present fairly, in all material respects, the consolidated financial position of SMART Technologies Inc. as at March 31, 2012 and March 31, 2011, and its consolidated results of operations and its consolidated cash flows for each of the years in the three year period ended March 31, 2012 in accordance with U.S. generally accepted accounting principles. /s/ KPMG LLP Chartered Accountants Calgary, Canada May 17, 2012
Page 3
REPORT OF INDEPENDENT REGISTERED PUBLIC ACCOUNTING FIRM To the Shareholders and Board of Directors of SMART Technologies Inc.
We have audited the accompanying consolidated balance sheets of SMART Technologies Inc. as of March 31, 2012 and March 31, 2011 and the related consolidated statements of operations, shareholders’ deficit, and cash flows for each of the years in the three year period ended March 31, 2012. These consolidated financial statements are the responsibility of SMART Technologies Inc.'s management. Our responsibility is to express an opinion on these consolidated financial statements based on our audits. We conducted our audits in accordance with the standards of the Public Company Accounting Oversight Board (United States). Those standards require that we plan and perform the audit to obtain reasonable assurance about whether the financial statements are free of material misstatement. An audit includes examining, on a test basis, evidence supporting the amounts and disclosures in the financial statements. An audit also includes assessing the accounting principles used and significant estimates made by management, as well as evaluating the overall financial statement presentation. We believe that our audits provide a reasonable basis for our opinion. In our opinion, the consolidated financial statements referred to above present fairly, in all material respects, the consolidated financial position of SMART Technologies Inc. as of March 31, 2012 and March 31, 2011, and its consolidated results of operations and its consolidated cash flows for each of the years in the three year period ended March 31, 2012 in conformity with U.S. generally accepted accounting principles We also have audited, in accordance with the standards of the Public Company Accounting Oversight Board (United States), SMART Technologies Inc.’s internal control over financial reporting as of March 31, 2012, based on the criteria established in Internal Control – Integrated Framework issued by the Committee of Sponsoring Organizations of the Treadway Commission (COSO), and our report dated May 17, 2012 expressed an unqualified opinion on the effectiveness of SMART Technologies Inc.’s internal control over financial reporting. /s/ KPMG LLP Chartered Accountants Calgary, Canada May 17, 2012

Page 4
REPORT OF INDEPENDENT REGISTERED PUBLIC ACCOUNTING FIRM To the Shareholders and Board of Directors of SMART Technologies Inc. We have audited SMART Technologies Inc.’s internal control over financial reporting as of March 31, 2012, based on criteria established in Internal Control – Integrated Framework issued by the Committee of Sponsoring Organizations of the Treadway Commission (COSO). SMART Technologies Inc.’s management is responsible for maintaining effective internal control over financial reporting and for its assessment of the effectiveness of internal control over financial reporting, included in the accompanying Management’s Discussion and Analysis of Financial Condition and Results of Operations for the year ended March 31, 2012. Our responsibility is to express an opinion on the Company’s internal control over financial reporting based on our audit.
We conducted our audit in accordance with the standards of the Public Company Accounting Oversight Board (United States). Those standards require that we plan and perform the audit to obtain reasonable assurance about whether effective internal control over financial reporting was maintained in all material respects. Our audit included obtaining an understanding of internal control over financial reporting, assessing the risk that a material weakness exists, and testing and evaluating the design and operating effectiveness of internal control based on the assessed risk. Our audit also included performing such other procedures as we considered necessary in the circumstances. We believe that our audit provides a reasonable basis for our opinion.
A company’s internal control over financial reporting is a process designed to provide reasonable assurance regarding the reliability of financial reporting and the preparation of financial statements for external purposes in accordance with generally accepted accounting principles. A company’s internal control over financial reporting includes those policies and procedures that (1) pertain to the maintenance of records that, in reasonable detail, accurately and fairly reflect the transactions and dispositions of the assets of the company; (2) provide reasonable assurance that transactions are recorded as necessary to permit preparation of financial statements in accordance with generally accepted accounting principles, and that receipts and expenditures of the company are being made only in accordance with authorizations of management and directors of the company; and (3) provide reasonable assurance regarding prevention or timely detection of unauthorized acquisition, use, or disposition of the company’s assets that could have a material effect on the financial statements.
Because of its inherent limitations, internal control over financial reporting may not prevent or detect misstatements. Also, projections of any evaluation of effectiveness to future periods are subject to the risk that controls may become inadequate because of changes in conditions, or that the degree of compliance with the policies or procedures may deteriorate.
In our opinion, SMART Technologies Inc. maintained, in all material respects, effective internal control over financial reporting as of March 31, 2012, based on criteria established in Internal Control – Integrated Framework issued by the Committee of Sponsoring Organizations of the Treadway Commission.
We also have audited, in accordance with the standards of the Public Company Accounting Oversight Board (United States), the consolidated balance sheets of SMART Technologies Inc. as of March 31, 2012 and 2011, and the related consolidated statements of operations, shareholders’ deficit, and cash flows for each of the years in the three-year period ended March 31, 2012, and our report dated May 17, 2012 expressed an unqualified opinion on those consolidated financial statements. /s/ KPMG LLP Chartered Accountants Calgary, Canada May 17, 2012

Page 5
SMART Technologies Inc. Consolidated Statements of Operations (thousands of U.S. dollars, except per share amounts) For the years ended March 31, 2012, 2011 and 2010
March 31, 2012 March 31, 2011 March 31, 2010
Revenue $ 745,800 $ 790,055 $ 647,975 Cost of sales 410,160 399,176 326,457
Gross margin 335,640 390,879 321,518 Expenses
Selling, marketing and administration 178,318 180,092 138,810 Research and development 51,815 53,740 33,581 Depreciation and amortization of property and equipment 21,259 22,796 15,930 Amortization of intangible assets 9,573 8,986 21 Restructuring costs (note 4) 13,375 - - Interest expense 14,576 26,321 30,222 Interest expense on related party debt - 5,297 34,626 Foreign exchange loss (gain) 8,544 (10,534) (91,814)
297,460 286,698 161,376 Other income, net 516 486 204
Income before income taxes 38,696 104,667 160,346 Income tax expense (recovery) (note 13)
Current 15,364 35,652 12,504 Deferred (8,448) (340) 5,810
6,916 35,312 18,314
Net income $ 31,780 $ 69,355 $ 142,032
Earnings per share (note 15)
Basic $ 0.26 $ 0.53 $ 0.81 Diluted $ 0.26 $ 0.53 $ 0.81
See accompanying notes to consolidated financial statements
Page 6
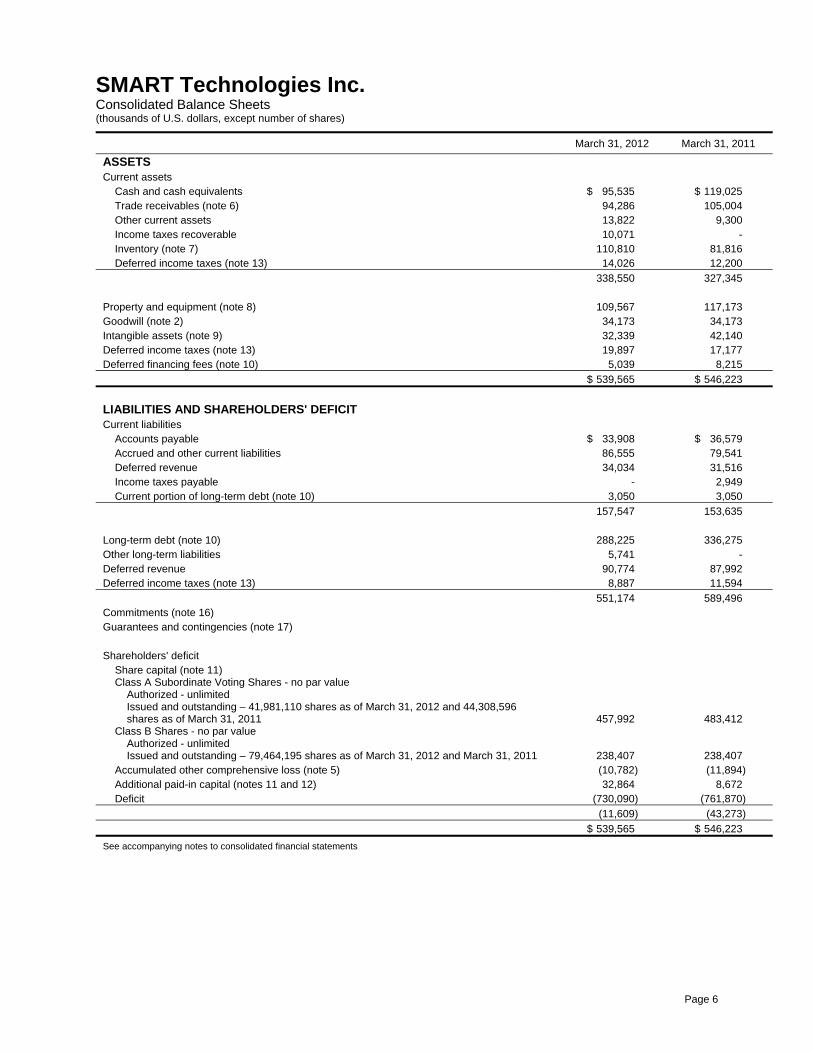
SMART Technologies Inc. Consolidated Balance Sheets (thousands of U.S. dollars, except number of shares)
March 31, 2012 March 31, 2011
ASSETS
Current assets Cash and cash equivalents $ 95,535 $ 119,025 Trade receivables (note 6) 94,286 105,004 Other current assets 13,822 9,300 Income taxes recoverable 10,071 - Inventory (note 7) 110,810 81,816 Deferred income taxes (note 13) 14,026 12,200
338,550 327,345 Property and equipment (note 8) 109,567 117,173 Goodwill (note 2) 34,173 34,173 Intangible assets (note 9) 32,339 42,140 Deferred income taxes (note 13) 19,897 17,177 Deferred financing fees (note 10) 5,039 8,215
$ 539,565 $ 546,223
LIABILITIES AND SHAREHOLDERS' DEFICIT
Current liabilities Accounts payable $ 33,908 $ 36,579 Accrued and other current liabilities 86,555 79,541 Deferred revenue 34,034 31,516 Income taxes payable - 2,949 Current portion of long-term debt (note 10) 3,050 3,050
157,547 153,635 Long-term debt (note 10) 288,225 336,275 Other long-term liabilities 5,741 - Deferred revenue 90,774 87,992 Deferred income taxes (note 13) 8,887 11,594
551,174 589,496 Commitments (note 16) Guarantees and contingencies (note 17) Shareholders' deficit
Share capital (note 11) Class A Subordinate Voting Shares - no par value Authorized - unlimited Issued and outstanding – 41,981,110 shares as of March 31, 2012 and 44,308,596
shares as of March 31, 2011 457,992
483,412 Class B Shares - no par value Authorized - unlimited Issued and outstanding – 79,464,195 shares as of March 31, 2012 and March 31, 2011 238,407
238,407 Accumulated other comprehensive loss (note 5) (10,782) (11,894) Additional paid-in capital (notes 11 and 12) 32,864 8,672 Deficit (730,090) (761,870)
(11,609) (43,273)
$ 539,565 $ 546,223
See accompanying notes to consolidated financial statements

Page 7
SMART Technologies Inc. Consolidated Statements of Shareholders’ Deficit (thousands of U.S. dollars) For the years ended March 31, 2012, 2011 and 2010
Share capital stated amount Deficit
Accumulated other
comprehensive (loss) income
Additional paid-in capital Total
Balance as of March 31, 2009 $ 160,247 $ (973,257) $ 130,677 $ - $ (682,333)
Net income - 142,032 - - 142,032
Participant Equity Loan Plan (note 11) 1,027 - - - 1,027 Foreign currency translation - - (155,041) - (155,041)
Balance as of March 31, 2010 $ 161,274 $ (831,225) $ (24,364) $ - $ (694,315) Net income - 69,355 - - 69,355 Participant Equity Loan Plan (note 11) 8,331 - - - 8,331 2010 Reorganization (notes 3 and 11) 413,618 - - - 413,618 Initial public offering 138,596 - - - 138,596 Foreign currency translation - - 12,470 - 12,470 Stock-based compensation - - - 8,672 8,672
Balance as of March 31, 2011 $ 721,819 $ (761,870) $ (11,894) $ 8,672 $ (43,273)
Net income - 31,780 - - 31,780 Participant Equity Loan Plan (note 11) 135 - - - 135 Repurchase of common shares (note 11) (25,555) - - 15,800 (9,755) Foreign currency translation - - 1,112 - 1,112 Stock-based compensation - - - 8,392 8,392 Balance as of March 31, 2012 $ 696,399 $ (730,090) $ (10,782) $ 32,864 $ (11,609)
See accompanying notes to consolidated financial statements

Page 8
SMART Technologies Inc. Consolidated Statements of Cash Flows (thousands of U.S. dollars) For the years ended March 31, 2012, 2011 and 2010
March 31, 2012 March 31, 2011 March 31, 2010
Cash provided by (used in) Operations Net income $ 31,780 $ 69,355 $ 142,032 Adjustments to reconcile net income to net cash provided by
operating activities
Depreciation and amortization of property and equipment 25,028 26,914 17,956 Amortization of intangible assets 9,573 8,986 21 Amortization of deferred financing fees 2,991 3,270 1,927 Non-cash interest expense (recovery) on long-term debt 966 (967) (1,082) Non-cash interest expense on related party long-term debt - 5,297 34,626 Non-cash restructuring costs in other long-term liabilities 5,358 - - Stock-based compensation 8,392 8,672 - Loss (gain) on foreign exchange 8,268 (11,483) (93,447) Deferred income tax (recovery) expense (8,448) (340) 5,810 Loss on disposal of property and equipment 217 86 220 Trade receivables 5,501 (11,048) 2,452 Other current assets (4,705) 6,400 (3,745) Inventory (32,377) (16,689) 14,237 Income taxes recoverable and payable (13,422) (5,556) 7,872 Accounts payable, accrued and other current liabilities 9,835 (12,739) 17,251 Deferred revenue 8,686 14,810 13,379
Cash provided by operating activities 57,643 84,968 159,509
Investing Business acquisition - (82,000) - Cash of subsidiary at date of acquisition - 7,974 - Capital expenditures (23,132) (27,498) (24,565) Proceeds from sale of property and equipment 105 14 18 Intangible assets - (502) (484)
Cash used in investing activities (23,027) (102,012) (25,031)
Financing Proceeds from issuance of debt - - 47,910 Proceeds from IPO, net - 134,314 - Financing fees paid - (1,396) - Repurchase of common shares (9,755) - - Repayment of debt (48,052) (239,307) (3,006) Participant equity loan plan, net 31 8,251 (10,210) Common shares issued - - 12,136
Cash (used in) provided by financing activities (57,776) (98,138) 46,830
Effect of exchange rate changes on cash and cash equivalents (330) 4,038 11,806
Net (decrease) increase in cash and cash equivalents (23,490) (111,144) 193,114 Cash and cash equivalents, beginning of year 119,025 230,169 37,055
Cash and cash equivalents, end of year $ 95,535 $ 119,025 $ 230,169
Cash and cash equivalents are comprised as follows Cash $ 19,421 $ 10,662 $ 7,080 Short-term investments 76,114 108,363 223,089
$ 95,535 $ 119,025 $ 230,169
Supplemental cash flow disclosures Interest paid $ 12,182 $ 29,721 $ 26,328 Interest received 536 574 169 Income taxes paid 30,052 38,674 4,334 Amount of non-cash capital additions in accounts payable and
accrued and other current liabilities 1,975 4,368 2,793
See accompanying notes to consolidated financial statements

SMART Technologies Inc. Notes to Consolidated Financial Statements (thousands of U.S. dollars, except per share amounts, and except as otherwise indicated) For the years ended March 31, 2012, 2011 and 2010
Page 9
Nature of business SMART Technologies Inc. (the “Company”), formerly SMART Technologies (Holdings) Inc., was incorporated on June 11, 2007 under the Business Corporations Act (Alberta). On August 28, 2007 the shareholders of a related company which was then named SMART Technologies Inc. (“STI”), transferred 100% of the issued shares of STI to the Company. Prior to August 28, 2007 the principal operating company was STI. On August 28, 2007, SMART Technologies ULC was formed with the amalgamation of STI and a numbered company. On February 26, 2010 the Company changed its name to SMART Technologies Inc. Through its wholly owned subsidiary, SMART Technologies ULC (“ULC”), and its subsidiaries, the Company designs, develops and sells interactive technology products and integrated solutions that enhance learning and enable people to collaborate with each other in innovative and effective ways. The Company is the global leader in the interactive display category, which is the core of its collaboration solutions. It generates revenue from the sale of interactive technology products and integrated solutions, including hardware, software and services. 1. Basis of presentation and significant accounting policies
The consolidated financial statements of the Company have been prepared by management in accordance with accounting principles generally accepted in the United States of America (“GAAP”), applied on a basis consistent for all periods. All normal recurring adjustments considered necessary for fair presentation have been included in the financial statements. The significant accounting policies used in these GAAP consolidated financial statements are as follows. (a) Principles of consolidation
These consolidated financial statements include the accounts of the Company and its subsidiaries, all of which are wholly owned. All intercompany balances and transactions have been appropriately eliminated on consolidation.
(b) Use of estimates
The preparation of the consolidated financial statements requires management to make estimates and assumptions that affect the reported amounts of assets and liabilities and disclosures of contingent assets and liabilities at the date of the financial statements and reported amounts of revenues and expenses during the reporting period. Significant areas requiring the use of management estimates relate to the determination of provisions for various litigation claims, deferred revenue, allowance for doubtful receivables, inventory valuation, warranty provisions, sales incentive provisions, restructuring provisions, fair value of assets acquired and liabilities assumed in business combinations, deferred income taxes, valuation of derivative financial instruments and impairment assessments of property and equipment, intangible assets and goodwill. Actual results could differ from these estimates.
(c) Foreign currency translation
The Company’s Canadian operations and its foreign subsidiaries, which solely provide marketing support, use the Canadian dollar (“CDN”) as their functional currency. For these entities, monetary assets and liabilities denominated in foreign currencies are translated using exchange rates in effect at the balance sheet date and non-monetary assets and liabilities denominated in foreign currencies are translated at historic rates. Gains and losses on re-measurement are recorded in the Company’s consolidated statements of operations as part of foreign exchange loss (gain). The Company’s United States (“U.S.”) and New Zealand operating subsidiaries have the U.S. dollar as their functional currency and its Japanese
SMART Technologies Inc. Notes to Consolidated Financial Statements (thousands of U.S. dollars, except per share amounts, and except as otherwise indicated) For the years ended March 31, 2012, 2011 and 2010
Page 10
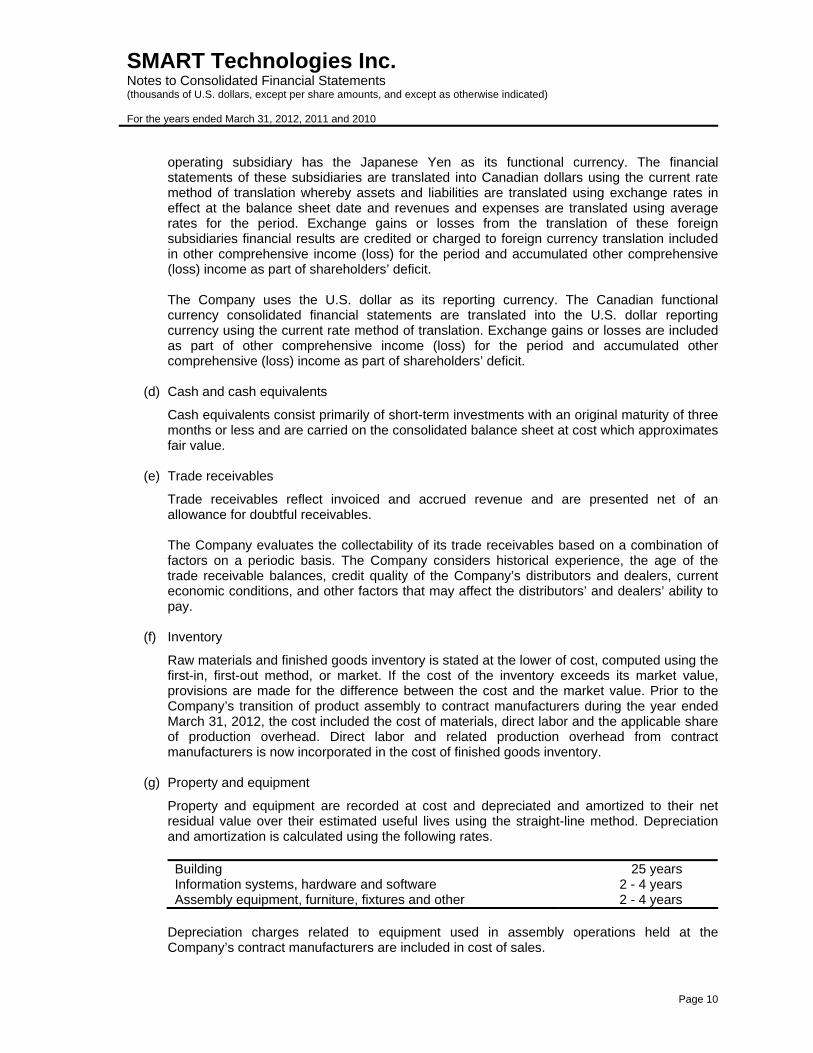
operating subsidiary has the Japanese Yen as its functional currency. The financial statements of these subsidiaries are translated into Canadian dollars using the current rate method of translation whereby assets and liabilities are translated using exchange rates in effect at the balance sheet date and revenues and expenses are translated using average rates for the period. Exchange gains or losses from the translation of these foreign subsidiaries financial results are credited or charged to foreign currency translation included in other comprehensive income (loss) for the period and accumulated other comprehensive (loss) income as part of shareholders’ deficit. The Company uses the U.S. dollar as its reporting currency. The Canadian functional currency consolidated financial statements are translated into the U.S. dollar reporting currency using the current rate method of translation. Exchange gains or losses are included as part of other comprehensive income (loss) for the period and accumulated other comprehensive (loss) income as part of shareholders’ deficit.
(d) Cash and cash equivalents
Cash equivalents consist primarily of short-term investments with an original maturity of three months or less and are carried on the consolidated balance sheet at cost which approximates fair value.
(e) Trade receivables
Trade receivables reflect invoiced and accrued revenue and are presented net of an allowance for doubtful receivables. The Company evaluates the collectability of its trade receivables based on a combination of factors on a periodic basis. The Company considers historical experience, the age of the trade receivable balances, credit quality of the Company’s distributors and dealers, current economic conditions, and other factors that may affect the distributors’ and dealers’ ability to pay.
(f) Inventory
Raw materials and finished goods inventory is stated at the lower of cost, computed using the first-in, first-out method, or market. If the cost of the inventory exceeds its market value, provisions are made for the difference between the cost and the market value. Prior to the Company’s transition of product assembly to contract manufacturers during the year ended March 31, 2012, the cost included the cost of materials, direct labor and the applicable share of production overhead. Direct labor and related production overhead from contract manufacturers is now incorporated in the cost of finished goods inventory.
(g) Property and equipment
Property and equipment are recorded at cost and depreciated and amortized to their net residual value over their estimated useful lives using the straight-line method. Depreciation and amortization is calculated using the following rates. Building 25 years Information systems, hardware and software 2 - 4 years Assembly equipment, furniture, fixtures and other 2 - 4 years
Depreciation charges related to equipment used in assembly operations held at the Company’s contract manufacturers are included in cost of sales.
SMART Technologies Inc. Notes to Consolidated Financial Statements (thousands of U.S. dollars, except per share amounts, and except as otherwise indicated) For the years ended March 31, 2012, 2011 and 2010
Page 11
Property and equipment are reviewed for impairment whenever events or changes in circumstances indicate that the carrying value may not be recoverable. In reviewing for impairment, the carrying value of such assets is compared to the estimated undiscounted future cash flows expected from the use of the assets and their eventual disposition. Any impairment charge is recognized to reduce the carrying value of the assets to its estimated fair value in the period in which it is identified.
(h) Intangible assets
Intangible assets are stated at cost less accumulated amortization and are comprised of acquired technology, customer relationships and other intellectual property. Intangible assets are amortized as follows. Acquired technology 5 - 10 years Customer relationships 5 years Other intellectual property 5 - 10 years
Intangibles with determinable lives are amortized using the straight-line method based on the estimated useful lives of the respective assets. When there is a change in the estimated useful life of a finite-lived intangible asset, amortization is adjusted prospectively. Intangible assets with finite lives are tested for impairment if events or conditions have occurred that indicate that their carrying value may not be recoverable. Any impairment charge is recognized to reduce the carrying value of the intangible asset to its estimated fair value in the period in which such determination is made.
(i) Goodwill
Goodwill is the residual amount that results when the purchase price of an acquired business exceeds the sum of the amounts allocated to the assets acquired, less liabilities assumed, based on their fair values. Goodwill is not amortized, but is tested for impairment annually or more frequently if events or changes in circumstances indicate that the asset might be impaired. The Company consists of a single reporting unit. The impairment test is carried out in two steps. In the first step, the carrying amount of the reporting unit is compared with its fair value. If the carrying amount is greater than zero and its fair value exceeds its carrying amount, goodwill is considered not to be impaired and the second step of the impairment test is unnecessary. The second step is carried out when the carrying amount exceeds its fair value, in which case the implied fair value of the goodwill is compared with its carrying amount to measure the amount of the impairment loss, if any. If the carrying amount is zero or negative, the second step of the impairment test is performed when it is more likely than not that a goodwill impairment exists. In the second step, the implied fair value of goodwill is determined in a similar manner as the value of goodwill is determined in a business combination, using the fair value as if it was the purchase price. The implied fair value of goodwill is calculated by measuring the excess of the estimated fair value of the Company over the aggregated estimated fair values of identifiable assets and liabilities. The conduct of the second step involves significant judgment on the selection of assumptions necessary to arrive at an implied fair value of goodwill. These assumptions include, but are not limited to, development of multi-year business cash flow forecasts, the selection of discount rates and the identification and valuation of unrecorded assets. When the carrying amount of the goodwill exceeds the
SMART Technologies Inc. Notes to Consolidated Financial Statements (thousands of U.S. dollars, except per share amounts, and except as otherwise indicated) For the years ended March 31, 2012, 2011 and 2010
Page 12
implied fair value of the goodwill, an impairment loss is recognized in an amount equal to the excess.
(j) Business combinations
The Company accounts for business combinations using the acquisition method of accounting, and accordingly, the assets and liabilities of the acquired business are recorded at their fair values at the date of acquisition. The excess of the fair value of consideration transferred over the estimated fair values is recorded as goodwill. Any changes in the estimated fair values of the net assets recorded for acquisitions prior to the finalization of more detailed analysis, but not to exceed one year from the date of acquisition, will change the amount of goodwill recorded. All acquisition costs are expensed as incurred and in-process research and development costs are recorded at fair value as an indefinite-lived intangible asset and assessed for impairment thereafter until completion, at which point the asset is amortized over its expected useful life. The results of operations of acquired businesses are included in the consolidated financial statements from the acquisition date.
(k) Deferred financing fees
Deferred financing fees represent the direct costs of entering into the Company’s long-term debt and credit facilities. For non-revolving credit facilities, costs are amortized as interest expense using the effective interest method. For revolving credit facilities, costs are amortized as interest expense using the straight-line method. The deferred financing fees are amortized over the term of the debt or credit facilities.
(l) Revenue recognition
The Company recognizes revenue when persuasive evidence of an arrangement exists, shipping occurs or services are rendered, the sales price is fixed or determinable and collection is reasonably assured. Revenue consists primarily of consideration from the bundled sale of hardware, software that is essential to the functionality of the hardware and technical support. Revenue from the bundled sale of hardware, software and technical support is recognized in accordance with general revenue recognition accounting guidance and revenue from separate sales of software products and technical support is recognized in accordance with industry specific software revenue recognition accounting guidance. Amounts invoiced and cash received in advance of meeting these revenue recognition criteria are recognized as deferred revenue. The Company offers certain incentives to customers based on purchase levels. These incentives are recorded as a reduction of related revenues when this revenue is recognized. Revenue is recorded net of taxes collected from customers that are remitted to government authorities with the collected taxes recorded as current liabilities until remitted to the relevant government authority. The Company’s arrangements do not include any provisions for refunds. Revenue recognition for arrangements with multiple deliverables
For multi-element arrangements that include tangible products containing software essential to the product’s functionality and undelivered elements relating to the tangible product and its essential software, the Company allocates revenue to the multiple deliverables based on their relative selling prices. To determine the relative selling price the following hierarchy is used.
(i) vendor-specific objective evidence of fair value (“VSOE”);
SMART Technologies Inc. Notes to Consolidated Financial Statements (thousands of U.S. dollars, except per share amounts, and except as otherwise indicated) For the years ended March 31, 2012, 2011 and 2010
Page 13
(ii) third-party evidence (“TPE”); and (iii) estimate of the selling price (“ESP”).
VSOE is established as the price charged for a deliverable when the same deliverable is sold separately by the Company. TPE of selling price is established by evaluating largely similar and interchangeable competitor products or services in stand-alone sales to similarly situated customers. The ESP is established considering internal factors such as internal costs, margin objectives, pricing practices and controls, customer and market conditions such as competitor pricing strategies for similar products, and industry data. Substantially all the Company’s revenue is made up of the sales of interactive displays and accessories. The interactive displays consist of hardware products and software essential to the functionality of the hardware product that is delivered at the time of sale, and technical support for the life of the product, which includes future unspecified software upgrades and features relating to the product’s essential software to be received, on a when-and-if-available basis. The Company has allocated revenue between these deliverables using the relative selling price method. The Company assesses incentives and discounts provided to customers in determining the relative selling prices of the deliverables in its arrangements to determine the most appropriate method of allocating such incentives and discounts to such deliverables. In general, the Company has concluded that allocating such incentives and discounts ratably to the deliverables based on the proportion of arrangement consideration allocated to each is appropriate based upon the way the Company currently sells its product. The Company is unable to determine VSOE for its deliverables as they are not sold on a separate, stand-alone basis. The Company’s go-to-market strategy is the same or similar to that of its peers for these deliverables, in that product offerings are made in multiple deliverable bundles, such that the TPE of selling price of stand-alone deliverables cannot be obtained. Consequently, the Company is unable to establish selling price using VSOE or TPE and therefore uses ESP in its allocation of revenue. Amounts allocated to the delivered hardware and the related essential software is recognized at the time of sale provided all the conditions for revenue recognition have been met. Amounts allocated to the technical support services and unspecified software upgrades are deferred and recognized using the straight-line method over the estimated life of the related hardware of seven years. All product cost of sales, including estimated warranty costs, are recognized at the time of sale. Costs for research and development, sales and marketing are expensed as incurred. Revenue recognition for software The Company also sells software, technical support and unspecified software upgrade rights altogether separate from hardware. For software arrangements involving multiple elements, revenue is allocated to each element based on the relative fair value only if VSOE evidence of fair values, which is based on prices charged when the element is sold separately, is available. The Company does not have VSOE for the undelivered elements in its software sales and, accordingly, the entire arrangement consideration is deferred and amortized over three years, the estimated period that such items are delivered or that services are provided.
(m) Comprehensive income (loss)
Comprehensive income (loss) is comprised of net income and other comprehensive income (loss) (“OCI”).

SMART Technologies Inc. Notes to Consolidated Financial Statements (thousands of U.S. dollars, except per share amounts, and except as otherwise indicated) For the years ended March 31, 2012, 2011 and 2010
Page 14
OCI refers to revenues, expenses, gains and losses that under GAAP are recorded as an element of comprehensive income but are excluded from net income. OCI consists of foreign currency translation adjustments for the period which arise from the conversion of the Canadian dollar functional currency consolidated financial statements to the U.S. dollar reporting currency consolidated financial statements. OCI also includes foreign currency translation adjustments from those foreign subsidiaries that have a local currency as their functional currency and arising on translation of the Company’s consolidated financial statement into their reporting currency.
(n) Financial instruments
Derivative financial instruments are used by the Company to manage its exposure to interest and foreign exchange rate fluctuations. To manage interest rate exposure, the Company enters into interest rate swap contracts and to manage foreign exchange exposure, the Company enters into forward and foreign exchange collar contracts. The Company does not use derivative financial instruments for speculative purposes. Financial Accounting Standards Board (“FASB”) ASC 815 - Accounting for Derivative Instruments requires all derivative financial instruments to be recognized at fair value on the consolidated balance sheet and outlines the criteria to be met in order to designate a derivative instrument as a hedge and the methods for evaluating hedge effectiveness. The fair value is calculated based on quoted market prices. Derivative contracts that do not qualify as hedges under ASC 815, or where hedge accounting is not applied, are recorded at fair value in the consolidated balance sheet unless exempted from derivative treatment as meeting normal purchase and sale criteria. Any changes in the fair value of these derivative contracts are recorded in net income when those changes occur. The Company does not currently apply hedge accounting as defined by ASC 815 to any of its financial instruments.
(o) Income taxes
In accordance with FASB ASC 740 - Accounting for Income Taxes, the Company uses the liability method of accounting for income taxes. Under the liability method, current income taxes are recognized for the estimated income taxes payable for the current year and deferred income taxes are recognized for temporary differences between the tax and accounting bases of assets and liabilities and the benefit of losses and other deductions carried forward for tax purposes that are likely to be realized. A valuation allowance is recorded against net deferred income tax assets if it is more likely than not that the asset will not be realized. Deferred income tax assets and liabilities are measured using enacted tax rates expected to apply to taxable income in the years in which the temporary differences are scheduled to be recovered or settled. The effect on the deferred income tax assets and liabilities from a change in tax rates is recognized in net income in the period that the change is enacted. The Company follows ASC 740 in assessing its uncertain tax positions and provisions for income taxes which clarifies the accounting for uncertainty in income taxes recognized in an enterprise’s financial statements, prescribes a recognition threshold of more likely than not to be sustained upon examination and provides guidance on derecognition measurement classification, interest and penalties, accounting in interim periods, disclosure and transitions.
(p) Investment tax credits
The Company uses the flow-through method to account for investment tax credits (“ITCs”), earned on eligible Scientific Research and Experimental Development (“SR&ED”)

SMART Technologies Inc. Notes to Consolidated Financial Statements (thousands of U.S. dollars, except per share amounts, and except as otherwise indicated) For the years ended March 31, 2012, 2011 and 2010
Page 15
expenditures. Under this method, the ITCs are recognized as a reduction to income tax expense (recovery). ITCs are subject to technical and financial review by Canadian tax authorities on a project-by-project basis and therefore amounts received may vary significantly from the amounts recorded. Any such differences are recorded as an adjustment to the recognized amount in the year the SR&ED review is completed and the results are made known to the Company.
(q) Research and product development costs
Research costs are expensed as incurred. Development costs for products and licensed software to be sold, leased or otherwise marketed are subject to capitalization beginning when a product’s technological feasibility has been established and ending when a product is available for general release to customers. In most instances, the Company’s products are released soon after technological feasibility has been established. Costs incurred subsequent to achievement of technological feasibility are usually not significant, and therefore most product development costs are expensed as incurred.
(r) Earnings per share
Per share amounts are based on the weighted-average number of common shares outstanding during the period. Diluted earnings per share are calculated using the treasury stock method.
(s) Warranty provision
The Company provides for the estimated costs of product warranties at the time revenue is recognized. Interactive displays and other hardware products are generally covered by a time-limited warranty for varying periods of time. The Company’s warranty obligation is affected by product failure rates, warranty periods, freight, material usage and other related repair or replacement costs. The Company assesses the adequacy of its warranty liability and adjusts the amount as necessary based on actual experience and changes in future estimated costs.
(t) Stock-based compensation
Stock-based compensation expense for stock options is estimated at the grant date based on each option’s fair value as calculated by the Black-Scholes-Merton (“BSM”) option-pricing model. The Company generally recognizes stock-based compensation expense ratably using the straight-line method over the requisite service period with an offset to additional paid-in capital. The BSM model requires various judgmental assumptions including volatility and expected option life. In addition, judgment is also applied in estimating the amount of stock-based awards that are expected to be forfeited, and if actual results differ significantly from these estimates, stock-based compensation expense and the Company’s results of operations would be impacted. Any consideration paid by employees on exercise of stock options plus any recorded stock-based compensation within additional paid-in capital related to that stock option is credited to share capital. The Company classifies Restricted share units (“RSUs”), Performance share units (“PSUs”) and Deferred share units (“DSUs”) as equity instruments as the Company has the ability to settle the awards in common shares. The compensation expense is calculated based on the fair value of each instrument as determined by the closing value of the Company’s common shares on the business day of the grant date. The Company recognizes compensation expense ratably over the vesting period of the RSUs and PSUs. For DSUs, compensation expense is recorded at the date of grant.
SMART Technologies Inc. Notes to Consolidated Financial Statements (thousands of U.S. dollars, except per share amounts, and except as otherwise indicated) For the years ended March 31, 2012, 2011 and 2010
Page 16
(u) Participant equity loan plan
The Company has a Participant Equity Loan Plan (the “Plan”), under which the Company loaned funds to certain employees for the purpose of allowing these employees the opportunity to purchase common shares of the Company at fair value. Common shares issued under the Plan are subject to voting and transferability restrictions that lapse based on certain events. Shares purchased under the Plan are reported as share capital at their fair value on the date of issue. The outstanding related employee loans and accrued interest are reported as a deduction from share capital. When there is an amendment in the terms of the Plan, the difference between the fair value at the date of the amendment and the fair value at the original date of purchase is recognized as stock-based compensation ratably on a graded basis over the period that restrictions on the shares lapse.
(v) Restructuring costs
Employee termination benefits associated with an exit or disposal activity are accrued when the liability is both probable and reasonably estimable provided that the Company has a history of providing similar severance benefits that meet the criteria of an on-going benefit arrangement. If no such history exists, the costs are expensed when the termination benefits are paid. Contract termination costs are recognized and measured at fair value when the Company ceases using the rights under the contract. Other associated costs are recognized and measured at fair value when they are incurred.
(w) Recent accounting policies adopted
In December 2010, the FASB issued authoritative guidance to modify the first step of the goodwill impairment test for reporting units with zero or negative carrying amounts. For those reporting units, the second step of the goodwill impairment test is required to be performed if it is more likely than not that a goodwill impairment exists. This new authoritative guidance became effective for fiscal years, and interim periods within those years, beginning after December 15, 2011. The Company adopted the guidance in the first quarter of fiscal 2012 and applied these principles to its goodwill impairment assessment in fiscal 2012. In January 2010, the FASB issued revised guidance intended to improve disclosures related to fair value measurements. This guidance requires new disclosures as well as clarifies certain existing disclosure requirements. New disclosures under this guidance require separate information about significant transfers in and out of Level 1 and Level 2 and the reason for such transfers, and also require purchases, sales, issuances, and settlements information for Level 3 measurement to be included in the roll-forward activity on a gross basis. The guidance also clarifies the requirement to determine the level of disaggregation for fair value measurement disclosures and the requirement to disclose valuation techniques and inputs used for both recurring and nonrecurring fair value measurements in either Level 2 or Level 3. This accounting guidance became effective for the Company beginning in the first quarter of fiscal 2011, except for the roll-forward of activity on a gross basis for Level 3 fair value measurement, which was effective for the Company in the first quarter of fiscal 2012. The adoption of the remaining guidance in the first quarter of fiscal 2012 did not have a material impact on the Company’s disclosures. In May 2011, the FASB, as a result of work performed with the International Accounting Standards Board (“IASB”), issued authoritative guidance to achieve common fair value measurement and disclosure requirements in U.S. GAAP and International Financial Reporting Standards (“IFRS”). The guidance is expected to improve the comparability of fair value measurements presented and disclosed in financial statements prepared in accordance

SMART Technologies Inc. Notes to Consolidated Financial Statements (thousands of U.S. dollars, except per share amounts, and except as otherwise indicated) For the years ended March 31, 2012, 2011 and 2010
Page 17
with U.S. GAAP and IFRS. The guidance presents certain amendments to clarify existing fair value measurements and disclosure requirements such as clarifying the application of the highest and best use and valuation premise concepts, measuring the fair value of an instrument classified in a reporting entity’s shareholders’ equity and clarifying that a reporting entity should disclose quantitative information about the unobservable inputs used in a fair value measurement that is categorized within Level 3 of the fair value hierarchy. Furthermore, the guidance amends previous literature by requiring additional disclosures about fair value measurements, specifically requesting additional information about the valuation processes used for fair value measurements categorized within Level 3 of the fair value hierarchy as well as presenting sensitivity of the fair value measurements to changes in unobservable inputs in Level 3 valuations. The guidance also amends previous literature around measuring the fair value of financial instruments that are managed within a portfolio as well as the application of premiums and discounts in a fair value measurement. The new authoritative guidance became effective for interim and annual periods beginning after December 15, 2011. The adoption of the guidance in the fourth quarter of fiscal 2012 did not have a material impact on the Company’s results of operations, financial condition or disclosures.
(x) Recently issued pronouncements
In June 2011, the FASB issued authoritative guidance to improve the comparability, consistency and transparency of financial reporting and to increase the prominence of other comprehensive income in financial statements. The guidance presents amendments requiring total comprehensive income, the components of net income, and the components of other comprehensive income to be presented either in a single continuous statement of comprehensive income or in two separate but consecutive statements. The guidance also requires that reclassification adjustments for items that are reclassified from other comprehensive income to net income be presented on the face of the financial statements. In December 2011, the FASB issued authoritative guidance to defer the new requirement to present components of reclassifications of other comprehensive income on the face of the income statement. The new authoritative guidance is effective for fiscal years, and interim periods within those years, beginning after December 15, 2011, and should be applied retrospectively. The Company will adopt the guidance in the first quarter of fiscal 2013 and does not expect the adoption to have a material impact on the Company’s results of operations or financial condition. In September 2011, the FASB issued authoritative guidance to simplify how entities test goodwill for impairment. The amendment will allow an entity to first assess qualitative factors to determine whether it is necessary to perform the two-step quantitative goodwill impairment test. An entity will no longer be required to calculate the fair value of a reporting unit unless the entity determines, based on a qualitative assessment, that it is more likely than not that its fair value is less than its carrying amount. The new authoritative guidance is effective for annual and interim goodwill impairment tests performed for fiscal years beginning after December 15, 2011 and early adoption is permitted. The Company will adopt the guidance in the first quarter of fiscal 2013 and does not expect the adoption to have a material impact on the Company’s results of operations, financial condition or disclosures.
2. 2010 Acquisition
On April 21, 2010, the Company acquired 100% of the issued and outstanding shares of Next Holdings Limited (“NextWindow”), a privately held New Zealand company, for $82,000 in cash.
The acquisition was accounted for using the acquisition method whereby identifiable assets acquired and liabilities assumed were measured at their fair values as of the date of acquisition. The excess of the acquisition price over such fair value was recorded as goodwill on acquisition. Fair values were determined based on information available at the date of acquisition. The
SMART Technologies Inc. Notes to Consolidated Financial Statements (thousands of U.S. dollars, except per share amounts, and except as otherwise indicated) For the years ended March 31, 2012, 2011 and 2010
Page 18
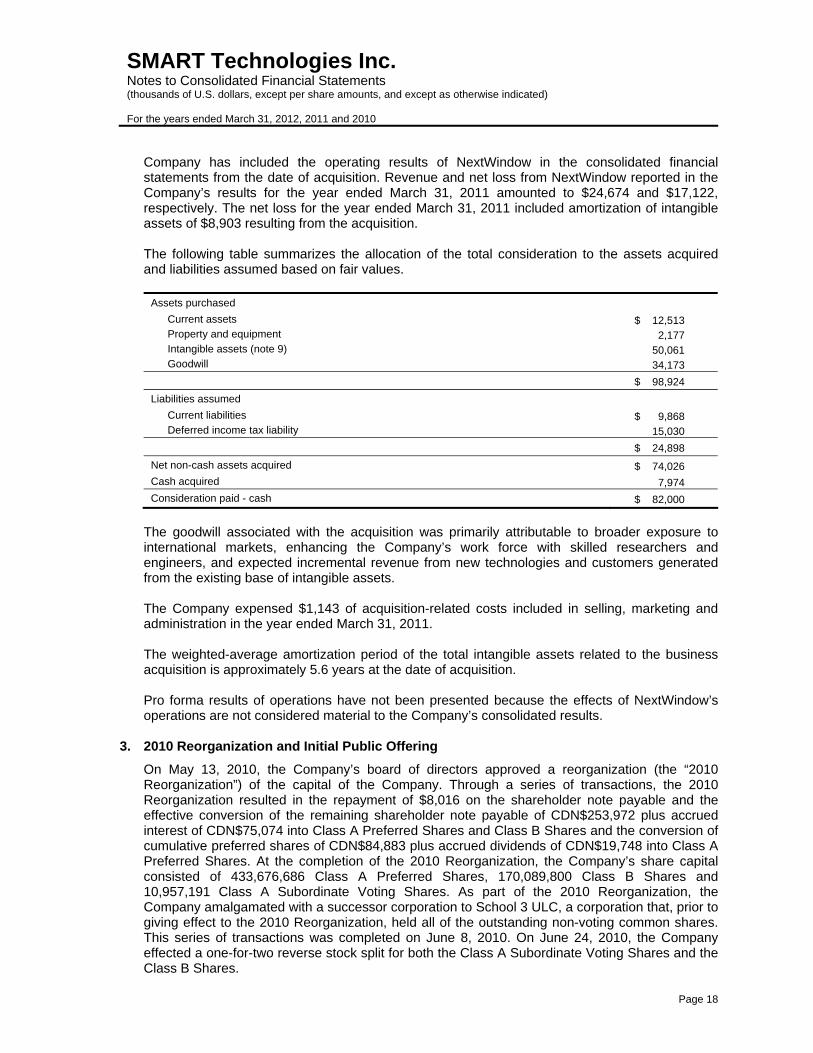
Company has included the operating results of NextWindow in the consolidated financial statements from the date of acquisition. Revenue and net loss from NextWindow reported in the Company’s results for the year ended March 31, 2011 amounted to $24,674 and $17,122, respectively. The net loss for the year ended March 31, 2011 included amortization of intangible assets of $8,903 resulting from the acquisition. The following table summarizes the allocation of the total consideration to the assets acquired and liabilities assumed based on fair values.
Assets purchased
Current assets $ 12,513 Property and equipment 2,177 Intangible assets (note 9) 50,061 Goodwill 34,173
$ 98,924
Liabilities assumed
Current liabilities $ 9,868 Deferred income tax liability 15,030
$ 24,898
Net non-cash assets acquired $ 74,026
Cash acquired 7,974
Consideration paid - cash $ 82,000
The goodwill associated with the acquisition was primarily attributable to broader exposure to international markets, enhancing the Company’s work force with skilled researchers and engineers, and expected incremental revenue from new technologies and customers generated from the existing base of intangible assets. The Company expensed $1,143 of acquisition-related costs included in selling, marketing and administration in the year ended March 31, 2011. The weighted-average amortization period of the total intangible assets related to the business acquisition is approximately 5.6 years at the date of acquisition. Pro forma results of operations have not been presented because the effects of NextWindow’s operations are not considered material to the Company’s consolidated results.
3. 2010 Reorganization and Initial Public Offering
On May 13, 2010, the Company’s board of directors approved a reorganization (the “2010 Reorganization”) of the capital of the Company. Through a series of transactions, the 2010 Reorganization resulted in the repayment of $8,016 on the shareholder note payable and the effective conversion of the remaining shareholder note payable of CDN$253,972 plus accrued interest of CDN$75,074 into Class A Preferred Shares and Class B Shares and the conversion of cumulative preferred shares of CDN$84,883 plus accrued dividends of CDN$19,748 into Class A Preferred Shares. At the completion of the 2010 Reorganization, the Company’s share capital consisted of 433,676,686 Class A Preferred Shares, 170,089,800 Class B Shares and 10,957,191 Class A Subordinate Voting Shares. As part of the 2010 Reorganization, the Company amalgamated with a successor corporation to School 3 ULC, a corporation that, prior to giving effect to the 2010 Reorganization, held all of the outstanding non-voting common shares. This series of transactions was completed on June 8, 2010. On June 24, 2010, the Company effected a one-for-two reverse stock split for both the Class A Subordinate Voting Shares and the Class B Shares.
SMART Technologies Inc. Notes to Consolidated Financial Statements (thousands of U.S. dollars, except per share amounts, and except as otherwise indicated) For the years ended March 31, 2012, 2011 and 2010
Page 19
In July 2010, in connection with the Company’s initial public offering (“IPO”) transaction, all the issued and outstanding Class A Preferred Shares were converted into Class B or Class A Subordinate Voting Shares and the Class A Preferred Shares were removed from the authorized share capital of the Company and the Company issued Class A Subordinate Voting Shares from Treasury. After giving effect to the IPO, the Company had 44,308,596 Class A Subordinate Voting Shares and 79,464,195 Class B Shares outstanding. Using the proceeds of the IPO, the Company repaid $40,000 of the unsecured term loan and $19,244 of the term construction facility in July 2010. In September 2010, the remaining balances of the unsecured term loan, the term construction facility and the construction loan of $42,389, $29,836 and $1,438, respectively, were repaid in full.
4. Restructuring costs
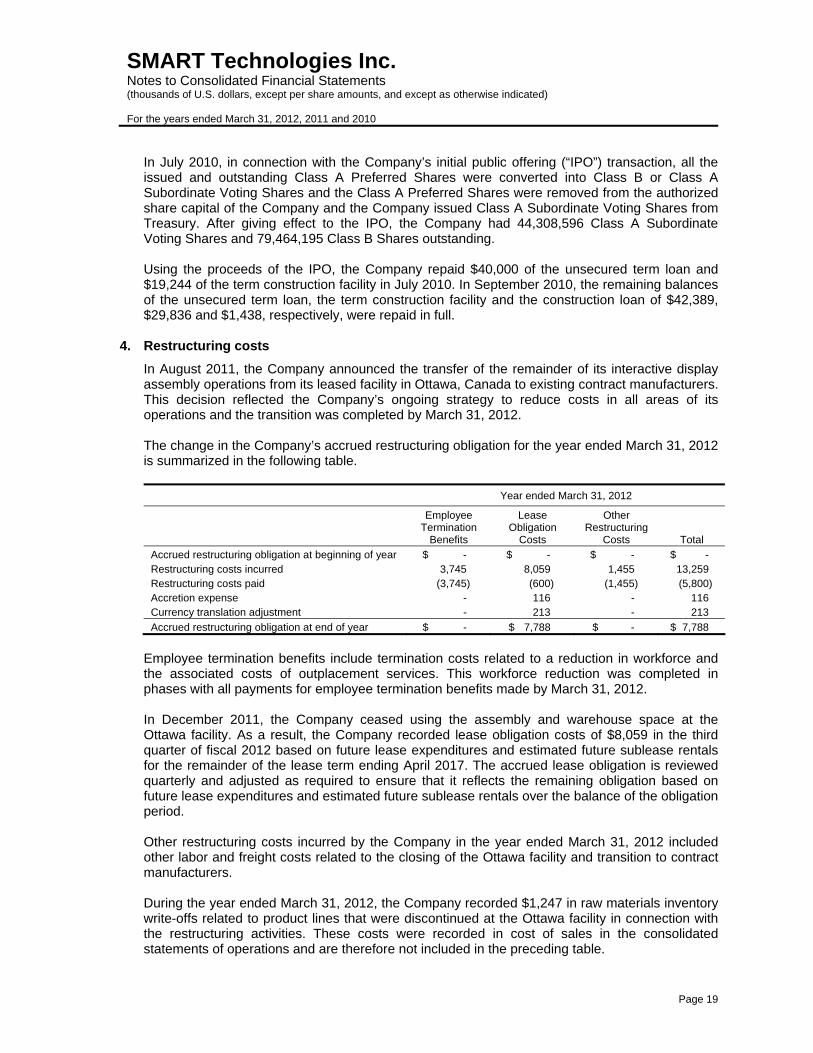
In August 2011, the Company announced the transfer of the remainder of its interactive display assembly operations from its leased facility in Ottawa, Canada to existing contract manufacturers. This decision reflected the Company’s ongoing strategy to reduce costs in all areas of its operations and the transition was completed by March 31, 2012. The change in the Company’s accrued restructuring obligation for the year ended March 31, 2012 is summarized in the following table.
Year ended March 31, 2012
Employee Termination
Benefits
Lease Obligation
Costs
Other Restructuring
Costs Total
Accrued restructuring obligation at beginning of year $ - $ - $ - $ - Restructuring costs incurred 3,745 8,059 1,455 13,259 Restructuring costs paid (3,745) (600) (1,455) (5,800) Accretion expense - 116 - 116 Currency translation adjustment - 213 - 213
Accrued restructuring obligation at end of year $ - $ 7,788 $ - $ 7,788
Employee termination benefits include termination costs related to a reduction in workforce and the associated costs of outplacement services. This workforce reduction was completed in phases with all payments for employee termination benefits made by March 31, 2012. In December 2011, the Company ceased using the assembly and warehouse space at the Ottawa facility. As a result, the Company recorded lease obligation costs of $8,059 in the third quarter of fiscal 2012 based on future lease expenditures and estimated future sublease rentals for the remainder of the lease term ending April 2017. The accrued lease obligation is reviewed quarterly and adjusted as required to ensure that it reflects the remaining obligation based on future lease expenditures and estimated future sublease rentals over the balance of the obligation period. Other restructuring costs incurred by the Company in the year ended March 31, 2012 included other labor and freight costs related to the closing of the Ottawa facility and transition to contract manufacturers. During the year ended March 31, 2012, the Company recorded $1,247 in raw materials inventory write-offs related to product lines that were discontinued at the Ottawa facility in connection with the restructuring activities. These costs were recorded in cost of sales in the consolidated statements of operations and are therefore not included in the preceding table.
SMART Technologies Inc. Notes to Consolidated Financial Statements (thousands of U.S. dollars, except per share amounts, and except as otherwise indicated) For the years ended March 31, 2012, 2011 and 2010
Page 20
At March 31, 2012, the current portion of the accrued restructuring obligation of $2,280 was included in accrued and other current liabilities with the remaining long-term portion of $5,508 included in other long-term liabilities.
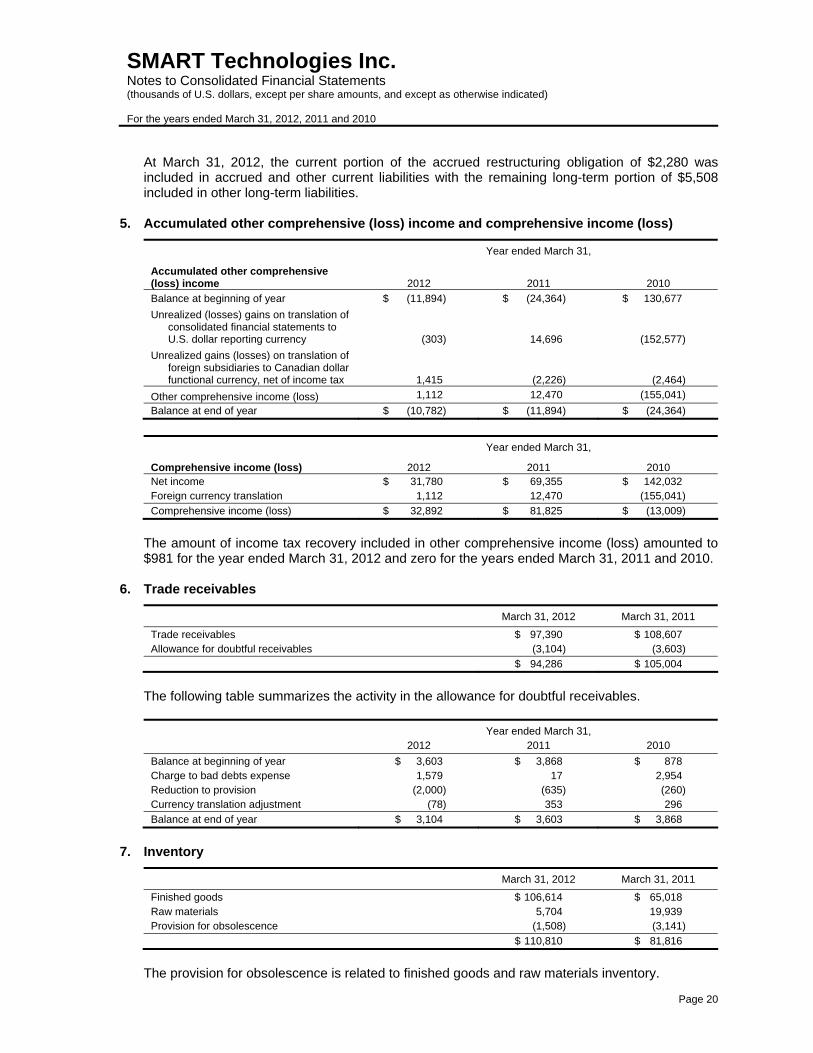
5. Accumulated other comprehensive (loss) income and comprehensive income (loss)
Year ended March 31,
Accumulated other comprehensive (loss) income 2012 2011 2010
Balance at beginning of year $ (11,894) $ (24,364) $ 130,677
Unrealized (losses) gains on translation of consolidated financial statements to U.S. dollar reporting currency (303) 14,696 (152,577)
Unrealized gains (losses) on translation of foreign subsidiaries to Canadian dollar functional currency, net of income tax 1,415 (2,226) (2,464)
Other comprehensive income (loss) 1,112 12,470 (155,041)
Balance at end of year $ (10,782) $ (11,894) $ (24,364)
Year ended March 31,
Comprehensive income (loss) 2012 2011 2010 Net income $ 31,780 $ 69,355 $ 142,032 Foreign currency translation 1,112 12,470 (155,041)
Comprehensive income (loss) $ 32,892 $ 81,825 $ (13,009)
The amount of income tax recovery included in other comprehensive income (loss) amounted to $981 for the year ended March 31, 2012 and zero for the years ended March 31, 2011 and 2010.
6. Trade receivables
March 31, 2012 March 31, 2011
Trade receivables $ 97,390 $ 108,607 Allowance for doubtful receivables (3,104) (3,603)
$ 94,286 $ 105,004
The following table summarizes the activity in the allowance for doubtful receivables.
Year ended March 31,
2012 2011 2010
Balance at beginning of year $ 3,603 $ 3,868 $ 878 Charge to bad debts expense 1,579 17 2,954 Reduction to provision (2,000) (635) (260) Currency translation adjustment (78) 353 296
Balance at end of year $ 3,104 $ 3,603 $ 3,868
7. Inventory
March 31, 2012 March 31, 2011
Finished goods $ 106,614 $ 65,018 Raw materials 5,704 19,939 Provision for obsolescence (1,508) (3,141)
$ 110,810 $ 81,816
The provision for obsolescence is related to finished goods and raw materials inventory.
SMART Technologies Inc. Notes to Consolidated Financial Statements (thousands of U.S. dollars, except per share amounts, and except as otherwise indicated) For the years ended March 31, 2012, 2011 and 2010
Page 21
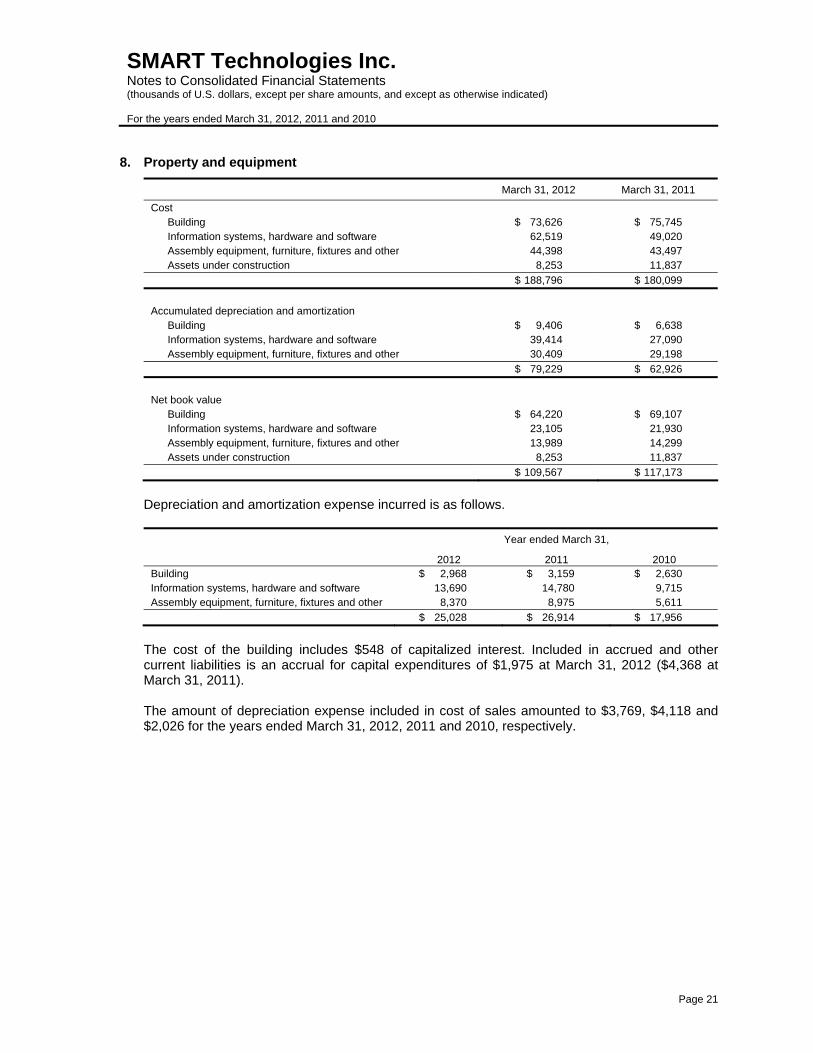
8. Property and equipment
March 31, 2012 March 31, 2011
Cost Building $ 73,626 $ 75,745 Information systems, hardware and software 62,519 49,020 Assembly equipment, furniture, fixtures and other 44,398 43,497 Assets under construction 8,253 11,837
$ 188,796 $ 180,099
Accumulated depreciation and amortization
Building $ 9,406 $ 6,638 Information systems, hardware and software 39,414 27,090 Assembly equipment, furniture, fixtures and other 30,409 29,198
$ 79,229 $ 62,926
Net book value
Building $ 64,220 $ 69,107 Information systems, hardware and software 23,105 21,930 Assembly equipment, furniture, fixtures and other 13,989 14,299 Assets under construction 8,253 11,837
$ 109,567 $ 117,173
Depreciation and amortization expense incurred is as follows.
Year ended March 31,
2012 2011 2010 Building $ 2,968 $ 3,159 $ 2,630 Information systems, hardware and software 13,690 14,780 9,715 Assembly equipment, furniture, fixtures and other 8,370 8,975 5,611
$ 25,028 $ 26,914 $ 17,956
The cost of the building includes $548 of capitalized interest. Included in accrued and other current liabilities is an accrual for capital expenditures of $1,975 at March 31, 2012 ($4,368 at March 31, 2011). The amount of depreciation expense included in cost of sales amounted to $3,769, $4,118 and $2,026 for the years ended March 31, 2012, 2011 and 2010, respectively.
SMART Technologies Inc. Notes to Consolidated Financial Statements (thousands of U.S. dollars, except per share amounts, and except as otherwise indicated) For the years ended March 31, 2012, 2011 and 2010
Page 22
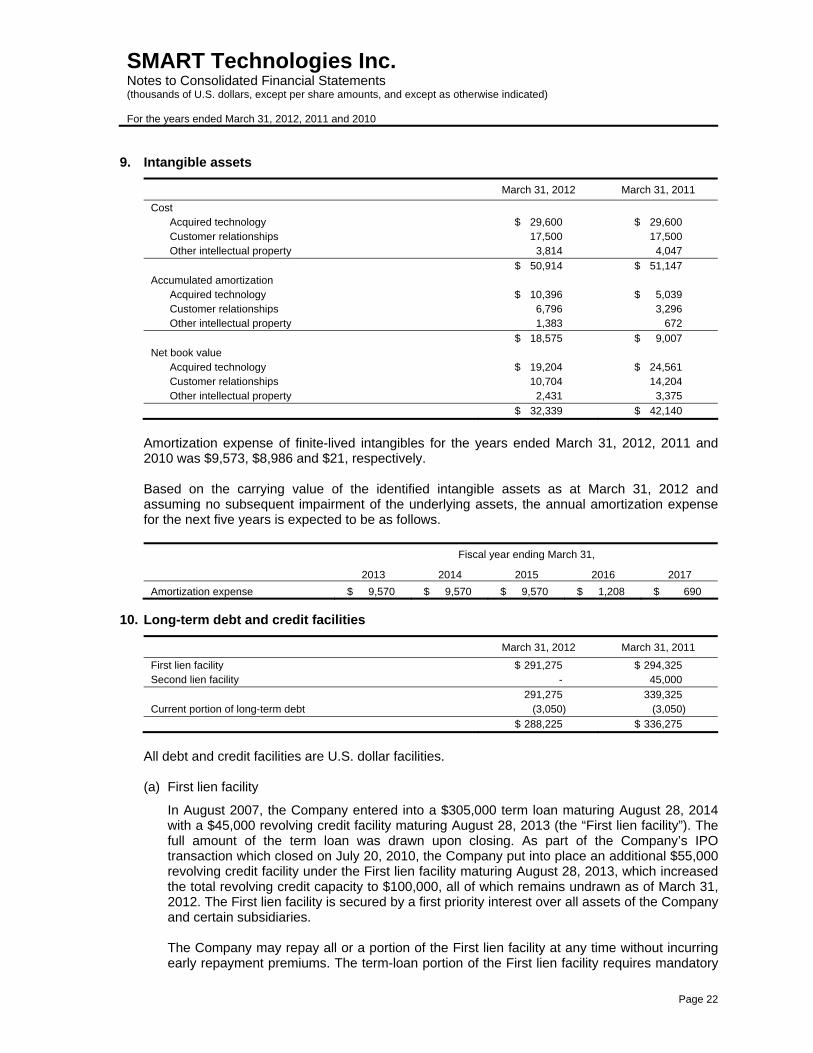
9. Intangible assets
March 31, 2012 March 31, 2011
Cost Acquired technology $ 29,600 $ 29,600 Customer relationships 17,500 17,500 Other intellectual property 3,814 4,047
$ 50,914 $ 51,147 Accumulated amortization Acquired technology $ 10,396 $ 5,039 Customer relationships 6,796 3,296 Other intellectual property 1,383 672
$ 18,575 $ 9,007 Net book value Acquired technology $ 19,204 $ 24,561 Customer relationships 10,704 14,204 Other intellectual property 2,431 3,375
$ 32,339 $ 42,140
Amortization expense of finite-lived intangibles for the years ended March 31, 2012, 2011 and 2010 was $9,573, $8,986 and $21, respectively. Based on the carrying value of the identified intangible assets as at March 31, 2012 and assuming no subsequent impairment of the underlying assets, the annual amortization expense for the next five years is expected to be as follows.
Fiscal year ending March 31,
2013 2014 2015 2016 2017
Amortization expense $ 9,570 $ 9,570 $ 9,570 $ 1,208 $ 690
10. Long-term debt and credit facilities
March 31, 2012 March 31, 2011
First lien facility $ 291,275 $ 294,325 Second lien facility - 45,000
291,275 339,325 Current portion of long-term debt (3,050) (3,050)
$ 288,225 $ 336,275
All debt and credit facilities are U.S. dollar facilities.
(a) First lien facility
In August 2007, the Company entered into a $305,000 term loan maturing August 28, 2014 with a $45,000 revolving credit facility maturing August 28, 2013 (the “First lien facility”). The full amount of the term loan was drawn upon closing. As part of the Company’s IPO transaction which closed on July 20, 2010, the Company put into place an additional $55,000 revolving credit facility under the First lien facility maturing August 28, 2013, which increased the total revolving credit capacity to $100,000, all of which remains undrawn as of March 31, 2012. The First lien facility is secured by a first priority interest over all assets of the Company and certain subsidiaries.
The Company may repay all or a portion of the First lien facility at any time without incurring early repayment premiums. The term-loan portion of the First lien facility requires mandatory

SMART Technologies Inc. Notes to Consolidated Financial Statements (thousands of U.S. dollars, except per share amounts, and except as otherwise indicated) For the years ended March 31, 2012, 2011 and 2010
Page 23
annual repayments totaling $3,050. In addition, beginning with the year ended March 31, 2009, the Company is required to repay amounts under the facility ranging between zero and 50% of annual excess cash flow, contingent upon the Company’s leverage ratio at the time. As of March 31, 2012, the leverage ratio was below the level required to trigger a repayment. Borrowings under the term loan bear interest at floating rates, based on LIBOR, the U.S. federal funds rate or the Canadian base rate of the administrative agent. Borrowings under the revolving credit facility bear interest at floating rates based on the banker’s acceptance rate, LIBOR, the U.S. federal funds rate, the Canadian base rate of the administrative agent or the Canadian prime rate. The Company has discretion with respect to the basis upon which interest rates are set. The interest rate on borrowings under the First lien facility term loan was 2.99% at March 31, 2012 and 3.10% at March 31, 2011. The interest rates on the undrawn credit facilities of $45,000 and $55,000 at March 31, 2012 were 2.24% and 3.99%, respectively. The Company had outstanding letters of credit totaling $973 at March 31, 2012 and $1,371 at March 31, 2011. These letters of credit have not been drawn; however, they reduce the amount available to the Company under the revolving portion of the First lien facility. The Company was in compliance with all financial covenants with respect to the facility at March 31, 2012. The facility has two financial covenants: a total leverage ratio test and an interest coverage ratio test. Compliance is tested quarterly and the Company has been in compliance with all covenants during all reporting periods since the inception of the loan.
(b) Second lien facility
In August 2007, the Company entered into an eight year, $100,000 term loan (the “Second lien facility”), which was fully drawn upon closing. In fiscal 2012, the remaining balance of $45,000 was repaid in full. No repayment premiums were charged.
(c) Deferred financing fees
The Company incurred fees of $13,090 in closing the First lien facility and the Second lien facility which have been recorded as deferred financing fees. These fees are shown as an asset and amortized over the loans’ terms based on the effective interest rate method. The Company also incurred fees of $1,385 in closing the new revolving facility on July 20, 2010 under the First lien facility. These fees are shown as an asset and amortized over the term of the facility using the straight-line method. Repayments of the term loans also result in releases of these fees, which are then included in interest expense. The Company also incurred fees relating to the term construction facility which was repaid in the year ended March 31, 2011. The Company recorded amortization of deferred financing fees of $2,991, $3,270 and $1,927 for the years ended March 31, 2012, 2011 and 2010, respectively.
11. Share capital
(a) Share capital
The Company’s authorized share capital consists of an unlimited number of Class A Subordinate Voting Shares, an unlimited number of Class B Shares and an unlimited number of Preferred Shares issuable in series. Each holder of Class B Shares and each holder of Class A Subordinate Voting Shares is entitled to receive notice of and attend all meetings of the Company’s shareholders, except

SMART Technologies Inc. Notes to Consolidated Financial Statements (thousands of U.S. dollars, except per share amounts, and except as otherwise indicated) For the years ended March 31, 2012, 2011 and 2010
Page 24
meetings at which only holders of another particular class or series have the right to vote. At each such meeting, each Class B Share entitles its holder to 10 votes and each Class A Subordinate Voting Share entitles its holder to one vote, voting together as a single class, except as otherwise set forth in the Company’s articles of amalgamation or prescribed by applicable laws. The change in the Company’s issued and outstanding share capital for the years ended March 31, 2012, 2011 and 2010 is summarized in the following tables.
The 2010 Reorganization completed on June 8, 2010 effectively resulted in the conversion of the Company’s Voting Common Shares, Voting Preferred Shares, cumulative preferred shares including accrued interest (note 3) and shareholder note payable (note 3) into 10,957,191 Class A Subordinate Voting Shares, 170,089,800 Class B Shares and 433,676,686 Class A Preferred Shares. The Company’s Non-voting Common Shares were cancelled as part of the 2010 Reorganization. On June 24, 2010, the Company effected a one-for-two reverse split of the Class A Subordinate Voting Shares and the Class B Shares. As part of the Company’s IPO on July 20, 2010, the 433,676,686 Class A Preferred Shares were converted to 5,898,744 Class B Shares and 18,550,550 Class A Subordinate Voting
Shares Outstanding
Voting Common Shares
Non-voting Common Shares
Voting Preferred Shares
Class A Preferred Shares
Class A Subordinate
Voting Shares
Class B Shares Total
March 31, 2009 42,606,653 127,489,844 127,483,148 - - - 297,579,645
Participant Equity Loan Plan 10,957,191 - - - - - 10,957,191
March 31, 2010 53,563,844 127,489,844 127,483,148 - - - 308,536,836 2010 Reorganization (53,563,844) (127,489,844) (127,483,148) 433,676,686 5,478,596 85,044,901 215,663,347 Initial Public Offering - (433,676,686) 38,830,000 (5,580,706) (400,427,392)
March 31, 2011 - - - - 44,308,596 79,464,195 123,772,791 Repurchase of Common Shares - (2,327,486) - (2,327,486)
March 31, 2012 - - - - 41,981,110 79,464,195 121,445,305
Stated Amount
Voting Common Shares
Non-voting Common Shares
Voting Preferred Shares
Class A Preferred Shares
Class A Subordinate
Voting Shares
Class B Shares Total
March 31, 2009 $ 40,139 $ 120,108 $ - $ - $ - $ - $ 160,247
Participant Equity Loan Plan 1,027 - - - - - 1,027
March 31, 2010 $ 41,166 $ 120,108 $ - $ - $ - $ - $ 161,274
Participant Equity Loan Plan 2,122 - - - 6,209 - 8,331
2010 Reorganization (43,288) (120,108) - 413,616 3,156 160,242 413,618
Initial Public Offering - - - (413,616) 474,047 78,165 138,596
March 31, 2011 $ - $ - $ - $ - $ 483,412 $ 238,407 $ 721,819
Participant Equity Loan Plan - - - - 135 - 135 Repurchase of Common Shares - - - - (25,555) - (25,555)
March 31, 2012 $ - $ - $ - $ - $ 457,992 $ 238,407 $ 696,399

SMART Technologies Inc. Notes to Consolidated Financial Statements (thousands of U.S. dollars, except per share amounts, and except as otherwise indicated) For the years ended March 31, 2012, 2011 and 2010
Page 25
Shares and then 11,479,450 Class B Shares were converted to 11,479,450 Class A Subordinate Voting Shares. New Class A Subordinate Voting Shares issued by the Company to the public pursuant to the IPO totaled 8,800,000 at an issue price of $17.00. Proceeds from the IPO were $138,596, net of underwriting commissions of $7,854 and other offering expenses of $7,429, net of tax of $4,279. Other offering expenses were also recorded as a reduction of IPO proceeds effective the date of the IPO. Concurrent with this transaction, 30,030,000 Class A Subordinate Voting Shares were sold to the public by existing shareholders at an issue price of $17.00.
(b) Participant equity loan plan
In 2009, the Company implemented a Participant Equity Loan Plan (the “Plan”) under which the Company loaned funds to certain employees for the purpose of allowing them to purchase common shares of the Company at fair market value as determined by a third party valuation. Shares granted under the Plan are reported as share capital in shareholders’ equity at their value on the date of issue. The outstanding related loans and accrued interest are reported as a reduction of share capital. Share capital increased by $135 (2011 – $8,331) in the year ended March 31, 2012 as a result of Plan activity. This includes loan principal and interest repayments totaling $612 (2011 – $8,497), interest accrued during the year of $105 (2011 – $204) and foreign exchange adjustments of $73 (2011 – $131). Also, during the year ended March 31, 2012, 160,800 (2011 – 57,500) shares of employees who left the Company were repurchased by a subsidiary company resulting in a net reduction in share capital of $445 (2011 – $159) and related loans and accrued interest were repaid. Total loans and accrued interest amounted to $2,043 at March 31, 2012 ($2,624 at March 31, 2011). Shares issued under the Plan were initially subject to restrictions that lapse as follows: 40% of the Plan shares were subject to restrictions that lapse based on passage of time and 60% were subject to restrictions that lapse based on performance of the Company. The restrictions on performance-based shares lapsed upon a liquidity event that provided a return on invested capital earned by the principal shareholders of the Company above certain valuation thresholds. At the time of the IPO, 789,176 time-vesting shares were unrestricted and as a result of the Company’s IPO, 1,951,594 performance-based shares became unrestricted, causing employee loans of $6,537 to become immediately repayable. In August 2010, the Plan was amended such that the 40% of shares with performance-based restrictions that did not become unrestricted as part of the IPO transaction, representing 24% of the total shares under the Plan, would become unrestricted in two equal installments on each of the next two anniversary dates of the IPO. As a result of this amendment, the difference between the fair value of the affected shares at the date of the amendment and the fair value at the initial issuance of the shares is being recognized as stock-based compensation ratably on a graded basis over the period the restrictions lapse. The expense is included in selling, marketing and administration expense and research and development expense, with an offsetting credit to additional paid-in capital and is adjusted to reflect expected forfeitures based on Company historical data. Changes in the forfeiture rate will result in changes in the amount of compensation cost recognized over the amortization period. The total value expensed in the year ended March 31, 2012 was $5,243 ($7,567 in the year ended March 31, 2011). The remaining amount to be expensed over the next four months is expected to be $947.

SMART Technologies Inc. Notes to Consolidated Financial Statements (thousands of U.S. dollars, except per share amounts, and except as otherwise indicated) For the years ended March 31, 2012, 2011 and 2010
Page 26
(c) Share repurchase plan
On August 19, 2011, the Company’s Board of Directors approved a share repurchase plan and normal course issuer bid to purchase for cancellation up to 4,000,000, or approximately 9%, of the Company’s 44,308,596 Class A Subordinate Voting Shares outstanding at that time. The shares may be purchased in the open market at prevailing market prices over a 12-month period commencing August 25, 2011 and ending August 24, 2012. In the year ended March 31, 2012, the Company repurchased for cancellation 2,327,486 Class A Subordinate Voting Shares at an average price of $4.19 per share for a total purchase price of $9,755, resulting in a reduction to stated capital of $25,555 and a corresponding credit to additional paid-in capital of $15,800.
12. Stock-based compensation
The 2010 Equity Incentive Plan (“2010 Plan”) provides for the grant of options, restricted share units and deferred share units to the directors, officers, employees, consultants and service providers of the Company and its subsidiaries. Under the 2010 Plan, the Company has reserved for issuance Class A Subordinate Voting Shares representing up to 10% of the total outstanding Class A Subordinate Voting Shares and Class B Shares. At March 31, 2012 there were 7,917,998 stock-based awards available for future grant. Total stock-based compensation expense including the total value expensed as part of the Participant Equity Loan Plan (note 11) was $8,392, $8,672 and zero for the years ended March 31, 2012, 2011 and 2010, respectively.
(a) Stock options
A summary of the status of the Company’s stock options at March 31, 2012, 2011 and 2010 and changes during the year ended on those dates is as follows.
Options Outstanding
Number of
options
Weighted-average
exercise price per option
Average remaining
contractual life in years
Aggregate intrinsic value
Balance at March 31, 2009 and 2010 - $ - - $ - Granted 1,444,500 16.22 - Exercised - - - Forfeited (28,500) 15.61 -
Balance at March 31, 2011 1,416,000 $ 16.24 4.37 $ 152 Granted 2,172,828 5.54 - Exercised - - - Forfeited (588,171) 13.06 -
Balance at March 31, 2012 3,000,657 $ 9.11 3.97 $ -
Exercisable at March 31, 2012 16,618 $ 17.00 -
The aggregate intrinsic value in the table above represents the total intrinsic value (the aggregate difference between the closing stock price of the Company’s Class A Subordinate Voting Shares on March 31, 2012, 2011 and 2010 and the exercise price of in-the-money options) that would have been received by the option holders if all in-the-money options had been exercised on that date. The options granted in the year ended March 31, 2012 will vest over four years.
SMART Technologies Inc. Notes to Consolidated Financial Statements (thousands of U.S. dollars, except per share amounts, and except as otherwise indicated) For the years ended March 31, 2012, 2011 and 2010
Page 27
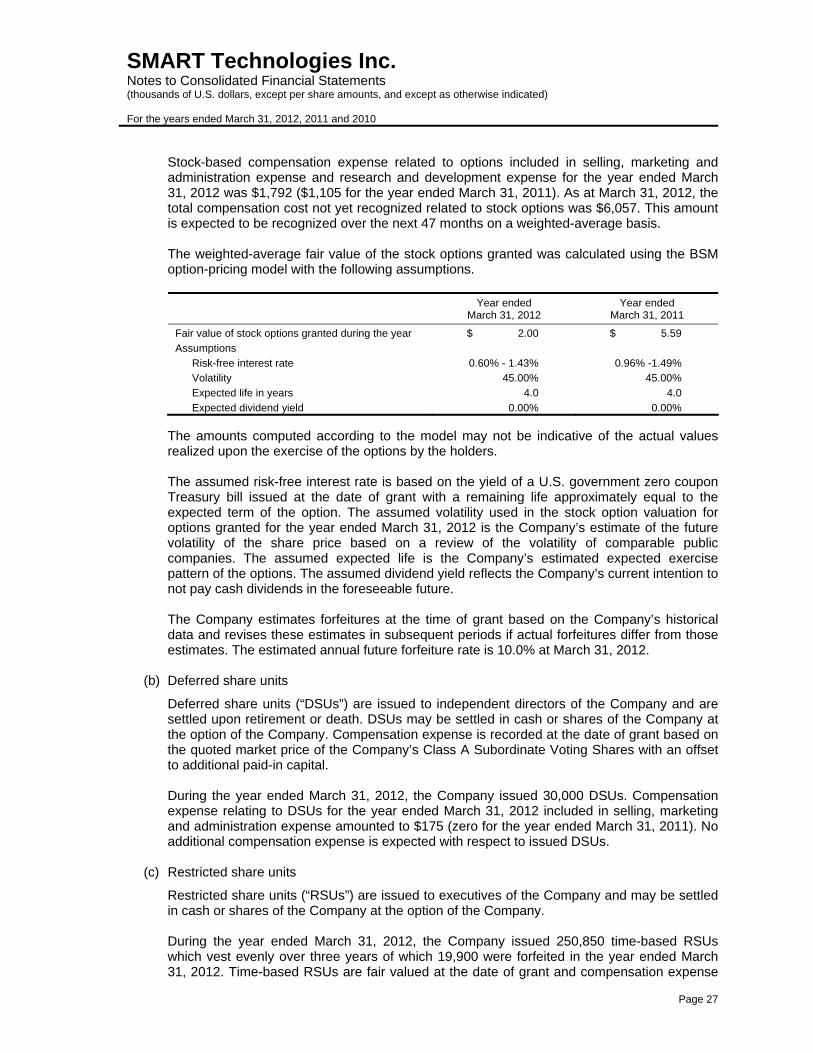
Stock-based compensation expense related to options included in selling, marketing and administration expense and research and development expense for the year ended March 31, 2012 was $1,792 ($1,105 for the year ended March 31, 2011). As at March 31, 2012, the total compensation cost not yet recognized related to stock options was $6,057. This amount is expected to be recognized over the next 47 months on a weighted-average basis. The weighted-average fair value of the stock options granted was calculated using the BSM option-pricing model with the following assumptions.
Year ended March 31, 2012
Year ended March 31, 2011
Fair value of stock options granted during the year $ 2.00 $ 5.59
Assumptions
Risk-free interest rate 0.60% - 1.43% 0.96% -1.49%
Volatility 45.00% 45.00%
Expected life in years 4.0 4.0
Expected dividend yield 0.00% 0.00%
The amounts computed according to the model may not be indicative of the actual values realized upon the exercise of the options by the holders. The assumed risk-free interest rate is based on the yield of a U.S. government zero coupon Treasury bill issued at the date of grant with a remaining life approximately equal to the expected term of the option. The assumed volatility used in the stock option valuation for options granted for the year ended March 31, 2012 is the Company’s estimate of the future volatility of the share price based on a review of the volatility of comparable public companies. The assumed expected life is the Company’s estimated expected exercise pattern of the options. The assumed dividend yield reflects the Company’s current intention to not pay cash dividends in the foreseeable future. The Company estimates forfeitures at the time of grant based on the Company’s historical data and revises these estimates in subsequent periods if actual forfeitures differ from those estimates. The estimated annual future forfeiture rate is 10.0% at March 31, 2012.
(b) Deferred share units
Deferred share units (“DSUs”) are issued to independent directors of the Company and are settled upon retirement or death. DSUs may be settled in cash or shares of the Company at the option of the Company. Compensation expense is recorded at the date of grant based on the quoted market price of the Company’s Class A Subordinate Voting Shares with an offset to additional paid-in capital. During the year ended March 31, 2012, the Company issued 30,000 DSUs. Compensation expense relating to DSUs for the year ended March 31, 2012 included in selling, marketing and administration expense amounted to $175 (zero for the year ended March 31, 2011). No additional compensation expense is expected with respect to issued DSUs.
(c) Restricted share units
Restricted share units (“RSUs”) are issued to executives of the Company and may be settled in cash or shares of the Company at the option of the Company. During the year ended March 31, 2012, the Company issued 250,850 time-based RSUs which vest evenly over three years of which 19,900 were forfeited in the year ended March 31, 2012. Time-based RSUs are fair valued at the date of grant and compensation expense
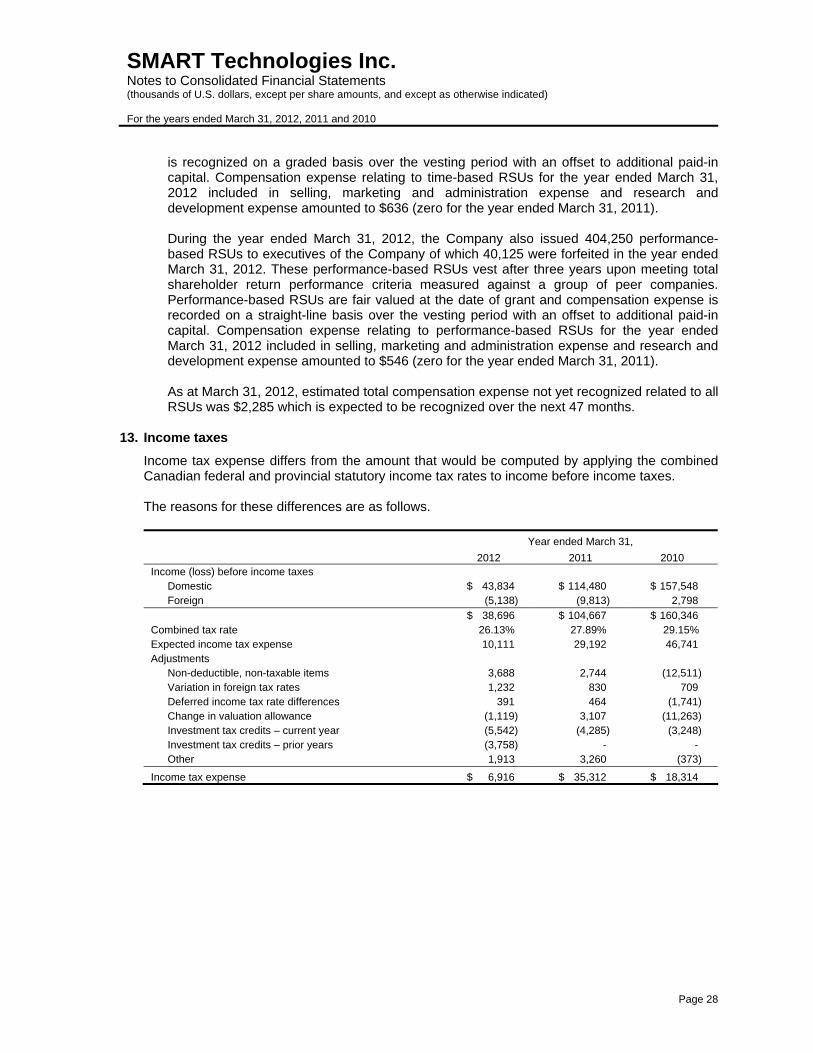
SMART Technologies Inc. Notes to Consolidated Financial Statements (thousands of U.S. dollars, except per share amounts, and except as otherwise indicated) For the years ended March 31, 2012, 2011 and 2010
Page 28
is recognized on a graded basis over the vesting period with an offset to additional paid-in capital. Compensation expense relating to time-based RSUs for the year ended March 31, 2012 included in selling, marketing and administration expense and research and development expense amounted to $636 (zero for the year ended March 31, 2011). During the year ended March 31, 2012, the Company also issued 404,250 performance-based RSUs to executives of the Company of which 40,125 were forfeited in the year ended March 31, 2012. These performance-based RSUs vest after three years upon meeting total shareholder return performance criteria measured against a group of peer companies. Performance-based RSUs are fair valued at the date of grant and compensation expense is recorded on a straight-line basis over the vesting period with an offset to additional paid-in capital. Compensation expense relating to performance-based RSUs for the year ended March 31, 2012 included in selling, marketing and administration expense and research and development expense amounted to $546 (zero for the year ended March 31, 2011). As at March 31, 2012, estimated total compensation expense not yet recognized related to all RSUs was $2,285 which is expected to be recognized over the next 47 months.
13. Income taxes
Income tax expense differs from the amount that would be computed by applying the combined Canadian federal and provincial statutory income tax rates to income before income taxes. The reasons for these differences are as follows.
Year ended March 31,
2012 2011 2010 Income (loss) before income taxes
Domestic $ 43,834 $ 114,480 $ 157,548 Foreign (5,138) (9,813) 2,798
$ 38,696 $ 104,667 $ 160,346 Combined tax rate 26.13% 27.89% 29.15% Expected income tax expense 10,111 29,192 46,741 Adjustments
Non-deductible, non-taxable items 3,688 2,744 (12,511) Variation in foreign tax rates 1,232 830 709 Deferred income tax rate differences 391 464 (1,741) Change in valuation allowance (1,119) 3,107 (11,263) Investment tax credits – current year (5,542) (4,285) (3,248) Investment tax credits – prior years (3,758) - - Other 1,913 3,260 (373)
Income tax expense $ 6,916 $ 35,312 $ 18,314

SMART Technologies Inc. Notes to Consolidated Financial Statements (thousands of U.S. dollars, except per share amounts, and except as otherwise indicated) For the years ended March 31, 2012, 2011 and 2010
Page 29
The tax effects of temporary differences that give rise to significant portions of the deferred income tax assets and liabilities are presented below.
March 31, 2012 March 31, 2011
Deferred income tax assets Inventory $ 124 $ 350 Foreign non-capital losses 4,133 4,140 Derivative contracts 181 341 Deferred revenue 31,462 30,823 Restructuring obligation 1,965 - Warranty accrual 4,448 2,979 Other 581 833 Valuation allowance (4,536) (5,655)
38,358 33,811 Deferred income tax liabilities Intangible assets 6,827 8,690 Property and equipment 335 49 Long-term debt 2,225 4,030 Investment tax credits 2,969 2,249 Long-term debt financing fees 966 1,010
13,322 16,028
Net deferred income tax asset $ 25,036 $ 17,783
Deferred income tax asset – current $ 14,026 $ 12,200 Deferred income tax asset – long-term 19,897 17,177 Deferred income tax liability – long-term (8,887) (11,594)
$ 25,036 $ 17,783
The Company had consolidated non-capital losses for income tax purposes of $13,702 at March 31, 2012 ($13,589 at March 31, 2011 and $9,486 at March 31, 2010), of which $1,133 will expire at various times through 2019 and $12,569 will carry forward indefinitely. In assessing the realization of deferred tax assets, management considers whether it is more likely than not that some portion of or all of the deferred tax assets will be realized. Management considers the scheduled reversal of deferred tax liabilities, projected future taxable income and tax planning strategies in making this assessment. To the extent that any portion of the deferred tax assets is not more likely than not to be realized, a valuation allowance has been provided. The Company and its Canadian subsidiaries file federal and provincial income tax returns in Canada, its U.S. subsidiary files federal and state income tax returns in the U.S. and its other foreign subsidiaries file income tax returns in their respective foreign jurisdictions. The Company and its subsidiaries are generally no longer subject to income tax examinations by tax authorities for years before March 31, 2007. Tax authorities in Canada, Germany and the U.S. are conducting examinations of local tax returns for various taxation years. Notwithstanding management’s belief in the merit of the Company’s tax filing position, it is possible that the final outcome of any audits by taxation authorities may differ from estimates and assumptions used in determining the Company’s consolidated tax provision and accruals, which could result in a material effect on the consolidated income tax provision and the net income for the period in which such determinations are made. Notwithstanding management’s belief in the merit of the Company’s tax filing positions, it is reasonably possible that the Company’s unrecognized tax benefits, if any, could significantly increase or decrease within the next twelve months, although this change is not likely to have a material impact on the Company’s effective tax rate. Future changes in management’s

SMART Technologies Inc. Notes to Consolidated Financial Statements (thousands of U.S. dollars, except per share amounts, and except as otherwise indicated) For the years ended March 31, 2012, 2011 and 2010
Page 30
assessment of the sustainability of tax filing positions may impact the Company’s income tax liability. The Company recognizes interest related to income taxes in interest expense and penalties related to income taxes in selling, marketing and administration expense in the consolidated statement of operations. The amount of gross interest and penalties accrued was $52 at March 31, 2012 and zero at March 31, 2011. The Company recognized interest and penalty expense related to tax matters of $69, $86 and $173 for the years ended March 31, 2012, 2011 and 2010, respectively. The Company does not recognize tax benefits associated with uncertain tax positions unless the position is more likely than not to be sustained upon examination.
14. Product warranty
The Company estimates its warranty costs at the time of revenue recognition based on historical warranty claims experience and records the expense in cost of sales. The accrued warranty obligation is reviewed quarterly to establish that it reflects the remaining obligation based on the anticipated future expenditures over the balance of the obligation period. Adjustments are made when the actual warranty claim experience differs from the estimates. The accrued warranty obligation is included in accrued and other current liabilities. The change in the Company’s accrued warranty obligation for the years ended March 31, 2012, 2011 and 2010 is summarized in the following table.
Year ended March 31, 2012 2011 2010
Accrued warranty obligation at beginning of year $ 11,543 $ 10,840 $ 6,132 Actual warranty costs incurred (13,498) (14,041) (10,845) Warranty provision 19,820 13,494 13,842 Adjustments for changes in estimate - 725 - Currency translation adjustment (351) 525 1,711
Accrued warranty obligation at end of year $ 17,514 $ 11,543 $ 10,840
15. Earnings per share amounts
The weighted-average number of shares outstanding for the year ended March 31, 2012 reflects Class A Subordinate Voting Shares and Class B Shares outstanding on a pro-rata basis from April 1, 2011 to March 31, 2012. Options to purchase 3,000,657 Class A Subordinate Voting Shares were outstanding at March 31, 2012. During the year ended March 31, 2012, 375,959 options had an exercise price lower than the weighted-average trading price of underlying Class
Year ended March 31,
2012 2011 2010 Net income for basic and diluted earnings per share
available to common shareholders $ 31,780 $ 69,355 $ 142,032 Weighted-average number of shares outstanding – basic 122,726,275 130,775,288 176,322,584 Effect of dilutive securities – stock-based compensation 643,768 - -
Weighted-average number of shares outstanding – diluted 123,370,043 130,775,288 176,322,584
Earnings per share
Basic $ 0.26 $ 0.53 $ 0.81 Diluted $ 0.26 $ 0.53 $ 0.81

SMART Technologies Inc. Notes to Consolidated Financial Statements (thousands of U.S. dollars, except per share amounts, and except as otherwise indicated) For the years ended March 31, 2012, 2011 and 2010
Page 31
A Subordinate Voting Shares and are included in the calculation of diluted earnings per share. All other options were excluded from the computation of diluted earnings per share because their exercise prices exceeded the trading price of the underlying Class A Subordinate Voting Shares during the year ended March 31, 2012. Diluted earnings per share includes the dilutive impact of outstanding DSUs and RSUs for the year ended March 31, 2012. The weighted average number of shares outstanding for the year ended March 31, 2011 reflects voting common shares and non-voting shares outstanding on a pro-rata basis from April 1, 2010 to June 8, 2010, the date of the 2010 Reorganization and Class A Subordinate Voting Shares and Class B Shares outstanding on a pro-rata basis from June 9, 2010 to March 31, 2011, after giving retroactive effect to the one-for-two reverse share split effected June 24, 2010 for the Class A Subordinate Voting Shares and the Class B Shares. Options to purchase 1,416,000 Class A Subordinate Voting Shares were outstanding at March 31, 2011 of which 137,000 options had an exercise price lower than the weighted-average trading price of underlying Class A Subordinate Voting Shares during the year ended March 31, 2011. These options were excluded from the calculation of diluted earnings per share because the combined exercise price and unamortized fair value is greater than the average trading price of the Class A Subordinate Voting shares for the year ended March 31, 2011 and therefore their inclusion would have been anti-dilutive. All other options were excluded from the computation of diluted earnings per share because their exercise prices exceeded the trading price of the underlying Class A Subordinate Voting Shares during the year ended March 31, 2011. The weighted-average number of shares outstanding for the year ended March 31, 2010 reflects voting and non-voting common shares.
16. Commitments
Fiscal year ending March 31,
2013 2014 2015 2016 2017 and thereafter
Operating leases $ 7,075 $ 5,675 $ 5,376 $ 4,912 $ 18,692 Derivative contracts 908 - - - - Long-term debt repayments
Long-term debt 3,050 3,050 285,175 - - Future interest obligations
on long-term debt 9,467 9,367 3,820 - - Purchase commitments 72,540 2,482 1,037 349 -
Total $ 93,040 $ 20,574 $ 295,408 $ 5,261 $ 18,692
The operating lease commitments relate primarily to office and warehouse space and represent the minimum commitments under these agreements. The Company incurred rental expense of $5,156, $4,795 and $5,012 for the years ended March 31, 2012, 2011 and 2010, respectively. The derivative contracts represent minimum commitments under foreign exchange and interest rate contracts based on the forward strip for each instrument through the contract term. Long-term debt commitments represent the minimum principal repayments required under the long-term debt facility. Purchase commitments represent commitments for raw materials, finished goods from contract manufacturers, as well as certain information systems and licensing costs. Commitments have been calculated using foreign exchange and interest rates in effect at March 31, 2012. Fluctuations in these rates may result in actual payments differing from those reported in the above table.

SMART Technologies Inc. Notes to Consolidated Financial Statements (thousands of U.S. dollars, except per share amounts, and except as otherwise indicated) For the years ended March 31, 2012, 2011 and 2010
Page 32
17. Guarantees and contingencies
(a) Securities Class Actions
Since December 2010, several putative class action complaints against the Company and other parties have been filed in the U.S. District Courts in New York and Illinois on behalf of the purchasers of the Class A Subordinate Voting Shares in the Company’s IPO. The complaints alleged certain violations of federal securities laws in connection with the IPO. The New York actions were subsequently dismissed voluntarily. Pursuant to the provisions governing class action litigation as set out in the Private Securities Litigation Reform Act of 1995, in June 2011, the U.S. District Court for the Northern District of Illinois appointed, as Lead Plaintiff, the City of Miami General Employees’ and Sanitation Employees’ Retirement Trust. In October 2011, the Court granted the defendants’ motion to transfer the case to the U.S. District Court for the Southern District of New York where it is now pending. A consolidated amended class action complaint was filed in November 2011. A motion to dismiss the case was filed by the defendants in the New York court on January 6, 2012 and, on April 3, 2012, the Court granted in part and denied in part the motion. A Second Amended Complaint was filed on April 23, 2012 and the Company filed a motion to dismiss the amended claims on May 11, 2012. That motion is pending in the New York court. In February 2011, a class proceeding was commenced in the Ontario Superior Court of Justice on behalf of purchasers of the Class A Subordinate Voting Shares issued in conjunction with the IPO. A second class proceeding was subsequently initiated by the same law firm with an Ontario-based plaintiff. Originally, the plaintiffs indicated that they would consolidate the two actions; however, they have now applied to stay the first and will be proceeding only with the second action. The hearing to determine whether the matter will be certified to proceed as a class action is scheduled for December of 2012. In September 2011, an additional putative class proceeding was commenced in the Superior Court of the State of California, County of San Francisco on behalf of purchasers of the Class A Subordinate Voting Shares. The Company is of the view that this proceeding is not materially different than the aforementioned matter being heard in the Southern District of New York. In October 2011, the defendants removed the case to the U.S. District Court for the Northern District of California. Thereafter, the defendants filed a motion to transfer the case to the U.S. District Court for the Southern District of New York, and plaintiffs filed a motion to remand the case to California state court. Both motions are pending. All of the claims in Canada and the U.S. are essentially based on the allegation that the Company misrepresented or omitted to fully disclose demand for its products. The foregoing litigation proceedings are in their early stages. As a result, the Company is not able to make any determination with respect to the likelihood or amount of any damages that might be awarded against the Company with such proceedings (or any related proceedings).
(b) Indemnities and Guarantees
In the normal course of business, the Company enters into guarantees that provide indemnification and guarantees to counterparties to secure sales agreements and purchase commitments. Should the Company be required to act under such agreements, it is expected that no material loss would result. As a result of the U.S. and Canadian class action IPO litigations, as described in the "Securities Class Actions" section above, the Company may be required, subject to certain limitations, to indemnify the following parties: the underwriters pursuant to the underwriting agreement entered into in connection with the IPO; Intel Corporation, Apax Partners and IFF

SMART Technologies Inc. Notes to Consolidated Financial Statements (thousands of U.S. dollars, except per share amounts, and except as otherwise indicated) For the years ended March 31, 2012, 2011 and 2010
Page 33
Holdings Inc. pursuant to a registration rights agreement entered into in 2007 and amended and restated in connection with the IPO; and the directors and officers of SMART Technologies Inc. pursuant to indemnification agreements entered into by the Company and each director and officer on or about the time of their appointment to their respective office.
(c) Other Litigation
In addition to the putative class action complaints described above under “Securities Class Actions”, the Company is involved in various other claims and litigation arising in the normal course of business. While the outcome of these other matters is uncertain and there can be no assurance that such matters will be resolved in the Company’s favor, the Company does not currently believe that the outcome of such other claims and litigation, or the amounts which the Company may be required to pay by reason thereof, would have a material adverse impact on its financial position, results of operations or liquidity.
18. Segmented disclosure
The Company reports segmented information as a single reportable business segment based upon the manner in which related information is organized and managed. The Company’s operations are substantially related to the design, development and sale of hardware and software of interactive displays and related products that enable group collaboration and learning. The Company conducts business globally. Revenue information relating to the geographic locations in which the Company sells products is as follows.
Year ended March 31,
2012 2011 2010 Revenue
United States $ 432,659 $ 497,726 $ 409,527 Canada 54,237 60,669 47,722 Europe, Middle East and Africa 183,920 175,472 149,905 Rest of World 74,984 56,188 40,821
$ 745,800 $ 790,055 $ 647,975
For the years ended March 31, 2012, 2011 and 2010, no single customer accounted for more than 10% of revenues. Most of the Company’s assets are held in Canada. As a result of the acquisition of NextWindow on April 21, 2010 (note 2), one country outside Canada, New Zealand, has more than 10% of the Company’s total consolidated long-lived assets at March 31, 2012. Total long-lived assets in New Zealand amounted to $68,956 and total long-lived assets outside of Canada amounted to $70,352 at March 31, 2012.
19. Financial instruments
The Company’s financial instruments consist of foreign exchange and interest rate derivative instruments and other financial instruments including cash and cash equivalents, trade receivables, accounts payable, accrued and other current liabilities and long-term debt. The Company uses derivatives to partially offset its exposure to foreign exchange risk and interest rate risk. The Company enters into derivative transactions with high credit quality counterparties and, by policy, seeks to limit the amount of credit exposure to any one counterparty based on an analysis of the counterparty’s relative credit standing. The Company does not use derivative financial instruments for trading or speculative purposes.

SMART Technologies Inc. Notes to Consolidated Financial Statements (thousands of U.S. dollars, except per share amounts, and except as otherwise indicated) For the years ended March 31, 2012, 2011 and 2010
Page 34
(a) Foreign exchange rate risk
Foreign exchange risk is the risk that fluctuations in foreign exchange rates could impact the Company. The Company operates globally and is exposed to significant foreign exchange risk, primarily between the Canadian dollar and both the U.S. dollar (“USD”), and the Euro (“EUR”). This exposure relates to our U.S. dollar-denominated debt, the sale of our products to customers globally and purchases of goods and services in foreign currencies. The Company seeks to manage its foreign exchange risk by monitoring foreign exchange rates, forecasting its net foreign currency cash flows and periodically entering into forward contracts and other derivative contracts to convert a portion of its forecasted foreign currency denominated cash flows into Canadian dollars for the purpose of paying Canadian dollar denominated operating costs. The Company may also enter into forward contracts and other derivative contracts to manage its cash flows in other currencies. These programs reduce, but do not entirely eliminate, the impact of currency exchange movements. The Company currently does not apply hedge accounting to its currency derivatives. The maturity of these instruments generally occurs within 12 months. Gains or losses resulting from the fair valuing of these instruments are reported in foreign exchange loss (gain) in the consolidated statements of operations.
(b) Interest rate risk
Interest rate risk is the risk that the value of a financial instrument will be affected by changes in market interest rates. The Company’s financing includes long-term debt and revolving credit facilities that bear interest based on floating market rates. Changes in these rates result in fluctuations in the required cash flows to service this debt. The Company partially mitigates this risk by periodically entering into interest rate swap agreements to fix the interest rate on certain long-term variable-rate debt. The Company currently does not apply hedge accounting to its interest rate derivatives. Changes in the fair value of these interest rate derivatives are included in interest expense in the consolidated statements of operations.
(c) Credit risk
Credit risk is the risk that the counterparty to a financial instrument fails to meet its contractual obligations, resulting in a financial loss to the Company. The Company sells hardware and software that enables group collaboration and learning to a diverse customer base over a global geographic area. The Company evaluates collectability of specific customer receivables based on a variety of factors including currency risk, geopolitical risk, payment history, customer stability and other economic factors. Collectability of receivables is reviewed on an ongoing basis by management and receivables accounts are adjusted as required. Receivables balances are charged against the allowance when the Company determines that it is probable that the receivable will not be recovered. The geographic diversity of the customer base, combined with the Company’s established credit approval practices and ongoing monitoring of customer balances, mitigates this counterparty risk (note 6).
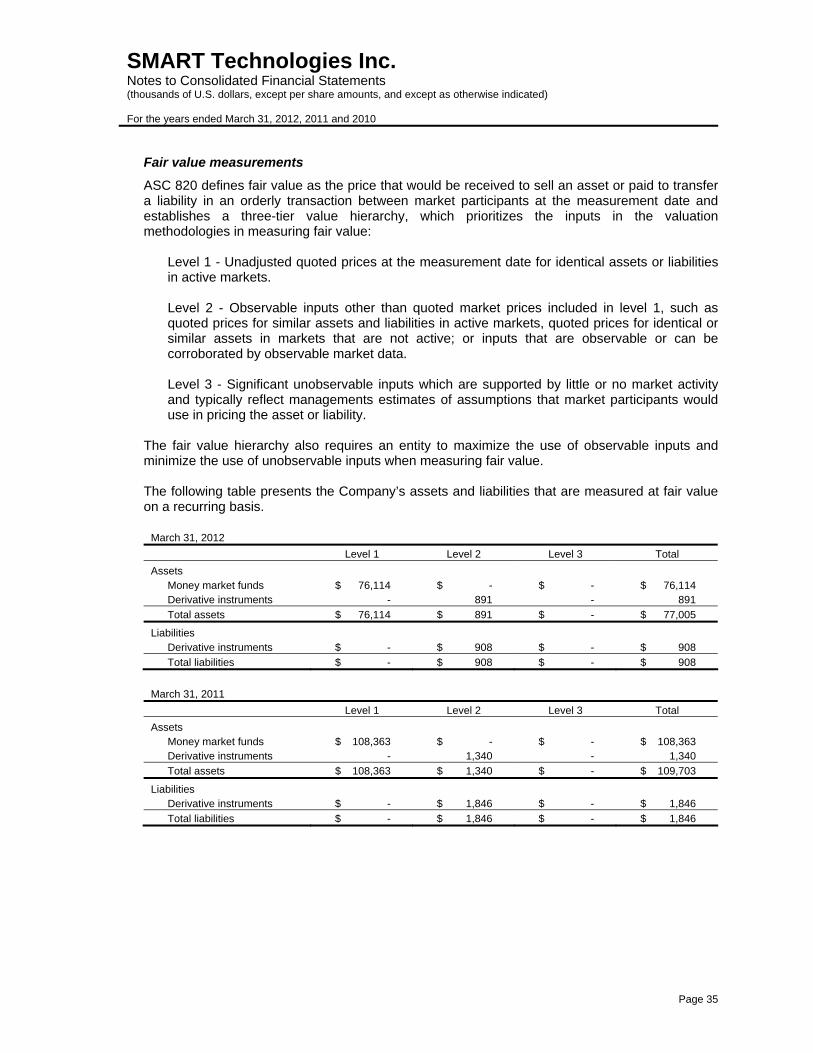
SMART Technologies Inc. Notes to Consolidated Financial Statements (thousands of U.S. dollars, except per share amounts, and except as otherwise indicated) For the years ended March 31, 2012, 2011 and 2010
Page 35
Fair value measurements
ASC 820 defines fair value as the price that would be received to sell an asset or paid to transfer a liability in an orderly transaction between market participants at the measurement date and establishes a three-tier value hierarchy, which prioritizes the inputs in the valuation methodologies in measuring fair value:
Level 1 - Unadjusted quoted prices at the measurement date for identical assets or liabilities in active markets. Level 2 - Observable inputs other than quoted market prices included in level 1, such as quoted prices for similar assets and liabilities in active markets, quoted prices for identical or similar assets in markets that are not active; or inputs that are observable or can be corroborated by observable market data. Level 3 - Significant unobservable inputs which are supported by little or no market activity and typically reflect managements estimates of assumptions that market participants would use in pricing the asset or liability.
The fair value hierarchy also requires an entity to maximize the use of observable inputs and minimize the use of unobservable inputs when measuring fair value. The following table presents the Company’s assets and liabilities that are measured at fair value on a recurring basis.
March 31, 2012
Level 1 Level 2 Level 3 Total
Assets Money market funds $ 76,114 $ - $ - $ 76,114 Derivative instruments - 891 - 891
Total assets $ 76,114 $ 891 $ - $ 77,005
Liabilities Derivative instruments $ - $ 908 $ - $ 908
Total liabilities $ - $ 908 $ - $ 908
March 31, 2011
Level 1 Level 2 Level 3 Total
Assets Money market funds $ 108,363 $ - $ - $ 108,363 Derivative instruments - 1,340 - 1,340
Total assets $ 108,363 $ 1,340 $ - $ 109,703
Liabilities Derivative instruments $ - $ 1,846 $ - $ 1,846
Total liabilities $ - $ 1,846 $ - $ 1,846
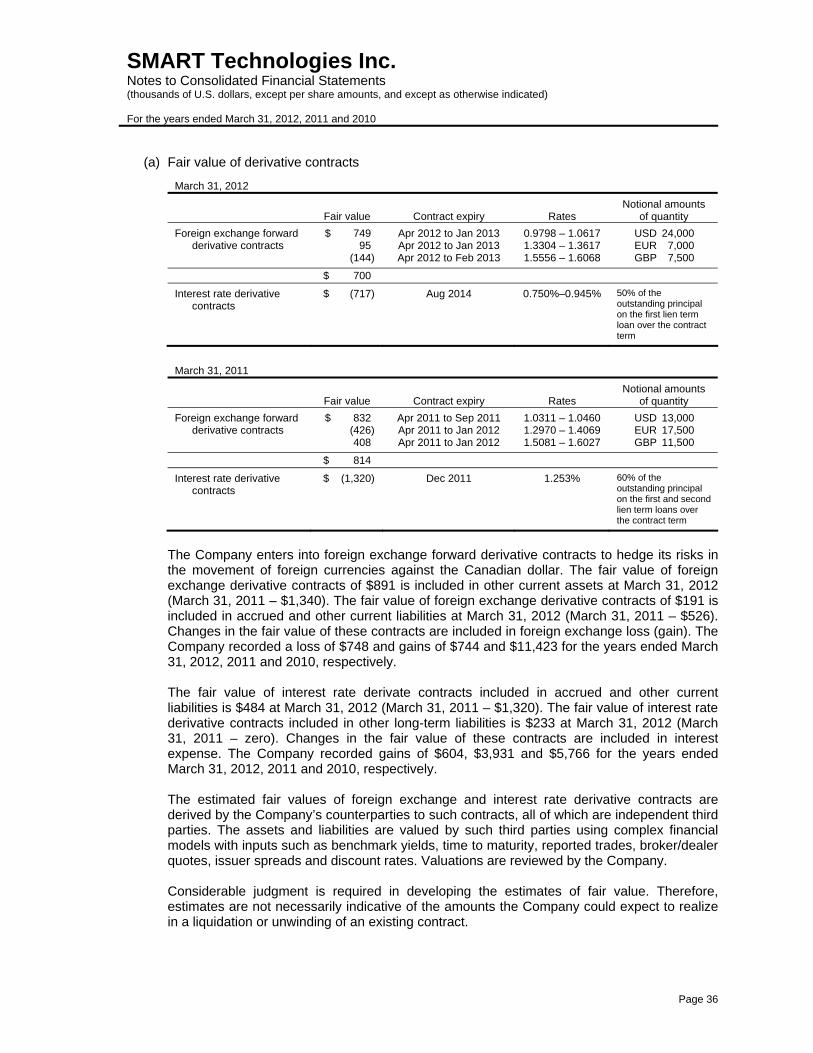
SMART Technologies Inc. Notes to Consolidated Financial Statements (thousands of U.S. dollars, except per share amounts, and except as otherwise indicated) For the years ended March 31, 2012, 2011 and 2010
Page 36
(a) Fair value of derivative contracts
March 31, 2012
Fair value Contract expiry Rates Notional amounts
of quantity
Foreign exchange forward derivative contracts
$ 749 95
(144)
Apr 2012 to Jan 2013 Apr 2012 to Jan 2013 Apr 2012 to Feb 2013
0.9798 – 1.0617 1.3304 – 1.3617 1.5556 – 1.6068
USD 24,000 EUR 7,000 GBP 7,500
$ 700
Interest rate derivative contracts
$ (717) Aug 2014 0.750%–0.945% 50% of the outstanding principal on the first lien term loan over the contract term
March 31, 2011
Fair value Contract expiry Rates Notional amounts
of quantity
Foreign exchange forward derivative contracts
$ 832 (426) 408
Apr 2011 to Sep 2011 Apr 2011 to Jan 2012 Apr 2011 to Jan 2012
1.0311 – 1.0460 1.2970 – 1.4069 1.5081 – 1.6027
USD 13,000 EUR 17,500 GBP 11,500
$ 814
Interest rate derivative contracts
$ (1,320) Dec 2011 1.253% 60% of the outstanding principal on the first and second lien term loans over the contract term
The Company enters into foreign exchange forward derivative contracts to hedge its risks in the movement of foreign currencies against the Canadian dollar. The fair value of foreign exchange derivative contracts of $891 is included in other current assets at March 31, 2012 (March 31, 2011 – $1,340). The fair value of foreign exchange derivative contracts of $191 is included in accrued and other current liabilities at March 31, 2012 (March 31, 2011 – $526). Changes in the fair value of these contracts are included in foreign exchange loss (gain). The Company recorded a loss of $748 and gains of $744 and $11,423 for the years ended March 31, 2012, 2011 and 2010, respectively. The fair value of interest rate derivate contracts included in accrued and other current liabilities is $484 at March 31, 2012 (March 31, 2011 – $1,320). The fair value of interest rate derivative contracts included in other long-term liabilities is $233 at March 31, 2012 (March 31, 2011 – zero). Changes in the fair value of these contracts are included in interest expense. The Company recorded gains of $604, $3,931 and $5,766 for the years ended March 31, 2012, 2011 and 2010, respectively. The estimated fair values of foreign exchange and interest rate derivative contracts are derived by the Company’s counterparties to such contracts, all of which are independent third parties. The assets and liabilities are valued by such third parties using complex financial models with inputs such as benchmark yields, time to maturity, reported trades, broker/dealer quotes, issuer spreads and discount rates. Valuations are reviewed by the Company.
Considerable judgment is required in developing the estimates of fair value. Therefore, estimates are not necessarily indicative of the amounts the Company could expect to realize in a liquidation or unwinding of an existing contract.

SMART Technologies Inc. Notes to Consolidated Financial Statements (thousands of U.S. dollars, except per share amounts, and except as otherwise indicated) For the years ended March 31, 2012, 2011 and 2010
Page 37
(b) Long-term debt
The estimated fair value of the Company’s long-term debt has been determined based on current market conditions by discounting future cash flows under current financing arrangements at borrowing rates believed to be available to the Company for debt with similar terms and remaining maturities. The fair value of debt was measured utilizing Level 3 inputs. The Level 3 fair value measurements utilize a discounted cash flow model. This model utilizes observable inputs such as contractual repayment terms and benchmark forward yield curves, plus a discount rate that is intended to represent our credit risk for secured or unsecured obligations. We estimate our credit risk based on our corporate credit rating and the credit rating on our variable-rate long-term debt and utilize benchmark yield curves that are widely used in the financial industry. The carrying value and fair value of the Company’s long-term debt as at March 31, 2012 and March 31, 2011, are as follows.
March 31, 2012 March 31, 2011
Carrying amount Fair value Carrying amount Fair value
Variable-rate long-term debt $ 291,275 $ 289,340 $ 339,325 $ 329,836
(c) Other financial assets and liabilities
The fair values of cash and cash equivalents, trade receivables and accounts payable and accrued and other current liabilities approximate their carrying amounts due to the short-term maturity of these instruments. A portion of these items are denominated in currencies other than the Canadian dollar functional currency of the Company including the U.S. dollar, Euro and British pound sterling and are translated at the exchange rate in effect at the balance sheet date.
20. Related party transactions
All transactions with related parties were nominal for the years ended March 31, 2012, 2011 and 2010, with the exception of those disclosed in notes 3 and 11.
21. Comparative figures
Certain reclassifications have been made to prior periods’ figures to conform to the current period’s presentation.