smart energy, plasma and nuclear systems
TRANSCRIPT

Smart Energy, Plasm
a and Nuclear System
s • Hossam
A. Gabbar
Smart Energy, Plasma and Nuclear Systems
Printed Edition of the Special Issue Published in Energies
www.mdpi.com/journal/energies
Hossam A. GabbarEdited by

Smart Energy, Plasma and Nuclear Systems


Smart Energy, Plasma and Nuclear Systems
Editor
Hossam A. Gabbar
MDPI • Basel • Beijing • Wuhan • Barcelona • Belgrade • Manchester • Tokyo • Cluj • Tianjin

Editor
Hossam A. Gabbar
University of Ontario Institute of
Technology
Canada
Editorial Office
MDPI
St. Alban-Anlage 66
4052 Basel, Switzerland
This is a reprint of articles from the Special Issue published online in the open access journal
Energies (ISSN 1996-1073) (available at: https://www.mdpi.com/journal/energies/special issues/
SEGE SPANS2019).
For citation purposes, cite each article independently as indicated on the article page online and as
indicated below:
LastName, A.A.; LastName, B.B.; LastName, C.C. Article Title. Journal Name Year, Volume Number,
Page Range.
ISBN 978-3-0365-0752-1 (Hbk)
ISBN 978-3-0365-0753-8 (PDF)
© 2021 by the authors. Articles in this book are Open Access and distributed under the Creative
Commons Attribution (CC BY) license, which allows users to download, copy and build upon
published articles, as long as the author and publisher are properly credited, which ensures maximum
dissemination and a wider impact of our publications.
The book as a whole is distributed by MDPI under the terms and conditions of the Creative Commons
license CC BY-NC-ND.

Contents
About the Editor . . . . . . . . . . . . . . . . . . . . . . . . . . . . . . . . . . . . . . . . . . . . . . vii
Preface to ”Smart Energy, Plasma and Nuclear Systems” . . . . . . . . . . . . . . . . . . . . . . . ix
Sergio Ciattaglia, Maria Carmen Falvo, Alessandro Lampasi and Matteo Proietti Cosimi Energy Analysis for the Connection of the Nuclear Reactor DEMO to the European Electrical GridReprinted from: Energies 2020, 13, 2157, doi:10.3390/en13092157 . . . . . . . . . . . . . . . . . . . 1
Simone Minucci, Stefano Panella, Sergio Ciattaglia, Maria Carmen Falvo and Alessandro Lampasi
Electrical Loads and Power Systems for the DEMO Nuclear Fusion ProjectReprinted from: Energies 2020, 13, 2269, doi:10.3390/en13092269 . . . . . . . . . . . . . . . . . . . 21
Hossam A. Gabbar, Muhammad R. Abdussami and Md. Ibrahim Adham
Techno-Economic Evaluation of Interconnected Nuclear-Renewable Micro Hybrid EnergySystems with Combined Heat and PowerReprinted from: Energies 2020, 13, 1642, doi:10.3390/en13071642 . . . . . . . . . . . . . . . . . . . 43
Wanghao Fei and Paul Moses
Fault Current Tracing and Identification via Machine Learning Considering Distributed EnergyResources in Distribution Networks †
Reprinted from: Energies 2019, 12, 4333, doi:10.3390/en12224333 . . . . . . . . . . . . . . . . . . . 73
Geun Wan Koo, Won-Young Sung and Byoung Kuk Lee
Comparison and Design of Resonant Network Considering the Characteristics of a Plasma GeneratorReprinted from: Energies 2019, 12, 3156, doi:10.3390/en12163156 . . . . . . . . . . . . . . . . . . . 85
v


About the Editor
Hossam A. Gabbar (Dr.) Dr. Gabbar is a full Professor in the University of Ontario Institute of
Technology (UOIT) in the Faculty of Energy Systems and Nuclear Science, and is cross appointed in
the Faculty of Engineering and Applied Science, where he has established both the Energy Safety and
Control Lab (ESCL) and Advanced Plasma Engineering Lab. He is leading national and international
research in the areas of nuclear safety and control, advanced plasma systems and their application in
nuclear fusion, as well as in the control and protection of smart grids and micro energy grids. He is
leading research efforts in Canada, achieving international recognition for his work in the field of
energy safety and control for nuclear and energy production facilities.
vii


Preface to ”Smart Energy, Plasma and Nuclear
Systems”
This Special Issue on the topics of smart energy, plasma and nuclear systems contains a collection
of five extended papers from the SEGE (International Conference on Smart Energy Grid Engineering)
2019 and SPAN (Symposium on Plasma And Nuclear Systems) 2019. The SEGE conference aims
to provide an opportunity to discuss various engineering challenges of smart energy grid design
and operation by focusing on advanced methods and practices for designing different components
and integrating these within the grid. It also provides a forum for researchers from academia
and professionals from industry—in addition to government regulators—to tackle these challenges
and discuss and exchange knowledge and best practices about the design and implementation of
smart energy grids. The Symposium on Plasma and Nuclear Systems (SPANS) is connected with
SEGE. SPANS provides a forum for researchers from academia and industry to present and discuss
the latest research innovations in nuclear and plasma systems. SPANS will provide attendees
with state-of-the-art research and technologies, while engaing in active discussions with industry.
Additionally, it will provide industry with opportunities to promote their products and business
cases. Attendees from regulators and standards will engage in fruitful discussions on how R&D
is linked with regulations and standards. The 2019 edition of SEGE was held in Oshawa, Canada,
and attracted a total of 112 regular paper submissions, spanning numerous active and emerging
topic areas. The conference program committee selected 60 papers to be presented at the conference
and published in the conference proceedings. The five extended papers for this special issue were
selected from among all the accepted papers by the Special Issue Guest Editor Dr. Hossam A. Babbar,
based on the relevance to the journal and the reviews of the conference version of the papers.
The authors were asked to revise the conference paper for journal publication and in accordance
with the customary practice of adding 30% new material. The revised papers, again, went through
the normal journal-style review process and are now finally presented to readers in this Special Issue.
We greatly appreciate the willingness of the authors in helping to organize this Special Issue.
Hossam A. Gabbar
Editor
ix


energies
Article
Energy Analysis for the Connection of the NuclearReactor DEMO to the European Electrical Grid
Sergio Ciattaglia 1, Maria Carmen Falvo 2,*, Alessandro Lampasi 3 and Matteo Proietti Cosimi 2
1 EUROfusion Consortium, 85748 Garching, Germany; [email protected] DIAEE—Department of Astronautics, Energy and Electrical Engineering, University of Rome Sapienza,
00184 Rome, Italy; [email protected] ENEA Frascati, 00044 Frascati, Rome, Italy; [email protected]* Correspondence: [email protected]
Received: 31 March 2020; Accepted: 22 April 2020; Published: 1 May 2020
Abstract: Towards the middle of the current century, the DEMOnstration power plant, DEMO,will start operating as the first nuclear fusion reactor capable of supplying its own loads and ofproviding electrical power to the European electrical grid. The presence of such a unique and peculiarfacility in the European transmission system involves many issues that have to be faced in theproject phase. This work represents the first study linking the operation of the nuclear fusion powerplant DEMO to the actual requirements for its correct functioning as a facility connected to the powersystems. In order to build this link, the present work reports the analysis of the requirements that thisunconventional power-generating facility should fulfill for the proper connection and operation in theEuropean electrical grid. Through this analysis, the study reaches its main objectives, which are thedefinition of the limitations of the current design choices in terms of power-generating capability andthe preliminary evaluation of advantages and disadvantages that the possible configurations for theconnection of the facility to the European electrical grid can have. In reference to the second objective,the work makes possible a first attempt at defining the features of the point of connection to theEuropean grid, whose knowledge will be useful in the future, for the choice of the real construction site.
Keywords: nuclear fusion; tokamak; generation power plant; power system; electrical transmission grid
1. Introduction
The European roadmap to fusion energy, summarized in Figure 1, includes the DEMOnstrationpower plant (generally identified as DEMO), which represents the first fusion reactor designed tosupply electrical power to the electrical grid to which it will be connected [1]. With the start ofits operation, currently set for the middle of the 21st century, DEMO could be a revolution in the worldof nuclear fusion power and in general in the world of power generation.
The first and fundamental step of the roadmap however is ITER, a research tokamak projectcurrently under construction in France that is foreseen to be operative in around five years. ITER is notdesigned to generate electrical power, but it is designed to achieve five goals that are essential for thecontinuation of the research in this field [2]:
• It will generate 500 MW of fusion thermal power during a relatively prolonged fusion time of400 s;
• It will demonstrate the effectiveness of new technologies for heating, control, diagnostics,cryogenics and remote maintenance, applied to fusion reactors;
• It will achieve a deuterium-tritium plasma capable of self-sustainment;• It will test the breeding blanket technology and so the possibility of producing the tritium needed
for the fusion reactions inside the reactor itself;
Energies 2020, 13, 2157; doi:10.3390/en13092157 www.mdpi.com/journal/energies1

Energies 2020, 13, 2157
• It will demonstrate the safety characteristics of a fusion device.
DEMO will largely build on the ITER experience; indeed, its construction will start after severalyears of ITER operation. Now, the design of DEMO is based on five main objectives [3]:
• Conversion of fusion thermal power into electricity for several hundreds of megawatts;• Achievement of tritium self-sufficiency (the tritium produced through the breeding blanket
technology is higher than that consumed during the fusion reaction);• Reasonable availability of up to several full-power years;• Minimization of radioactive wastes, with no-long-term storage;• Extrapolation to a commercial fusion power plant.
Considering the achievements that both the facilities should reach, the actual characteristic thatdistinguishes DEMO from ITER is the size and consequently the possibility of achieving higher valuesof fusion gain factor and longer fusion time. The fusion gain factor is defined as the thermal powerproduced inside the reactor during the fusion reaction divided by the thermal power delivered to theplasma during the operation. In particular, DEMO being bigger than its predecessor, it is designed toreach a fusion gain factor between 10 and 50 [1], while this value for ITER is foreseen to be around10 [1]. One of the aims of current studies on this topic is to understand if this gain factor is high enoughto allow a feasible supply of electrical energy to the grid, also because the electrical power systems oftokamaks like ITER or DEMO are larger and more complex than those of nuclear-fission power plants.
As for every tokamak, the main limitation for DEMO is the impossibility of maintaining the fusionreactions for an indefinite time [4]. This is an intrinsic characteristic of tokamaks, and it is related tothe need of charging and discharging the central solenoid (CS) system that generates and confines theplasma current. This essentially means that the operation of DEMO is variable, and in particular, it isdivided in several phases that will be presented in following section.
Figure 1. Summary of the EUROfusion Roadmap to fusion energy.
Now, the researchers are trying to understand how and how much the non-generation time canbe reduced, even if the generation time is already foreseen to be at least one order of magnitudegreater than the non-generation time. From the structural point of view, the need to optimize thischaracteristic led to the identification of two possible alternative configurations. The first one involvesthe direct coupling between the Primary Heat Transfer System (PHTS, the system that extracts the
2

Energies 2020, 13, 2157
thermal power from the reactor walls) and the Power Conversion System (PCS), which reflects thevariability of the thermal output into the electrical power output. The second one involves the indirectcoupling between the PHTS and the PCS, which allows to decouple the variable thermal output fromthe electrical power output, with the interposition of an Intermediate Heat Transfer System (IHTS)with an Energy Storage System (ESS) based on molten salts [3], allowing a constant electrical poweroutput at the generator level.
The article includes five sections. Section 2 defines the main characteristics of DEMO, and itintroduces its operational phases. Section 3 focuses on the electrical generator, defining the limitationsof the possible coupling configurations, through the analysis of the European Network of TransmissionSystem Operators (ENTSO-E) requirements for generators. Section 4 presents three possible connectionsolutions for the DEMO facility, considering both the demand and the generation, providing anoverview of the advantages and disadvantages of each solution. In Section 5, starting from the inputand output power profiles, some features of the point of connection to the grid are evaluated. Section 6resumes the conclusions of the study.
2. DEMO Features and Operational Phases
DEMO is foreseen to generate a fusion thermal power inside its reactor that has been evaluated tobe in the order of 2 GWth [5]. Now, two solutions are under study for the thermal power extraction andaccordingly for the PHTS. The first solution exploits a mature technology, which is the water cooling,also used in fission nuclear plants for its simplicity and reliability. The second solution instead foreseesthe use of helium for the PHTS, which seems to be promising for future applications but is still arelatively new technology. Conventionally, the first solution is identified as Water Cooled LithiumLead (WCLL), where lithium lead refers to the technology adopted inside the reactor wall, and thesecond one as Helium Cooled Pebble Bed (HCPB) [6].
In case of direct coupling between the PHTS and the PCS, both the WCLL and the HCPBconfigurations provide for the implementation of a Rankine cycle for the thermal power conversion.This means that in case of HCPB, the helium cools the reactor (PHTS), and then, it exchanges theextracted power with the cycle working fluid, namely water. Moreover, in case of indirect coupling,the working cycle is a Rankine cycle, but in this case, the decoupling between the PCS and the PHTSmakes the overall operation independent of the type of fluid circulating in the PHTS. From now on,more efforts are being focused on the WCLL configuration and so more data are available. This studywill mostly refer to this solution. In any case, several results and procedures can be applied both to theWCLL and to the HCPB configurations.
For the limits of the tokamak technology, the thermal power is generated only during a portionof the operation time, which is generally identified as the “Burn Flat-Top” phase. A smaller powercan be generated in the other phases for thermal inertia of the materials, nuclear reactions and otherphenomena but always, as a consequence of the Burn Flat-Top. In the present configuration, this phaseshould last around 7200 s (2 h). Between each burn phase, other phases are conventionally identifiedduring which no relevant thermal power is extracted. These phases are resumed in Table 1, with theirrespective duration.
For completeness, a brief description of the phases is reported. During CS pre-magnetization,the CS, that is, the core of the magnet system, is energized in order to be able to generate a power pulsestrong enough to generate the plasma ignition that is represented by the Breakdown phase. Once theplasma has been generated inside the reactor, it must be heated up to the temperatures needed tohave a sustainable rate of fusion reactions, and this is done during the Plasma Ramp-Up and HeatingFlat-Top phases, mainly using the additional heating (AH) systems. Now, the most likely solutionallows for the use of three technologies for the AH: Electron Cyclotron Resonance Heating (ECRH),Ion Cyclotron Resonance Heating (ICRH) and Neutral Beam Injection (NBI) [7]. When the temperaturereaches the order of 107 K, the conditions inside the reactor allow to have self-sustained fusion reactionshappening, and this identifies the Burn Flat-Top phase. During this phase, the power demand from
3

Energies 2020, 13, 2157
the magnet system and the AH is minimum, while the thermal power generated is maximum. At theend of the burn phase, the reactor has to be brought back to the initial conditions avoiding shocks inthe plasma, and this is done during the Plasma Ramp-Down and the Dwell time.
Table 1. Plasma phases.
Phase Initial Time Phase Final Time Phase Duration Phase Name
−500 s 0 s 500 s CS pre-magnetization0 s 1.4 s 1.4 s Plasma Breakdown
1.4 s 184 s ≈183 s Plasma Ramp-Up184 s 194 s 10 s Heating Flat-Top194 s 7394 s 7200 s Burn Flat-Top7394 s 7540 s ≈146 s Plasma Ramp-Down7540 s 7740 s 200 s Dwell time
The whole operation of DEMO, in terms of input and output power of the facility, can be describedreferring to the phases resumed in Table 1.
For what concerns the power needed to operate the facility, two types of loads have to be considered:the steady-state loads and the pulsed loads. The first ones require a steady-state 50 Hz voltage input,i.e., auxiliaries, cryogenics, pumps or compressors for the PHTS, etc. The pulsed loads, i.e., magnetsystem and AH devices, have to be supplied with variable voltage waveforms, and so, they will beprovided with complex power conversion systems that are currently under study. The steady stateand pulsed loads are supplied by dedicated substations and distribution systems [5], respectively,the Steady State Electrical Power System (SS EPS) and the Pulsed Power Electrical Power System(PP EPS). By convention, the PP EPS is identified with its two subsystems, the Coil Power Supply PulsedEPS (CPSP EPS) and the Heating Power Supply Pulsed EPS (HPSP EPS), which supply the magnetssystem and the AH devices, respectively. From the generation point of view, instead, the generatorsubsystem is here conventionally referred to as Electrical Generator EPS (EG EPS). The connectionnode and the High Voltage/Medium Voltage (HV/MV) transformation sub-station are defined as HighVoltage Switchyard EPS (HVS EPS).
In order to have a preliminary overview of the facility’s demand, Figure 2 presents a qualitativeprofile of the input active power, derived from the data available in the EUROfusion private database.
Figure 2. Qualitative profile of DEMOnstration power plant (DEMO) active power demand duringone cycle.
Regarding the power generation, of course, the direct and indirect coupling cases have to beseparately considered to evaluate the output power profiles.
4

Energies 2020, 13, 2157
Despite being the simplest solution form the constructive point of view, the direct coupling betweenthe PHTS and the PCS leads to several thermomechanical and electrical concerns. Regarding thethermomechanical aspects, several studies, not public but available for the authors as researchersinvolved in DEMO project on the Eurofusion database, assess the impossibility of operating the turbinewith a completely direct coupling with the reactor. Firstly, the thermomechanical stresses due tothe abrupt changes in the steam mass flow rate would be unsustainable for the turbine, leading topremature failures of the turbine itself. To limit these cyclical stresses, the maximum steam mass flowrate has to be reached with a ramp. In particular, the nominal power of the turbine has to be reachedwith an increase of 10% of the nominal power per minute. Another limit concerns the minimumpower at which the turbine can be operated, that is, the minimum steam flow rate that can be supplied.In this case, the problem affects both the thermomechanical and the electrical aspects. Indeed, from thethermomechanical point of view, the turbine would suffer from the cyclical start and stop procedures,while from the electrical point of view the generator cannot lose the synchronism with the grid, so ithas to be kept spinning. This means that the turbine has to be supplied with the proper mass flow rateof steam also during the non-generation time. In particular, the minimum power of the turbine hasbeen set to 10% of the nominal power. During the reactor non-generation time, the solution currentlyunder study allows for the implementation of a small electrically heated molten-salts loop, designed toprovide the proper mass flow rate of steam to the turbine.
Referring to the latest studies, not public but available for the authors as researchers involved inDEMO project on the Eurofusion database, the nominal power of the steam turbine has been evaluatedto be around 790 MW. Considering a 5% value for the losses due to the coupling between the turbineand the synchronous generator, the nominal value for the electrical power output can be estimated tobe about 750 MW. Considering this nominal value and the limits previously reported in case of directcoupling between the PHTS and the PCS, the resulting active power profile is shown in Figure 3.
Figure 3. Electrical Generator (EG) active power output profile in case of direct coupling between thePrimary Heat Transfer System (PHTS) and the Power Conversion System (PCS).
For the indirect coupling configuration, the situation is more complex from the constructive pointof view, due to the IHTS and the molten-salts ESS, but the management of the turbine and of thegenerator is simpler. Indeed, in this case the steam flow rate supplied to the turbine can be maintainedpractically constant during the whole operation of the facility, like in a conventional power plant,minimizing both the thermomechanical and the electrical stresses.
Referring to the latest studies available on the EUROfusion private database, the nominal powerof the turbine in case of indirect coupling configuration is around 675 MW. Considering the samevalue used in the previous case for the efficiency of the turbine-synchronous generator coupling (0.95),
5

Energies 2020, 13, 2157
the resulting active power output at the EG level is around 640 MW. The resulting profile is reported inFigure 4.
Figure 4. EG active power output profile in case of indirect coupling between the PHTS and the PCS.
3. Connection of DEMO EG to the European Electrical Grid
Being the first fusion reactor able to deliver electrical power to the external grid, DEMO has toface new issues with respect to its predecessors. Of course, as it has been mentioned before, DEMO isnot a conventional power plant. However, since it uses a conventional thermodynamic cycle for theconversion and is connected to the grid through a synchronous generator, now it has to be consideredas a conventional power plant from the regulatory point of view.
In reference to the current European power systems regulation, as a synchronous generatorconnected to the transmission grid, for a proper operation, DEMO has to fulfil the requirements set bythe ENTSO-E. Specifically, these requirements are defined in the ENTSO-E Regulation of 14 April 2016“Establishing a network code on requirements for grid connection of generators” (commonly said RfGnetwork code) [8].
In what concerns synchronous generators, which in the code are referred to as synchronousPower Generating Modules (PGMs), the RfG distinguishes four categories, according to the voltagelevel of the connection and to power rating of the facility (identified as maximum capacity inside theregulation). The categories reported in the RfG are the following:
• Type A PGM, characterized by a voltage level at the connection point below 110 kV and maximumcapacity of 0.8 kW or more;
• Type B PGM, characterized by voltage level at the connection point below 110 kV and maximumcapacity between 1 MW and 50 MW;
• Type C PGM, characterized by voltage level at the connection point below 110 kV and maximumcapacity between 50 MW and 75 MW;
• Type D PGM, characterized by any voltage level at the connection point and maximum capacityhigher than 75 MW.
Therefore, for the specific case of DEMO, the requirements for Type D synchronous PGMs,namely those with a power rating higher than 75 MW, have to be considered. The requirements forType D PGMs deal with:
1. Frequency stability;2. Limited frequency sensitive mode—over-frequency;3. Admissible power reduction;
6

Energies 2020, 13, 2157
4. Limited frequency sensitive mode—under-frequency;5. Frequency sensitive mode;6. Capability of maintaining constant output;7. System restoration;8. Voltage stability;9. Robustness;10. General system management;11. Specific requirements for synchronous PGMs.
Since the research is still in a preliminary design phase, there is not enough information to analyzeall the aspects of the RfG. Therefore, for the purpose of this study, we will refer only to the main aspects,i.e., those that can have an actual impact on the current design choices. In particular, we will considerthe items in the list above from 1 to 7 and 11. The items from 1 to 6 deal with power generation andcontrol, while items 7 and 11, respectively, deal with the capability of restoring the system after ashutdown of the grid and with the reactive power capability of the synchronous generator.
3.1. Constant Power Output Requirement
The frequency stability requirement defines the frequency ranges, and respective time intervals,for which the PGM shall be able to remain connected and operate in the grid. Moreover, for item6 in the list above, in this range, the PGM shall be capable of maintaining a constant output at itstarget active power value. While in case of indirect coupling this requirement is fulfilled (Figure 4),it represents the strongest practical limitation to the choice of a direct coupling configuration, due tothe variability of the EG power output. Referring to the profile of the active power output reported inFigure 3, considering the large variation of the output power (from 75 to 750 MW) and the fast variationin time, no compensation could be possible on the electrical side. Therefore, if the direct couplingconfiguration has to be adopted, the only way to fulfill the constant output requirement is to act on themechanical power and so on the thermal power provided to the turbine or to act outside the mainturbine-generator (TG) group. Therefore, the constant output power can be achieved in two main ways:One way is to make the TG work at the same active power set-point during all the phases; the otherway is to couple the TG with an auxiliary generation set, even based on a totally different technology.
The first way can be seen as a category of solutions, all based on feeding a constant mass flow rateof steam to the steam turbine. Feeding always the same mass flow rate to the steam turbine essentiallymeans to have an auxiliary steam generator. Actually, in the direct coupling PHTS-PCS scheme,one auxiliary steam generator is already foreseen, but it only provides the steam needed to operatethe TG at the 10% of its nominal power (as mentioned in the previous section). Coherently withthe volumes involved, the ESS loop could be foreseen with a higher rating, in order to guarantee upto 100% of the nominal mass flow rate of steam to the TG. Since the ESS loop is currently foreseento be fed by an electric heater, it has to be considered that the net output power of the facility willbe lower. Moreover, the convenience of the direct coupling approach, which is mainly the simplicity ofconstruction with respect to the indirect coupling one, could be no longer that evident. Nonetheless,this solution could be even more complex than the pure indirect cycle.
The second solution is even more complex and expensive with respect to the first one, since itrequires the implementation of a secondary generation set able to compensate the generation duringthe non-production time of the reactor. Since the power rating of the auxiliary generation set should becomparable with that of the first one, this kind of solution appears to be unlikely to be implemented.At the connection with the external grid, the sum of the two generation sets would appear as a goodapproximation of a conventional Type D PGM, but actually, it would have an installed maximumpower capacity which is around two times the nominal one.
7

Energies 2020, 13, 2157
3.2. Power Control Capability Requirements
The Limited Frequency Sensitive Mode—Over/Under frequency (LFSM-O/U) is an operation policy,activated by the Transmission System Operator (TSO) when the grid is an emergency state of over/underfrequency and needs a fast decrease/increase of active power generation [9]. The Frequency SensitiveMode (FSM) instead represents the ordinary operating mode of a PGM, in which the power outputchanges in response to a change in the frequency of the system, in such a way that it supports therecovery of the target frequency [10]. Therefore, all the points from 2 to 5 deal with the powercontrol capability of the PGM. In particular, the most restrictive value defined in the RfG is 10%(so ΔPmax = 0.1 Pmax) power control capability, which is provided for the FSM operating mode. It isimportant to stress out that the provision of the power control capability is limited by the minimumregulating level and by the maximum capacity of the PGM. In addition, the ambient conditionsand the limitations on the operation near maximum capacity at low frequency of the PGM have tobe considered.
Regarding the indirect cycle configuration, while the stable and continuous operation with afixed active power set point should be guaranteed thanks to the IHTS, evaluations on the molten saltsESS-water coupling should be performed, in order to define the potential of the system in terms of rateof change of active power.
In case of direct coupling, moving from the profile in Figure 3, the continuous and dashed redlines in Figure 5 represent the profile that the generation should be able to maintain in order to operatein the European Network as a conventional Type D synchronous PGM. In particular, the continuousline represents the maximum capacity operation that by definition the PGM should be capable ofproviding continuously during the ordinary operation in the grid. The dashed line instead defines theactive power lower limit for the operation in case of FSM, with the power variation set to the maximumvalue of 10% of the maximum capacity as a conservative solution, since its actual value depends on theagreement carried out between the facility owner and the relevant TSO.
Figure 5. Active power output adapted to the European Network of Transmission System Operators(ENTSO-E) requirements.
Concerning the red dashed line, the capability of lowering the active power output, since thefusion thermal power has to be extracted in any case from the reactor (referring to generation time),it is sufficient to use suitable bypass valves upstream from the steam turbine. Of course, the solutionmust be compliant with the capacity of the condenser downstream the turbine that should be able toelaborate additional flows of steam and not only the double-phase flow coming from the turbine itself.For the direct coupling configuration, this condition should be already fulfilled since during the powerramps a variable portion of steam bypasses the steam turbine, so there could be no need for adjustmentsin these terms.
8

Energies 2020, 13, 2157
3.3. System Restoration Requirements
Concerning the system restoration, the relevant TSO may require the black start capability. A PGMwith the black start capability shall be able to restart from a shutdown without the external gridelectrical energy supply. This kind of service may be possible in case of indirect coupling, depending onthe size of the reserve and on the duration of the shutdown, but it is not compliant with the operationin case of direct coupling. Indeed, in case of a network shutdown, the reactor is likely to be shut downin turn, since its operation and security strongly depend on the network supply. Moreover, for thesame reason, the reactor cannot be restarted without the external grid, leading to the impossibility of ablack start of the PGM.
3.4. Specific Requirements for Type D Synchronous PGMs
The operation of a Type D synchronous PGM requires additional specifications, mainly in terms ofvoltage stability and so about reactive power capability at and below the maximum capacity. From theserequirements, we can extrapolate the maximum value for the Q/Pmax ratio that a Type D synchronousPGM connected to the European electrical grid should be able to provide. This means that we canevaluate a preliminary power rating, in terms of apparent power, of the synchronous machine thathas to be coupled with the steam turbine. Since the maximum value set in the RfG for this ratio is0.65, which means cosφ = 0.84 (a common value for machines of this rating that can be found also inliterature [11]), we will have that:
• In case of direct coupling, the maximum active power is equal to 750 MW during the burn phase;this means that the generator has to be able to supply Qmax_direct = 0.65·Pmax ≈ 490 MVAr, and thisresults in an apparent power rating of the machine of around 900 MVA;
• In case of indirect coupling, the maximum active power is equal to 640 MW; this means that thegenerator has to be able to supply Qmax_indirect = 0.65·Pmax ≈ 416 MVAr, and this results in anapparent power rating of the machine of around 765 MVA.
4. Layout Options for HV Switchyard Including the Generator
The results reported in this section take as reference the regulation on the connection of newfacilities provided by the Italian TSO, Terna [12], considering that the Italian policies are based on theENTSO-E prescriptions, so this approach is more conservative with respect to an approach based onthe European requirements.
Relying on the guidelines provided by Terna, the connection of new facilities to the national gridmust be planned in accordance with a proper procedure that is outlined in Figure 6.
Figure 6. Procedure for the connection of generators and consumers to the European grid.
9

Energies 2020, 13, 2157
In particular, considering that the project is still in a preliminary design phase, the first threesteps reported in Figure 6 will be considered in the analysis and so those that deal with the connectionplanning and not with the executive design, which are:
• The definition of the minimum value of power rating of the facility for which the connectionhas to be implemented in the transmission network, which is 10 MW; in particular, in case ofboth generation and demand facilities, the value to consider is the highest between the maximuminjection and the maximum demand.
• The definition of the voltage level of the point of connection of the new facilities.• The definition of the type of scheme to be implemented for the connection of the new facilities.
For the definition of the voltage level and of the connection scheme, the technical document [12]provides a table summarizing standard solutions, partially reported in Table 2.
Table 2. Standard solutions for voltage level and connection scheme of new generation ordemand facilities.
Power Rating of the Facility Nominal Voltage LevelStandard Solutions
Radial In-and-Out
Generation100–250 MW 120–150 kV Yes No200–350 MW 220–380 kV Yes Single busbar + bypass>350 MW 380 kV Yes Double bus bar
Demand20–50 MW 120–150 kV Yes Single busbar30–100 MW 120–150 kV Yes Single busbar>100 MW 220–380 kV Yes Single busbar + bypass
The in-and-out connection is performed with the implementation of a new station on an existingtransmission line. This means that the new station is supplied by two different transmission lines,coming from two different nodes. Therefore, the facility can ideally operate even when one of thelines is out of service. The radial connection is similar to the in-and-out one, but the connection startsfrom an existing station of the transmission line. This solution is generally adopted when the distancebetween the existing station and the facility is lower than 10 km.
Keeping in mind this simplified procedure to evaluate the connection characteristics, three possibleconfigurations have been considered for the connection of DEMO to the European transmission grid:
• Single Point of Delivery (POD); EG EPS, SS EPS and PP EPS are connected to the sameHV Switchyard;
• Double POD with EG-dedicated node; SS EPS and PP EPS are connected to one HV Switchyard,while the EG EPS is connected to another HV Switchyard;
• Double POD with PP EPS-dedicated node; SS EPS and EG EPS are connected to one HV Switchyard,while the PP EPS is connected to another HV Switchyard.
In the following subsections these solutions will be analyzed starting from power profileselaborated in the DIgSILENT PowerFactory simulation environment [13], moving from the dataavailable on the EUROfusion database in terms of production and consumption of the facility.Concerning the demand, the data refers to the assisted breakdown scenario, which allows for the useof EHCR during the breakdown phase to assist the magnets system, lowering the power peak requiredfor the plasma ignition.
4.1. Single POD
The single POD configuration is the one that requires the simplest implementation. In case ofsingle POD, DEMO would fall in the category of power generating/demanding facilities. This meansthat the value of power to be considered in the evaluation of the connection scheme is the highestbetween the generation maximum power and the demand maximum power [12].
10

Energies 2020, 13, 2157
In Figure 7, the preliminary active power profiles are presented, in case of direct andindirect coupling.
Figure 7. Power profiles at the HV node in case of single Point of Delivery (POD) configuration.
As shown in Figure 7, in case of direct coupling, the maximum power absorbed is around500 MW, while the maximum power injected is around 360 MW. The maximum power is reachedin “demand mode”, and its value is higher than 100 MW. This means (considering Table 2) that theconnection shall be performed at the highest available voltage level with the implementation of anin-and-out single bus-bar scheme with bypass. In case of indirect coupling instead, we can see thatthere is a peak of injected power of around 650 MW, which is higher than the peak of absorbed power,so the connection has to be performed at the highest available voltage level with the implementationof an in-and-out double bus-bar scheme (Figure 8). Of course, also the radial configuration can beadopted if allowed by the distance of the station.
Figure 8. In-and-out double bus-bar connection scheme in case of single POD.
11

Energies 2020, 13, 2157
With the implementation of a single POD, the node cannot be seen from the external grid pointof view as a proper generation node. This means that the current legislation on the connection ofgenerators (RfG code) to the grid cannot be applied. Moreover, this configuration is as easy to implementas it is dangerous, both for the operation of the facility and of the network. In fact, the high-powerspikes absorbed by the converters to feed the PP EPS loads would jeopardize the functioning of thegenerator, since it would be the nearest source of power. This implies high transient electromechanicaltorque applied to the shaft of the TG, whose integrity could be seriously compromised, both for themagnitude and for the cyclicality of the resistive torque. To avoid this situation, an electrical ESS couldbe implemented upstream the PP EPS, to limit the power derivatives.
4.2. Double POD with EG-Dedicated Node
It is clear that the generator should be decoupled as much as possible from the PP EPS supply.One way to do so is by implementing a double POD solution, with one POD dedicated to the EG EPSand the second one for the SS EPS and PP EPS. Figure 9 shows the active power profile at the POD forthe SS EPS plus PP EPS, and Figure 10 shows the generation profile of the EG EPS.
Figure 9. Power profile at the Steady State Electrical Power System (SS EPS) + Electrical Power System(PP EPS) HV node in case of double POD configuration.
Figure 10. Power output of the generator in case of direct and indirect coupling.
12

Energies 2020, 13, 2157
For convention, the power supplied by the external grid is represented as positive, while thepower injected into the grid is negative. However, in Figure 10 the generator output power profile isdefined from the generator point of view, so it is represented as positive. Of course, from the externalgrid point of view, that power is negative, since it is injected into the grid itself.
Regarding the SS EPS plus PP EPS POD, since the maximum power required from the grid isaround 700 MW, the connection shall be performed at the highest voltage level available, with theimplementation of an in-and-out single bus-bar scheme with bypass (see Table 2). Concerning theEG dedicated POD instead, the maximum power injected is 750 MW in case of direct coupling and640 MW in case of indirect coupling. Therefore, independently from the coupling configuration, theconnection shall be performed at the highest voltage level available, with the implementation of anin-and-out double bus-bar scheme.
Figure 11 reports the in-and-out connection schemes in case of double POD configuration withEG-dedicated node.
Figure 11. In-and-out connection scheme in case of double POD with EG-dedicated node.
As long as the generation node is well defined, all the requirements for the connection andoperation of PGMs in the grid can be applied. Assuming the two POD to be fed by stations of theTransmission Network that are far enough from each other (in an electrical sense), in this configuration,the generator could operate more safely. Moreover, it could operate in line with the prescriptions forits specific category, bearing in mind the intrinsic limitations of the plant evaluated in Section 3.
Of course, from the demand point of view, the influence of the pulsed loads in this case iscompletely reflected to the transmission system.
4.3. Double POD with PP EPS-Dedicated Node
Another possible solution is the implementation of a double POD with one node dedicated tothe PP EPS. Regarding the SS EPS plus EG EPS node, Figure 12 shows that, both in case of direct andindirect coupling, the maximum power is attained in generation mode, so the requirements to applyfor the connection are those referred to the generation nodes.
13

Energies 2020, 13, 2157
Figure 12. Power profiles at the SS EPS + EG EPS HV node in case of double POD configuration.
In particular, since the maximum power injected is higher than 350 MW, the connection shallbe implemented at the highest available voltage level, with the in-and-out double bus-bar scheme(Table 2). In case of indirect coupling, the node appears to grid as a simple generation node, since thepower needed for the SS EPS is entirely supplied by the EG EPS during all the operational phases.Therefore, of course the net output at the HV node level is lower than the previous configuration(EG-dedicated node), but the requirements for the connection and operation of PGMs in the grid arestill applicable. In case of direct coupling instead, the node is both a generation and demand nodesince the EG EPS can only supply the whole power required from the SS EPS during the burn time.
Concerning the PP EPS-dedicated POD, the preliminary power profile at the HV node is presentedin Figure 13.
Figure 13. Power profile at PP EPS-dedicated HV node in case of double POD configuration.
14

Energies 2020, 13, 2157
The maximum power absorbed at the node level is higher than 100 MW, so the connection shallbe implemented at the highest voltage level available with the in-and-out single bus-bar schemewith bypass.
Figure 14 reports the in-and-out connection schemes in case of double POD configuration with PPEPS-dedicated node.
Figure 14. In-and-out connection scheme in case of double POD with PP EPS-dedicated node.
This configuration allows preserving the advantages of the previous case, decoupling both the SSEPS and the EG EPS from the supply of the PP EPS. Since the SS EPS requires practically constant inputpower, the generator can operate safely, supplying both the internal SS power system and the gridwithout further stresses and, in case of indirect coupling, as a conventional PGM connected to the grid.At the same time, the power peaks detected by the grid at the PP EPS POD, are of course lower thanthose related to the previous case where the SS EPS contribution makes them reach higher values.
5. Features of the Point of Delivery (POD)
This section reports further evaluations on the Point of Delivery (POD) that can be performedstarting from the preliminary power profiles elaborated through DIgSILENT PowerFactory [13].Indeed, talking about the active power profiles, some data can be extrapolated in order to have anidea of the main electrical features of the HV node (or nodes) to which DEMO should be connected.Concerning the reactive power instead, some general considerations are reported.
5.1. Power-Frequency Control
The requirements in terms of frequency control and admissible frequency variations aredefined in the ENTO-E document “P1—Policy 1: Load-Frequency Control and Performance” [14].The power-frequency characteristic of a power system is linked to its capability of limiting the frequencyvariation during an event of unbalance between generation and demand. The power-frequencyvariation is expressed in MW/Hz, so it physically represents the value of power variation in MW thatcauses a frequency variation of one Hz. Policy 1 [14] defines minimum and average power-frequencycontrol characteristics in Continental Europe, which are respectively 15 GW/Hz and 19.5 GW/Hz.Other important values of the Policy 1 [14] that we have to consider for the purpose of this analysis arethe “minimum instantaneous frequency after a loss of generation” and the “maximum instantaneousfrequency after a loss of load”, which are respectively 49.2 Hz and 50.8 Hz. This means that themaximum frequency deviation accepted in Continental Europe’s synchronous area is ±800 mHz fromthe nominal value. However, it has to he stressed out that these values refer to the loss of a load orof a generation node; they do not refer to the ordinary operation of the grid. Indeed, to have a morereliable limit we should consider the maximum permissible quasi-steady-state frequency deviationthat is set to ±200 mHz. This frequency deviation also represents the limit for which all the available
15

Energies 2020, 13, 2157
primary control reserves are expected to be fully activated. In fact, this value represents the maximumvalue that can be managed only relying on the primary frequency control.
Regarding our specific case, analyzing the active power profiles, it is possible to identify severalpower steps, mainly due to the functioning of the magnets system and of the AH devices. In particular,the most severe event in this sense is a 426 MW active power step that occurs during the PlasmaRamp-up phase. The event, reported in Figure 15, is caused by the PP EPS operation.
Figure 15. Active Power step required by the PP EPS during the Plasma Ramp-up phase.
Since this power step is caused by the PP EPS, it will be present in each configuration we consideredin the previous section for the connection of DEMO to the electrical grid. Therefore, independentlyfrom the solution adopted, we have to evaluate the effect of this event on the grid. Considering theaverage value of power-frequency control characteristic for Continental Europe, we can calculatethe frequency deviation caused by the step in Figure 15, which turns out to be around +21.85 mHz,significantly lower than the 200 mHz limit. Indeed, the 200 mHz limit is reached in case of whatis called Reference Incident inside the ENTSO-E documents, i.e., an unbalance between generationand demand of 3 GW. Nonetheless, this event refers to an unbalance condition distributed inside theEuropean transmission grid and not to an unbalance in a single node. In this sense, the effect of a426 MW active power on the grid step must not be underestimated just because it theoretically doesnot generate a significant frequency deviation from the nominal value. Moreover, it must be stressedout that this step is not occasional but is cyclically repeated during DEMO operation, so this is anothercritical aspect.
5.2. Voltage Drop and Short-Circuit Power
Considering the reactive power, the connection node should be characterized through theshort-circuit power. The link between the reactive power and the short-circuit power of the node isthe voltage drop. It is well known that, for a fixed value of reactive power required by the facility,a higher short-circuit power of the connection node involves a lower voltage drop at node level.A first approximation of the voltage drop, expressed in per unit, ΔV [p.u.] caused by a variation ofreactive power ΔQ on a node with a short-circuit power Ssc is provided by the well-known formulaΔV [p.u.] = ΔQ/Ssc.
Since for now there is not any reliable data regarding the actual reactive power required for theoperation of DEMO (mainly for what concerns the supply of the pulsed loads), we cannot really definea specific value for the short-circuit power needed at the connection node. Nevertheless, we can
16
Energies 2020, 13, 2157
adopt an opposite approach starting from a reasonable value for the short-circuit power and from therequirements in terms of voltage drop defined by ENTSO-E. Bypassing the requirements in terms ofpower factor and so assuming DEMO to be a non-conventional demand facility, we can preliminarilyestimate a reasonable maximum value of reactive power that the facility can demand from the grid.
Considering the studies carried out on ITER [15] and the size of DEMO with respect to itspredecessor, the new facility is likely to be connected to a node with a short-circuit power rating inthe order of at least 30–40 GVA. This value seems reasonable considering the configuration of theEuropean electrical grid and also considering that nodes with this rating can be also found in Italy [16],where the shape of the country does not facilitate the creation of highly meshed grids (which meanshigher reliability and also higher short-circuit power).
Bearing in mind this range of values for the short-circuit power, we must define a range of valuesfor the voltage drop that do make sense for the specific case. Considering that most of the reactivepower will be required by the PP EPS (due to the power conversion systems), an estimation based on amaximum voltage drop at the connection node, around ± 3 ÷ 5%, should be conservative and reliable.Indeed, the 3% value for the voltage drop is the one assumed for the Pulsed Power Electrical Network(PPEN) in ITER, which corresponds to the PP EPS in our case, as mentioned in the System RequirementsDocuments of ITER (available in the ITER private database). Due to the considerably greater size ofDEMO, it makes sense to assume a wider range for the voltage drop.
Defining the worst case in terms of short-circuit power and voltage drop, i.e., 30 MVA and 3%,respectively, the resulting maximum reactive power demand from DEMO facility is around 900 MVAr.
Unlike the considerations reported for the active power related aspects, in this case the PODconfiguration affects the evaluations. As already mentioned, the main concerns in terms of reactivepower absorption come from the power electronic devices needed to supply the magnets system andthe AH and so the pulsed loads. Therefore, if the PP EPS is isolated from the other substations, whichmeans we are adopting the third configuration (see Section 4.3), we can consider only its node as anunconventional demand node, and we can cut the contribution of the SS EPS to the total reactivepower required from that specific node. If the first configuration is considered instead (see Section 4.1),since the EG EPS could not be operated as a conventional PGM in any case, the possibility of using itfor the internal reactive power compensation is not to be excluded, still bearing in mind the drawbacksof this solution.
6. Conclusions
Considering the state of the art of the DEMO project, the present work has been carried out withthe purpose of providing some cause for reflection on the choices that have been made and that willbe made; it is not meant to define final design solutions. In fact, it is important to stress out that at thisstage of the design, the data is continuously questioned, so the analyses carried out for the realizationof this article aim at providing guidelines, procedures and addresses.
The data available from the studies that are being performed in research centers all over Europeallowed a first estimation of the input and output power profiles of the facility. Through the analysisof these profiles, it has been possible to evaluate the limitations of the facility, both in case of directand indirect coupling between the PHTS and the PCS, from the generator operation point of view.In this sense, the conclusion is that the direct coupling configuration, despite being the simplest fromthe constructive point of view, would lead to the impossibility of considering DEMO as a conventionalpower plant, unless significant adjustments are foreseen. In any case, the eventuality that DEMO couldbe considered as a non-conventional generation and demand facility is not to be excluded. In this sense,no matter which configuration will be selected, the European grid could allow the operation of thefacility. However, this would not be in line with the purpose of the whole roadmap, since it would leadto a single facility that is allowed to operate freely in the grid. If designed on these terms, DEMO wouldnot be a model for real fusion power plant prototypes; it would be a model for a new generation ofnon-dispatchable generation plants.
17

Energies 2020, 13, 2157
Regarding the connection configuration and characteristics, this article presented threepossible solutions. In particular, the solution that allows for the implementation of an EG-dedicatedpoint of delivery, even if it is theoretically not in line with the idea at the base of DEMO, which is theself-sustainment of its loads, is the one that shows more advantages. From the grid connection pointof view, the generator could be operated in line with the requirements for its category, being the node apure generation node. From the facility point of view instead, the turbine-generator group would bedecoupled from the power spikes absorbed and injected by the PP EPS, guaranteeing a longer life ofthe mechanical components.
Author Contributions: Conceptualization, M.C.F. and M.P.C.; methodology, M.C.F. and M.P.C.; software, M.P.C.;validation, M.C.F., A.L. and S.C.; formal analysis, M.C.F. and M.P.C.; investigation M.P.C.; resources, A.L. andS.C. data curation, M.P.C. and A.L.; writing—original draft preparation, M.P.C.; writing—review and editing,M.P.C. and M.C.F.; visualization, M.P.C.; supervision, M.C.F., A.L. and S.C.; project administration, M.C.F., A.L.and S.C.; funding acquisition, M.C.F., A.L. and S.C. All authors have read and agreed to the published version ofthe manuscript.
Funding: This work has been carried out within the framework of the EUROfusion Consortium and has receivedfunding from the Euratom Research and Training Programme 2014–2018 and 2019–2020 under grant agreementNo 633053. The views and opinions expressed herein do not necessarily reflect those of the European Commission.
Conflicts of Interest: The authors declare no conflict of interest.
References
1. EUROfusion, European Research Roadmap to the Realization of Fusion Energy. 2018. Available online:https://www.euro-fusion.org/eurofusion/roadmap/ (accessed on 30 March 2020).
2. ITER. What Will ITER Do? Available online: https://www.iter.org/sci/Goals (accessed on 30 March 2020).3. Barucca, L.; Ciattaglia, S.; Chantant, M.; Del Nevo, A.; Hering, W. Status of EU DEMO Heat Transport and
Power Conversion Systems. Fusion Eng. Des. 2017, 136, 1557–1566. [CrossRef]4. Morris, J.; Kovari, M. Time-dependent power requirements for pulsed fusion reactors in system codes.
Fusion Eng. Des. 2017, 124, 1203–1206. [CrossRef]5. Federici, G.; Bachmann, C.; Barucca, L.; Biel, W.; Boccaccini, L.; Brown, R.; Bustreo, C.; Ciattaglia, S.;
Cismondi, F.; Coleman, M.; et al. DEMO design activity in Europe: Progress and updates. Fusion Eng. Des.2018, 136, 729–741.
6. Ciattaglia, S.; Federici, G.; Barucca, L.; Lampasi, A.; Minucci, S.; Moscato, I. The European DEMO FusionReactor: Design Status and Challenges from Balance of Plant Point of View. In Proceedings of the 17IEEE International Conference on Environment and Electrical Engineering (EEEIC 2017), Milan, Italy,6–9 June 2017.
7. Lampasi, A.; Minucci, S. Survey of Electric Power Supplies Used in Nuclear Fusion Experiments.In Proceedings of the 17 IEEE International Conference on Environment and Electrical Engineering (EEEIC2017), Milan, Italy, 6–9 June 2017.
8. ENTSO-E. COMMISSION REGULATION (EU) 2016/631 of 14 April 2016 Establishing a Network Code onRequirements for Grid Connection of Generators; ENTSO-E: Brussels, Belgium, 2016.
9. ENTSO-E. Limited Frequency Sensitive Mode, ENTSO-E Guidance Document for National Implementation forNetwork Codes on Grid Connection, 31 January 2018; ENTSO-E: Brussels, Belgium, 2018.
10. ENTSO-E. Frequency Sensitive Mode, ENTSO-E Guidance Document for National Implementation for NetworkCodes on Grid Connection, 7 November 2017; ENTSO-E: Brussels, Belgium, 2017.
11. Fitzgerald, A.; Kingsley, C.; Umans, S. Electric Machinery; McGraw-Hill Education; McGraw-Hill: York, NY,USA, 2002; Chapter 5.5; pp. 293–294.
12. Terna, Guida Agli Schemi di Connessione. Attachment A2 of Terna Network Code, July 2015; Terna:Rome, Italy, 2015. Available online: https://download.terna.it/terna/0000/0105/19.pdf (accessed on30 March 2020).
13. DIgSILENT. Load Flow Analysis. Available online: https://www.digsilent.de/en/load-flow-analysis.html(accessed on 30 March 2020).
14. UCTE. Continental Europe Operation Handbook P1, Load-Frequency Control and Performance; UCTE:Brussels, Belgium, 2009.
18

Energies 2020, 13, 2157
15. Benfatto, I. Power converters for ITER. Comput. Sci 2006, 231–247. Available online: http://cds.cern.ch/record/987554/files/p231.pdf?version=1 (accessed on 30 March 2020).
16. Terna. Qualità del Servizio di Trasmissione, Valori Minimi e Massimi Convenzionali Della Corrente di Cortocircuito eDella Potenza di Cortocircuito Della Rete Rilevante con Tensione 380-220-150-132 kV; Terna: Rome, Italy, 2017.
© 2020 by the authors. Licensee MDPI, Basel, Switzerland. This article is an open accessarticle distributed under the terms and conditions of the Creative Commons Attribution(CC BY) license (http://creativecommons.org/licenses/by/4.0/).
19


energies
Article
Electrical Loads and Power Systems for the DEMONuclear Fusion Project
Simone Minucci 1, Stefano Panella 2, Sergio Ciattaglia 3, Maria Carmen Falvo 2 and
Alessandro Lampasi 4,*
1 Department of Economics, Engineering, Society and Business Organization, University of Tuscia,01100 Viterbo, Italy; [email protected]
2 Department of Astronautics, Energy and Electrical Engineering, University of Rome Sapienza, 00184 Rome,Italy; [email protected] (S.P.); [email protected] (M.C.F.)
3 EUROfusion Consortium, 85748 Garching bei München, Germany; [email protected] National Agency for New Technologies, Energy and Sustainable Economic Development (ENEA),
00044 Frascati, Italy* Correspondence: [email protected]
Received: 16 March 2020; Accepted: 22 April 2020; Published: 4 May 2020
Abstract: EU-DEMO is a European project, having the ambitious goal to be the first demonstrativepower plant based on nuclear fusion. The electrical power that is expected to be produced is in theorder of 700–800 MW, to be delivered via a connection to the European High Voltage electrical grid.The initiation and control of fusion processes, besides the problems related to the nuclear physics,need very complex electrical systems. Moreover, also the conversion of the output power is nottrivial, especially because of the inherent discontinuity in the EU-DEMO operations. The presentarticle concerns preliminary studies for the feasibility and realization of the nuclear fusion powerplant EU-DEMO, with a special focus on the power electrical systems. In particular, the first stage ofthe study deals with the survey and analysis of the electrical loads, starting from the steady-stateloads. Their impact is so relevant that could jeopardy the efficiency and the convenience of the plantitself. Afterwards, the loads are inserted into a preliminary internal distribution grid, sizing the mainelectrical components to carry out the power flow analysis, which is based on simulation modelsimplemented in the DIgSILENT PowerFactory software.
Keywords: balance of plant; DEMO; electric loads; nuclear fusion; plasma; power flow; powersupply; power systems
1. Introduction
EU-DEMO (the DEMOnstration fusion power reactor proposed by the European Union), or simplyDEMO, is a unique European project, as it will be the first demonstrative nuclear fusion power plantable to produce and distribute electrical power throughout Europe, thanks to a connection with theEuropean High Voltage (HV) electrical grid (typically at 400 kV) [1–3].
To accomplish this challenging purpose, the European Union set up the EUROfusion Consortium,whose main goals and tasks are summarized in the “European Research Roadmap to the Realisation ofFusion Energy” [4]. The schedule and the milestones of the Roadmap are sketched in Figure 1.
Even though other alternative approaches are being investigated in EUROfusion [4] and in anotherresearch facility [5], the EUROfusion Roadmap is based on two tokamak projects: DEMO and ITER [6].The latter is currently under construction in Cadarache (France) with a worldwide contribution andaims at:
• Producing 500 MW of fusion power for pulses of at least 400 s.
Energies 2020, 13, 2269; doi:10.3390/en13092269 www.mdpi.com/journal/energies21

Energies 2020, 13, 2269
• Demonstrating the integrated operation of technologies for a fusion power plant.• Achieving a deuterium-tritium plasma where reactions are sustained through internal heating.• Testing tritium breeding.• Demonstrating the safety characteristics of a fusion device, both for human and environment.
Figure 1. Overview of the European Roadmap to the realization of Fusion Energy [4]. The reporteddates are still indicative.
These goals are important and partially common with the DEMO project, so that it can useITER-like solutions for possible future issues. However, DEMO will be bigger than ITER in terms ofsize and of required services, also because it will be connected to the grid to deliver the producedelectrical energy, unlike ITER. Also the time required for the realization of these two projects is different:while it is foreseen to start ITER first experiments by 2025 and to operate with deuterium and tritiumby 2035, DEMO is expected to be in operation around by 2050.
In the past, fusion devices were generally not regarded as nuclear facilities and did not need anuclear license. However, ITER and DEMO are much more critical in terms of tritium inventory, neutronflux, pulse duration, stored magnetic energy, cooling system enthalpy and amount of helium at 4 K.ITER demonstrated its safety and obtained the nuclear license to start the construction. Nevertheless,specific nuclear regulations are likely to be introduced for next-generation devices, also dependingon the host country. As DEMO is expected to have more neutronic flux and more inventory oftritium than ITER, a license from authorities will be necessary before starting the construction ofsafety-classified systems.
As a nuclear facility, a specific design is necessary for the DEMO Balance of Plant (BoP), that isthe nuclear engineering term referred to all the supporting and auxiliary systems needed for energyconversion and delivering, excluding all the nuclear components. Therefore, EUROfusion is promotinga multidisciplinary research and engineering activity that is approaching the design of the DEMOBoP [7,8], even moving from the experience of the other experimental tokamaks and nuclear-fissionpower plants. One of the most critical part of the BoP is the electrical power system, also because thissystem is not trivial both in terms of size and of complexity.
22

Energies 2020, 13, 2269
The present paper introduces the preliminary studies for the feasibility and realization of theelectrical system of the nuclear fusion power plant DEMO. In particular, the results of the followingactivities are described:
• Characterization and classification of the expected of the electrical loads belonging to the specificDEMO systems by analyzing literature data, technical specifications and design progresses ofDEMO itself and of previous tokamak plants, especially ITER and its satellites JT-60SA [9] andDTT [10].
• Preliminary design of part of the internal distribution network and preliminary sizing of the mainelectrical components of part of the internal distribution grid (conception and development ofsimulation models for the power flow analysis) then implemented in the DIgSILENT PowerFactorysoftware environment.
The loads characterization and classification is the starting point for first electrical designsand is expected to provide more realistic data than those in previous analyses based on theoreticalconsiderations [11].
This paper is organized in seven sections. Section 2 introduces the relevant DEMO figures andexplains possible configurations and operation phases. Section 3 presents the preliminary layout ofthe DEMO site as used for the electrical analysis. Section 4 introduces the main options of the BoPand the basic principles for the design of the electrical systems. Section 5 is focused on the survey ofthe main DEMO subsystems and electrical loads and on the results obtained by the load analysis andcharacterization. Section 6 presents the results on the preliminary design and sizing of a part of theinternal distribution grid. Section 7 reports the paper’s conclusions.
2. DEMO Characteristics and Operation Phases
The tokamak operations are based on the heating of a plasma up to temperatures at which it isself-sustained by the fusion processes induced by the ion thermal motion. In DEMO, the plasma heatsup the surrounding structure, the tokamak Breeding Blanket (BB), and the fluid used to cool down theBB can drive a Turbine Generator (TG) through proper heat exchangers. The energy produced by suchprocess is expected to be higher than the energy employed to initiate the fusion reactions. In order toreach high temperatures (about 150 M◦C), DEMO could use three different kinds of additional Heatingand Current Drive (H&CD) systems [10,12]:
• Radiofrequency heating at ion cyclotron resonance frequency (ICRH), based on high-intensitybeams of electromagnetic radiation able to excite the ions in the plasma at their own resonancefrequency (in the order of tens of megahertz).
• Microwave heating at electron cyclotron resonance frequency (ECRH), based on electromagneticradiations able to heat the electrons (and then the ions) up in the plasma at their own resonancefrequency (in the order of hundreds of gigahertz).
• Negative neutral beam injectors (N-NBIs or simply NBIs), shooting neutral high-energy particlesinto the plasma where they transfer their energy by collisions.
The heat produced by the plasma fusion must be transferred to Power Conversion System (PCS)able to transform it into electrical energy with maximum possible efficiency and reliability: this isthe main scope of the BoP. In the present status of the DEMO project, two alternative solutions areconsidered as basic fluid to cool down the BB: water and helium [8,13,14]. Consequently, two optionsare considered for the Primary Heat Transfer System (PHTS):
• Water Cooled Lithium Lead (WCLL).• Helium Cooled Pebble Bed (HCPB).
The DEMO operations are strictly related to the physics of the plasma. This also implies a difficultyto achieve very long or steady-state operations that would be preferable for the energy budget. A lot of
23

Energies 2020, 13, 2269
fusion research is devoted to the possibility of steady-state operations, but presently without relevantpractical results. On the other hand, pulsed operations simplify tokamak physics and may be moreflexible in an energy market ruled by renewable sources. Presently, the DEMO operations are supposedto be pulsed in basic option but could be steady-state in future advanced ones. Therefore, unlikenuclear-fission power plants, the DEMO BoP and electrical systems must be designed for pulsedoperations for both the two cooling system options in the PHTS-PCS.
In fact, even though a relevant output power is produced only during the plasma flat-top phase,other operation phases are necessary to achieve the correct execution of the pulse. In particular,the DEMO operations consist of seven phases:
(1) Central solenoid (CS) pre-magnetization. Some superconductive magnets, in particular thoselocated in the toroid hole (CS), must be energized to attain a suitable value of magnetic flux intothe Vacuum Vessel (VV). The energization current in the DEMO CS modules is expected to be upto 45 kA and to span the range ±45 kA [15]. The duration of the pre-magnetization phase mainlydepends on the maximum possible charge rate of the superconductors. The pre-magnetization istypically executed by supplying the superconductors at rather constant voltage, producing anincreasing current and resulting in an increasing power demand from the grid. The start of thepre-magnetization phase is conventionally set to a negative value of time and ends at zero.
(2) Plasma breakdown. It is the shortest (about 1 s) but also the most critical phase from the powersupply point of view. The plasma initiation requires high-power pulses in several superconductingcoils (at least in the CS). The effective presence of the plasma in the tokamak vessel starts inthis phase.
(3) Plasma ramp-up. In this phase, the plasma current is progressively increased by the coils andH&CD sources. The ramp-up must be slow in order to keep the plasma under control. On theother hand, the available CS magnetic flux is consumed by the ramp-up duration, reducing theuseful time for the production of electrical energy.
(4) Heating flat-top. All the H&CD sources are used to heat up the plasma until fusion temperatureand conditions are reached.
(5) Burn flat-top. DEMO produces energy thanks to the nuclear fusion reactions. Ideally, during thisphase, the fusion reactions taking place at a sustainable rate guarantee the self-sustainment of theplasma. This phase is very long, about 7200 s (2 h).
(6) Plasma ramp-down. The plasma is gradually switched off, maintaining its control by coil andH&CD power.
(7) Dwell time. It is the time required after the pulse to bring DEMO to a condition stable enough tostart a new pulse and to create an adequate vacuum inside the plasma chamber. Of course, it isdesirable that the DEMO design will progress towards negligible dwell times. Actually, dwelltime conventionally includes also the CS pre-magnetization phase since the CS charging actionbelongs to those operations necessary to complete a pulse and start the following one. However,since this operation does not last the whole dwell time, in this work they are managed as twodifferent and consecutive phases.
This pulsed behavior may introduce specific problems for the BoP. First, discontinuous operationswould be damaging to the turbine, then the variable flow of the expected huge powers may let someinstabilities arise into the external grid that could even refuse or limit the connection. This problem iseven more critical because of the relevant reactive components in power. The durations of the mainplasma phases according to last DEMO design are summarized in Table 1.
24

Energies 2020, 13, 2269
Table 1. Summary of the DEMO operation phases with typical durations.
Phase Phase Name Typical Time Duration
1 CS pre-magnetization 500 s2 Plasma Breakdown 1.4 s
180 s3 Plasma ramp-up4 Heating flat-top 10 s5 Burn flat-top 7200 s6 Plasma ramp-down 150 s7 Dwell time 200 s
Total time duration of the DEMO operations ≈8240 s
In order to reduce the output power fluctuations, an intermediate buffer system could be insertedbetween the PHTS and the PCS. Therefore, two different approaches are under evaluation about thePHTS-PCS coupling [13,14] for both the two cooling options:
• PHTS-PCS direct cycle, characterized by direct coupling between the PHTS and the PCS.• PHTS-PCS indirect cycle, having an Intermediate Heat Transfer System (IHTS) and thermal Energy
Storage System (ESS) between the PHTS and the PCS.
The thermal efficiency in the direct cycle option is higher but the TG’s life cycle is compromisedbecause it is turned on only during the burn flat-top phase. The thermal energy is extracted from theBB by water or helium, then it is transferred to steam supplying the steam turbine.
In the indirect cycle, the PHTS is coupled with the PCS through the IHTS based on a molten-saltESS. Its task is to store thermal power during the burn flat-top phase (removed by the molten salt) andits delivery to the PCS. In this way, the TG can operate almost in steady-state at 80% of the PHTS-ratedpower without interruption nor fluctuations during the plasma phases when fusion heat is not availablefor energy conversion. Therefore, it can produce almost constant electrical power and rotate at a ratherconstant speed, thus avoiding thermo-mechanical cycling issues.
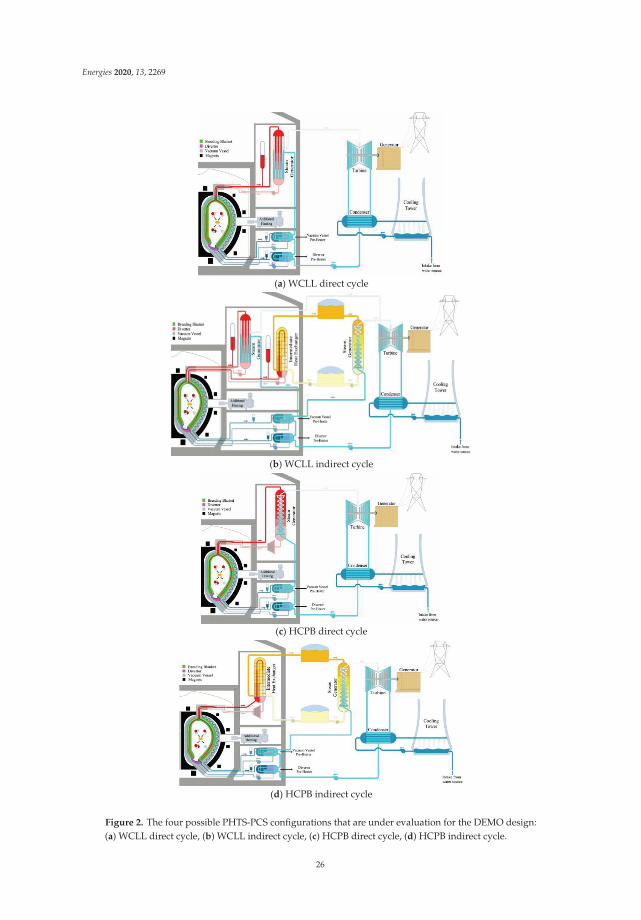
Considering the two coupling configurations and the two coolant options, the DEMO BoP couldbe based on one out of the following four different possible configurations, as summarized in Figure 2:
(1) WCLL in direct cycle (Figure 2a).(2) WCLL in indirect cycle (Figure 2b).(3) HCPB in direct cycle (Figure 2c).(4) HCPB in indirect cycle (Figure 2d).
It is worth noticing the presence of two steam generators in Figure 2b. Unlike the HCPBconfiguration in Figure 2d, the IHTS in the WCLL BoP takes and stores not all the power coming fromthe BB PHTS but only the fraction coming from the first wall that is delivered to the PCS during thedwell time using a suitable steam generator [13].
The selection of the optimal configuration is expected to be completed in the next years basing alsoon the outcomes of the research on the DEMO electrical loads and the design of its distribution network.
25
Energies 2020, 13, 2269
(a) WCLL direct cycle
(b) WCLL indirect cycle
(c) HCPB direct cycle
(d) HCPB indirect cycle
Figure 2. The four possible PHTS-PCS configurations that are under evaluation for the DEMO design:(a) WCLL direct cycle, (b) WCLL indirect cycle, (c) HCPB direct cycle, (d) HCPB indirect cycle.
26

Energies 2020, 13, 2269
3. Preliminary DEMO Layout
Figure 3 summarizes the preliminary layout that is presently expected for the DEMO site [7,16],mostly based on ITER’s one. The actual location of the DEMO site is not yet identified and will be definedalso following the outcomes of DEMO electrical analysis and requirements. Nevertheless, it is importantin order to assess the electrical distribution layout, the electrical loads and cables characteristics.
Figure 3. Preliminary layout of the EU-DEMO site.
4. Basic Principles for the Design of the DEMO Electrical Power System
DEMO power systems can be divided in three electrical distribution groups:
• Steady-State Electrical Network (SSEN), supplying all the auxiliaries, including the componentsrelevant for nuclear safety and the protection of the investments. The steady-state loads require arather constant power.
• Pulsed-Power Electrical Network (PPEN), supplying the pulsed loads, i.e. the superconductingcoils and the H&CD systems. The pulsed loads require a time-changing power only duringplasma operations.
• Turbine Generator (TG), connecting the DEMO power plant to the external grid to deliver the netelectrical power produced by the PCS.
Figure 4 shows a preliminary sketch of a possible configuration of the DEMO electrical powersystem with its three sub-distribution groups.
The scheme in Figure 4 should be integrated by emphasizing the buses for the safety loads and byinserting the systems for the reactive power compensation and harmonic filtering. Such systems arerelevant in ITER (occupying an area approximately corresponding to the DEMO Area 35 in Figure 3),but their ratings and placements can be defined in DEMO only after an adequate survey of theelectrical loads.
Because of the deeply different nature of the electrical loads connected at SSEN and PPENdistributions, the former can be exhaustively characterized into an electrical load list, as described inthe rest of the paper, but the latter need further specifications in terms of time evolution of the powerprofiles. Such difference heavily affects also the power profiles at the Point of Delivery, requiringfurther design and optimization stages to meet the requirements imposed by the grid regulator.
27

Energies 2020, 13, 2269
Figure 4. Preliminary sketch of a possible DEMO electrical power system configuration, emphasizingthe division of the electrical distribution into three groups: SSEN, PPEN and TG.
The amount of electrical power delivered by DEMO to the external grid depends on the selectedoption for the PHTS-PCS and on its control strategy. Figure 5 shows the input and output of theDEMO electric power depending of the PHTS coupling. The figure is essentially qualitative as PPENcontribution is still under analysis, but some data available for a non-optimized coil system show thatit could require input powers at breakdown even higher than 1 GW with relevant reactive powercomponents [15]. More in general, the input power requested could exceed the produced power insome time intervals.
Pin (SSEN+PPEN)
Bre
akdo
wn
Ram
p-up
Hea
ting
flat
-top
Burn flat-top Ramp-down
kdowdo
w
Dwell time
≈500 s ≈180 s ≈10 s 7200 s ≈150 s ≈500 s ≈200 s ≈10 s 7200 s ≈200 s
Pout Thermal output ≈2 GW
Electrical with direct coupling ≈800 MW Electrical power with
indirect coupling
≈200 s
Rotation kept by auxiliary steam
Time
Time
Figure 5. Qualitative (not in scale) curves of input (red line) and output powers. The thermal powerproduced by the plasma and fusion processes (purple line) can be transformed in an electrical powerwhose characteristics are different for the direct (green line) and indirect coupling (blue line).
28

Energies 2020, 13, 2269
With the direct PHTS-PCS coupling, the power for the DEMO electrical loads should be suppliedonly by the external grid during the dwell time between the pulses and during the ramp-up andramp-down phases too.
In order to avoid excessive mechanical and thermal stresses on the turbine, it is supplied with aproper mass flow rate of steam which has to guarantee the turbine operation at 10% of its nominalcapacity during the dwell time. In order to cover the steam production during the dwell time, the mostsuitable and efficient solution consists in the introduction of a small thermal ESS loop, managed in oneof the following three main configurations:
• The “Steam only” configuration uses a portion of the steam in the PHTS for the molten-salt loop.• The hybrid configuration provides for the coordinated use of the steam from the PHTS and an
electric heater.• The “Electric only” configuration foresees only the use of an electric heater.
The most efficient solution seems to be the third one due to temperature concerns [17]. Indeed,using the steam in the PHTS to heat the molten-salt hot tank does not allow reaching a temperaturehigh enough to guarantee proper conditions for the steam turbine during the dwell time. This couldresult in water damage to the steam turbine.
Besides the operation during the dwell time, thermodynamic analysis show that the maximumpower output of the turbine is evaluated to be around 790 MW [18]. Considering a conservativeefficiency of 0.95 for the turbine-synchronous generator coupling, the nominal active power to considerfor the generator is 750 MW. In literature, a common minimum power factor to operate synchronousgenerators results to be 0.8. This value is also adopted in some grid legislations [17] to identify thevalue of the reactive power that a generator should be able to supply to the grid when required, and soto build a reference capability curve. Considering this value for the power factor, the rating of thesynchronous generator in terms of apparent power is around 940 MVA.
This has to be considered an approximation since the variations in the prime mover power wouldactually cause transient phenomena at the synchronous machine level. From the reactive power pointof view instead, the nominal value that the generator could supply to the grid is around 565 MVAR,coming from the minimum power factor assumed. However, no assumptions can be made on thereactive power profile since, in general, it is dependent on the conditions of the external grid and so itis managed by the transmission system operator.
In order to find a coherent value for the output power and to assume an efficiency for the newthermodynamic cycle, it is necessary to know the thermal energy balance. Of course, this efficiencymight be different from the direct coupling case because of the presence of the IHTS. Using the IHTS,the turbine operates constantly at its nominal power, increasing the overall efficiency during the wholeoperation (no transients, no off-design conditions). On the other hand, the presence of a more complexheat exchange system may lead to less thermal power transferred to the PCS. For these reasons, a firstapproximation about the power output in case of indirect coupling has been evaluated as the totalenergy output during one pulse, divided by the total duration of the pulse. In this way, the nominalpower of the turbine has been calculated to be around 85% of the previous case. This leads to a ratedactive power of around 640 MW. Taking as a reference for the power factor the value adopted in theprevious case, for the indirect coupling configuration, the rated apparent power of the synchronousgenerator ranges around 800 MVA.
5. Summary of Electrical Loads Connected to the SSEN
The DEMO subsystems are organized according to a Plant Breakdown Structure (PBS), usedalso for the classifications of the electrical loads. Table 2 provides for each PBS a short description,the expected power and the electrical distribution system where the PBS and its loads is connected.Since some PBSs contain both loads connected to the SSEN and to the PPEN distribution networks,they are reported twice.
29

Energies 2020, 13, 2269
Table 2. EU-DEMO Project Plant Breakdown Structure (PBS) with expected powers and connection tothe distribution grid.
PBS PBS DescriptionPower
DistributionActive (MW) Reactive (MVAR)
11 Magnet System 0 0 Passive12 Vacuum Vessel (VV) 0 0 Passive13 Divertor System 0 0 Passive14 Blanket (HCPB) 1 0 0 Passive16 Blanket (WCLL) 1 0 0 Passive18 Limiter 0 0 Passive20 Cryostat 0 0 Passive21 Thermal Shields 0 0 Passive22 Tritium, Fueling, Vacuum 12.2 7.7 SSEN25 Tritium Extraction and Removal (HCPB) 1 3.0 1.9 SSEN27 Tritium Extraction and Removal (WCLL) 1 3.0 1.9 SSEN30 ECRH System (main power) 2,3 125.0 60.5 PPEN30 ECRH System (auxiliary power) 2 6.0 2.9 SSEN31 NBI System (main power) 2,3 125.0 60.5 PPEN31 NBI System (auxiliary power) 2 6.0 2.9 SSEN32 ICRH System (main power) 2,3 125.0 60.5 PPEN32 ICRH System (auxiliary power) 2 6.0 2.9 SSEN40 Plasma Diagnostic & Control System 6.1 3.0 SSEN49 VV PHTS 9.7 4.7 SSEN50 Breeding Blanket PHTS (HCPB) 1,3 165.6 54.4 SSEN52 Breeding Blanket PHTS (WCLL) 1 59.4 19.5 SSEN54 VV Pressure Suppression System (HCPB) 1 2.3 0.0 SSEN56 VV Pressure Suppression System (WCLL) 1 4.6 2.9 SSEN58 Divertor & Limiter PHTS (HCPB) 1 19.5 12.1 SSEN59 Divertor & Limiter PHTS (WCLL) 1 10.0 6.2 SSEN60 Remote Maintenance (RM) System 4 5.0 3.1 SSEN61 Assembly 4.6 2.2 SSEN63 Radwaste Treatment and Storage 3.0 1.5 SSEN70 Balance of Plant (HCPB) 1 12.0 5.8 SSEN72 Balance of Plant (WCLL) 1 12.0 5.8 SSEN80 Site Utilities 3.1 1.9 SSEN81 Cryoplant & Cryodistribution 101.8 63.1 SSEN82 Electrical Power Supply (main power) 3 300.0 300.0 PPEN82 Electrical Power Supply (auxiliary power) 21.0 10.2 SSEN83 Buildings 54.8 26.6 SSEN85 Plant Control System 3.6 1.7 SSEN87 Auxiliaries 90.9 56.4 SSEN
1 The PBSs referred to the HCPB and WCLL options are alternative: once the final configuration will be selected,only one of the two reported powers will be requested in DEMO. 2 The powers reported for the H&CD systems(PBSs 30, 31 and 32) were estimated for the reference solution with related efficiencies (see Section 5.3). 3 Since thepowers absorbed by these PBSs are not constant, their peak powers are reported. While the PPEN loads (PBSs 30, 31,32 and 82) may be very variable, the load of PBS 50 is reduced to 20% in some phases as described in Section 5.5.4 Even if RM System is connected to the SSEN, it mainly operates during specific maintenance phases and notduring plasma phases in Table 1.
Passive systems are those not absorbing any significant electrical power. However, it is worthmentioning that systems which are labelled as passive may require a small amount of power for theinstrumentation and control systems. In such cases, this power is accounted in PBS 40 or 85.
Some of listed PBSs of the project are still at very preliminary stage or under design. To provide afirst estimation of the electrical power absorbed by these subsystem, and to carry out a comprehensive(although preliminary) power flow analysis of the DEMO plant, a first guess based on reasonableextrapolation from the ITER loads and power profiles was used.
For each of the PBSs listed in Table 2 the information necessary to run power flow analyses wereinvestigated, as the load type (if belonging to SSEN or PPEN distribution), the voltage level and the
30

Energies 2020, 13, 2269
power absorption in terms of active power and power factor. Whenever no information coming fromthe design layout regarding the power factor were available, a local reactive power compensationsystem is supposed for each subsystem, regulating it at a value equal to 0.95.
Note that the total input power requested by DEMO cannot be estimated only by summing theentries in Table 2 because: (i) HCPB and WCLL cooling options are alternative and (ii) the powerabsorbed by loads belonging to PBSs 30, 31, 32, 50 and 82 are not constant for all the phases, being thempulsed. In these cases, the only peak values of the power are reported. In particular, the PPEN loadsrequire high powers only to initiate (phases 1 and 2 in Table 1), ramp (phases 3 and 6) and heat (phase4) the plasma, while their contribution is lower than the output power for most of the operational time(phase 5). The details for the PPEN power profiles will be developed in next years.
The following subsections provide a brief description of the electrical loads for each “non-passive”DEMO PBS supplied by the SSEN distribution.
5.1. PBS 22: Tritium, Fueling and Vacuum
The DEMO PBS 22 collects all the components belonging to the subsystems devoted to the fuelcycle (e.g., isotope separation columns, water detritiation, molecular sieve beds), to the plasma fueling(e.g., pellet injection systems) and to the vacuum generation inside the plasma chamber (e.g., motorpumps and compressors). For all these subsystems, preliminary assumptions and designs are underevaluation based on the lesson learnt from ITER layout and projects. A first guess of the total electricalpower absorbed by the three subsystems is provided as 12.2 MW, from the information collected fromthe design progresses and from extrapolations from ITER, taking into account also the differencesbetween the two projects and how they reflect on the operation of each subsystem.
5.2. PBS 25/27: Tritium Extraction and Removal for HCPB/WCLL
Tritium Extraction and Removal is a subsystem devoted to the unburned and unexhausted tritiumextraction from the VV and its transportation to the fuel cycle system (PBS 22-1). Afterwards, it istreated, separated from its isotopes and re-injected inside the chamber to participate to the occurringfusion reactions. This system is at embryonic state and no information regarding its structure and itspower absorption have been evaluated at present, both for the two cases of cooling system based onhelium or water coolant. As a first guess of the power absorption, an extrapolation from ITER layoutwas carried out, obtaining an estimation of 3 MW.
5.3. PBS 30, 31 and 32: Heating and Current Drive (H&CD) Systems
The H&CD systems foreseen in DEMO are ECRH, ICRH and NBI. The optimal heating source mix,as well as the power to be delivered to the plasma, is still a key issue under investigation. The definitionof the final parameters is scheduled by the end of the conceptual phase, foreseen by the end of 2024.Up to now, the requests in terms of plasma heating and stabilization require to deliver 150 MW ofheating power to the plasma (that needs a much higher electrical power to be supplied). Three possibleoptions are under investigation to achieve the total amount:
• The reference solution consists in evenly distributing the total power among the three sources.• The alternative (and rather probable) solution consists in excluding ICRH and moving its power
to ECRH (100 MW) without changing the NBI.• An open option consists in producing all the necessary power by ECRH.
It is important to stress that the functions of the H&CD systems need to be supplied by twodifferent kinds of power supplies:
• Main Power Supplies, connected to the PPEN.• Auxiliary Power Supplies, connected to the SSEN.
31

Energies 2020, 13, 2269
In ITER the auxiliary powers of the H&CD systems are included in the respective PBSs and areaccounted to be all equal to about 3 MW. As the DEMO power supplies are expected to manage higherpowers, an auxiliary power of 6 MW is estimated from the SSEN for each of the three H&CD PBSs.
The issue of the time evolution and efficiencies [10,12] of the H&CD Main Power Supplies ismore complex and will be addressed in a future paper by the authors. The average efficiencies for theexpected technologies are foreseen to be about 40% of the power delivered to the plasma [12], resultingin a power of 125 MW for the main power of each H&CD system.
5.4. PBS 40: Plasma Diagnostics and Control Systems
Since the Plasma Diagnostic & Control System is still to be defined, the electrical power absorbedhas been estimated by the ITER data. However, since the DEMO facility is expected to be developedunder a more mature knowledge of fusion physics and technology with respect to ITER, its diagnosticsystem is supposed to be much simpler, leading to an estimation of 6.1 MW, supposing a global powerfactor equal to 0.9. The electrical power includes the local air conditioning of the cubicles servingthe diagnostics.
5.5. PBS 50: BB Primary Heat Transfer System (HCPB)
The Primary Heat Transfer System based on the HCPB collects all the components and systemsdevoted to the fusion heat recovery and delivery to the PCS. The main heat extraction zone is the BB,supplying about 85% of the total fusion heat. Other fusion heat sources such as the VV, limiter anddivertor are addressed in PBS 49 and PBS 58. As mentioned in Section 2, two possible layouts areunder investigation to couple PHTS to the PCS, in order to mitigate the intrinsically pulsed behavior ofthe plasma for TG, that are the indirect (Figure 2d) and direct coupling (Figure 2c).
In the first configuration, the electrical loads are related both to the PHTS and to the IHTS. Its aimis to recover heat to be supplied to the turbine during dwell time and all phases when fusion heat isnot available for energy conversion, in order to keep it constant in its operation.
In the direct cycle configuration, instead, the electrical loads are only those belonging to the PHTSsystem and those belonging to the small ESS.
Considering the segmentation option with 18 sectors (each of them including three outer blanketand two inner blanket segments), the HCPB BB is divided into nine independent circuits (for safetyreasons, in order to limit common-mode failures), serving two sectors each. The sectors are fed bynine loops (each with two compressors), six designed for the Outboard Blanket (OB) sectors and threedesigned for the Inboard Blanket (IB) sectors. The main electrical load for each loop is the electricalmotor connected to the compressors, for which a first power estimation is provided based on thethermo-hydraulic design of the loops themselves (9.2 MW of mechanical power per compressor withefficiency equal to 0.95).
Because of the very high electrical power absorbed by the motor compressors, resulting in a totalpower in the order of hundreds of megawatts, it was decided to regulate them in order to reducethe power consumption during the scenario phases when no thermal power comes from the fusionreactions. Unfortunately, the power transitions from regulated to full power and vice versa cannot beperformed at any time rate because the current technology for helium compressors allows a ramp-upand ramp-down at a maximum rate of about 10–20%/minute. Also with controlled ramps, the frequentpower variations induce stresses on the compressors that are justified by the relevant energy savingthat can be achieved (more than 100 MW for more than 500 s). Some possible modulations of thecompressor power are sketched in Figure 6. The selected modulation rate will be a trade-off betweenenergy saving and components stress. Presently, the assumed tradeoff is 20%/min but faster rates willbe investigated also considering technology progresses.
32

Energies 2020, 13, 2269
Pinput
20% Prated ≈2 MW 20% Prated
100% Prated ≈10 MW
≈500 s ≈180 s ≈10 s ≈7200 s≈1.4 s ≈150 s ≈200 s
CS pre-magnetization Ramp-up Ramp-down Dwell timeBurning flat-top
Time
Figure 6. Possible qualitative time evolutions of the power modulation of each of the 18 HCPB OB andIB BB compressors in order to reduce the total power demand. The assumed tradeoff is 20%/minute,a slower rate makes no sense, a faster rate could be detrimental for the components.
In the IHTS there is an intermediate heat exchanger based on “tubes and shell” technology: heliumflows into the tubes and molten salt crosses the shell side [13]. In order to mitigate the dynamic behaviorof the thermal fusion power between burn flat-top and dwell time on PCS components (particularly onTG and then on the electrical grid), the IHTS is equipped with an ESS. Its task is to store thermal powerduring burn flat-top phase (removed by the molten salt) and its delivery to the PCS in order to let theTG work almost in steady-state at 80% of the PHTS-rated power, thus avoiding thermo-mechanicalcycling issues. Its main electrical loads are the electrical motors moving the circulators present in theloops, whose electrical power was estimated from the thermo-hydraulic design of the IHTS system interms of mass flow rate and pressure drops. Besides, many other electrical loads regarding all auxiliarysystems are still to be evaluated both belonging to the PHTS and the IHTS system. Therefore, they arenot included in the present estimations since currently under design.
5.6. HCPB PBS 52: Primary Heat Transfer System (WCLL)
The PHTS based on the WCLL collects all the components and systems devoted to the fusion heatrecovery and delivery to the PCS. The main difference with respect to the HCPB architecture is that theheat exchanger is not between PHTS and PCS in the indirect coupling configuration but it receives andstores only the portion of thermal power coming from the first wall of the vessel. This solution aims toreduce the size of the IHTS and its ESS but needs the presence of a second steam generators betweenthe PHTS and the IHTS. However, the same considerations already mentioned for the HCPB hold forthe WCLL cooling system about the coupling between the PHTS and PCS as well as the electrical loadsto be included in the power flow analysis.
The PHTS consists of two different cooling systems, removing heat from two different partsof the blanket, namely the breeding zone and the tokamak first wall (addressed in PBS 59) and theVV (addressed in PBS 49). Both PHTSs consist of two loops, in order to limit the size of piping andcomponents. The breeding-zone PHTS loops include a steam generator, two pumps, one pressurizerand one hot/cold leg. The first-wall PHTS loops include one heat exchanger, one pump, one pressurizerand one hot/cold leg. Cold/hot ring headers supply/return water to the breeding-zone/first-wall loops.Summing all up, six main coolant pumps are foreseen in the present PHTS WCLL design: four maincoolant pumps, two per loop, are present in the cold legs of the breeding-zone PHTS and two maincoolant pumps in the first-wall PHTS.
The electrical loads are the electrical motors moving the pumps as well as the pressurizers.Conversely from the motor pumps, which absorb constant electrical power during the whole scenario,
33

Energies 2020, 13, 2269
the pressurizers are “time-random” electrical loads. They are resistors benches which heat the water upin order to increase the water pressure in pipes whenever the control system sense a pressure reduction.Therefore, they may or may not be switched on during the scenario and not at the same electricalpower. In practice, the total power of the pressurizer is 2 MW in standard conditions but when thepressure drops below the minimum threshold the pressurizer is switched on, demanding 10 MW.The very conservative worst-case assumed in these analyses consists in assuming the pressurizersworking continuously.
As shown in Figure 6, in the HCPB option, the helium pumps are modulated to operate at reducedpower around the dwell time. This could be theoretically useful also for the PHTS-WCLL, but thelimited energy saving that could be achieved does not justify the cycling stress produced on the pumpsby the frequent power variations.
The WCLL IHTS is conceptually similar to that of the HCPB BB in terms of thermo-hydraulicarchitecture. First estimations regarding the electrical power absorbed by the electrical motors movingthe circulators present on the loops are based on the estimations of mass flow rate and pressure drop inthe pipes.
5.7. PBS 60: Remote Maintenance (RM) System
In new-generation tokamaks, Remote Maintenance (RM) is becoming more and more demandingand important with respect to existing facilities in terms of electrical power demand and nuclear safetyissues. In fact, in ITER and DEMO the Occupational Radiation Exposure is expected to be twice orthree times that of modern nuclear fission plants.
The DEMO RM is mainly divided into two groups:
• In-vessel RM includes all the activities regarding the movement of parts of the vessel or anyoperation inside it.
• Ex-vessel RM, instead, includes maintenance in and around the tokamak port cells and those inthe Maintenance Facility.
The concepts of the safe transportation of extracted parts of the VV are similar to those adopted inITER. In fact, once extracted from the vessel, both the divertor and the blanket sectors are moved bytransport casks through gallery corridors.
Besides, many crane-based systems and lifting systems need to be foreseen in designing thehandling of the extracted BB (through the upper port) and divertor (through the lower port) sectors,to move them to the Active Maintenance Facility. Some megawatts of electrical power are expected tobe absorbed by this system based on the first estimations on the weight of the parts to be moved.
The total DEMO maintenance and safety needs can be sustained by a RM of about 5 MW. Eventhough the RM electrical loads belong to the SSEN, parts of them are “decoupled by the plasmaoperation”, as for the remote handling inside the VV. This is a key point in the design of the electricaldistribution: the coincidence factor of many electrical loads is zero. However, it is worth mentioningthat some RM activities such as the processing/detritiation of some components could be carried outboth during and off operations in the Active Maintenance Facility (Building 21 in Figure 3).
5.8. PBS 70: Balance of Plant (HCPB)
Components belonging to PBS 70 are those of the PCS with HCPB-PHTS. This system consists of aclassical Hirn Cycle with superheated steam, with steam generator, re-heater, deaerator, condenser, feedwater and turbine (connected to the electrical generator for the thermal-electrical energy transformation).
First studies about absorbed electrical power by PCS in case of helium cooled blanket only regardthe water pump, based on the requested mass flow rate inside the circuit and the estimated pressuredrops. Further investigations will regard ancillary systems serving the PCS, not available at this stage.
It is worth noticing that the net efficiency of the thermal cycle is about 31%, when taking intoaccount the electrical power absorbed by PHTS (in particular, the very high power absorbed by the
34

Energies 2020, 13, 2269
circulators), IHTS and PCS components. The previous considerations lead to a power estimation of12 MW for PBS 70.
5.9. PBS 72: Balance of Plant (WCLL)
As for PBS 70, the components belonging to PBS 72 are those of the PCS in the cooling systemlayout based on the WCLL concept. The same considerations already reported for PBS 70 wereproposed, except for slight differences in terms of the steam generator coupling the PCS and the IHTSin case of indirect coupling. It results in a total power absorbed equal to 12 MW. It is worth noticingthat first simulations pointed that the system would be able to operate with about 700 MW of grosselectrical power and an efficiency equal about to 34%, considering all electrical power needed to berecirculated for PHTS, IHTS and PCS components needs.
5.10. PBS 81: Cryoplant and Cryodistribution
A preliminary design of cryoplant and cryodistribution is under development both in termsof layout of the plant and of estimation of the power and energy absorbed by the mechanicalcryopumps. Among the numerous systems to be kept at cryogenic temperatures, it is worth mentioning:the superconducting coils (at 4 K), the coil casings and supporting structures and the thermal shieldsof VV, cryostat, ports and cryodistribution. Besides, differently from ITER cryoplant, some systems areforeseen to be refrigerated by independent systems, such as cryopumps for the VV and the divertor,NBI cryopumps, pellet launching system and ECRH superconducting magnets. However, the projectis currently at a very preliminary stage. A first guess of the total electrical power absorbed by theDEMO cryoplant and cryodistribution (101.8 MW) has been obtained by scaling that designed for ITERproject taking into account the volumes of the superconducting magnets and of the other structuresand components to be kept at cryogenic temperatures.
5.11. PBS 83: Buildings
The electrical loads included in such estimation regard the lighting systems, the elevator systemsand the Heating, Ventilation and Air Conditioning (HVAC) system. Since the design of the DEMObuildings is at a very preliminary stage, a first guess of 54.8 MW is provided by extrapolating the dataavailable from ITER and considering the DEMO preliminary site layout shown in Figure 3.
5.12. PBS 85: Plant Control System
A first guess of 3.6 MW for the power absorbed by the COntrol, Data Access and Communication(CODAC), Central Interlock System (CIS) and Central Safety System (CSS) systems was obtained byestimating the number of cubicles for each subsystem, from those present in ITER.
5.13. PBS 87: Auxiliaries
First preliminary information about the power absorbed by auxiliaries is an extrapolation fromITER’s electrical demand for the Component Cooling Water System (CCWS), CHiller Water System(CHWS), sulfur hexafluoride (SF6) distribution system and compressed air distribution system.This extrapolation results in 90.9 MW.
5.14. Summary of the Total Electrical Power Absorbed by the DEMO SSEN
Since the BoP is still under design also in terms of choice between the two helium-based andwater-based cooling system, two parallel and independent designs are under evaluation also in termsof the power electrical system. Figure 7 summarizes the SSEN active and reactive rated powers in eachplasma phase for both the two cooling system options. It is important to note the power variations inthe HCPB option (Figure 7a) due to the ramp modulation of the compressors motor in the PHTS circuits.
35

Energies 2020, 13, 2269
(a)
(b)
404 404454
536 536
454404
224 224 240268 268
240 224
0
100
200
300
400
500
600
CS Pre-magnetization (≈500 s)
Plasma breakdown (≈1 s)
Plasma ramp-up (≈180 s)
Heating flat-top (≈10 s)
Burn flat-top (≈7200 s)
Plasma ramp-down (≈150 s)
Dwell time (≈200 s)
Active power (MW) Reactive power (MVAR)
423 423 423 423 423 423 423
227 227 227 227 227 227 227
0
50
100
150
200
250
300
350
400
450
500
CS Pre-magnetization (≈500 s)
Plasma breakdown (≈1 s)
Plasma ramp-up (≈180 s)
Heating flat-top (≈10 s)
Burn flat-top (≈7200 s)
Plasma ramp-down (≈150 s)
Dwell time (≈200 s)
Active power (MW) Reactive power (MVAR)
Figure 7. Nominal SSEN active and reactive powers in each plasma phase, considering the two differentPHTS-PCS options: (a) HCPB and (b) WCLL.
6. Preliminary Design and Sizing of the DEMO Electrical Distribution
In compliance with the preliminary scheme in Figure 4 and the lesson learnt from ITER electricaldesign, four voltage levels are firstly assumed to be used for the DEMO electrical distribution system:
• 22 kV, 6.6 kV and 0.4 kV, in SSEN.• 22 kV and 66 kV, in PPEN.
According to this assumption and to the aforementioned loads characterization, the HV/MV andMV/LV transformers and the cables for SSEN are sized, by using simulation models for the powerflow analysis [19]. The electrical scheme has been designed and implemented in the DIgSILENTPowerFactory software environment. The criteria used for the simulations are:
• Utilization and contemporaneity factors equal to 1 (no redundancy is considered for electricalloads which are supposed to work at their rated power).
• Load power factors assumed to be equal to those identified in the electrical load list.• Constraint on the nodal voltage variation during operation accepted: <4%.• Transformers size check in reference of the nominal values.• Cables size check in reference of the nominal values and to the layout assumptions.
36

Energies 2020, 13, 2269
The flow diagram in Figure 8 summarizes the algorithm adopted for the design of the electricaldistribution system and for the sizing of the electrical components.
Analysis of the DEMO loads and check of the
available data
First layout and voltage level choices.
Assumptions on missing data matching the literature reference
Run of power flow simulations
Are the limits
respected?
Design and sizing done
No
Yes
Definition of design and sizing criteria and limits
First sizing of the electrical components
Figure 8. Simplified flow diagram of the algorithm adopted for the preliminary design of theDEMO SSEN.
Simulations were carried out independently for both the two different cooling systemconfigurations (PHTS-HCPB and PHTS-WCLL) and referring only to SSEN loads in each plasmaoperational phase. As first output of the power flow analysis, the number and the size of the HV/MVtransformers are identified according to available data of installed transformed and reliability issuesboth during normal and off-normal conditions: six three-phases 2-windings transformers with ratingpower of 150 MVA and voltage ratio equal to 400/22 kV.
As regards the internal distribution for SSEN, the loads have been dispersed following designcriteria based on the voltage levels, loads type and distance between the distribution node and theactual location of the loads in the facility estimated on the site layout. The ordinary and the safetyloads are distinguished at the 0.4 kV voltage level and the following MV/LV transformers are selectedfollowing the same aforementioned criteria:
• Six three-phases 2-windings transformers with rated power of 2.5 MVA and voltage ratio equal to22/0.4 kV, for the ordinary loads.
• Four three-phases 2-windings transformers with rated power of 1.6 MVA and voltage ratio equalto 22/0.4 kV, for the safety loads.
• Six three-phases 2-windings transformers with rated power of 3.15 MVA and voltage ratio equal to22/0.4 kV for the supply of some special loads (as those in PBS 22), which are installed separatelybecause of the greater distance from the distribution node with respect to the other loads.
The choice to divide the MV/LV transformers in several groups connected by a bus-tie aimsat limiting the short-circuit currents, thus allowing the selection of commercial low voltage circuitbreakers. Regarding the loads connected at the 6.6 kV busbars, they are supplied through:
• Five three-phases 2-windings transformers with rated power of 40 MVA and voltage ratio equalto 22/6.6 kV in case of HCPB.
37

Energies 2020, 13, 2269
• Five three-phases 2-windings transformers with rated power of 20 MVA and voltage ratio equalto 22/6.6 kV in case of WCLL.
In the 6.6 kV section, the ordinary loads are supplied by 10 three-phases 2-windings transformerswith rated power of 40 MVA and voltage ratio equal to 22/6.6 kV. Finally, the cryogenic system issupplied by five three-phases 2-windings transformers with rated power of 40 MVA and voltage ratioequal to 22/6.6 kV. The main data of the selected transformers are reported in Tables 3 and 4, where:
• Sn is the rated power in MVA;• P0 is the no-load power in kW;• Pk is the short circuit power in kW;• Vk is the short circuit voltage in percentage.
Table 3. Electrical data of the MV/MV and MV/LV transformers.
Transformation Ratio 22/0.4 kV Transformation Ratio 22/6.6 kV
Sn [MVA] P0 [kW] Pk [kW] Vk [%] I0 [%] Sn [MVA] P0 [kW] Pk [kW] Vk [%] I0 [%]
1.6 2.2 13 6 0.9 20 7.7 110 7 0.32.5 3.1 19 6 0.6 40 15.1 220 7 0.3
3.15 3.8 22 6 0.5 Winding not present
Table 4. Electrical data of the HV/MV transformers.
Transformation Ratio 400/22 kV
Sn [MVA] P0 [kW] Pk [kW] Vk [%] I0 [%]150 17.1 77.5 13 2
Results obtained by the methodology based on the power flow analysis and the aforementionedsizing criteria allowed also to carry out the cables sizing. It is important to stress that this sizingwas possible only by adopting a preliminary but consistent layout as shown in Figure 3. The typeof the selected cables and their electrical data are summarized in Table 5, reporting the value of theresistance R’ (for the reference and maximum operating temperatures) and reactance X’ per unit length.The assumed cable materials and technical characteristics are summarized in Table 6.
Table 5. Electrical data of the SSEN cables.
Rated Voltage [kV] Section [mm2] Rated Current [A] R’ (20 ◦C) [mΩ/km] Max R’ (90 ◦C) [mΩ/km] X’ [mΩ/km]
0.4 1 × 240 550 20.1 104 810.4 1 × 300 620 64.1 85 796.6 1 × 500 760 36.6 51 936.6 1 × 630 850 28.3 42 906.6 1 × 800 930 22.1 35 8622 1 × 150 453 124.0 159 12822 1 × 240 612 75.4 97.8 12822 3 × 400 813 47.0 62.7 128
Table 6. Materials and technical characteristics assumed for the SSEN cables.
Rated Voltage [kV] Section [mm2] Cores Conductor Insulation
0.4 240300 Single Stranded flexible
annealed bare copper
High-module HEPR rubber, with filler/sheathnon-hydroscopic material and special PVC
outer sheath
6.6500630800
Single Copper Unarmored XLPE, with semi-conductivescreens on conductor and insulation
22150240 Single Stranded circular
compacted copperXLPE insulation, with conductor screen and
insulation screen400 Triple
38

Energies 2020, 13, 2269
From the power flow analysis carried out including the SSEN loads and distribution, the totalelectrical active and reactive powers requested to the HV point of connection of DEMO to the externalelectrical grid can be assessed in reference to the different plasma phases. The results are shown inFigure 9 for the HCBP and WCLL cases. This information is the starting point for the sizing and designof the HV switchyard that is object of study and research of the same authors.
433
434 48
4
568
568
484
434
314
317 34
3 394
394
343
317
467
467
467
467
467
467
467
328
331
331
331
331
331
331
0
100
200
300
400
500
600
CS Pre-magnetization (≈500 s)
Plasma breakdown (≈1 s)
Plasma ramp-up (≈180 s)
Heating flat-top (≈10 s)
Burn flat-top (≈7200 s)
Plasma ramp-down (≈150 s)
Dwell time (≈200 s)
HCPB active power (MW) HCPB reactive power (MVAR)
WCLL active power (MW) WCLL reactive power (MVAR)
Figure 9. Total steady state electrical powers requested from the grid at the DEMO HV connectionpoint in the two PHTS-PCS cases (HCPB and WCLL).
7. Conclusions
This paper presented the preliminary studies for the feasibility and realization of the demonstrativenuclear fusion power plant DEMO. The study moved from the analysis of the expected DEMOoperations and of the electrical loads to sketch a preliminary electric scheme for a part of the internaldistribution grid, including the sizing of the main electrical components. This preliminary designwas supported by simulation models for the power flow analysis implemented in the DIgSILENTPowerFactory environment.
The first results are focused on the electrical loads analysis and characterization showing asignificant variability with respect to the plant configuration, especially because of to the coolingchoices and the operational phases. This aspect affects the preliminary design of the electric distributiongrid for the SSEN in DEMO. The results show a huge amount of power that would be shared with theHV European grid, pointing out the complexity of the sizing and design of the HV switchyard.
The results shall be continuously refined in the next years following the development of theproject and the new experiences in the plasma physics and engineering achieved by ITER or satelliteexperiments. For instance, the design optimization of the toroidal and blanket segmentation led to anumber of sectors being reduced from 18 to 16. The following design choices could lead to a pipingredistribution with a limited impact on the total pumping power but there is still room for generaldesign optimizations. Moreover, a relevant breakthrough could consist in the possibility to achievelonger burn phases.
Nevertheless, the electrical design must be continuously updated because its impact is so relevantthat could jeopardy the efficiency and the convenience of the plant. In fact, some physics andengineering choices as the cooling configuration and the coil current scenarios could be driven also byelectrical constraints or optimizations.
In particular, the following aspects are object of study and research in progress by the same authors:
• Impact of the PPEN power profiles, at least in the reference scenarios.• Operations and connection of the TG in the direct and indirect coupling.• Sizing and design of the HV switchyard.
39

Energies 2020, 13, 2269
• Technical and legal rules for the connection of DEMO to the HV grid.• Detailed survey of the critical loads in order to improve the plant safety and reliability and to size
the UPSs and the diesel generators with the proper redundancy.• Location and sizing of the reactive power compensation and filtering systems.
Author Contributions: S.M. collected the data from DEMO PBS experts and from other tokamaks. S.M. and S.P.modeled the distribution network and performed the power flow simulations. S.C. followed the conceptualizationof the BoP, of the layout and of the safety classifications. S.P. conceptualized and developed the electrical network.A.L. arranged the electrical load list and the operational phase classification. The methodology was agreed byall the authors. S.M., S.C., M.C.F. and A.L. organized and supervised the project for the involved institutions.The manuscript was edited by all the authors. All authors have read and agreed to the published version ofthe manuscript.
Funding: This work has been carried out within the framework of the EUROfusion Consortium and has receivedfunding from the Euratom research and training programme 2014-2018 and 2019-2020 under grant agreement No633053. The views and opinions expressed herein do not necessarily reflect those of the European Commission.
Conflicts of Interest: The authors declare no conflict of interest.
Abbreviations and Acronyms
BB (Tokamak) Breeding BlanketBoP Balance of PlantCCWS Component Cooling Water SystemCD(R) Conceptual Design (Review)CHWS Chiller Water SystemCIS Central Interlock SystemCS Central SolenoidCODAC COntrol, Data Access and CommunicationCSS Central Safety SystemDMS Disruption Mitigation SystemECRH Electron Cyclotron Resonance HeatingELM Edge Localized ModeESS Energy Storage SystemEU European UnionHCPB Helium Cooled Pebble BedH&CD Heating and Current DriveHV High VoltageHVAC Heating, Ventilation and Air ConditioningIB Inboard BlanketICRH Ion Cyclotron Resonance HeatingIHTS Intermediate Heat Transfer SystemLV Low VoltageNBI Neutral Beam InjectorOB Outboard BlanketPBS Plant Breakdown StructurePCS Power Conversion SystemPHTS Primary Heating Transfer SystemPPEN Pulsed Power Electrical Network (classification used in ITER)RM Remote MaintenanceSC Super-ConductorSSEN Steady State Electrical Network (classification used in ITER)TBM Test Blanket ModuleTG Turbine GeneratorVV Vacuum VesselWCLL Water Cooled Lithium Lead
40

Energies 2020, 13, 2269
References
1. Bachmann, C.; Ciattaglia, S.; Cismondi, F.; Federici, G.; Keech, G.; Maviglia, F.; Siccinio, M. Critical designissues in DEMO and solution strategies. Fusion Eng. Des. 2019, 146, 178–181. [CrossRef]
2. Federici, G.; Bachmann, C.; Barucca, L.; Biel, W.; Boccaccini, L.; Brown, R.; Bustreo, C.; Ciattaglia, S.;Cismondi, F.; Coleman, M.; et al. DEMO design activity in Europe: Progress and updates. Fusion Eng. Des.2018, 136, 729–741. [CrossRef]
3. Federici, G.; Bachmann, C.; Barucca, L.; Baylard, C.; Biel, W.; Boccaccini, L.V.; Bustreo, C.; Ciattaglia, S.;Cismondi, F.; Corato, V.; et al. Overview of the DEMO staged design approach in Europe. Nucl. Fusion 2019,59, 066013. [CrossRef]
4. EUROfusion. European Research Roadmap to the Realisation of Fusion Energy. 2018. Available online:https://www.euro-fusion.org/eurofusion/roadmap/ (accessed on 15 March 2020).
5. Lampasi, A.; Maffia, G.; Alladio, F.; Boncagni, L.; Causa, F.; Giovannozzi, E.; Grosso, L.A.; Mancuso, A.;Micozzi, P.; Piergotti, V.; et al. Progress of the Plasma Centerpost for the PROTO-SPHERA Spherical Tokamak.Energies 2016, 9, 508. [CrossRef]
6. ITER Website. Available online: http://www.iter.org/ (accessed on 16 March 2020).7. Ciattaglia, S.; Federici, G.; Barucca, L.; Stieglitz, R.; Taylor, N. EU DEMO safety and balance of plant design
and operating requirements. Issues and possible solutions. Fusion Eng. Des. 2019, 146, 2184–2188. [CrossRef]8. Ciattaglia, S.; Federici, G.; Barucca, L.; Lampasi, A.; Minucci, S.; Moscato, I. The European DEMO Fusion
Reactor: Design Status and Challenges from Balance of Plant Point of View. In Proceedings of the17 IEEE International Conference on Environment and Electrical Engineering (EEEIC 2017), Milan, Italy,6–9 June 2017.
9. Novello, L.; Coletti, A.; Baulaigue, O.; Dumas, N.; Ferro, A.; Gaio, E.; Maistrello, A.; Lampasi, A.; Zito, P.;Matsukawa, P.; et al. Advancement on the Procurement of Power Supply Systems for JT-60SA. In Proceedingsof the IEEE 25th Symposium on Fusion Engineering (SOFE), Austin, TX, USA, 31 May–4 June 2015.
10. Lampasi, A.; Zito, P.; Starace, F.; Costa, P.; Maffia, G.; Minucci, S.; Gaio, E.; Toigo, V.; Zanotto, L.; Ciattaglia, S.The DTT device: Power supplies and electrical distribution system. Fusion Eng. Des. 2017, 122, 356–364.[CrossRef]
11. Morris, J.; Kovari, M. Time-dependent power requirements for pulsed fusion reactors in systems codes.Fusion Eng. Des. 2017, 124, 1203–1206. [CrossRef]
12. Lampasi, A.; Minucci, S. Survey of Electric Power Supplies Used in Nuclear Fusion Experiments.In Proceedings of the 17 IEEE International Conference on Environment and Electrical Engineering(EEEIC 2017), Milan, Italy, 6–9 June 2017.
13. Barucca, L.; Ciattaglia, S.; Chantant, M.; Del Nevo, A.; Hering, W.; Martelli, E.; Moscato, I. Status of EUDEMO heat transport and power conversion systems. Fusion Eng. Des. 2018, 136, 1557–1566. [CrossRef]
14. Moscato, I.; Barucca, L.; Ciattaglia, S.; Di Maio, P.; Federici, G. Preliminary design of EU DEMO helium-cooledbreeding blanket primary heat transfer system. Fusion Eng. Des. 2018, 136, 1567–1571. [CrossRef]
15. Ferro, A.; Lunardon, F.; Ciattaglia, S.; Gaio, E. The reactive power demand in DEMO: Estimations andstudy of mitigation via a novel design approach for base converters. Fusion Eng. Des. 2019, 146, 2687–2691.[CrossRef]
16. Gliss, C.; Ciattaglia, S.; Korn, W.; Moscato, I. Initial layout of DEMO buildings and configuration of the mainplant systems. Fusion Eng. Des. 2018, 136, 534–539. [CrossRef]
17. Falvo, M.C. Studies on the generator operation assuming power profiles corresponding to the PHTS-PCSindirect and direct cycle, v1.0, 20 December 2019, EUROfusion Report IDM: EFDA_D_2NUUME. Availableonline: https://idm.euro-fusion.org/ (accessed on 15 March 2020).
18. Del Nevo, A. Direct Coupling of WCLL BB PHTS to PCS feasibility study, v1.0, 14 February 2019, EUROfusionReport IDM: EFDA_D_2MN55V. Available online: https://idm.euro-fusion.org/ (accessed on 15 March 2020).
19. Duncan Glover, J.; Sarma, M.S.; Overbye, T.J. Power System Analysis and Design, 5th ed.; Cl-Engineering:Pacific Cove, CA, USA, 2011.
© 2020 by the authors. Licensee MDPI, Basel, Switzerland. This article is an open accessarticle distributed under the terms and conditions of the Creative Commons Attribution(CC BY) license (http://creativecommons.org/licenses/by/4.0/).
41


energies
Article
Techno-Economic Evaluation of InterconnectedNuclear-Renewable Micro Hybrid Energy Systemswith Combined Heat and Power
Hossam A. Gabbar 1,2,*, Muhammad R. Abdussami 1 and Md. Ibrahim Adham 1
1 Faculty of Energy Systems and Nuclear Science, Ontario Tech University (UOIT),Oshawa, ON L1G 0C5, Canada; [email protected] (M.R.A.);[email protected] (M.I.A.)
2 Faculty of Engineering and Applied Science, Ontario Tech University (UOIT), Oshawa, ON L1G 0C5, Canada* Correspondence: [email protected]
Received: 7 March 2020; Accepted: 31 March 2020; Published: 2 April 2020
Abstract: Renewable energy sources (RESs) play an indispensable role in sustainable advancement byreducing greenhouse gas (GHG) emissions. Nevertheless, due to the shortcomings of RESs, an energymix with RESs is required to support the baseload and to avoid the effects of RES variability. Fossilfuel-based thermal generators (FFTGs), like diesel generators, have been used with RESs to supportthe baseload. However, using FFTGs with RESs is not a good option to reduce GHG emissions. Hence,the small-scale nuclear power plant (NPPs), such as the micro-modular reactor (MMR), have becomea modern alternative to FFTGs. In this paper, the authors have investigated five different hybridenergy systems (HES) with combined heat and power (CHP), named ‘conventional small-scale fossilfuel-based thermal energy system,’ ‘small-scale stand-alone RESs-based energy system,’ ‘conventionalsmall-scale fossil fuel-based thermal and RESs-based HES,’ ‘small-scale stand-alone nuclear energysystem,’ and ‘nuclear-renewable micro hybrid energy system (N-R MHES),’ respectively, in terms ofnet present cost (NPC), cost of energy (COE), and GHG emissions. A sensitivity analysis was alsoconducted to identify the impact of the different variables on the systems. The results reveal that theN-R MHES could be the most suitable scheme for decarbonization and sustainable energy solutions.
Keywords: nuclear power plant; renewable energy; hybrid energy system; combined heat and power
1. Introduction
According to the 2030 Agenda for Sustainable Development, seventeen Sustainable DevelopmentGoals (SDGs) are set for action by both developed and developing countries. Among the seventeenSDGs, one of the most crucial goals is “Affordable and Clean Energy.” The objective of the goal“Affordable and Clean Energy” is to ensure not only affordable, resilient, and modern forms of energy,but also sustainable and carbon-free electricity for the planet [1].
Electricity is a fundamental requirement for global advancement and economic growth.The demand for electricity is growing proportionally to the population and economic development.Currently, the world is undergoing two challenges for managing the high demand for electricity;one problem is how to support the high demand for electricity without exploiting finite energyresources (mainly fossil fuels), and another challenge is how to produce electricity without affectingthe environment [2].
Currently, most of the electric energy is produced from conventional sources like coal, gas, and oil.The production of electricity by using these resources tends to raise the emission of greenhouse gases(GHGs) in the atmosphere. Research is ongoing to reduce the impact of using traditional sources forelectricity generation in the environment. For instance, one such initiative is the implementation of
Energies 2020, 13, 1642; doi:10.3390/en13071642 www.mdpi.com/journal/energies43

Energies 2020, 13, 1642
carbon capture and storage (CCS) policies. In this process, the waste carbon dioxide from the powerplant can be captured and transported to a storage site for disposal so that it cannot disperse in theenvironment [3].
In recent times, the world is looking for sustainable energy sources that will be used to meettoday’s demand without putting them into danger for future usages. Consequently, renewable energysources (RESs), such as solar, wind, geothermal, hydropower, and ocean energy, are being recognizedas sustainable sources for electric energy production [4]. RESs are intermittent, and electricity cannotbe stored economically for an extended period, so some other sources of energy that can provide aback-up for the RESs during their unavailability period and act as a base load or critical load supplierare needed.
The research and development plan for dynamic modeling and simulation of large scalenuclear-renewable hybrid energy system (N-R HES) is addressed in [5]. The N-R HES is interpreted asa combination of a nuclear reactor, a turbine for electricity generation from thermal energy, at least aRES, and a product produced from the N-R HES by an industrial process. In the report, the authorscategorized the N-R HES into three types: tightly coupled HES, thermally coupled HES, and looselycoupled electricity-only HES. The potential vital benefits of N-R HES include GHG-free electricity, aresilient electric grid, and low COE. The authors have also regarded the integration of SMR and RESfor future work.
A combination of renewable energy generation, nuclear reactors, and industrial processes,including the versatility of grid and making the best possible use of investment, have been exploredin [6]. Six features of interconnection have been identified here—electrical, thermal, chemical, hydrogen,mechanical, and information. This study concluded that the integration of nuclear and renewableenergy could be a potential solution for a long-term and ample amount of power and heat supplythat is free from sudden price changes like fossil-fuels. This document also pointed out that thenuclear-renewable hybrid system can supply load-following power, and excess energy can be usedfor the production of secondary energy-intensive products. Nevertheless, system analysis, technicaladvancement, and optimization are required to implement this hybrid system in practice.
Currently, the International Atomic Energy Agency (IAEA) has published a technical documentof nuclear-renewable integration. The report addresses the national strategies on nuclear and RESs,opportunities and challenges of nuclear-renewable integration, and the role of the small-scale reactorsin nuclear-renewable hybridization [7].
A comparison of three scenarios, namely a nuclear power plant, a combination of a nuclear plantand a wind facility, and a mixture of nuclear and wind energy sources with a hydrogen generationfacility, have been done in [8]. This study reported that with optimization, the nuclear-wind systemwith a hydrogen production facility could be an economically viable option in the future. Sensitivityanalysis has also been carried out to realize the impact of the energy market, depreciation rate, discountrate, and time horizon in terms of internal rate of return (IRR), levelized cost of energy (LCOE), netpresent value (NPV), and payback period.
In [9], the author highlighted the critical challenges of nuclear-renewable integration, such asintegration values, regulatory, financial, technological, plant testing, and plant operation. The authorsuggested that the information linkage-based nuclear-renewable coupling would be able to overcomethe complexities of the integration process.
Three scenarios of N-R HES to supply thermal energy from the system have been examinedin [10]. The first arrangement includes a nuclear reactor, thermal power cycle, wind power plant, andelectric boiler; the second scenario comprises a nuclear reactor, thermal power cycle, wind power plant,and electric thermal storage; the third configuration is a combination of a nuclear reactor, thermalpower cycle, wind power plant, electric boiler, and thermal storage. The electric thermal storage storesthermal energy that is generated by electricity. The financial performance analysis tells us that the thirdarrangement has the lowest NPV, lowest IRR, and highest TCI. The analysis results are evident becausethe thermal power supply is elevated significantly by introducing the electric boiler and the thermal
44

Energies 2020, 13, 1642
storage simultaneously in the third scenario. The result is also evident since the authors assumed thatthe cost of heat generated from the nuclear reactor is less than the price of heat generated from gas(electric boiler) [10].
The Hybrid Optimization Model for Electric Renewable (HOMER) software has been used forpredicting the viability of a HES in [11]. The HES consists of photovoltaic (PV) cells, diesel generator,and battery bank. Paper [11] summarized that the PV-diesel-battery system has one-third fuel-savingscompared to the diesel-only system. It is also concluded that hydrogen technologies can technicallyreplace the diesel-battery system. The PV-diesel-battery configuration will also reduce emissions andincrease the penetration of renewable energy. Besides, the authors found that the implementationof 20% renewable energy would reduce a massive amount of CO2 compared to the present value ofemission [11].
However, small scale nuclear reactors like the micro modular reactor (MMR) are gaining attentioncurrently for their small size, affordability, security, reliability, and innovativeness. Several companiesare now working on these types of reactors. For example, U-Battery, an MMR manufacturer, isexpecting to demonstrate this type of reactor by 2026 [12]. Some other very small reactors are beingdeveloped, such as the eVinciTM micro reactor with combined heat and power (CHP) rated from200 kWe to 5 MWe [13]. Consequently, these types of micro reactors can replace the FFTGs (dieselgenerators), which are now being employed with RESs either as the backup power supply or as themain electric power- generating source.
In this paper, the planning and optimization of different HES models have been developed andevaluated based on multiple techno-economic key performance indicators (KPIs). The grid-connectedas well as off-grid mode have been analyzed in this paper. Five different scenarios with CHP havebeen developed and assessed using the HOMER software. Comparison among all situations has beenmade based on three KPIs - NPC, COE, and GHG emission. This document is divided as follows: thedetailed nuclear-renewable hybrid energy system is discussed in Section 2. System configurations areaddressed in Section 3. Section 4 covers the design considerations that are made for system evaluation.Part 5 illustrates the system simulations. The simulation results, based on selected KPIs, are compiledin Section 6. The discussion is presented in Section 7.
2. Nuclear-Renewable Micro Energy System
N-R HES is a collective network of different RESs, nuclear reactors, energy storage systems(ESSs), power electronic devices, and various energy users (e.g., electric, thermal, and hydrogen).Since no fossil fuel is combusted in the N-R HES, it is the cleanest HES with virtually zero GHGemissions. The N-R HES utilizes a substantial amount of waste heat energy from the thermal generator(e.g., nuclear reactor, geothermal energy, concentrated solar power, and biomass) to generate differentproducts. Several advanced control algorithms are used in N-R HES to ensure the security and reliableperformance of the system. Based on the size of the hybrid system, the coupling scheme can becategorized into two types [14], as discussed below.
2.1. Large-scale Coupling
In large-scale coupling, a traditional large-scale nuclear power plant (NPP) is collocated withregionally available RESs. The coupling may occur at either the electrical, thermal, or electrical-thermallevels. For example, the International Atomic Energy Agency (IAEA) recommends that a conventionallarge-scale NPP must have a bare area—called “exclusion zone”—around the NPP for safety purposes.A part of this exclusion zone can be used to install wind turbines to extract wind energy and integrateit with the NPP generation or electric grid [15]. Since the exclusion zone is typically a large empty area,it might be a favorable space of achieving high wind speeds, implying a high wind energy potential.Moreover, e PV panels can be fitted on the different facilities of the NPP to harness solar power.
The large-scale coupling also includes the mobile microgrid (MM) with traditional NPP for variouspurposes. An MM is a HES consisting of different RESs, such as wind and PV, with intelligent remote
45

Energies 2020, 13, 1642
control capability for resilient off-grid power supply [16]. An MM can also be linked with large-scaleNPP for emergency cases to support the essential electric system, Class I power supply, of the NPP.Class I, associated with a battery bank, is the most sensitive power class in NPP, and it can never beinterrupted. Hence, a battery fast charging mechanism, powered by MM, can solve the drawbacks ofthe battery bank and ensure the safety of NPP. In summary, the integration of MM with traditionalNPP works for both objectives – load demand fulfillment and NPP emergency back-up support [17].
2.2. Modular-scale Coupling
In modular-scale coupling, a small-scale reactor, called small modular reactor (SMR) or micromodular reactor (MMR), is conjoined with RESs at a site where the RESs are mostly available. Thereare notable advantages of MMR, explained in the later section, over the SMR. The MMR is moveableand modular in size; the MMR is towed into a suitable location to combine with RESs in modular-scalecoupling schemes. The HES that uses a modular-scale coupling method is called nuclear-renewablemicro hybrid energy system (N-R MHES). The N-R MHES has immense applications in remotecommunity service, transportation electrification, distant oil and gas mining facilities, and remotechemical industries. The grid-connected N-R MHES also provides an excellent energy solution to themedium-level electricity demand with the lowest NPC and COE [14].
3. System Configuration
A case study has been conducted to assess some specific KPIs—net present cost (NPC), costof energy (COE), and greenhouse gas (GHG) emissions—of an N-R MHES. The grid-level couplingmethod is reflected in the study. The case study includes the system equipment with some conservativeassumptions that are listed with each component in the subsections. The load data are obtained fromthe National Aeronautics and Space Administration (NASA) Surface Meteorology and Solar Energydatabase [18]. The data are synthesized in a MATLAB simulator, and the Hybrid Optimization ofMultiple Energy Resources (HOMER) Pro software is used for system modeling, simulations, and KPIanalysis. In the study, the project lifetime is assumed as a whole 30 years – starting in 2007 and endingin 2036. The prices of the system component are pragmatic compared to the present market value. TheRESs data, such as solar radiation, wind speed, and water flow of the hydro dam, are assumed to bethe same during the complete project lifetime. However, some important system parameters, such asload demand and equipment cost, change in each year of project life. To address the effect of thesevariations on the whole system, an additional study is conducted by “Multiyear Analysis” module inthe HOMER Pro software. The details of individual system equipment are demonstrated in the nextfew subsections. The project life, inflation rate, and discount rate are considered as 30 years, 2%, and8%, respectively. The costs of all system equipment, mentioned in the specification table in this study,are the first-year cost of the whole project life.
The HOMER software uses the inflation rate and discount rate to calculate the actual discount rate.The actual discount rate is used to determine the discount factors and annualized costs. The inflationrate, discount rate, and actual discount rate are mathematically related as follows [19]:
r =d− i1 + i
(1)
where r, d, and i represent actual discount rate, discount rate, and inflation rate, respectively.
3.1. Electric Load
The electric load data has been collected for the year of 2018 from several facilities of Ontario TechUniversity (UOIT, Oshawa, ON, Canada). These data are deemed as input electric load data for thefirst year of the project life. The data are collected from UOIT since it has a significant variation inthe load profile of the UOIT facilities. As a micro HES is considered for this analysis, the actual loadprofile is scaled-down to a comparable size to emulate the load profile of a small-scale energy system.
46

Energies 2020, 13, 1642
The scaled-down data also reduces the simulation time. Nevertheless, the scaled-down process doesnot change the load characteristics.
The load profile that is collected from UOIT is designed and named “Electric Load #1” in theHOMER Pro software interface. Another electric load is modeled in HOMER Pro, entitled “ElectricLoad #2,” to create “diversity” in the system load profile. The peak occurs for “Electric Load #1”at noon, whereas the peak occurs for “Electric Load #2” at evening. Thus, the diversity is created.A deferrable electrical load is also designed in the HOMER Pro software. The value of average energydemand, storage capacity, peak power demand, and minimum load ration of the deferrable load are12 kWh/day, 48 kWh, 8 kW, and 80%, respectively. The “Electric Load #1” and “Electric Load #2” aregiven the highest priority for demand fulfillment in the system and considered as the primary loadin simulation; whereas, the deferrable electric load gets less priority. In the simulation, the resourcesalways supply electricity to the primary load first, then go for the deferrable load. Figure 1 illustratesthe total electric load profile - summation of Electric Load #1, Electric Load #2, and deferrable load - ofthe system. Table 1 represents the details of system electric load.
Figure 1. Total electrical load profile (first year of project lifetime).
Table 1. Specifications of the primary electric load.
ParameterValue
Electric Load #1 Electric Load #2
Average Energy Demand (kWh/day) 12,000 500Average Power Demand (kW) 500 20.83
Peak Power Demand (kW) 857.17 61.83Load Factor (%) 58 34
The yearly total electrical load profiles are depicted in Figure 1. The characteristics of the electricalloads are summarized in Table 1.
3.2. Thermal Load
Since the actual thermal load data is not available for the project, a standard thermal load profile ismodeled in this study from HOMER Pro software library. Two types (commercial load and communityload) of thermal loads are designed to introduce variety into the N-R MHES. The thermal loads arecompatible and comparable to the typical hybrid energy system.
The yearly total thermal load profiles are depicted in Figure 2. The peak demand occurs at noonand evening for Thermal Load #1 and Thermal Load #2, respectively. The characteristics of thermalloads are summarized in Table 2.
47

Energies 2020, 13, 1642
Figure 2. Total thermal load profile (first year of project lifetime).
Table 2. Specifications of the thermal load.
ParameterValue
Thermal Load #1 Thermal Load #2
Average Thermal Energy Demand (kWh/day) 3500 200Average Thermal Power Demand (kW) 143.83 8.33
Peak Thermal Power Demand (kW) 502.55 24.73Load Factor (%) 29 34
3.3. Diesel Generator
Though the FFTG is not a compulsory part of N-R MHES, a Diesel genset is studied here toinvestigate and compare the KPIs between conventional fossil fuel-based thermal hybrid energysystems and N-R MHES. The traditional hybrid energy system combines FFTGs, RESs, energy storage,and power electronic components. In this project, a 1 MW diesel generator is compared with a 1 MWMMR, side by side, to obtain the most feasible system in terms of economic and environmentalviewpoints. The heat recovery ratio and diesel price are assumed 40% and 0.79 UDS/Liter [20],respectively in this study. The economic parameters of a typical diesel generator, used in the simulation,is listed in Table 3. The HOMER Pro software automatically calculates the total emission by dieselgenerator while the Diesel genest produces electricity.
3.4. Solar Power
Solar photovoltaic (PV) technology is used in this project to convert solar radiation into usefulelectricity. The solar radiation data of UOIT have been collected from NASA Surface Meteorology andSolar Energy database. The solar radiation data are assumed to be the same throughout the 30 years ofthe project lifetime.
The output of the PV array is calculated as follows [21]:
PPV= YPVfPV
(GT
GT,STC
)[1 + αp(Tc−Tc,STC)
](2)
where YPV, fPV, GT, GT,STC, αp, Tc, and Tc,STC denote the rated capacity of the PV array under standardtest conditions (kW), PV derating factor (%), solar radiation incident on PV in the current timestep (kW/m2), solar incident radiation at standard test condition (1 kW/m2), temperature coefficient(%/◦C), PV cell temperature in the current time step (◦C), and PV cell temperature under standard testconditions (25 ◦C), respectively.
The manufacturers set the PV power rating at a specific condition called “Standard Test Conditions(STC).” In STC, the solar radiation is assumed to be 1 kW/m2, the cell temperature is taken as 25 ◦C,and no wind flow is considered around the PV cell. However, in practical cases, the full-sun cell
48

Energies 2020, 13, 1642
temperature is always greater than 25 ◦C, and there is a significant wind flow encompassing the PVsystem. The derating factor is also regarded to model the PV cell explicitly since it is related to thepanel losses, wiring losses, and aging. The derating factor is a scaling factor to match the PV rating ofthe manufacturers with the real-world conditions.
If the temperature effect is ignored to design the PV panel, Equation (3) can be simplified as follows:
PPV = YPVfPV
(GT
GT,STC
)(3)
The yearly solar irradiance data are represented in Figure 3. A flat panel 400 kW PV array, havingan operating temperature 25 ◦C, is used here. The PV array consists of 400 solar cell units; each unit israted at 1 kW. The details specifications of the solar PV cell are summarized in Table 3.
Figure 3. Solar irradiance.
3.5. Wind Power
Two (2) wind turbine units, each rated as 330 kW, are used in this N-R MHES. The hub height androtor diameter of the turbine are 55 m and 33 m, respectively. It has been assumed that the wind speedis the same for the entire project life. The details of the wind turbine are presented in Table 3.
Three steps are maintained to calculate the output of the wind turbine in HOMER [22]. The firststep is to estimate wind speed at the hub height of the wind turbine. The wind speed at the hub heightis calculated by Equation (4):
VHUB = VA
ln(HHUB
H0
)ln(HA
H0
) (4)
where VHUB, VA, HHUB, H0, and HA denote wind speed at the hub height of the wind turbine (m/s),Wind speed at the anemometer height (m/s), Hub height of the wind turbine (m), Surface roughnesslength (m), and Anemometer height (m), respectively.
The second step is to calculate the turbine power at standard air density; this is done with thehelp of the turbine power curve given by the manufacturer. The wind power output at standard airdensity is estimated from the corresponding wind speed value, calculated in the previous step.
The third step deals with the application of density correction. The following equation is used fordensity correction to calculate the exact wind power extracted by the wind turbine:
PACTUAL =
(ρ
ρ0
)PSTP (5)
where PACTUAL, ρ, ρ0, and PSTP represent actual power output of the wind turbine (kW), actual airdensity (kg/m3), air density at standard temperature and pressure (kg/m3), and power output of thewind turbine at standard temperature and pressure (kW), respectively. Figure 4 represents the windspeed profile at UOIT for one year.
49

Energies 2020, 13, 1642
Figure 4. Wind speed.
3.6. Hydro Power
A run-of-river hydroelectric plant is considered in this study. The average yearly (2018) mass flowrates of Lake Ontario, Canada are collected and shown in Figure 5. The economic specifications of thehydro plant and hydro turbine are summarized in Table 3.
The nominal power of a hydropower plant can be calculated from the following equation [23]:
PHYDRO = HA × ρWATER × g×QTURBINE × ηTURBINE (6)
where HA, ρWATER, g, QTURBINE, and ηTURBINE denote available water head (m), water density ( kgm3 ),
gravitational constant ( ms2 ), mass flow rate ( m3
s ), and hydro turbine efficiency (%), respectively.The mass flow rate or hydro turbine flow rate is the amount of water that flows through the hydro
turbine. In this study, the mass flow rate is calculated using Equation (7) [23]:
QTURBINE =
⎧⎪⎪⎪⎨⎪⎪⎪⎩0, QAVAILABLE < QMINIMUM
QAVAILABLE, QMINIMUM ≤ QAVAILABLE ≤ QMAXIMUMQMAX, QAVAILABLE > QMAXIMUM
(7)
where QAVAILABLE, QMINIMUM, and QMAXIMUM represent available mass flow rate to hydro turbine( m3
s ), available minimum mass flow rate to hydro turbine ( m3
s ), and available maximum mass flow rate
to hydro turbine ( m3
s ), respectively.The available water head, design flow rate, minimum flow rate, and maximum flow rate of the
hydroelectric plant are considered as 25 m, 500 L/s, 50%, and 150%, respectively, in this case study.
Figure 5. Mass flow rate.
50

Energies 2020, 13, 1642
Table 3. Specifications of some system equipment.
ParametersSystem Equipment
Solar PV Wind Turbine Hydro Generator Diesel Genset
Nominal Capacity (kW) 1 330 98.1 1000
Capital Cost (USD) 640 40,000 459,845 300,000
Replacement Cost (USD) 640 30,000 229,923 200,000
Lifetime (Years) 30 20 25 2.5
Operation and Maintenance Cost(USD/year) 0 100 13,795 87,600
3.7. Nuclear Power Plant
Due to the high initial cost and necessity of a large installation site of the conventional NPP, amicro modular reactor (MMR) is a promising solution for reducing the capital cost and eliminatingthe need for a massive installation area. MMRs have some benefits over conventional NPPs; MMRtakes a shorter time to construct, design of MMR is simple and flexible, and MMR is appropriate forsmall-scale electricity generation systems [24].
According to the IAEA, the NPP rated under 300 MWe can be interpreted as ’small’ NPP. IAEAdefines the NPP as ’medium’ if the reactors have the power rating up to 700 MWe. The ’small’ and’medium’ NPP collectively have been called ’small and medium reactor (SMR),’ but commonly, theyare termed as ’small modular reactor (SMR).’ One subclass of SMR is ’very small reactors (vSMRs)’that are rated under 15 MWe, and are very competent for remote communities [25].
The MMR, a generation-IV reactor, is a small-scale reactor, characterized by a power rating inbetween 1 MWe to 20 MWe. The MMR provides a safe, emission-free, and cost-efficient energy sourcefor both on-grid and off-grid applications. Due to its modular nature, small footprint, in-factoryconstruction, cogeneration capability, high-level safety measures, insignificant installation area, designsimplicity, scalability, and transportability, the MMR has a high impact on energy system modelingconsideration. The MMR could be an outstanding solution for large-scale generating station back-uppower, remote industries, and transportation electrification [26]. A feasibility assessment of theMMR for military ground application has been conducted in [27]. Based on inherent risk, strategicalcomplication, and cost associated with using diesel generators in a forward operating base (FOB), theauthors found that the MMR is better than diesel generator for longer-term operation.
The TRISO fuel, a proven technology, is used in the MMR. TRISO is a uranium fuel coated withthree layers; the uranium center is covered with a carbon layer, followed by silicon carbide, followedby an outer carbon layer. This extraordinary design ensures the utmost safety of the fuel under extremeconditions. The TRISO fuel can sustain up to 1800 ◦C, which is 200 ◦C hotter than the accident condition.The MMR is a gas-cooled reactor where helium is circulated in a primary circuit, and nitrogen is usedin the secondary circuit. Since helium is an inert gas, clean, free of fission product, and does not reactchemically with reactor or fuel, helium provides numerous benefits to the MMR. The fuel enrichmentis around 9–12% for MMR. The molten salt is used in MMR as thermal storage to supply electricity andprocess heat. The power density, outlet temperature, and the process heat temperature of MMR are1.24 W/cm3, 630 ◦C, and 750 ◦C, respectively. The active system is not required to extract heat in theMMR-based plant. Moreover, off-site service, such as electric power, is also not needed for the safeoperation of this type of reactor [28].
A 1 MWe MMR is considered in this research. It always supplies a constant 1 MWe to the load.Since the MMR has the CHP capability, 40% of the waste heat of the MMR can be utilized to supportthe thermal load of the system. There are no GHG emissions to produce electricity from MMR andthere is no GHG emissions during operation. However, if fossil fuel is burnt in the construction of NPP,or if the fossil fuel is used in mining or refining uranium ore, GHG will be produced; but, this types of
51

Energies 2020, 13, 1642
GHG emissions are not considered in this study. A detail specification of MMR is listed in Table 4. TheMMR can operate without refueling up to 5 years [29]. However, the spent fuel transportation cost isnot considered in this study.
Table 4. Specifications of the MMR.
Parameter Value
Fuel Type UraniumNominal Capacity (kW) 1000
Capital Cost (USD) 11,250,000Refurbishment Cost (USD) 2,300,000
Operation and Maintenance Cost (USD/lifetime) 1,510,000 [30]Lifetime (Years) 60 [29]Efficiency (%) 40 [30]
Heat Recovery Ratio (%) 40Fuel Price (USD/kg) 1390 [31]
The capital cost of an exact 1 MW*e MMR is also not available. Therefore, the capital cost ofa 1 MWe MMR is calculated as 11.25 million USD by linear estimation from the capital cost of a2 × 10 MW**t (2 units, each having a power rating of 10 MWt) [30]. The refurbishment cost of the plantis approximated as 2.3 million USD [31]. (*MWe =megawatt electric, **MWt =megawatt thermal).
3.8. Electric Grid
The studied N-R MHES is analyzed for the grid-connected mode of operation. An electric grid,with the “net metering” provision, is considered here. The purchase and the sale capacity of the gridare determined and optimized by the HOMER software. The grid capacities (purchase and sale) areoptimized in such a way that the availability of electric power is always guaranteed for all cases,discussed in Sections 5.1–5.5. The optimized grid capacities confirm that if the energy resources failto supply the electricity demand, the grid is competent in providing the required electric power tothe load. The measured purchase and sale capacity of the electric grid are 0.9 MW and 1000 MW,respectively. The purchase capacity is the maximum amount of power that can be consumed from thegrid at a time. The sale capacity is the maximum power that can be sold to the grid by “net metering“at any time.
The electric energy that is being supplied to the grid is typically generated by burning fossil fuel.In this study, natural gas is considered as the fuel to generate the grid electricity. As the research alsofocuses on the environmental consequences of the N-R MHES, the grid emission is also considered.Though natural gas is a clean form of fuel, it still releases different types of gases to the atmosphere.The amount of emission from natural gas is listed in Table 5.
Table 5. Grid emissions [32].
Pollutant Emission Factor (g/kWh)
Carbon Dioxide (g/kWh) 181.1Carbon Monoxide (g/kWh) 0.062Particulate Matter (g/kWh) 0.0108
Sulfur Dioxide (g/kWh) 0.00155Nitrogen Oxides (g/kWh) 0.1424
Furthermore, the energy rate is not the same for all day long; it varies with time and types of load,such as industrial load, community load, residential load, and commercial load. For example, theelectricity price is not equal in the morning, and at the mid of the day. Even the cost of electricity insummer and winter also differs. Similarly, the electricity charge is different for household loads and
52

Energies 2020, 13, 1642
industries. By studying all these perspectives, different electricity prices are discussed in this study fordifferent times of the day and the year. The energy rates of the electric grid are summarized in Table 6.
Table 6. Energy rates of the electric grid [33].
Schedule Types of Energy RateElectricity Price
(USD/kWh)Sellback Price
(USD/kWh)
September-AprilWeekday
Off-peak (19.00–07.00) 0.065
0.025Mid-peak (11.00–17.00) 0.094
On-peak (07.00–11.00& 17.00–19.00) 0.134
Weekend Off-peak(full day) 0.065 0.025
May-AugustWeekday
Off-peak (19.00–07.00) 0.065
0.025Mid-peak (07.00–11.00
& 17.00–19.00) 0.094
On-peak (11.00–17.00) 0.134
Weekend Off-peak(full day) 0.065 0.025
3.9. Energy Storage
A lithium-ion battery bank, comprising 500 battery cells (each has nominal capacity of 1 kWh), isregarded as the energy storage component in this project. Both the capital and replacement cost of asingle cell are considered as 180 USD. The battery lifetime, SOCmin, SOCmin are 15 years, 100%, and30%, respectively, for this case.
3.10. Boiler
The boiler produces thermal power by heating fluids inside the boiler vessel to serve the thermalload. Though the generators, considered in this project, have CHP capability, the boiler is kept insidethe scenarios to support the thermal load for severe cases. If the extracted heat from the generators isnot adequate to serve the thermal load demand, the boiler supplies the rest of the thermal power. Forthis study, diesel is used as fuel for the boiler, and the boiler has an efficiency of 85%. The HOMERsoftware assumes that the boiler is an existing infrastructure, and its capital cost is not included in thetotal project expenses. However, the fuel price is added to the project cash-flow.
4. Design Considerations
Several features are considered in this project to estimate an accurate techno-economic evaluationof N-R MHES. Although numerous KPIs can be evaluated in N-R MHES, the three most importantKPIs – NPC, COE, and GHG emissions is conducted here as well. It is obvious that the fuel price, loaddemand, expenses of the equipment, and the efficiency of the machine would not be the same duringthe entire project life (30 years). Consequently, a multi-year analysis has been performed by varyingthe most significant parameters that influence the selected KPIs.
4.1. Key Performance Indicators
4.1.1. Net Present Cost
The NPC or life cycle cost of supplies is the present value of all cost (e.g., installation cost, operatingcost, replacement cost, fuel expense, emission penalties, purchasing cost of power from the grid),minus the present value of all the revenues; over the project lifetime [34].
53

Energies 2020, 13, 1642
The NPC can be calculated from the following equations. Since, the net present value and the netpresent cost differ only in sign:
Net Present Cost (NPC) = −Net Present Value (NPV) (8)
NPV =Cash flow
(1 + i)t − Initial Investment (9)
where i and t indicate discount rate (%) and number of time periods, respectively.If it is intended to calculate the NPC for longer project lifetime with multiple cash flows, the
formula can be modified as:
NPV =n∑
t=0
Rt
(1 + i)t (10)
where Rt and n denote net cash inflow-outflow in unit time period and project lifetime, respectively.
4.1.2. Cost of Energy
The COE is the average cost per unit useful electrical energy, kilowatt-hour (kWh). For a CHPsystem, the COE is calculated as follows [35]:
COE =CANNUAL,TOTAL −CBOILERHSERVED
HSERVED(11)
where CANNUAL, TOTAL, CBOILER, HSERVED, and ESERVED represent total annualized cost of the system($/year), boiler marginal cost ($/kWh), total annualized thermal load served (kWh/year), annualizedtotal electrical load served (kWh/year), respectively.
The unit of cash can vary from region to region. The second term of the numerator is responsiblefor serving the thermal load. If the system does not serve the thermal load, then CBOILERHSERVED = 0.
4.1.3. Greenhouse Gas Emission
The emission of pollutants mostly results from the generation of electric energy from theconventional thermal generator, production of thermal energy from the boiler, and consumption ofgrid electricity. The pollutants that are usually emitted from the generator, boiler, and electric grid arecarbon dioxide, carbon monoxide, particulate matter, sulfur dioxide, and nitrogen oxides.
In the simulation, the emission from the generator and boiler is determined in the same way;whereas, the emission from the grid is calculated differently. The annual emission from generator orboiler is estimated as follows:
Emission of any Pollutant by Generator/Boiler= Emission Factor
( gkWh
)× Total Annual Fuel Consumption (kWh)
(12)
Since the grid is capable of purchasing and selling energy, the annual grid emission is estimatedby Equation (13):
Emission of any Pollutant by Grid= Emission factor
( gkWh
)× (Grid Purchase Energy−Grid Sale Energy)(kWh)
(13)
To calculate the total emission throughout the project lifetime, the annual emission amount ismultiplied by the project lifetime.
4.2. Multi-year Analysis
For a multi-year analysis, six factors are examined that substantially affect the N-R MHESperformance. The percentage of changes of the selected factors are noted in Table 7. The value of
54

Energies 2020, 13, 1642
the parameters increases or decreases gradually according to the changes indicated in Table 7. Forexample, the grid electricity price is raised by 9.6% in each year throughout the total project lifetime.
Table 7. Parameters of the multi-year analysis.
Criteria Value (Change in %/year)
Grid Electricity Price Increment 9.6 [36]PV Degradation 1 [37]
Fuel Price Increment (Uranium) 0.0257 [38]Fuel Price Increment (Diesel) 10 [39]Electricity Demand Increment 0.3 [40]Thermal Demand Increment 0.1 [40]
4.3. Control Algorithm
A modified cycle charging control strategy is implemented in this project. In cycle chargingstrategy, renewable generators first supply electricity to meet the load demand, and the excess energy,if any, is occupied by the battery pack to charge in between SOCmax and SOCmin. If the renewablegenerators are incapable of fully supplying the electricity demand, standby battery bank comes to thescenario and supports the load along with the renewable generators. If the combination of renewablegenerators and batteries cannot fulfill the electricity demand, a back-up diesel generator will be initiatedto supply energy [41].
The modified cycle charging strategy is same as “cycle charging” strategy except for the inclusionof the MMR. The MMR provides a continuous supply of electricity and is turned-on always throughoutthe year, if there is no forced shutdown of MMR. However, if the energy system does not haveany renewable generator and the energy system includes conventional FFTG, battery, and electricgrid, the electricity demand will be served by the electric grid first, then by the battery, then by thethermal generator.
Figure 6 demonstrates the working strategy of the modified cycle charging, which is applied inthis study. Initially, the renewable generators, along with MMR, will be initiated to support the load. Ifthere is any excess energy, it will be applied to charge the battery, and the rest of the electric energy, ifany, will be sold to the grid. In this circumstance, S2, S3, S4, S7, S8, S9, and S10 will be closed. If theelectricity demand is increased slightly, the grid will supply the required electricity to the load. In thisstate, S2, S3, S4, S7, S8, S9, and S10 will also be turned off. The further rise in the demand, the batterybank will be operated; so, S2, S3, S4, S5, S7, S8, S9, and S10 will be closed. If the electricity demand isincreased more, the diesel generator (if any) will be started. Therefore, S1, S2, S3, S4, S5, S6, S7, S8, S9,and S10 will be operated. It should be noted that S10 is a bi-directional switch. For off-grid application,the excess energy will be consumed by dump load. A thermal load controller, rated as 1300 kW, is usedin the system to covert the excess electricity into thermal energy to support the thermal load demand.
In a particular case, when the system has no renewable generators, the diesel generator will beinitiated to charge the battery, and the grid will start supplying electricity to the load simultaneously(S1, S6, S7, and S10 will be closed). If the stand-alone gird is inadequate to accomplish the electricitydemand, the battery will be discharged to satisfy the electric load (S1, S5, S6, S7, and S10 will be closed).If the combination of the grid and battery fails to satisfy the electricity demand completely, the dieselgenerator will be turned on. The diesel generator will always make sure that the battery bank is fullycharged. The above-mentioned control algorithm is outlined in Figure 7.
55

Energies 2020, 13, 1642
Figure 6. Working strategy of the control algorithm.
Resource Assessment (RES, MMR, Diesel Generator, Electric Grid, Energy Storage)
Load Assessment (Electric and Thermal
Load)
PL(t)= PRES(t)+PGRID(t)+ PMMR(t)?
Calculate the demand, PL(t)
PL(t)>PRES(t)+PGRID(t)+
PMMR(t)?
PL(t)>PRES(t)+PGRID(t)+PMMR(t)+PBAT(t)?
Add diesel generator to support the loadSOC(t)=SOCmax?
PL(t)=PRES(t)+PGRID(t)+ PMMR(t)+PBAT(t)+PGEN(t)?
SOC(t)<SOCmax?Sell the excess electricity to grid
Charge the battery up to SOCmax
SOC(t)≤SOCmin?
Support the load by adding
battery power
SOC(t)≤SOCmin?
NO
NO
YES
YES
NO NO
YES
YES
YES
NO
YES
NO
YES
Start(t=0)
Finish
Support the load by PRES(t)+PGRID(t)
+PMMR(t)
YES
NO
t=t+1
t=t+1
NO
Figure 7. Control algorithm.
5. Simulations
In this section, five different types of energy systems are simulated in the HOMER software.The simulations include several components, such as electric load, thermal load, solar power, windpower, hydro power, energy storage (battery), electric grid, diesel generator, boiler, and power
56

Energies 2020, 13, 1642
electronics devices — various combinations of these components model the five different energysystems. The equipment ratings are assumed to be the same for all cases.
5.1. Case-01: Conventional Small-scale Fossil Fuel -based Thermal Energy System
In this case, no renewable generator is considered; this system model consists of electric load,thermal load, electric grid, battery, and boiler. The conventional small-scale grid-connected thermalenergy system is the most common electrical power generation system arrangement. This scheme isconsidered for the sake of comparison with N-R MHES. The equipment ratings are previously statedin Section 3. Figure 8 shows the system configuration.
(a) (b)
Figure 8. (a) Conventional small-scale grid-connected fossil fuel-based thermal energy system;(b) Conventional small-scale Off-grid fossil fuel-based thermal energy system.
Table 8 presents the total electricity and thermal energy production and consumption scenarioin the grid-connected system for the first year of the project period. Since the generated electricityand thermal energy production/distribution pattern are similar for each year of the project lifetime,only the first-year generation/consumption data of the five cases have been investigated in this paper.According to the control algorithm, the electric load demand is mostly fulfilled by the electric gridpurchased energy (99.99) and the genset supplies very small amount of energy (0.09%) for a short time.As the electric grid has an adequate power rating, it is capable of supplying electricity sufficiently tothe load. It should be remarked that the grid is always competent in handling any size of load demand;but, if the grid exceeds its’ rated capacity, the “demand charge” is applied to the user – causing asignificantly high electricity bill for the customer. HOMER always optimizes the system to the mosteconomical one; hence, the battery bank is operated to avoid the demand charge in this case.
Since the genset is operated for a short duration, the amount of cogenerated heat is very small.Moreover, there is no other thermal power generation sources in the system except genset and boiler.Therefore, 99.98% thermal demand is accomplished by the boiler. Table 9 presents the energy productionand consumption profile of the off-grid system for case-01. The Genest fully meets the electric demand.The thermal demand is accomplished mostly by the cogenerated heat of genset.
57

Energies 2020, 13, 1642
Table 8. Energy production and consumption scenario of grid-connected mode for the first year ofproject life (case-01).
ElectricityProduction
Amount(%)
ElectricityConsumption
Amount(%)
ThermalEnergy
Production
Amount(%)
ThermalEnergy
Consumption
Amount(%)
GridPurchase 99.99 Primary
Load 99.91 Boiler 99.98Thermal
load100
Genset 0.01 DeferrableLoad 0.09 Genset 0.02
Total 100 Total 100 Total 100 Total 100
Table 9. Energy production and consumption scenario of off-grid mode for the first year of projectlife (case-01).
ElectricityProduction
Amount(%)
ElectricityConsumption
Amount(%)
ThermalEnergy
Production
Amount(%)
ThermalEnergy
Consumption
Amount(%)
Genset 100
PrimaryLoad 99.91 Genset 97.42
Thermalload
100Deferrable
Load0.09
Boiler 2.57
ExcessElectricity 0.01
Total 100 Total 100 Total 100 Total 100
5.2. Case-02: Small-scale Stand-alone Renewable Energy Sources-based Energy System
This is a RES-based energy system with the electric grid; no thermal generator is installed in thiscase. The boiler is included to serve the thermal load. The RESs include wind, solar, and hydro powerin this case. Figure 9 shows the stand-alone grid-connected RES-based energy system.
(a) (b)
Figure 9. (a) Small scale stand-alone grid-connected renewable energy sources-based energy system;(b) Small scale stand-alone Off-grid renewable energy sources-based energy system.
58

Energies 2020, 13, 1642
Since the electricity production by RESs is insignificant compared to the electricity demand andthe availability of RESs is irregular, a substantial amount of electricity (45.90%) is purchased from thegrid, addressed in Table 10. The rest of the electricity demand is fulfilled by the combination of wind(31.10%), hydro (14.90%), and solar (8.10%). The primary electric load is the summation of ElectricLoad #1 and Electric Load #2.
The thermal demand is totally met by boiler since boiler is the only thermal power generator inthis system architecture. The thermal load is also the summation of Thermal Load #1 and Thermalload #2. In case-02, the system equipment cannot fulfill the electric and thermal load demand withoutelectric grid. Even the battery bank is not capable of fulfilling the electricity demand in case-02 (off-gridmode). Hence, there is no feasible energy distribution scenario for case-02 (off-grid mode).
Table 10. Energy production and consumption scenario of grid-connected mode for the first year ofproject life (case-02).
ElectricityProduction
Amount(%)
ElectricityConsumption
Amount(%)
ThermalEnergy
Production
Amount(%)
ThermalEnergy
Consumption
Amount(%)
GridPurchase 39.30 Primary
Load 94.70
Boiler 100 ThermalLoad
100Wind 27.60 Grid Sales 5.19
Hydro 22.60 DeferrableLoad
0.11Solar 10.50
Total 100 Total 100 Total 100 Total 100
5.3. Case-03: Conventional Small-scale Fossil Fuel-based Thermal and Renewable Energy Sources-based HybridEnergy System
Figure 10 outlines a typical fossil fuel-based thermal-renewable micro hybrid energy system,which is a combination of case-01 and case-02. The power rating and costs are the same as the previousspecification for all components.
Table 11 presents the amount of the electric and thermal energy production and consumptionwithin the system. The contribution of electricity production by the sources is same as case-02. Thoughthe diesel Genset is available in the system, HOMER optimizes the system for the lowest cost andprefers the electric grid over the Diesel genset to serve the electricity demand. Therefore, the electricdemand is fulfilled without operating the genset. Moreover, the RESs are non-dispatchable andgenerates excess energy—higher than the need—for a definite period depending on the availability ofRESs; this small amount of surplus electricity (6.19%) is sold to the grid, indicated in Table 11. As thegenset is not operated at all, no cogenerated heat is available for this system. Hence, the thermaldemand is fully supplied by the boiler.
In the off-grid mode, 46.47% and 75.70% of the total electric and thermal demand, respectively,are satisfied by the genset and cogenerated heat of the genset. Around 15.3% of the thermal demand ismet by the surplus electric power, which is generated by wind, hydro, and solar. The thermal loadcontroller, depicted in Figure 10b, converts the excess electric power into thermal power if needed bythe thermal load. For this case, energy production and consumption scenario of off-grid mode for thefirst year of project have shown in the Table 12.
59

Energies 2020, 13, 1642
(a) (b)
Figure 10. (a) Conventional small-scale fossil fuel-based grid-connected thermal and renewable energysources-based hybrid energy system; (b) Conventional small-scale fossil fuel-based off-grid thermaland renewable energy sources-based hybrid energy system.
Table 11. Energy production and consumption scenario of grid-connected mode for the first year ofproject life (case-03).
ElectricityProduction
Amount(%)
ElectricityConsumption
Amount(%)
ThermalEnergy
Production
Amount(%)
ThermalEnergy
Consumption
Amount(%)
GridPurchase 39.30 Primary
Load 94.70
Boiler 100 ThermalLoad
100Wind 27.60 Grid Sales 5.19
Hydro 22.60 DeferrableLoad
0.11Solar 10.50
Total 100 Total 100 Total 100 Total 100
Table 12. Energy production and consumption scenario of off-grid mode for the first year of projectlife (case-03).
ElectricityProduction
Amount(%)
ElectricityConsumption
Amount(%)
ThermalEnergy
Production
Amount(%)
ThermalEnergy
Consumption
Amount(%)
Genset 56.86 PrimaryLoad
99.90Genset 87.46
ThermalLoad
100Wind 14.3 Excess
Electricity 2.77Hydro 23.4 Deferrable
Load0.10
Solar 5.44 Boiler 9.77
Total 100 Total 100 Total 100 Total 100
60

Energies 2020, 13, 1642
5.4. Case-04: Small-scale Stand-alone Nuclear Energy System
Figure 11 illustrates a stand-alone grid-connected small-scale nuclear power system. The systemconfiguration is similar to case-01, except the Diesel genset is replaced by an MMR with the samepower and CHP rating.
The MMR always provides a continuous supply of electricity at its’ rated capacity, and a singleunit of MMR is capable of supplying full electricity demand (100%) in the case-04, indicated in Table 13.Table 13 also shows that a considerable amount of surplus energy (47.90%) is being sold to the grid;this ultimately causes profit for the system. Moreover, since the MMR has the 40% CHP rating and theMMR runs continuously throughout the year, the cogenerated heat from MMR is fully sufficient toserve the thermal load demand of the system, depicted in Table 11. The boiler is not contributing inthis case to serve the thermal load.
As shown in Table 14, in off-grid mode, the total electric demand is fulfilled by the MMR.The thermal demand is partially (53.9%) met by the cogenerated heat of MMR, and the excess electricityaccomplishes the rest (46.1%) of the demand.
(a) (b)
Figure 11. (a) Small-scale grid-connected stand-alone nuclear energy system; (b) Small-scale off-gridstand-alone nuclear energy system.
Table 13. Energy production and consumption scenario of grid-connected mode for the first year ofproject life (case-04).
ElectricityProduction
Amount(%)
ElectricityConsumption
Amount(%)
ThermalEnergy
Production
Amount(%)
ThermalEnergy
Consumption
Amount(%)
MMR 100
PrimaryLoad 52.05
MMR 100 ThermalLoad
100Grid Sales 47.90
DeferrableLoad 0.05
Total 100 Total 100 Total 100 Total 100
61

Energies 2020, 13, 1642
Table 14. Energy production and consumption scenario of off-grid mode for the first year of project life(case-04).
ElectricityProduction
Amount(%)
ElectricityConsumption
Amount(%)
ThermalEnergy
Production
Amount(%)
ThermalEnergy
Consumption
Amount(%)
MMR 100
PrimaryLoad 99.10 MMR 53.9
ThermalLoad
100Deferrable
Load 0.01 ExcessElectricity 46.1
Total 100 Total 100 Total 100 Total 100
5.5. Case-05: Nuclear-Renewable Micro Hybrid Energy System
This case represents an N-R MHES, similar to case-03, except the diesel generator is interchangedby an MMR. Figure 12 shows the schematic of an N-R MHES.
(a) (b)
Figure 12. (a) Grid-connected nuclear-renewable micro hybrid energy system; (b) Off-gridnuclear-renewable micro hybrid energy system.
In N-R MHES, three-quarters (76.8%) of the total electricity demand is served by the MMR, andthe rest of the electricity demand is achieved by the RESs, mentioned in Table 15. Since electricityproduction also is massive in this case, a substantial amount of excess energy (59.86%) is sold to thegrid. Likewise, the case-04, the whole thermal demand is met by the cogenerated heat from MMR inthis case; the boiler is kept in idle mode.
In off-grid mode, 76.8% electric load is served by the MMR which has been shown in Table 16.A significant amount of excess electric energy (58.2% of total thermal demand) generated by thecombination of MMR and RESs is used to serve the thermal by the help of thermal load controller.
62

Energies 2020, 13, 1642
Table 15. Energy production and consumption scenario of grid-connected mode for the first year ofproject life (case-05).
ElectricityProduction
Amount(%)
ElectricityConsumption
Amount(%)
ThermalEnergy
Production
Amount(%)
ThermalEnergy
Consumption
Amount(%)
MMR 74.90 PrimaryLoad 39.10
MMR 100 ThermalLoad
100Wind 11.40 Grid Sales 60.86
Hydro 9.37 DeferrableLoad
0.04Solar 4.33
Total 100 Total 100 Total 100 Total 100
Table 16. Energy production and consumption scenario of off-grid mode for the first year of projectlife (case-05).
ElectricityProduction
Amount(%)
ElectricityConsumption
Amount(%)
ThermalEnergy
Production
Amount(%)
ThermalEnergy
Consumption
Amount(%)
MMR 81.25 PrimaryLoad
99.90Excess
Electricity 55.9Thermal
Load100
Wind 6.19
Hydro 10.2 DeferrableLoad
0.10 MMR 44.1Solar 2.36
Total 100 Total 100 Total 100 Total 100
6. Results
The study has investigated three important KPIs of N-R MHES. To evaluate the KPIs, the N-RMHES is compared with four other different energy systems (from case-01 to case-04). The computedNPC, for both grid-connected and off-grid mode, of the five cases are recorded in Table 17. The HOMERPro software optimizes the system based on the NPC of the system.
For the grid-connected mode, case-01 has the highest NPC and COE, whereas case-04 and case-05has the lowest NPC and COE, respectively. In case-01 (grid-connected mode), 99.99% electricity ofthe total electric demand is purchased from the grid. Furthermore, a massive amount of Diesel fuel(161,438 L/year) is utilized in the boiler to serve the thermal load that raises the total system cost.Consequently, the NPC and COE are quite high for this case. Case-04 (grid-connected mode) has thelowest NPC due to lower capital cost and operating cost. In case-05 (grid-connected mode), a largenumber of surplus electric energy is being generated by the combination of MMR and RES, and thesystem makes a significant amount of revenue by selling the excess energy to the grid. Besides, thecogenerated heat from MMR is adequate to serve the thermal demand fully; thus, no additional fuel isrequired to serve the thermal load. Therefore, COE is the lowest for this case. The NPC of case-05(grid-connected mode) is slightly higher than case-04 (grid-connected mode) due higher initial cost ofdifferent RES equipment, such as wind turbine, hydro turbine, and PV panel.
In the off-grid mode of operation, case-01 exhibits the highest NPC and COE. On the other hand,case-04 (off-grid mode) has the lowest NPC and COE. It should be remarked that case-02 does notprovide any feasible solution, implying that the system cannot support the electric demand studied inthis paper. In case-01 (off-grid mode), the genset supplies the total electric load by burning fuel, whichincreases the system cost significantly. However, boiler fuel cost is less in this case since the boilerprovides only 2.57% of thermal demand. In case-04, the NPC is lowest because the system consists ofonly MMR; no RESs are involved here. The absence of RESs reduces the system cost significantly asthere is no high initial cost.
63

Energies 2020, 13, 1642
Furthermore, the substantial excess electric energy is utilized by the thermal load controller toserve the thermal load. Since the boiler is not operated, and there is no additional fuel cost to fulfillthe thermal demand, the NPC and COE of the overall system are reduced in case-04 (off-grid mode).Nevertheless, it should be mentioned that a vast amount of excess electric energy (6,210,660 kWh/year)and thermal energy (9,765,760 kWh/year) is generated in case-05 (off-grid mode) compared to thecase-04 (off-grid mode). The excess electric and thermal energy produced in case-04 (off-grid mode) areestimated as 4,193,123 kWh/year and 7,748,223 kWh/year, respectively. Due to the absence of electricgrid in case-05 (off-grid mode), the excess electric energy is not being sold to the grid; hence, both NPCand COE are higher in case-05 (off-grid mode) than case-04 (off-grid mode).
Table 17. Case-wise comparison of NPC and COE.
Scenario System Status NPC (USD) COE (USD/kWh)
Case-01Grid-connected 31,583,960 0.3781
Off-grid 57,040,910 0.7656
Case-02Grid-connected 19,877,210 0.1907
Off-grid NFS * NFS *
Case-03Grid-connected 20,142,290 0.1946
Off-grid 37,807,960 0.4728
Case-04Grid-connected 10,960,580 0.0345
Off-grid 12,371,000 0.0856
Case-05Grid-connected 10,987,980 0.0262
Off-grid 13,221,380 0.0985
* NFS = Non-feasible Solution.
Table 18 presents the amount of GHG emissions in various cases. In this project, five types of GHGsare studied: carbon dioxide, carbon monoxide, sulfur dioxide, nitrogen oxide, and particulate matter.The particulate matter includes smoke, soot, and liquid droplets. For grid-connected mode, in case-01,all types of GHG emissions are highest because 99.99% of the electric demand is supplied by the electricgrid in case-01 and the burning of natural gas produces the grid electricity. As there is no burning offossil fuel in case-04 (both grid-connected and off-grid mode) and case-05 (both grid-connected andoff-grid mode), and the MMR fulfills the demand (both electric and thermal) implicitly, GHG emissionsare zero for these cases. It should be mentioned that the amount of GHG emissions is only accountedfor the electricity production process in this study; the carbon footprint for construction of the site andequipment manufacturing (i.e., PV panel) are not reflected here. Surprisingly, the GHG emissions aresignificant in case-02 (grid-connected mode) and case-03 (grid-connected mode). Generally, the GHGemission should be minimal in both cases because these are RES-based grid-connected hybrid energysystem, and only the fossil fuel is burnt to support the thermal demand. However, since the amount ofpurchased electricity from the grid is extensive in these cases and the grid electricity is being generatedby burning natural gas, case-02 (grid-connected mode) and case-03 (grid-connected mode) cause asignificant amount of GHG emissions.
For off-grid mode, case-01 also produces the maximum emissions due to the burning of dieselin the Genset and the boiler. Case-04 and case-05 show zero-emission since the full demand (bothelectrical and thermal) is satisfied by the combination of MMR, RESs, and cogenerated heat from MMR.
64

Energies 2020, 13, 1642
Table 18. Case-wise comparison of GHG emission.
Pollutant System Status Case-01 Case-02 Case-03 Case-04 Case-05
Carbon Dioxide(kg/year)
Grid-connected 1,254,395 771,827 771,827 0 0
Off-grid 3,261,052 NFS 1,700,908 0 0
CarbonMonoxide(kg/year)
Grid-connected 284 118 118 0 0
Off-grid 16,742 NFS 8468 0 0
Sulfur Dioxide(kg/year)
Grid-connected 1067 1062 1062 0 0
Off-grid 7972 NFS 4160 0 0
Nitrogen Oxide(kg/year)
Grid-connected 651 271 271 0 0
Off-grid 3209 NFS 1623 0 0
Particulate Matter(kg/year)
Grid-connected 49.3 20.6 20.6 0 0
Off-grid 143 NFS 72.4 0 0
However, the discussion mentioned above cannot draw a single conclusion explicitly since thistechno-economic study depends on several variables. Therefore, a sensitivity analysis is also carriedout to identify the impact of three critical parameters- discount rate, inflation rate, and project lifetime– on the system performance. Three different values are taken for each parameter, and the systemis evaluated based on these values, presented in Table 19. From Table 19, the stand-alone off-gridRES-based system (case-02) is not feasible despite the higher or lower discount rate, inflation rate,and project lifetime in this study. Case-01 (off-grid mode) and case-04 (off-grid mode) cannot alsomanage the selected electric and thermal load demand, studied here, for longer project lifetime (60and 100 years), depicted in Table 19. Moreover, case-03 (off-grid mode) is not capable of fulfilling thestudied electric and thermal load for a long project lifetime (100 years). All the system infeasibilityhappens due to capacity shortage. Since the electric and thermal demand is increasing at a certainpercentage each year without increasing the capacities of the resources, the current resources cannotserve the demand fully. The higher inflation rate has a notable impact also in the infeasible system.However, the N-R MHES (case-05, both grid-connected and off-grid mode) shows that it can supportthe demand always with considerably lower NPC, regardless of the higher or lower discount rate,inflation rate, and project lifetime. Higher inflation rate increases the NPC of case-01, case-02, andcase-03 significantly.
For the lower discount rate (3% and 8%) and short project lifetime (30 years), case-04 (off-gridmode) could have better performance than case-05 (off-grid mode) in terms of NPC, for instance,scenario No. 1,4,7,10,13, and 16 in Table 19. Sometimes, the NPC could also be lesser in case-04 (off-gridmode) in the high discount rate (10%) and small project lifetime (30 years), such as scenario No. 19,22,and 25.
For the lower value of project lifetime (30 and 60 years) or smaller value of inflation rate (2%and 4%), case-04 (grid-connected) may also show a slightly lower amount, compared to case-05(grid-connected), of NPC for a few cases (e.g., scenario No. 10 and 19). However, for the higher valueof project lifetime (60 and 100 years), case-05 always provides the most economical NPC.
65

Energies 2020, 13, 1642
Ta
ble
19
.Se
nsit
ivit
yan
alys
is.
No
.D
isco
un
tR
ate
Infl
ati
on
Ra
teP
roje
ctL
ife
tim
eS
yst
em
Sta
tus
NP
C
Ca
se-0
1C
ase
-02
Ca
se-0
3C
ase
-04
Ca
se-0
5
13
230
Gri
d-co
nnec
ted
79.4
M*
48.8
M49
.0M
9.75
M9.
13M
Off
-gri
d14
4M
NFS
94.5
M12
.3M
13.4
M
23
260
Gri
d-co
nnec
ted
1.11
B**
687
M68
7M
12.4
M9.
07M
Off
-gri
dN
FS**
*N
FS1.
42B
NFS
16.3
M
33
210
0G
rid-
conn
ecte
d36
.1B
NFS
22.2
B72
9M
23.0
M
Off
-gri
dN
FSN
FSN
FSN
FS19
.2M
43
430
Gri
d-co
nnec
ted
121
M73
.8M
73.8
M8.
61M
7.49
M
Off
-gri
d22
0M
NFS
144
M12
.1M
13.3
M
53
460
Gri
d-co
nnec
ted
2.94
B1.
82B
1.82
B15
.2M
6.27
M
Off
-gri
dN
FSN
FS3.
77B
NFS
19.3
M
63
410
0G
rid-
conn
ecte
d20
8B
NFS
128
B4.
37B
96.7
M
Off
-gri
dN
FSN
FSN
FSN
FS29
.7M
73
530
Gri
d-co
nnec
ted
149
M91
.2M
91.1
M7.
79M
6.32
M
Off
-gri
d27
3M
NFS
178
M11
.9M
13.1
M
83
560
Gri
d-co
nnec
ted
4.81
B2.
99B
2.99
B18
.4M
3.70
M
Off
-gri
dN
FSN
FS6.
19B
NFS
21.8
M
93
510
0G
rid-
conn
ecte
d49
9B
NFS
306
B10
.7B
233
M
Off
-gri
dN
FSN
FSN
FSN
FS41
.2M
108
230
Gri
d-co
nnec
ted
31.7
M19
.9M
20.1
M11
.0M
11.0
M
Off
-gri
d57
.0M
NFS
37.8
M12
.4M
13.2
M
118
260
Gri
d-co
nnec
ted
128
M79
.6M
79.9
M11
.3M
11.2
M
Off
-gri
dN
FSN
FS16
1M
NFS
13.8
M
128
210
0G
rid-
conn
ecte
d66
6M
NFS
411
M21
.0M
11.4
M
Off
-gri
dN
FSN
FSN
FSN
FS13
.9M
138
430
Gri
d-co
nnec
ted
45.3
M28
.1M
28.4
M10
.6M
10.5
M
Off
-gri
d81
.9M
NFS
54.0
M12
.4M
13.3
M
66

Energies 2020, 13, 1642
Ta
ble
19
.C
ont.
No
.D
isco
un
tR
ate
Infl
ati
on
Ra
teP
roje
ctL
ife
tim
eS
yst
em
Sta
tus
NP
C
Ca
se-0
1C
ase
-02
Ca
se-0
3C
ase
-04
Ca
se-0
5
148
460
Gri
d-co
nnec
ted
296
M18
3M
183
M11
.4M
10.7
M
Off
-gri
dN
FSN
FS37
4M
NFS
14.4
M
158
410
0G
rid-
conn
ecte
d3.
19B
NFS
1.96
B66
.7M
11.7
M
Off
-gri
dN
FSN
FSN
FSN
FS14
.9M
168
530
Gri
d-co
nnec
ted
54.5
M33
.7M
33.9
M10
.4M
10.1
M
Off
-gri
d98
.9M
NFS
65.0
M12
.4M
13.4
M
178
560
Gri
d-co
nnec
ted
459
M28
4M
284
M11
.6M
10.3
M
Off
-gri
dN
FSN
FS58
2M
NFS
14.8
M
188
510
0G
rid-
conn
ecte
d7.
19B
NFS
4.43
B14
3M
12.8
M
Off
-gri
dN
FSN
FSN
FSN
FS15
.7M
1910
230
Gri
d-co
nnec
ted
23.2
M14
.8M
15.0
M11
.2M
11.3
M
Off
-gri
d41
.6M
NFS
27.8
M12
.3M
13.1
M
2010
260
Gri
d-co
nnec
ted
63.5
M39
.6M
39.9
M11
.3M
11.4
M
Off
-gri
dN
FSN
FS78
.8M
NFS
13.4
M
2110
210
0G
rid-
conn
ecte
d17
8M
NFS
110
M13
.3M
11.5
M
Off
-gri
dN
FSN
FSN
FSN
FS13
.5M
2210
430
Gri
d-co
nnec
ted
32.3
M20
.2M
20.5
M10
.9M
11.0
M
Off
-gri
d58
.1M
NFS
38.5
M12
.4M
13.2
M
2310
460
Gri
d-co
nnec
ted
134
M83
.2M
83.5
M11
.3M
11.1
M
Off
-gri
dN
FSN
FS16
8M
NFS
13.8
M
2410
410
0G
rid-
conn
ecte
d72
4M
NFS
446
M22
.0M
11.4
M
Off
-gri
dN
FSN
FSN
FSN
FS13
.9M
2510
530
Gri
d-co
nnec
ted
38.4
M23
.9M
24.2
M10
.8M
10.7
M
Off
-gri
d69
.3M
NFS
45.8
M12
.4M
13.3
M
2610
560
Gri
d-co
nnec
ted
201
M12
4M
125
M11
.3M
10.9
M
Off
-gri
dN
FSN
FS25
3M
NFS
14.1
M
2710
510
0G
rid-
conn
ecte
d1.
55B
NFS
953
M36
.4M
11.4
M
Off
-gri
dN
FSN
FSN
FSN
FS14
.3M
*M=
mill
ion,
**B=
billi
on,*
**N
FS=
No
Feas
ible
Solu
tion
.
67

Energies 2020, 13, 1642
7. Discussion
Large-scale N-R HES is not a new concept. Research and innovation for the expansion of N-RHES are taking place in several countries. Nevertheless, due to significant risk and high capital costof large-scale NPP, small-scale NPP integration with RESs has been proposed and evaluated in thispaper. Although the N-R MHES depends on the availability of the local RESs, the N-R MHES alwaysprovides a baseload supply to strengthen the resiliency and stability of the hybrid energy system. Thispaper is intended to provide a clear idea of the technical and economic aspects of small-scale N-R HES.The key findings of this study can be summarized as follows.
From the sensitivity analysis, it can be concluded that the N-R MHES could be a resilient energysupply source for sustainable energy solutions in the future. The N-R MHES shows a significantbenefit for the long-term planning of a reliable energy system. Furthermore, the MMR can be a suitablereplacement for a Diesel genset in terms of NPC, COE, and emissions. From case-02 (off-grid mode), itis observed that the off-grid RES-based energy system is rarely capable or not capable of handlinglarge/medium-scale electricity demand adequately. However, the off-grid RES-based energy system canbe an impactful solution for small-scale electric/thermal demand. The case-02 (grid-connected mode)shows that the grid-energy is not always a clear form of an electric power source if the grid-energycomes from the burning of fossil fuel, although the grid-energy is deemed to be clean. Grid-connectedN-R MHES could be the most cost-effective solution in terms of COE to provide medium/large-scaleelectric power supply, depicted in case-05 (grid-connected mode). Moreover, as an extensive amountof excess electric and thermal energy is available in case-05 (off-grid mode), off-grid N-R MHES couldbe a suitable option for medium/large-scale remote industrial applications, such as desalination plants,mining stations, and EV charging platforms. Also, N-R MHES can provide the best solution fordecarbonization pathways project since there are no emissions in case-05.
Few other parameters, e.g., availability of RES, extreme conditions of RES, and abrupt changein electric and thermal load demand, also may influence the whole system performance and systemstability. But these kinds of severe conditions are not regarded in this study. Furthermore, the carbontax incorporation with the NPC and COE is beyond this study. If the carbon tax is included in thestudy, the NPC and COE of the case-01, case-02, and case-03 would be increased further. In addition,grid stability consideration is beyond of the scope of this study.
Author Contributions: Conceptualization, H.A.G., M.R.A. and M.I.A.; methodology, M.R.A. and M.I.A.; software,M.R.A.; validation, H.A.G., M.R.A. and M.I.A.; formal analysis, M.R.A.; investigation, M.R.A.; resources, M.R.A.;data curation, M.R.A.; writing—original draft preparation, M.R.A. and M.I.A.; writing—review and editing,M.R.A. and M.I.A; visualization, H.A.G., M.R.A. and M.I.A.; supervision, H.A.G.; project administration, H.A.G.;funding acquisition, H.A.G. All authors have read and agreed to the published version of the manuscript.
Funding: This research was funded by Natural Sciences and Engineering Research Council of Canada, grantnumber 210320.
Conflicts of Interest: The authors declare no conflict of interest.
Nomenclature
CCS Carbon Capture and StorageCHP Combined Heat and PowerCOE Cost of EnergyESS Energy Storage SystemFFTG Fossil Fuel-based Thermal GeneratorGHG Greenhouse GasHES Hybrid Energy SystemHOMER Hybrid Optimization Model for Electric RenewableIAEA International Atomic Energy AgencyIRR Internal Rate of ReturnKPI Key Performance Indicator
68

Energies 2020, 13, 1642
LCOE Levelized Cost of EnergySDG Sustainable Development GoalSTC Standard Test ConditionMM Mobile MicrogridMMR Micro Modular ReactorNASA National Aeronautics and Space AdministrationNPC Net Present CostNPP Nuclear Power PlantNPV Net Present ValueN-R HES Nuclear-Renewable Hybrid Energy SystemN-R MHES Nuclear-Renewable Micro Hybrid Energy SystemPV PhotovoltaicRES Renewable Energy SourceSMR Small Modular ReactorSOCmax State of Charge (maximum)SOCmin State of charge (minimum)TCI Total Capital InvestmentvSMR Very small reactors
References
1. Goal 7: Affordable & Clean Energy—UN SDG. Available online: https://www.gvicanada.ca/goal-7-affordable-and-clean-energy/ (accessed on 10 December 2019).
2. Usman, M.; Khan, M.T.; Rana, A.S.; Ali, S. Techno-economic analysis of hybrid solar-diesel-grid connectedpower generation system. J. Electr. Syst. Inf. Technol. 2018, 5, 653–662. [CrossRef]
3. Freris, L.; Infield, D. Renewable Energy in Power Systems; John Wiley & Sons, Ltd.: Hoboken, NJ, USA, 2008.4. Conserve Energy Future What Is Sustainable Energy and Its Types. Available online: https://www.conserve-
energy-future.com/sustainableenergy.php (accessed on 9 December 2019).5. Bragg-Sitton, S.M.; Boardman, R.; Rabiti, C.; Suk Kim, J.; McKellar, M.; Sabharwall, P.; Chen, J.; Cetiner, M.S.;
Harrison, T.J.; Qualls, A.L. Nuclear-Renewable Hybrid Energy Systems: 2016 Technology Development ProgramPlan; Oak Ridge National Lab.: Oak Ridge, TN, USA, 2016; p. 1333006.
6. Ruth, M.F.; Zinaman, O.R.; Antkowiak, M.; Boardman, R.D.; Cherry, R.S.; Bazilian, M.D. Nuclear-renewablehybrid energy systems: Opportunities, interconnections, and needs. Energy Convers. Manag. 2014, 78,684–694. [CrossRef]
7. IAEA TECDOC No: 1885. Nuclear-renewable hybrid energy systems for decarbonized energy production andcogeneration. In Proceedings of the Technical Meeting, Vienna, Austria, 22–25 October 2018; Technical Meetingon Nuclear-Renewable Hybdrid Energy Systems for Decarbonized Energy Production and Cogeneration,International Atomic Energy Agency. IAEA: Vienna, Austria, 2019. ISBN 978-92-0-161419-3.
8. Boldon, L.; Sabharwall, P.; Bragg-Sitton, S.; Abreu, N.; Liu, L. Nuclear Renewable Energy Integration: AnEconomic Case Study. Int. J. Energy Environ. Econ 2015, 28, 85–95.
9. Suman, S. Hybrid nuclear-renewable energy systems: A review. J. Clean. Prod. 2018, 181, 166–177. [CrossRef]10. Ruth, M.; Cutler, D.; Flores-Espino, F.; Stark, G.; Jenkin, T. The Economic Potential of Three Nuclear-Renewable
Hybrid Energy Systems Providing Thermal Energy to Industry; National Renewable Energy Lab.: Golden, CO,USA, 2016; p. 1335586.
11. Giatrakos, G.P.; Tsoutsos, T.D.; Mouchtaropoulos, P.G.; Naxakis, G.D.; Stavrakakis, G. Sustainable energyplanning based on a stand-alone hybrid renewableenergy/hydrogen power system: Application in Karpathosisland, Greece. Renew. Energy 2009, 34, 2562–2570. [CrossRef]
12. U-Battery What Is U-Battery? Available online: https://www.u-battery.com/what-is-u-battery (accessed on9 December 2019).
13. Westinghouse Nuclear. New Plants: eVinciTM Micro Reactor. Available online: http://www.westinghousenuclear.com/new-plants/evinci-micro-reactor (accessed on 9 December 2019).
14. Gabbar, H.A.; Abdussami, M.R. Feasibility Analysis of Grid-Connected Nuclear-Renewable Micro HybridEnergy System. In Proceedings of the 2019 IEEE 7th International Conference on Smart Energy GridEngineering (SEGE), Oshawa, ON, Canada, 12–14 August 2019; pp. 294–298.
69

Energies 2020, 13, 1642
15. Mishra, M.; Saxena, N.K.; Mishra, P. ANN Based AGC for Hybrid Nuclear-Wind Power System. In Proceedingsof the 2016 International Conference on Micro-Electronics and Telecommunication Engineering (ICMETE),Ghaziabad, India, 22–23 September 2016; pp. 410–415.
16. Elma, O.; Gabbar, H.A. Design and Analysis of Mobile Hybrid Energy System for Off-Grid Applications.In Proceedings of the 2019 International Conference on Power Generation Systems and Renewable EnergyTechnologies (PGSRET), Istanbul, Turkey, 26–27 August 2019; pp. 1–6.
17. Abdussami, M.R.; Gabbar, H.A. Flywheel-based Micro Energy Grid for Reliable Emergency Back-up Powerfor Nuclear Power Plant. In Proceedings of the 2019 International Conference on Smart Energy Systems andTechnologies (SEST), Porto, Portugal, 9–11 September 2019; pp. 1–6.
18. Finding Data to Run HOMER. Available online: https://www.homerenergy.com/products/pro/docs/latest/finding_data_to_run_homer.html (accessed on 26 December 2019).
19. Real Discount Rate. Available online: https://www.homerenergy.com/products/pro/docs/latest/real_discount_rate.html (accessed on 5 January 2020).
20. GlobalPetrolPrices.com Canada Diesel Prices. 18 November 2019. Available online: https://www.globalpetrolprices.com/Canada/diesel_prices/ (accessed on 25 November 2019).
21. How HOMER Calculates the PV Array Power Output. Available online: https://www.homerenergy.com/products/pro/docs/latest/how_homer_calculates_the_pv_array_power_output.html (accessed on25 November 2019).
22. How HOMER Calculates Wind Turbine Power Output. Available online: https://www.homerenergy.com/products/pro/docs/latest/how_homer_calculates_wind_turbine_power_output.html (accessed on25 November 2019).
23. How HOMER Calculates the Hydro Power Output. Available online: https://www.homerenergy.com/products/pro/docs/latest/how_homer_calculates_the_hydro_power_output.html (accessed on 25 November 2019).
24. Morales Pedraza, J. Small Modular Reactors for Electricity Generation; Springer: Cham, Switzerland, 2017; ISBN978-3-319-52215-9.
25. World Nuclear Association. Small Nuclear Power Reactors. Available online: https://www.world-nuclear.org/information-library/nuclear-fuel-cycle/nuclear-power-reactors/small-nuclear-power-reactors.aspx(accessed on 8 December 2019).
26. U-Battery. Available online: https://www.u-battery.com/ (accessed on 31 December 2019).27. Allen, K.S.; Hartford, S.K.; Merkel, G.J. Feasibility Study of a Micro Modular Reactor for Military Ground
Applications. J. Def. Manag. 2018, 8. [CrossRef]28. USNC. Available online: https://usnc.com/ (accessed on 9 December 2019).29. T. Abram et al., “Design of a U-Battery®,” p. 23, Nov. 2011. Available online: https://www.u-battery.com/
media (accessed on 31 March 2020).30. Abram, T.; Marsden, B.; Wickham, T.; Ding, M.; Kloosterman, J.L.; Kooijman, T.; Linssen, R. Design of a
U-Battery®. Delft Tech. Univ. 2011, 23.31. Nuclear Power Economics|Nuclear Energy Costs—World Nuclear Association. Available online:
https://www.world-nuclear.org/information-library/economic-aspects/economics-of-nuclear-power.aspx(accessed on 20 March 2020).
32. Natural Gas 1998, Issues and Trends. Available online: https://www.eia.gov/naturalgas/archive/056098.pdf(accessed on 27 December 2019).
33. Ontario Time-of-Use Electricity Rates. Available online: http://www.ontario-hydro.com/current-rates(accessed on 27 December 2019).
34. Arnaboldi, M.; Azzone, G.; Giorgino, M. Long-and Short-Term Decision Making. In PerformanceMeasurement and Management for Engineers; Elsevier: Amsterdam, The Netherlands, 2015; pp. 107–115.ISBN 978-0-12-801902-3.
35. Levelized Cost of Energy. Available online: https://www.homerenergy.com/products/pro/docs/latest/levelized_cost_of_energy.html (accessed on 27 December 2019).
36. Jackson, T.; Stedman, A.; Aliakbari, E.P.; Green, K. Evaluating Electricity Price Growth in Ontario; FRASERInstitute: Vancouver, BC, Canada, 2017.
37. Commercial Solar Panel Degradation: What You Should Know and Keep in Mind. Available online:https://businessfeed.sunpower.com/articles/what-to-know-about-commercial-solar-panel-degradation(accessed on 25 November 2019).
70

Energies 2020, 13, 1642
38. U.S Department of Energy; 2018 Uranium Marketing Annual Report; U.S. Energy Information Administration:Washington, DC, USA, 2018; Volume 70.
39. Erwin, S. New marine fuel rules to boost diesel prices for at least a year: Analysts. Reuters 2019.Available online: https://www.reuters.com/article/us-imo-shipping-usa-refiners/new-marine-fuel-rules-to-boost-diesel-prices-for-at-least-a-year-analysts-idUSKCN1TB2CJ (accessed on 31 March 2020).
40. Canada’s Energy Future 2018, An Energy Market Assessment. National Energy Board. Available online:https://www.cer-rec.gc.ca/nrg/ntgrtd/ftr/2018/2018nrgftr-eng.pdf (accessed on 31 March 2020).
41. Upadhyay, S.; Sharma, M.P. Development of hybrid energy system with cycle charging strategy using particleswarm optimization for a remote area in India. Renew. Energy 2015, 77, 586–598. [CrossRef]
© 2020 by the authors. Licensee MDPI, Basel, Switzerland. This article is an open accessarticle distributed under the terms and conditions of the Creative Commons Attribution(CC BY) license (http://creativecommons.org/licenses/by/4.0/).
71


energies
Article
Fault Current Tracing and Identification via MachineLearning Considering Distributed Energy Resourcesin Distribution Networks †
Wanghao Fei and Paul Moses *
School of Electrical and Computer Engineering, University of Oklahoma, Norman, OK 73019, USA; [email protected]* Correspondence: [email protected]† This paper is an extended version of our paper published in In Proceedings of the 2019 IEEE 7th
International Conference on Smart Energy Grid Engineering (SEGE), Oshawa, ON, Canada,12–14 August 2018; pp. 196–200.
Received: 11 October 2019; Accepted: 11 November 2019; Published: 14 November 2019
Abstract: The growth of intermittent distributed energy sources (DERs) in distribution grids is raisingmany new operational challenges for utilities. One major problem is the back feed power flows fromDERs that complicate state estimation for practical problems, such as detection of lower level faultcurrents, that cause the poor accuracy of fault current identification for power system protection.Existing artificial intelligence (AI)-based methods, such as support vector machine (SVM), are unableto detect lower level faults especially from inverter-based DERs that offer limited fault currents.To solve this problem, a current tracing method (CTM) has been proposed to model the singledistribution feeder as several independent parallel connected virtual lines that traces the detailedcontribution of different current sources to the power line current. Moreover, for the first time, theenhanced current information is used as the expanded feature space of SVM to significantly improvefault current detection on the power line. The proposed method is shown to be sensitive to very lowlevel fault currents which is validated through simulations.
Keywords: current tracing; fault current; distributed energy resources; network model
1. Introduction
Due to the increasing penetration rate of distributed energy sources (DERs), such as solar powerinjected at the distribution side of the power system, during the past decade, distribution grids havebecome large, complex, interconnected networks. The infusion of DERs onto distribution grids raisessome new state estimation challenges, such as fault current identification, which was less of an issue inconventional distribution grids operating without DERs.
The traditional distribution grid was not affected by irregular back power feeds caused byintermittent DER activity, as it was originally designed for single direction power flow from thesubstation to the customers. The ordinary fault current identification process is based on the faultcurrent threshold where no DERs are injected into the distribution grid. With DERs, excess power canbe generated and consumed by the customer or feed back to the distribution feeder. This raises newchallenges, especially in grid modeling methods for fault current identification, where the impact ofback feed power flow has to be considered for determining the fault current threshold. Failure to do somay have far reaching and costly consequences such as inadvertent tripping of circuits or overlookingfaults in the system.
Researchers have proposed many grid modeling methods for different types of power gridssuch as averaged models [1,2] and the port-Hamiltonian-based dynamic power system model [3].Certain modeling methods are suited for specific parts of the grid such as cyber-physical power systems
Energies 2019, 12, 4333; doi:10.3390/en12224333 www.mdpi.com/journal/energies73

Energies 2019, 12, 4333
framework modeling [4,5], topology modeling [6,7], load flow modeling [8,9], lightning protectionmodels [10], and traveling wave modeling [11]. In [12,13], the author used pattern recognition toidentify the fault current with the waveform data, which is an efficient tool for power transmission linefault detection. In addition, with the benefit of fast developing artificial intelligence (AI) technologies,many AI-based power system fault identification methods have been proposed as well, such assupport vector machine (SVM) [14], k-nearest neighbors algorithm (KNN) [13], pattern recognition [15],and deep learning [16].
Although different AI methods have been used to improve the accuracy of power system faultidentification, the approaches still heavily rely on grid modeling methods for some part of the powergrid. Most importantly, almost all of these AI-based fault current identification methods based onexisting grid modeling methods totally depend on the existing power line infrastructure, in thatcurrents from different power sources are congested to one end of a single power line and flowtowards the other end [17–19]. These methods are very effective when it comes to the identificationof larger fault currents, but some detailed current information such as those from inverter-basedDERs are difficult to detect. A much more detailed grid modeling method is needed to augment theAI method to be more sensitive to detect some lower level faults. This is particularly important inmodern distribution grids, as inverter-based DERs are known to produce exceptionally small faultcurrent contributions, due to inverter current limiting action, and are very difficult to detect throughconventional means.
For addressing the aforementioned grid modeling problems, a detailed grid model (referred toherein as the CTM) was proposed by the authors in a companion paper [20], which has sufficient detailof the current flows on the power line from each individual DER connected to the grid. The mainobjectives of this paper are as follows. First, for the first time, it is shown how the accuracy ofimplementing AI algorithms on such a detailed grid model can be improved. Specifically, implementingSVM algorithm on the proposed CTM model is explored. Second, in addition to using fault currentflows as the only input feature, the “traced” current information to expand the dimension of thefeature space is exploited. That is, the traced current is used along with the power line current asthe expanded feature space to identify the fault current which is a departure from existing methods.Finally, the performance of the combination of CTM with the SVM is demonstrated in the practicalscenario of fault identification with DERs operating in distribution grids. Specifically, this work showshow applying this hybrid method can improve sensitivity in detecting very low level faults.
This paper is organized as follows. In Section 2, the weaknesses of using traditional grid modelsfor fault current identification are pointed out, and applying CTM for multiple current sources of adistribution grid is proposed. The SVM method is implemented for fault current identification usingthe traced current in Section 3. Simulation results are presented in Section 4 and are discussed inSection 5, with concluding remarks given in Section 6.
2. Proposed Tracing Method
2.1. Single Power Line Fault Current Threshold
Consider the case where a DER group consists for example of solar and wind generation, avehicle-to-grid support battery storage, and loads that are attached to bus 1 are connected to the endof the power distribution grid through a single power line as shown in Figure 1.
74

Energies 2019, 12, 4333
Figure 1. Single power line with distributed energy source (DER) customers.
In Figure 1,�IL represents the power line current, and �U1 and �U2 are the voltages on buses 1 and2, respectively. The applied voltage difference angle of �U1 − �U2 is ψ. Without the impact of the DERgroup,�IL flows from bus 2 to bus 1 and the fault current can be easily identified by setting the faultcurrent threshold. However, when the impact of renewable energy sources is considered, as in thiscase, the fault current threshold is difficult to determine, as the DERs may contribute to the faultcurrent and the detection threshold varies. The power line’s current value and direction may also varywith the impact of DERs, which complicates the discrimination of faults from the normal condition.It is therefore necessary to know significantly more details of the current to determine if there is a faulton the power line or at the load.
2.2. Current Tracing
Using Figure 1 to demonstrate the CTM deduction, without loss of generality, it is assumed thatthe power line impedance is
Z = R + jX, (1)
where R > 0 and X > 0 are the resistance and reactance of the power line, respectively. An alternativecase, when X < 0, is discussed in the companion conference paper [20]. In this paper, only the X > 0case is considered. The impedance angle is θ. Based on Kirchhoff’s current law, it follows that
�IL = ∑ Iiejφi . (2)
where�Ii = Iiejφi is the current of the ith DER, and Ii > 0 and φi are the magnitude and phase angle of�Ii, respectively.
Figure 1 can be expressed with an equivalent circuit as shown in Figure 2a. The equivalence holdsas shown in Equations (3) and (4):
RE =R2 + X2
R, (3)
XE =R2 + X2
X, (4)
where RE > 0 and XE > 0 are the equivalent resistance and reactance respectively. Naturally, theequivalent circuit has the same total resistance, current, and power of the original circuit.
75

Energies 2019, 12, 4333
(a) Active-reactive current (b) Multiple current sources tracingFigure 2. Equivalent circuit.
In the equivalent circuit, the power line current�IL is virtually split into two parts defined as activecurrent�ILR and reactive current�ILX , which flows through RE and XE, respectively:
�IL = �ILR +�ILX , (5)
�ILR = ILRejψ, (6)
ILR = ILcos(θ), (7)
�ILX = ILXej(ψ− π2 ), (8)
ILX = ILsin(θ), (9)
where ILR and ILX are the magnitude of the active current and reactive current, respectively. Likewise,all current sources attached to bus 1 follow the same rule:
�Ii = �IRi +�IXi = IRiejψ + IXiej(ψ− π2 ), (10)
IRi = ILicos(ψ − φi), (11)
IXi = ILisin(ψ − φi), (12)
where IRi and IXi are the magnitude of the active and reactive current from�Ii, respectively, which couldeither be positive or negative. From Kirchhoff’s current law,
∑IRi>0
(�IRi) + ∑IRi<0
(�IRi) = ∑(�IRi) = �ILR, (13)
∑IXi>0
(�IXi) + ∑IXi<0
(�IXi) = ∑(�IXi) = �ILX , (14)
where ∑IRi>0
(�IRi) and ∑IRi<0
(�IRi) stand for the positive and negative part of �ILR, respectively, and
∑IXi>0
(�IXi) and ∑IXi<0
(�IXi) represent the positive and negative part of�ILX , respectively. The positive part
is responsible for supplying the load as well as feeding extra current to the power distribution grid.
76

Energies 2019, 12, 4333
The negative part is responsible for absorbing current from positive part. The jth positive currentsource flowing through the power line is
�I+LRj = I+LRjejψ, (15)
�I+LXj = I+LXjej(ψ−π
2), (16)
I+LRj =ILR IRj
∑IRi>0
(IRi), (17)
I+LXj =ILX IXj
∑IXi>0
(IXi). (18)
where �I+LRj is the active part of the jth positive current source flowing through the power line with
magnitude of I+LRj, and�I+LXj is the reactive part of the jth positive current source flowing through the
power line with magnitude of I+LXj. Therefore, the distribution grid model where each of the currentsare independent from one another can be shown in Figure 2b.
Combining the active and reactive components of the jth positive current source flowing throughthe power line, the equivalent circuit with part of the jth positive current source that flows throughthe power line can also be derived such that�I+LZj =
�I+LRj +�I+LXj, with its impedance, ZEj, as shown in
Figure 3. The complete derivation of this situation can be found in the companion paper [20].
Figure 3. Equivalent circuit of impedance lines.
3. Support Vector Machine and Current Tracing Kernel
3.1. Binary Classification Problem Formation
Given a set of power line current measurements Z = {zi, i = 1...n}, zi ∈ Rm that may or may not
contain fault current and the set of labels Y = {yi, i = 1...n}, yi ∈ {0, 1}, m stands for the dimension ofthe measurement, and n is the number of observations. The fault current identification problem can bemodeled as a binary classification problem by establishing the connection between the above two setssuch that
yi =
{−1 if ai = 0,
1 if ai �= 0.(19)
yi = 1 indicates that the ith current measurement is fault current, or, alternatively, there are nofault currents for yi = −1.
77

Energies 2019, 12, 4333
3.2. Support Vector Classifiers
The classification problem is reformatted into the optimization problem in [21]. The objectivefunction can be defined as
min12||ω||2 + C
m
∑i=1
ξi, (20)
where C is used to control the penalty of the misclassification, ω is a constant such thatω = [ω0, ω1, ...ωm]T , and ξi is the slack variable. The objective function is subject to the constraint that
ω0 + ωTzi ≥ 1 − ξi if yi = 1, (21)
ω0 + ωTzi ≤ ξi − 1 if yi = −1. (22)
3.3. Support Vector Machines
As an extension of the support vector classifier, SVM is established by enlarging the feature spaceusing kernel. Kernel is a function that is used to quantify the similarity of two observations. A linearKernel is defined as the inner product of two observations [21]:
K(zi, zi′) =m
∑j=1
zi,jzi′ ,j, (23)
where zi and zi′ are the two observations, and zi,j and zi′ ,j are the observations on jth dimension.In addition, some commonly used kernels are [21]
• Polynomial kernel: K(zi, zi′) = (1 + ∑mj=1 zi,jzi′ ,j)
d
• Radial kernel: K(zi, zi′) = exp(−γ ∑j=1m (xi,j − xi′ ,j)
2)
where γ and d are positive constants and r is a constant.
3.4. Current Tracing Kernel
In [22], the author applied principle component analysis to select the best features with highestinformation content to identify faults. This study concluded that the top three features for faultidentification were reactive power, real power, and angle of voltage. Interestingly, current is not one ofthem. The author concluded that with all of the three selected features, the accuracy of identification isalmost 96%. With all of the six features, i.e., the above features plus magnitude and angle of current andmagnitude of voltage, the accuracy of identification is no more than 97%. In the proposed approach,current is used as the only feature. Without current tracing, the feature space consists of only the linecurrent magnitude and angle.
Based on Equations (15)–(18), the line current can be decomposed into several traced currentsflowing through virtual impedance lines as shown in Figure 3. The feature space of line currents canbe enlarged by using the traced currents:
K(IL, ej(ψ−θ)) = �I+LZj. (24)
where K represents the linear mapping from power line current to the traced current.
4. Simulation Results
4.1. Current Tracing Kernel Results
In this simulation, the proposed CTM is applied to the single line system of Figure 4. Both sidesof the single line have a group of DERs and loads, and bus 2 is connected directly to the externaldistribution grid. All of the loads are of the constant power type, and the DERs are static generators.
78

Energies 2019, 12, 4333
Figure 4. Multiple source to multiple source on single power line.
The current sources parameters are listed in Table 1, which are given in the format of active andreactive power. DERs that connect to bus 1 cannot support the AC loads attached to bus 1 so that thecurrents flow from bus 2 to bus 1, which is opposite from the case shown in the companion paper [20].Bus 2 is selected as the reference bus and the single power line is 20 km length with series impedanceof 0.121 + j0.107 Ω/km.
Table 1. The current source parameters.
Bus LabelPower
Active/MW Reactive/MVar
1
1 −20 −102 −20 −53 30 154 20 5
21 −20 −102 40 153 30.872544 10.771589
In Table 1, the positive elements indicate an absorption of power whereas negative elementsrepresents generating power. The third current source attached to bus 2 is the external grid andis calculated by the power flow. Equations (15) and (16) are applied to find the traced current onthe power line from each bus as shown in Table 2. All of the traced currents are listed in per unitvalue. The traced current magnitude and phase in radians are selected as the kernel for fault currentidentification.
Table 2. Current tracing results with Equations (15)–(18).
Bus LabelActive Current Tracing Reactive Current Tracing
Mag Phase/° Mag Phase/°
1
1 0 0 0 02 0 0 0 03 5.3677 13.5251 5.6267 −76.47494 3.8535 13.5251 2.5276 −76.4749
21 0 0 0 02 3.5366 13.5251 3.6588 −76.47493 5.6847 13.5251 4.4955 −76.4749
In Table 2, a zero value indicates that the corresponding current source does not contribute tothe current on the power line. It can be observed that the zero value occurs at bus 1; labels 1 and2; and bus 2, label 1. This does not violate common sense as these are all labeled as loads that are
79

Energies 2019, 12, 4333
consuming active and reactive power and do not contribute to the power line current. Moreover, all ofthe traced active currents have the same phase angle regardless of how the current is traced from bus 1or bus 2 in either direction. The same rationale applies to the reactive currents. This is also consistentwith the fact that the voltages applied on the buses do not change when the current is decomposedinto its traced components. The reactive current is 90 degrees out of phase from the active current,which complies with Equations (15) and (16).
It is observed that, if all of the traced currents from the same bus are summed, the result isequivalent to the total power line current. This proves the equivalence of the current tracing theory asthe current tracing will not lose or generate new currents in addition to the line current.
4.2. SVM Results
In distribution systems with DERs, the fault current can be very small, as inverter-based DERscan only produce exceptionally small fault current contributions due to inverter current limiting action.Moreover, injected currents on different loads are continuously fluctuating in the normal condition.To obtain representative currents in the single line system, sample noises are injected to the specifiedload powers in Table 1 and the power flow is recalculated to obtain the traced current. This process isthen repeated to obtain the load profile and a continuous currents curve. The injected noise followsthe normal distribution such that,
X ∼ N(μ, σ2), (25)
where X represents active or reactive power sample noises; μ represents the average of the samplenoises, which is set to 0; and σ stands for the standard deviation, which is set to 0.1. All the samplenoises are independent from each other. The sample noises were injected cumulatively to the loadssuch that the kth point on the load profile is
Pk = P +k
∑i=1
Xpi, (26)
Qk = Q +k
∑i=1
Xqi, (27)
where Pk and Qk represent the active and reactive power of the kth point of the load profile, respectively;P and Q represent the given active and reactive power (Table 1); and Xpi and Xqi stand for the ithactive or reactive power sample noises, respectively.
This process is repeated 500 times, and all of the parameters that are used for current tracingand SVM training purpose are recorded. In addition to sample noises, a small fault is also injectedby increasing the active power consumption of bus 1, with current source 3 increased by 10% anddecreasing the reactive power by 10% of the same current source. Again, the process is repeated 500times, and all parameters are recorded. Only the traced current on the power line from bus 2 side isused as the current tracing kernel; however, it is the same as if the traced current from bus 1 side wasused as the current tracing kernel, as in the conference paper [20]. The first 500 parameters are takenas normal condition, i.e., yi = −1, and the last 500 parameters are considered as fault condition, i.e.,yi = 1. The penalty of misclassification C is set to be 1. Seventy percent of the parameters are randomlyselected as the training data, and the remaining 30% are taken as the testing data. In this work, thenon-waveform phasor current information is used for the fault identification problem. Other alternativemeasurement data have been considered in other research, such as exploiting sub-cycle waveformdistortion features in pattern recognition algorithms as a part of the identification process [12,15].
80

Energies 2019, 12, 4333
The confusion matrix is used to represent the testing results as defined in [23]. The f-score, recall,and precision parameters are used to evaluate the performance of fault current identification based onthe confusion matrix such that,
prec =tp
tp + f p, (28)
rec =tp
tp + f n, (29)
f s = 2prec ∗ recprec + rec
, (30)
where tp, fp, tn, and fn represent true positive, false positive, true negative, and false negative,respectively.
To show the advantage of using the current tracing kernel, the fault current identification resultsusing different feature spaces is compared. First, only the power line current�IL is used as the featurespace. Then, the polynomial kernel, radial kernel, and current tracing kernel are added as the expandedfeature space. All of the confusion matrices are calculated based on the same training and testing data.The confusion matrices and the performance based on the confusion matrices are shown in Tables 3and 4, respectively.
Table 3. Confusion matrix using different feature space.
Feature Space Fault Normal
No Kernel Predict Fault tp = 90 fp = 61Predict Normal fn = 13 tn = 136
Polynomial Kernel Predict Fault tp = 100 fp = 51Predict Normal fn = 19 tn = 130
Radial Kernel Predict Fault tp = 95 fp = 56Predict Normal fn = 16 tn = 133
Current Tracing Kernel Predict Fault tp = 145 fp = 6Predict Normal fn = 0 tn = 149
Table 4. Performance using different feature space.
Feature Space Precision Recall f1-Score
No Kernel 0.596 0.874 0.709Polynomial Kernel 0.662 0.840 0.74
Radial Kernel 0.629 0.856 0.725Current Tracing Kernel 0.96 1 0.98
It is clearly seen that among all the feature spaces used, the current tracing kernel has the bestperformance. All three performance parameters are significantly higher than the other feature spacesthat were used. The recall value equals 1, which indicates that when there is a fault current on thepower line; the SVM method using current tracing kernel will definitely detect it. In addition, thepolynomial kernel and radial kernel have a better performance than if only�IL is used as feature space.However, the performance parameters do not increase significantly. When comparing with the resultsshown in [22], which have 97% overall accuracy, the overall current tracing kernel result in this paperhas improved, i.e., an f1-score value of 98%.
5. Discussion
In the companion paper, it has been verified that the proposed tracing method is mathematicallyand physically identical to the original network. In this paper, the developed technique has beenapplied to a simple single power line system; however, it could be generalized to be as a part of a larger
81

Energies 2019, 12, 4333
distribution grid. Using the proposed CTM, pipelines of each current sources’ contribution towardsthe fault currents were established in the form of virtually decomposed traced currents. The expandedfeatures of the traced currents have the distinct advantage of containing more detailed information ofthe fault current, such as the change in contribution of each current source and the phase shift causedby the fault. These features can be exploited by the SVM algorithm for improved classification of faults,particularly where the fault levels are very low from the current limiting action of inverter-based DERs.
By choosing a large sample set of 1000 data points for faulted and normal cases, the proposedSVM method combined with the current tracing kernel is shown to be much more sensitive to verylow-level faults on the power line compared to the polynomial and radial kernel methods, where theaccuracy of detection was at most 74%. Compared to the other methods, such as the one in [22] wherethe accuracy of detection was at most 97%, the proposed method has improved accuracy of 98% whileusing significantly less measurement features.
These results are relevant in the context of smart grids aiming to improve distribution systemstate estimation, extending supervisory control and data acquisition processes beyond the substationdomain as DERs proliferate. In these simulations, only the batch data is used for training andtesting. However, the proposed model can be easily applied to practical streaming data obtainedfrom intelligent electronic devices used in advanced metering infrastructure such as protection relaysand phasor measurement units. With the enhanced features extracted through the proposed CTM,more intelligent protection relay coordination and fault isolation may be possible, particularly whenconsidering multiple inverter-based DER operation from energy storage and renewable energy.
6. Concluding Remarks
In this paper, we propose a CTM augmented with SVM method to model and test a distributionfeeder for power line fault current identification. The CTM modeled the distribution network byproviding a detailed map of how current flows from each current source that is connected to onebus towards another source tied to a different bus. The proposed method does not violate anyphysical circuit laws. After applying the proposed current tracing, the virtual traced currents andthe corresponding circuit are exactly equivalent to the original current and circuit. The tracedcurrent provides sufficient details and sensitivity for identifying faults and abnormal conditionsin the distribution feeder. With these details, the feature space of the power line current is enlargedthrough the “current tracing kernel”. In addition, the results proved and demonstrated the proposedmethod on a single power line distribution system, and the SVM method’s performance was evaluatedand compared by using different kernel methods. The results indicate that with the benefits of theproposed current tracing kernel, the SVM method is enhanced with more sensitivity to very low levelfaults compared to the commonly used kernel such as polynomial kernel and radial kernel.
The proposed method is a good fit for the distribution grid primary side overcurrent protectionscheme. In the companion paper, the multicurrent sources to multicurrent source current tracingare already introduced, and they can be used to further expand the feature spaces of fault current.In the future, the authors will explore the implementation aspects of the proposed CTM describedherein with the distribution grid backup protection scheme, especially the multicurrent sources tomulticurrent sources case, which would undoubtedly occur with higher DER penetration in the future.Furthermore, in future work, the authors will explore how to implement and test this approach ona laboratory scale distribution test feeder to further verify the implementation of the SVM detectionscheme using the proposed tracing method.
Author Contributions: Conceptualization, W.F.; methodology, W.F. and P.M.; software, W.F.; validation, W.F.and P.M.; formal analysis, W.F.; investigation, W.F.; resources, W.F.; data curation, W.F.; writing–original draftpreparation, W.F.; writing–review and editing, P.M.; visualization, W.F.; supervision, P.M.; project administration,P.M.; funding acquisition, P.M.
Funding: This research was funded in part by the Oklahoma Center for the Advancement of Science andTechnology (Project No. AR18-073) and the Oklahoma Gas & Electric Company (Project No. A18-0274).
82

Energies 2019, 12, 4333
Conflicts of Interest: The authors declare no conflicts of interest.
Abbreviations
The following abbreviations are used in this manuscript.
AI Artificial IntelligenceCTM Current Tracing MethodDER Distributed Energy ResourceKNN K-nearest NeighborsSVM Support Vector Machine
References
1. Saad, H.; Peralta, J.; Dennetiere, S.; Mahseredjian, J.; Jatskevich, J.; Martinez, J.; Davoudi, A.; Saeedifard, M.;Sood, V.; Wang, X.; et al. Dynamic averaged and simplified models for MMC-based HVDC transmissionsystems. IEEE Trans. Power Deliv. 2013, 28, 1723–1730. [CrossRef]
2. Daryabak, M.; Filizadeh, S.; Jatskevich, J.; Davoudi, A.; Saeedifard, M.; Sood, V.; Martinez, J.; Aliprantis, D.;Cano, J.; Mehrizi-Sani, A. Modeling of LCC-HVDC systems using dynamic phasors. IEEE Trans. Power Deliv.2014, 29, 1989–1998. [CrossRef]
3. Runolfsson, T. On the dynamics of three phase electrical energy systems. In Proceedings of the IEEEAmerican Control Conference (ACC), Boston, MA, USA, 6–8 July 2016; pp. 6827–6832.
4. Aravinthan, V.; Balachandran, T.; Ben-Idris, M.; Fei, W.; Heidari-Kapourchali, M.; Hettiarachchige-Don, A.;Jiang, J.N.; Lei, H.; Liu, C.C.; Mitra, J.; et al. Reliability modeling considerations for emerging cyber-physicalpower systems. In Proceedings of the 2018 IEEE International Conference on Probabilistic Methods Appliedto Power Systems (PMAPS), Boise, ID, USA, 24–28 June 2018; pp. 324–330.
5. Davis, K.R.; Davis, C.M.; Zonouz, S.A.; Bobba, R.B.; Berthier, R.; Garcia, L.; Sauer, P.W. A cyber-physicalmodeling and assessment framework for power grid infrastructures. IEEE Trans. Smart Grid 2015,6, 2464–2475. [CrossRef]
6. Fei, W.; Jiang, J.N.; Wu, D. Impacts of Modeling Errors and Randomness on Topology Identification ofElectric Distribution Network. In Proceedings of the 2018 IEEE International Conference on ProbabilisticMethods Applied to Power Systems (PMAPS), Boise, ID, USA, 24–28 June 2018; pp. 1–6.
7. Ji, G.; Sharma, D.; Fei, W.; Wu, D.; Jiang, J.N. A Graph-theoretic Method for Identification of ElectricPower Distribution System Topology. In Proceedings of the 1st Global Power, Energy and CommunicationConference (GPECOM), Nevsehir, Turkey, 12–15 June 2019; pp. 403–407.
8. Garces, A. A linear three-phase load flow for power distribution systems. IEEE Trans. Power Syst. 2016,31, 827–828. [CrossRef]
9. Yang, J.; Zhang, N.; Kang, C.; Xia, Q. A state-independent linear power flow model with accurate estimationof voltage magnitude. IEEE Trans. Power Syst. 2017, 32, 3607–3617. [CrossRef]
10. Vita, V.; Ekonomou, L.; Christodoulou, C.A. The impact of distributed generation to the lightning protectionof modern distribution lines. Energy Syst. 2016, 7, 357–364. [CrossRef]
11. Fei, W.; Ji, G.; Sharma, D.; Jiang, J.N. A New Traveling Wave Representation for Propagation of EnergyTransients in Power Lines from a Quantum Perspective. In Proceedings of the North American PowerSymposium (NAPS), Fargo, ND, USA, 9–11 September 2018; pp. 1–6.
12. Pavlatos, C.; Vita, V. Linguistic representation of power system signals. In Electricity Distribution; Springer:Berlin, Germany, 2016; pp. 285–295.
13. Harrou, F.; Taghezouit, B.; Sun, Y. Improved k NN-Based Monitoring Schemes for Detecting Faults in PVSystems. IEEE J. Photovolt. 2019, 9, 811–821. [CrossRef]
14. Abid, F.B.; Zgarni, S.; Braham, A. Distinct bearing faults detection in induction motor by a hybrid optimizedSWPT and aiNet-DAG SVM. IEEE Trans. Energy Convers. 2018, 33, 1692–1699. [CrossRef]
15. Pavlatos, C.; Vita, V.; Dimopoulos, A.C.; Ekonomou, L. Transmission lines’ fault detection using syntacticpattern recognition. Energy Syst. 2019, 10, 299–320. [CrossRef]
83

Energies 2019, 12, 4333
16. Guo, M.F.; Zeng, X.D.; Chen, D.Y.; Yang, N.C. Deep-learning-based earth fault detection usingcontinuous wavelet transform and convolutional neural network in resonant grounding distribution systems.IEEE Sens. J. 2017, 18, 1291–1300. [CrossRef]
17. Park, J.D.; Candelaria, J.; Ma, L.; Dunn, K. DC ring-bus microgrid fault protection and identification of faultlocation. IEEE Trans. Power Deliv. 2013, 28, 2574–2584. [CrossRef]
18. Vaseghi, B.; Takorabet, N.; Meibody-Tabar, F. Fault analysis and parameter identification ofpermanent-magnet motors by the finite-element method. IEEE Trans. Magn. 2009, 45, 3290–3295. [CrossRef]
19. Cheng, F.; Peng, Y.; Qu, L.; Qiao, W. Current-based fault detection and identification for wind turbinedrivetrain gearboxes. IEEE Trans. Ind. Appl. 2016, 53, 878–887. [CrossRef]
20. Fei, W.; Moses, P. Modeling Power Distribution Grids through Current Tracing Method. In Proceedingsof the IEEE International Conference on Smart Energy Grid Engineering (SEGE), Oshawa, ON, Canada,12–14 August 2019; pp. 196–200.
21. James, G.; Witten, D.; Hastie, T.; Tibshirani, R. An Introduction to Statistical Learning; Springer: Berlin,Germany, 2013; Volume 112.
22. Zhang, Y.; Ilic, M.D.; Tonguz, O.K. Mitigating blackouts via smart relays: A machine learning approach.Proc. IEEE 2010, 99, 94–118. [CrossRef]
23. Sammut, C.; Webb, G.I. Encyclopedia of Machine Learning and Data Mining; Springer Publishing Company,Incorporated: Berlin, Germany, 2017.
© 2019 by the authors. Licensee MDPI, Basel, Switzerland. This article is an open accessarticle distributed under the terms and conditions of the Creative Commons Attribution(CC BY) license (http://creativecommons.org/licenses/by/4.0/).
84

energies
Article
Comparison and Design of Resonant NetworkConsidering the Characteristics of a Plasma Generator
Geun Wan Koo 1, Won-Young Sung 2 and Byoung Kuk Lee 1,*
1 Department of Electrical and Computer Engineering, Sungkyunkwan University, 2066, Seobu-ro, Jangan-gu,Suwon-si 16419, Gyeonggi-do, Korea
2 Automotive Research & Development Division, Hyundai Motor Group, 150, Hyundaiyeonguso-ro,Namyang-eup, Hwaseong-si 18280, Gyeonggi-do, Korea
* Correspondence: [email protected]; Tel.: +82-31-299-4612
Received: 22 July 2019; Accepted: 15 August 2019; Published: 16 August 2019
Abstract: This paper presents a theoretical analysis and experimental study on the resonant networkof the power conditioning system (PCS) for a plasma generator. In order to consider the characteristicsof the plasma load, the resonant network of the DC-AC inverter is designed and analyzed. Specifically,the design of an LCL resonant network and an LCCL resonant network, which can satisfy the outputcurrent specification in consideration of plasma characteristics, is explained in detail. Moreover, theinverter current and phase angle between the inverter voltage and current is derived for evaluatinginverter performance. Based on these analysis results, the DC-AC inverter can be designed for aplasma generator considering plasma load characteristics. The theoretical analysis of both networksis validated through the simulation and experimental results.
Keywords: plasma generator; LCL network; LCCL network; phase compensation; ZVS control
1. Introduction
Plasma generators are used in various industrial fields for display panels and in the wafer cleaningprocess of semiconductors. According to the growth in the display and semiconductor markets, plasmagenerators are becoming increasingly important in industrial fields [1,2]. These plasma generatorsare conventionally constructed as a power conditioning system (PCS) and a chamber for plasmageneration. High frequency current must be supplied by the PCS to the reactor, which is a magneticsubstance in the chamber for supply energy which is used to ionize the gas entering the chamber. Theelectric field for ionizing is generated according to the frequency, sinusoidal wave, and magnitudeof the supplied current. Therefore, in order to effectively generate the electric field, the PCS shouldsupply high switching frequency and low total harmonic distortion (THD) constant current [3,4].
Another characteristic of the PCS for a plasma generator is that the inverter of the PCS usingzero voltage switching (ZVS) is conventionally adopted to decrease the switching losses. In orderto implement ZVS, the phase shift technique or load resonant technique has been used in previousresearch on the inverter. In order to achieve ZVS, the inverter should be designed in consideration ofthe following load characteristics in the plasma load case [5]: (1) the resistance of the load is increasedin proportion to the gas injected into the chamber; (2) the resistance of the load is changed in inverseproportion to the load current [6]; (3) a constant load current is recommended for maintaining thestable plasma state; (4) the THD of the load current should be low for effective plasma generation [7–9].
In the case of the conventional resistive load, the pulse frequency modulation (PFM) or phaseshift control are applied for the ZVS operation of the inverter. In plasma load, applying the PFM tothe control output current is difficult due to the characteristics of the plasma load mentioned above.When the PFM is used to vary the output current in the plasma load, the plasma load resistance isvaried depending on the output current. If the output current for generating plasma is increased, the
Energies 2019, 12, 3156; doi:10.3390/en12163156 www.mdpi.com/journal/energies85

Energies 2019, 12, 3156
resistance of the plasma load is decreased. When the output current for generating plasma is decreased,the resistance of the plasma load is decreased in an inversely proportional manner [6]. In addition,the designed initial Q-factor is varied rapidly due to changes in resistance. Because of the changedQ-factor, the resonant inverter cannot control the output current to the designed value.
Therefore, regulating the inverter output current using PFM is difficult because the plasma loadresistance is changed again and the phenomena mentioned previously occur repeatedly. In orderto solve these problems, the phase shift control should be used for the output current regulation.Conventionally, the phase shift full bridge inverter and load resonant inverter can solve the problemof using the phase shift control. In the plasma load case, the harmonics of the output current shouldbe strictly regulated in order to satisfy plasma quality as characteristics of the plasma load [10–13].Hence, it is difficult to adopt a phase shift full bridge inverter for the plasma system, and only the loadresonant inverter using the phase shift method can be adopted. If a phase shift inverter is used for theplasma load, the filter with the ability to implement the sinewave of the load current is required fordesigning a phase shift inverter [14,15]. Using the additional filter on the phase shift inverter leads toincreased system cost and volume. For this reason, the load resonant inverter using phase shift controlis preferred for the plasma load system over the phase shift inverter with an additional filter [15].
In order to adopt a load resonant inverter in the plasma system, the effective resonant networkdesign should be considered. There are two representative resonant networks for plasma systems: thestructure of an LCL resonant network and the structure of an LCCL resonant network. These networkshave different characteristics of the maximum inductor current and phase angle between invertervoltage (vo.inv) and inverter current (io.inv). In the resonant network design, the maximum inductorcurrent and inverter phase are the factors that influence the conduction loss and the soft-switchingrange for phase shift control. Therefore, in order to design a resonant network that is suitable for aplasma generator, the characteristics of the LCL network and the LCCL network should be comparedto select the optimal maximum inductor current and phase angle.
In this paper, in order to explain the specialty of plasma load to the design of the resonant network,both the LCL network and LCCL network, which are conventionally used for resonant inverter systemsand satisfy the specification of the plasma load, are analyzed in detail. Based on the analysis, the LCLresonant network and LCCL network are designed in consideration of the characteristics of the plasmaload and with the aim of preventing the drop-out phenomenon. In order to evaluate the designednetworks, simulation and analysis are conducted. Finally, the experimental results based on a 1 kWplasma generator are presented to verify the performances of the LCCL and LCL resonant networks onthe plasma generator.
2. Control Scheme and Characteristics of the Plasma Load
Figure 1 shows the conceptual circuit diagram of the plasma generation system that generatesplasma by injecting gas into the reactor of the chamber. In Figure 1, Lr, Cr, Llkg, and Rplasma representthe resonant inductor, resonant capacitor, leakage inductor, and the equivalent resistance of theplasma load, respectively. The “Vin” represents the input voltage of the inverter. vo.inv, io.inv, andiplasma indicate the mean output voltage of the inverter, the output current of the inverter and theoutput current for generating plasma, respectively. In the plasma generation system, the injected gasaffects the load. This plasma generator has unique features: (1) the impedance of the plasma load isproportionally decreased according to the increase in iplasma value [6] and (2) the sinusoidal wave ishighly recommended for generating plasma [15]. These characteristics are an important considerationpoint for designing the power supply of the plasma system.
86

Energies 2019, 12, 3156
Figure 1. Conceptual circuit diagram of the plasma generation system.
2.1. Chracteristics Analysis of the Plasma Load
These characteristics cause a special issue in the plasma system. Among the above-mentionedplasma characteristics, the impedance of plasma load leads to a special issue when pulse frequencymodulation is adopted for output current control. In Figure 2, in order to regulate the output current,the switching frequency (fsw) is changed to be above resonant frequency (fr). In the conventional gaincurve of the resonant network shown in Figure 2, in order to regulate the output current, increasing ordecreasing switching frequency is normally used in the resistive load.
(a) (b)
Figure 2. Description diagram of plasma drop-out: (a) frequency control method in resistive load; (b)frequency control method in plasma load.
However, in the plasma load case, when increasing the switching frequency to reduce the outputcurrent the plasma load impedance is increased according to the reduced output current. The increasedimpedance changes the Q-factor of the network to make a sharp current gain curve. In addition, theoutput current is decreased again because of the change in the current output gain curve, as shownin Figure 2. These mechanisms progress repeatedly until the output current reaches zero. Therefore,using PFM to control the output current is difficult in the plasma load. This phenomenon is calleddrop-out and is observed when controlling output current using PFM in the plasma load. In orderto solve the above-mentioned problems, the phase shift control scheme should be adopted for theresonant inverter to satisfy the output current control range. Moreover, the inverter should be operatedat the resonant frequency to avoid plasma drop-out.
2.2. Control Method Considering Characteristics of the Plasma Load
In order to obtain various output current ranges with ZVS, the resonant network should bedesigned to consider the minimum phase shift angle which can control the minimum plasma current
87

Energies 2019, 12, 3156
with ZVS operation. The minimum phase shift angle is calculated by Equation (1) [14], which representsthe relation between the amplitude of the fundamental wave of the inverter output voltage (vo.inv.1)and the phase shift angle.
Figure 3 shows the phase shift control scheme for output current control in the resonant inverter.In this scheme, the inverter is operated in order to reduce the fundamental wave of the inverter outputvoltage (vo.inv.1) with increasing phase shift angle for reducing the width of the square wave (β). Inthis control scheme, the vo.inv.1 can be calculated using Equation (1) and the phase angle between theinverter output voltage and output current is the crucial factor during ZVS to obtain various outputcurrents. According to Equation (1), vo.inv.1 can be controlled to adjust the phase shift angle at thefixed resonant frequency. The output current is obtained by the relationship between vo.inv.1 calculatedusing Equation (1) and the designed resonant network gain. Therefore, the maximum inverter currentand phase angle between vo.inv and io.inv should be considered in designing the resonant network toachieve lower conduction loss and soft-switching.
vo.inv.1 =4Vin· sin( β2 )
πcos(ωt− β
2) (1)
(a) (b)
Figure 3. Conceptual diagram of control method considering plasma drop-out: (a) full output currentcondition and (b) decreasing output current.
3. Analysis of the Resonant Network for the Plasma Load
The LCL network and the LCCL network are suitable structures for the resonant network forplasma generation. Depending on the network, the phase angle between the inverter maximum currentand the plasma current has different characteristics. Therefore, impedance analysis is necessary forconsidering the different characteristics of the resonant network depending on variations in the valuesof passive elements. Using the results of impedance analysis, the maximum current of the inverter,plasma current at the resonant frequency, and the phase between the inverter voltage and the currentcan be calculated.
3.1. Analysis of LCL Resonant Network
The LC resonant network is suitable for satisfying the constant current output of the plasmainverter with just a few passive elements. However, the LC resonant network is constructed here asthe LCL network because of the leakage inductance of the reactor which is used for plasma generation,as shown in Figure 4. Therefore, in order to design the power supply for the plasma generator, thecharacteristics of the LCL network should be analyzed mathematically. The first consideration pointin designing the network using mathematical analysis is deriving the Lr and Cr values, which canregulate the constant output current of the inverter regardless of load variation.
88

Energies 2019, 12, 3156
Figure 4. Conceptual circuit diagram of the LCL resonant network.
In order to regulate the constant output current while preventing drop-out, the resonant frequencyshould be selected as an operating frequency of the inverter, and the output current can be derivedfrom impedance analysis, as shown in Equation (2) [14]. Figure 5a presents the characteristics of outputcurrent through the impedance analysis according to frequency variation. As shown in Figure 5a,the output current changes with the load variation, except for the resonant frequency. Therefore, theresonant network should be designed to satisfy the maximum output current value at the resonantfrequency in the plasma generation system.
(a) (b)
Figure 5. Characteristics of LCL network for designing a power conditioning system (PCS): (a) outputcurrent characteristics of the LCL network and (b) phase angle characteristics of the LCL network.
After determining the maximum current, phase shift control is necessary for satisfying theminimum current of the load requirement and preventing drop-out. The phase shift angle for satisfyingthe minimum output current with phase shift control can be calculated using Equation (1). Theconsideration point for satisfying the phase shift angle which is calculated to regulate the minimumoutput current in the inverter is the phase difference between the inverter voltage and the current. Whenthe phase difference is smaller than the phase shift angle, the inverter is operated in the hard-switchingregion. By contrast, when the phase difference is larger than phase shift angle, the inverter could beoperated in the soft-switching region. The relationship between the phase shift angle and the phasedifference is considered using Equation (3) [16]. If the calculation results of Equation (3) are larger thanthe required phase shift angle, the inverter could be operated in the soft-switching region at resonantfrequency. Figure 5b shows the phase difference between the inverter voltage and the current accordingto load variation. When the inverter is operated at the resonant frequency to prevent drop-out andwhen the resistance of the load is small, the phase difference is large. Furthermore, the phase differencebecomes small when the resistance of the load is large, as shown in Figure 5b.
89

Energies 2019, 12, 3156
Using the above-mentioned analysis, the inverter can control the output current, which is requiredfor plasma generation. Regarding the other point of consideration aside from controlling load currentin order to design the power supply for the plasma generator, the inverter current (io.inv) should beconsidered for the efficiency of the inverter. The inverter current, which is the main cause of inverterlosses, can be calculated using Equation (4) [16]. This inverter current can be used for the index of theinverter efficiency. Therefore, in order to design a high efficiency inverter, the inverter current shouldbe considered.
iplasma.LCL(fr) =vo.inv.1
√Cr√
Lr(2)
θLCL(fr) = tan−1
⎡⎢⎢⎢⎢⎣ (Lr − Llkg)
Rplasma√
LrCr
⎤⎥⎥⎥⎥⎦ (3)
io.inv.LCL(fr) =
√Cr
Lr
1
Lr
√1
(Lr−Llkg)2+CrLrR2
plasma
(4)
3.2. Analysis of LCCL Resonant Network
The other structure of the resonant network for applying the plasma inverter is the LCCL network,as shown in Figure 6. Using the LCCL network, it is possible to compensate for the phase difference,which is not possible with the LCL network. In the case of the LCCL network design, it is necessary touse impedance analysis, as shown in Equation (5), to regulate the constant output current regardlessof the load at the resonant frequency in order to prevent drop-out. Figure 7a shows the maximumcurrent of the LCCL network according to load variation. Aside from the resonant frequency, theoutput current is changed with the load variation, as shown in Figure 7a.
Figure 6. Conceptual circuit diagram of the LCCL resonant network.
The phase shift control is also necessary for satisfying the minimum output current of the LCCLnetwork. In this case, the phase shift angle satisfying the minimum output current can be calculatedusing Equation (1), and the phase shift angle is equal to the case of the LCL network case because bothnetworks are designed for the same maximum current. In the case of the LCL network, designingthe phase difference between the inverter voltage and current is difficult because the values of Lr, Cr,and Llkg are already fixed in order to satisfy the maximum output current. On the other hand, in thecase of the LCCL network, the phase difference can be designed through the added compensationcapacitor (Ccomp), as shown in Equation (6). Figure 7b shows the phase difference of the LCCL networkaccording to the load variation at the resonant frequency. As shown in Figure 7b, the LCCL networkcan ensure a wider phase difference than the LCL network. Therefore, the LCCL network can beoperated in a wider ZVS range than the LCL network. In the case of the LCCL network, the invertercurrent can be calculated using Equation (7), and the inverter current of the LCCL network is increasedcompared with the inverter current of the LCL network.
90

Energies 2019, 12, 3156
(a) (b)
Figure 7. Characteristics of the LCCL network for designing a PCS: (a) output current characteristics ofthe LCCL network and (b) phase angle characteristics of the LCCL network.
Because of the compensation capacitor (Ccomp), as mentioned previously, the inverter current ofthe LCCL network is higher than that of the LCL network, and the LCCL network can extend the ZVSregion due to the compensation capacitor. Therefore, considering the overall efficiency of the inverter,loss analysis is necessary to compare the efficiency of both networks.
iplasma.LCCL(fr) =vo.inv.1
√Cr√
Lr(5)
θLCCL(fr) = tan−1
⎡⎢⎢⎢⎢⎣√
LrCr
RplasmaCcomp+
(Lr − Llkg)
Rplasma√
LrCr
⎤⎥⎥⎥⎥⎦ (6)
io.inv.LCCL(fr) =
√Cr
Lr
1
CcompLr
√1
CrLr
[CrLr+C2
compR2plasma+2Ccomp(Lr−Llkg)
]+C2
comp(Lr−Llkg)2
(7)
4. Simulation and Experimental Results
The simulation and experimental results are presented for the purpose of verifying the analysis ofthe resonant network. The simulation has been conducted to describe the operation characteristicsregarding the requirement and the phase shift angle. Finally, the applicability of the LCCL resonantnetwork for the plasma generator is validated using experimental results. Figure 8 shows the simulationwaveform about the LCL network and the LCCL network in the maximum current output condition.Both of the resonant networks can be operated to satisfy the maximum current output as shown inFigure 8a,b. When the LCL network is operated under the minimum current output conditions, thehard-switching region appears as is shown in Figure 8c. On the other hand, as shown in Figure 8d, theLCCL network can be operated with ZVS under the minimum load condition.
Loss analysis has been conducted to compare the efficiency of each resonant network [17]. In orderto analyze the losses of the inverter, only the switch loss is considered, without any loss of resonantinductor, which consists of an air core inductor and a resonant capacitor. Regarding the analysis results,the loss of the LCL network is smaller than that of the LCCL network in the ZVS operation regionunder the 20 A output condition, as shown in Figure 9. In the non-ZVS operation region at the 20 Aoutput condition, the loss of the LCL network is larger than that of the LCCL network. Beyond the 25A output region, the loss of the LCCL network is larger than that of the LCL network because the largeinverter current is required in the LCCL network.
91

Energies 2019, 12, 3156
(a) (b)
(c) (d)
Figure 8. Simulation waveform of each resonant network: (a) characteristics of the LCL network underthe 9 Ω, 35 A output conditions; (b) characteristics of the LCCL network under the 9 Ω, 35 A outputconditions; (c) characteristics of the LCL network under the 9 Ω, 20 A output conditions; and (d)characteristics of the LCCL network under the 9 Ω, 20 A output conditions.
(a) (b)
Figure 9. Loss analysis of each resonant network: (a) loss according to load variation in the LCLnetwork; (b) loss according to load variation in the LCCL network.
The experiment has been conducted based on the parameters listed in Table 1. Among theseparameters, the input voltage 1/3 scale-down model has been used with consideration of the laboratorypower distribution. The resonant network has been designed with Equation (2) considering switchingfrequency and maximum output current. Figure 10a shows the experimental waveform of the LCLnetwork, which represents the narrow phase angle. In this case, it is impossible for iplasma to becontrolled with the ZVS region using the phase shift control to obtain a minimum value, as shown inFigure 10a. On the other hand, a sufficient phase angle for the phase shift control in the ZVS region isobtained in the LCCL network, as shown in Figure 10b. In this result, the DC-AC inverter adoptingthe LCCL network can be operated with ZVS despite the worst case for obtaining the phase angle, asshown in Figure 10c.
92

Energies 2019, 12, 3156
Table 1. Parameters of the inverter and both resonant networks for simulation and experiment.
Parameters Value (Unit) Parameters Value (Unit)
Input voltage (Vin) 311 (Vdc) Leakage inductance (Llkg) 2 (uH)
Switching frequency (fsw) 400 (kHz) Equivalent resistor of plasma load (Rplasma) 2–9 (Ω)
Plasma current (iplasma) 20–35 (Arms) Compensation capacitance (Ccomp) 39.6 (nF)
(a) (b)
(c)
Figure 10. Feasibility test results of experimental waveform of each resonant network: (a) experimentalwaveform of the LCL network under the 9 Ω, 11.6 A conditions; (b) experimental waveform of theLCCL network under the 9 Ω, 11.6 A conditions; and (c) experimental waveform of the LCCL networkunder the 9 Ω, 6.6 A conditions.
The phase difference and soft-switching ability of the designed networks are verified through theseexperimental results. In the resonant inverter for using the plasma generator, the inverter loss is determinedwith the trade-off relationship between the conduction loss of the inverter current and the switching lossdue to the phase difference. Therefore, the LCCL resonant network could be better performing than theLCL network under the large resistance of the plasma load and small plasma current conditions.
5. Conclusions
In this paper, the applicability of the LCL network and LCCL network for a plasma generatorhave been investigated with consideration of the characteristics of the plasma load. In particular,the drop-out phenomenon, which is substantially different from the resistive load, is considered forthe design of an LCL network and an LCCL network. Considering the characteristics of the plasmaload, an LCL network and an LCCL network are designed and analyzed. Based on the analysis, asimulation was conducted in order to verify the validity of the designed networks. Furthermore, theexperiment was progressed while considering the laboratory power distribution level in order to verifythe applicability of the networks.
Author Contributions: Conceptualization, G.W.K. and W.-Y.S.; methodology, G.W.K.; software, G.W.K. andW.-Y.S.; validation, G.W.K.; formal analysis, G.W.K.; investigation, G.W.K.; resources, B.K.L.; data curation,G.W.K.; writing—original draft preparation, G.W.K. and B.K.L.; writing—review and editing, G.W.K. and B.K.L.;visualization, G.W.K. and W.-Y.S.; supervision, B.K.L.; project administration, B.K.L.; funding acquisition, B.K.L.
93

Energies 2019, 12, 3156
Funding: This work was supported by “Human Resources Program in Energy Technology” of the Korea Instituteof Energy Technology Evaluation and Planning (KETEP), granted financial resource from the Ministry of Trade,Industry & Energy, Korea. (No. 20184030202190); This work was supported by the Korea Institute of Energy.
Conflicts of Interest: The authors declare no conflict of interest.
References
1. Shimizu, K.; Kinoshita, K.; Yanagihara, K.; Rajanikanth, B.S.; Katsura, S.; Mizuno, A. Pulsed-Plasma Treatmentof Polluted Gas Using Wet-/Low-Temperature Corona Reactors. IEEE Trans. Ind. Appl. 1997, 33, 1373–1380.[CrossRef]
2. Kim, D.W.; You, S.J.; Kim, J.H.; Chang, H.Y.; Oh, W.Y. Computational Characterization of a New InductivelyCoupled Plasma Source for Application to Narrow Gap Plasma Processes. IEEE Trans. Plasma Sci. 2015, 43,3876–3882. [CrossRef]
3. Millner, A.R. Power Electronics Topologies for Plasma Generators. In Proceedings of the 2008 IEEEInternational Symposium on Industrial Electronics, Cambridge, UK, 30 June–2 July 2008; pp. 359–362.
4. Tran, K.; Millner, A. A New Power Supply to Ignite and Sustain Plasma in a Reactive Gas Generator.In Proceedings of the 2008 Twenty-Third Annual IEEE Applied Power Electronics Conference and Exposition,Austin, TX, USA, 24–28 February 2008; pp. 1885–1892.
5. Ahn, H.M.; Sung, W.-Y.; Lee, B.K. Analysis and Design of Resonant Inverter for Reactive Gas GeneratorConsidering Characteristics of Plasma Load. J. Electro. Eng. Technol. 2018, 13, 345–351.
6. Chabert, P.; Braithwaite, N. Impedance of the Plasma Alone. In Handbook of Semiconductor Wafer CleaningTechnology; Cambridge University Press: Cambridge, UK, 2011; pp. 233–235.
7. Lee, S.Y.; Gho, J.-S.; Kang, B.-H.; Cho, J.-S. Analysis of Pulse Power Converter for Plasma Application.In Proceedings of the 2008 IEEE International Symposium on Industrial Electronics, Cambridge, UK,30 June–2 July 2008; pp. 556–560.
8. Kuroki, T.; Mine, J.; Okubo, M.; Yamamoto, T.; Saeki, N. CF4 Decomposition Using Inductively CoupledPlasma: Effect of Power Frequency. IEEE Trans. Ind. Appl. 2005, 41, 215–220. [CrossRef]
9. Kuroki, T.; Mine, J.; Odahara, S.; Okubo, M.; Yamamoto, T.; Saeki, N. CF4 Decomposition of Flue Gasfrom Semiconductor Process Using Inductively Coupled Plasma. IEEE Trans. Ind. Appl. 2005, 41, 221–228.[CrossRef]
10. Rooms, S.D. A Plasma Torch Converter Based on the Partial Series Resonant Converter. In Proceedings ofthe AFRICON Conference, Windboek, South Africa, 26–28 September 2007; pp. 1–6.
11. Chen, G.; Sun, Q.; Hu, T.; Guo, Q. A Novel Digital Control Algorithm for a DC-DC Converter in PlasmaApplication. In Proceedings of the 2011 Asia-Pacific Power and Energy Engineering Conference, Wuhan,China, 25–28 March 2011.
12. Pacheco-Sotelo, J.O.; Barrientos, R.V.; Pacheco-Pacheco, M.; Flores, J.F.R.; García, M.A.D.; Benitez-Read, J.S.;Peña-Eguiluz, R.; López-Callejas, R. A Universal Resonant Converter for Equilibrium and NonequilibriumPlasma Discharges. IEEE Trans. Plasma Sic. 2004, 32, 2105–2112. [CrossRef]
13. Pacheco-Sotelo, J.; Peña-Eguiluz, R.; Eguiluz, L.P.; Ríos, A.S.; Sanchez, G.C. Plasma Torch Ignition by a HalfBridge Resonant Converter. IEEE Trans. Plasma Sic. 1999, 27, 1124–1130. [CrossRef]
14. Amjad, M.; Salam, Z.; Facta, M.; Mekhilef, S. Analysis and Implementation of Transformerless LCL ResonantPower Supply for Ozone Generation. IEEE Trans. Power Electron. 2013, 28, 650–660. [CrossRef]
15. Ahn, H.M.; Jang, E.S.; Ryu, S.; Lim, C.S.; Lee, B.K. Control Strategy for Power Conversion Systems in PlasmaGenerators with High Power Quality and Efficiency Considering Entire Load Conditions. Energies 2019, 12,1723. [CrossRef]
16. Borage, M.; Tiwari, S.; Kotaiah, S. Analysis and Design of an LCL-T Resonant Converter as a Constant-CurrentPower Supply. IEEE Trans. Ind. Electron. 2005, 52, 1547–1554. [CrossRef]
17. Graovac, D.; Purschel, M.; Kieo, A. MOSFET Power Losses Calculation Using the Data-Sheet Parameters; TechnicalReport for Infineon: Dresden, Germany, July 2006.
© 2019 by the authors. Licensee MDPI, Basel, Switzerland. This article is an open accessarticle distributed under the terms and conditions of the Creative Commons Attribution(CC BY) license (http://creativecommons.org/licenses/by/4.0/).
94

MDPISt. Alban-Anlage 66
4052 BaselSwitzerland
Tel. +41 61 683 77 34Fax +41 61 302 89 18
www.mdpi.com
Energies Editorial OfficeE-mail: [email protected]
www.mdpi.com/journal/energies


MDPI St. Alban-Anlage 66 4052 Basel Switzerland
Tel: +41 61 683 77 34 Fax: +41 61 302 89 18
www.mdpi.com ISBN 978-3-0365-0753-8