small business management mgmt5601 topic 9: financing the small firm … · small business...
TRANSCRIPT
©Mazzarol 2017 all rights reserved
Small Business Management MGMT5601
Topic 9: Financing the Small Firm (2) – Cash & ProfitProfessor Tim Mazzarol – UWA Business School
UWA Business School MBA Program [email protected] MGMT5601
©Mazzarol 2017 all rights reserved

©Mazzarol 2017 all rights reserved
• Know financial accounting terms.• Understand the importance of the
working capital cycle within the small firm.
• Understand and calculate the break-even point.
• Understand and apply the power of gross profit margin.
• Recognise the importance of pricing for profit.
• Review credit policy issues and relate these to cash flow management and profitability.
Learning outcomes
©Mazzarol 2015 all rights reserved
In this topic you should learn how to:

©Mazzarol 2017 all rights reserved
Confusion over accounting jargon in SMEs
• Questions asked by owner-managers:
– Why does a balance sheet have to balance?
– Is it good to have lots of assets?– Shouldn’t we minimize our
liabilities?– Equity – isn’t it about being equal?– Why do we call people to who we
owe a debt “Creditors”?– Why do we call people we give
credit to “Debtors”? – Why do you say “Profit and Loss”?
Surely it should be “Profit OR Loss”?
– Why is a car a FIXED asset when I can move it?
– Why are workers “Variable”?

©Mazzarol 2017 all rights reserved
The “Holy Trinity”
Balance Sheet
• Provides a cross-sectional snapshot of the firm’s net worth
• Assets – Liabilities = Owner’s Equity
Profit & Loss Statement
• Provides a picture of the firm’s past trading history
• Income – Expenses = Net Profit
Cash Flow Forecast
• Provides a forward estimate of the firm’s expected sales income & expenditures
• Debtors – Creditors = Net Income

©Mazzarol 2017 all rights reserved
Balance Sheet
Liabilities Equity Assets
• Comparing balance sheets over time shows the overall performance of the business.
• Balance sheet analysis allows the small business owner to make decisions about the overall strength of their firm.
• The Balance sheet shows the amount of cash and liquid assets available at that time and accounts receivable for future cash flow and working capital.
• Shows longer term assets that provide a foundation for future growth.
• Also shows the debt the firm has to pay within the financial year along with any longer term debt.
Is a “snapshot” in time of the firm’s value
Money owed to others
Net Worth
Cash,Receivables,
Stock,Equipment &
Property
Source: Shultz (2006)

©Mazzarol 2017 all rights reserved
Balance Sheet - Assets
ASSETS:• Current Assets (Cash & Cash Equivalents)
– Assets that are reasonably expected to be consumed sold for cash, or transformed into cash within the normal operating cycle (i.e. the financial year).
– Identifies the firm’s working capital (liquidity).
– Inventory should be as low as possible.• Non-Current Assets
– Durable assets used in the operation of the business.
• Accumulated Depreciation– The aggregate of charges against
earnings to write off the cost of an asset over its estimated useful life.
• Other Assets– May consist of intangible such as patents,
prepaid expenses, surrender value of life insurance.
Current Assets Current Liabilities
Cash $260,000 Accounts payable $350,000
Accounts receivable $580,000 Accrued expenses $190,000
Inventory $10,000 Income tax payable $10,000
Prepaid Expenses $120,000 Short term notes $50,000
Total Current Assets $970,000 Total Current Liabilities
$600,000
Non-Current Assets Non-CurrentLiabilities
Equipment, Furniture $50,000 Mortgages $100,000
Less: Depreciation ($20,000) Shareholders Equity & Retained Earnings
$300,000
$30,000
Total Assets $1,000,000 Total Liabilities & Equity
$1,000,000
Sources: Tarantino (2001) Shultz (2006)

©Mazzarol 2017 all rights reserved
Balance Sheet - Liabilities
Current Assets Current Liabilities
Cash $260,000 Accounts payable $350,000
Accounts receivable $580,000 Accrued expenses $190,000
Inventory $10,000 Income tax payable $10,000
Prepaid Expenses $120,000 Overdraft $50,000
Total Current Assets $970,000 Total Current Liabilities
$600,000
Non-Current Assets Non-Current Liabilities
Equipment, Furniture $50,000 Mortgages $100,000
Less: Depreciation ($20,000) Shareholders Equity & Retained Earnings
$300,000
$30,000
Total Assets $1,000,000 Total Liabilities & Equity
$1,000,000
LIABILITIES:• Current Liabilities
– Obligations that must be paid from current assets during the normal operating cycle. Usually includes monies to be paid to creditors, expenses accrued from past period, accumulated tax liabilities (e.g. GST) and short term credit.
• Non-Current Liabilities– Obligations such as mortgages that do not
have to be paid in the normal operating cycle.– Might also include director’s loans
• Shareholder Equity & Retained Earnings– Shareholder equity can include common and
preferential stock.– Retained Earnings is profits from past trading
periods not distributed to shareholders.• Total Liabilities and Equity
– Together these two items should equal total assets.
Sources: Tarantino (2001) Shultz (2006)

©Mazzarol 2017 all rights reserved
Graphic display of the Balance Sheet
Current Assets, $900,000
Fixed Assets (less depreciation), $100,000
Current Liabilities, $600,000
Mortgages, $50,000
Equity & Retained Profits, $350,000
Assets Liabilities

©Mazzarol 2017 all rights reserved
Dynamic Balance Sheet
©Mazzarol 2017 all rights reserved
Assets = Funding Need Liabilities = Funding Available
FIXED
Net Fixed Assets:Property, Plant & EquipmentLess Depreciation
Net Fixed Assets
$50,000-$20,000
$30,000
Net Equity:Share Capital & Retained ProfitsDirector’s Loans (provided by owner)Intangibles (e.g. patents, goodwill at purchase)
$300,000
VARIABLE
Net Working Assets:InventoryAccounts Receivable (Debtors)Prepaid ExpenseLess Current liabilities:Accounts Payable (Creditors)Accrued ExpensesIncome Tax PayableShort Term Notes
Net Working Assets
$10,000$580,000$120,000
-$350,000-$190,000-$10,000-$50,000
$110,000
Borrowings:Creditor Strain (Accounts Payable Overdue)Mortgages
Less Cash
Net Borrowings
$100,000
-$260,000
-$160,000
Assets = Funding Need $140,000 Liabilities = Funding Available $140,000
Shows total asset or funding needed against funding available within the business. Any short fall between assets and liabilities is usually filled by creditor strain and/or director’s loans.

©Mazzarol 2017 all rights reserved
Profit and Loss Statement
©Mazzarol 2017 all rights reserved
Sales Revenue
Cost of Goods Sold
Gross Profit
Overhead Costs
Net Profit (EBIT)
Shows the firm’s performance over a given time period including sales revenues, both variable and fixed costs and the amount of profit generated.The P&L statement breaks down the income and expenses by major categories and can be valuable to show how profitable a business is. Regular monitoring of the P&L on a monthly or quarterly basis allows corrective action to be taken.
Sources: Tarantino (2001) Shultz (2006)
Money paid to the firm by customers.
Variable Costs e.g.
direct labourand materials.
Profit from sale of goods or services
before allocation of
overhead costs.
Fixed costs e.g. salaries, rent & admin
expenses.
The “bottom line” –
Earnings Before
Interest & Tax

©Mazzarol 2017 all rights reserved
Profit and Loss Statement – key elements
Profit & Loss StatementRevenue $1,500,000
Less: Operating Expenses (COGS)
$500,000
Gross Profit $1,000,000
Less Overhead Costs:
Administration & Salaries $500,000
Depreciation $20,000
Earnings Before Interest & Tax $480,000
Interest charges $20,000
Income Tax Payable $110,000
Net Income $350,000
Sources: Tarantino (2001) Shultz (2006)
The P&L Statement shows the performance of the business over a given time period
Gross profit margin = (Gross Profit x 100) ÷ SalesGross profit margin = 66.7%
Converting to % of sales provides ability to compare trends:
Overheads = 33.3%
EBIT = 32%
Net Profit Margin = 23.3%
©Mazzarol 2017 all rights reserved
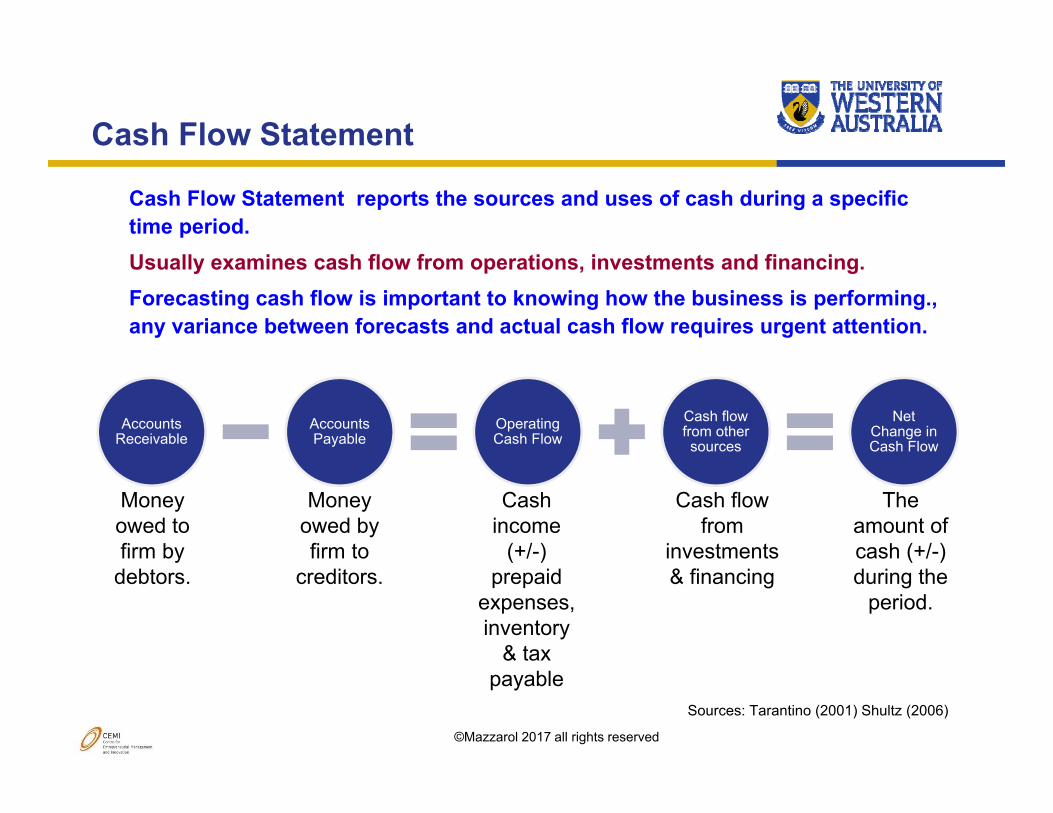
Cash Flow Statement
Accounts Receivable
Accounts Payable
Operating Cash Flow
Cash flow from other sources
Net Change in Cash Flow
Cash Flow Statement reports the sources and uses of cash during a specific time period. Usually examines cash flow from operations, investments and financing.Forecasting cash flow is important to knowing how the business is performing., any variance between forecasts and actual cash flow requires urgent attention.
Sources: Tarantino (2001) Shultz (2006)
Money owed to firm by
debtors.
Money owed by firm to
creditors.
Cash income
(+/-) prepaid
expenses, inventory
& tax payable
Cash flow from
investments & financing
The amount of cash (+/-) during the
period.
©Mazzarol 2017 all rights reserved
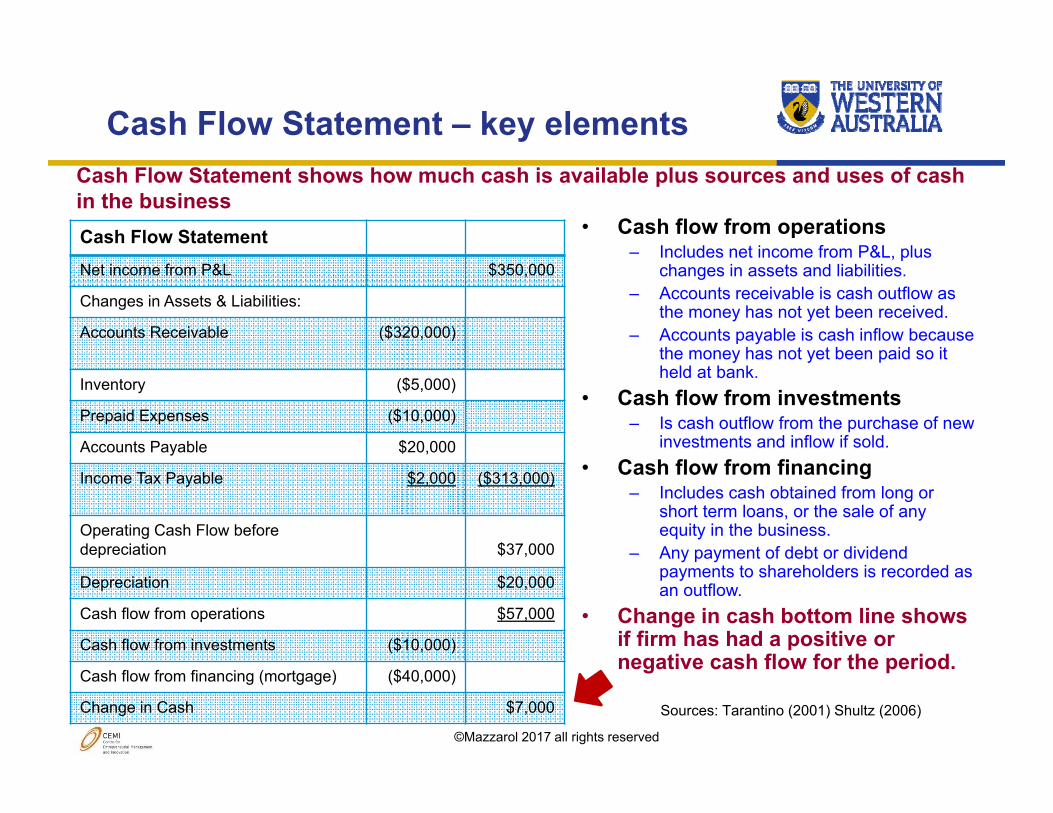
Cash Flow Statement – key elements
©Mazzarol 2017 all rights reserved
• Cash flow from operations– Includes net income from P&L, plus
changes in assets and liabilities.– Accounts receivable is cash outflow as
the money has not yet been received.– Accounts payable is cash inflow because
the money has not yet been paid so it held at bank.
• Cash flow from investments– Is cash outflow from the purchase of new
investments and inflow if sold.• Cash flow from financing
– Includes cash obtained from long or short term loans, or the sale of any equity in the business.
– Any payment of debt or dividend payments to shareholders is recorded as an outflow.
• Change in cash bottom line shows if firm has had a positive or negative cash flow for the period.
Cash Flow StatementNet income from P&L $350,000
Changes in Assets & Liabilities:
Accounts Receivable ($320,000)
Inventory ($5,000)
Prepaid Expenses ($10,000)
Accounts Payable $20,000
Income Tax Payable $2,000 ($313,000)
Operating Cash Flow before depreciation $37,000
Depreciation $20,000
Cash flow from operations $57,000
Cash flow from investments ($10,000)
Cash flow from financing (mortgage) ($40,000)
Change in Cash $7,000 Sources: Tarantino (2001) Shultz (2006)
Cash Flow Statement shows how much cash is available plus sources and uses of cash in the business

©Mazzarol 2017 all rights reserved
Cash flow forecasting
©Mazzarol 2017 all rights reserved

©Mazzarol 2017 all rights reserved
The Working Capital Cycle
©Mazzarol 2017 all rights reserved
CASHsalesreceipts
suppliers rawmaterials
work in
progressfinishedgoods
salescustomers
(tradedebtors)
(trade creditors)
costs
purchasesproduction
sellingand
distributioncosts
Source: Snaith and Walker, 1999

©Mazzarol 2017 all rights reserved
The Financial Operating Cycle
©Mazzarol 2017 all rights reserved
Source: Sgambelluri (2010)
Working capital is essential to the operation of the business.
Assets in the balance sheet are used to create sales and are funded by liabilities and “net worth” (e.g. owners equity and retained profits.
The P&L statement shows sales revenues, less cost of goods sold (COGS) and overhead costs resulting in a net profit or loss.
Any profits can then be distributed by the owner in one of three ways:
1. To purchase more assets2. To repay debt3. To pay dividends to the owner

©Mazzarol 2017 all rights reserved
Improving the small business cash flow

©Mazzarol 2017 all rights reserved
Improving small business cash flow
©Mazzarol 2017 all rights reserved
Tips for improving cash flow:
1. Get the payment upfront – 50% if possible.
2. Invoice same day you deliver the service or the product.
3. Collect payment on time – chase payment as soon as it is due.
4. Take advantage of credit or payment terms from suppliers.
5. Keep you overheads flexible –outsource tasks.
6. Manage inventory – don’t keep too much stock.
7. Don’t be dependent on one or two suppliers.

©Mazzarol 2017 all rights reserved
Cash and Working Capital Measures
• Cash Flow Forecast• Stock as % of Sales• Debtors as % of Sales• Creditors as % of Sales• Creditor Strain as % of
Sales– Creditor Strain = unauthorized
extra credit taken from suppliers
• True Working Assets as % of Sales(Stock + Debtors – Creditors +
Creditor Strain)
©Mazzarol 2017 all rights reserved
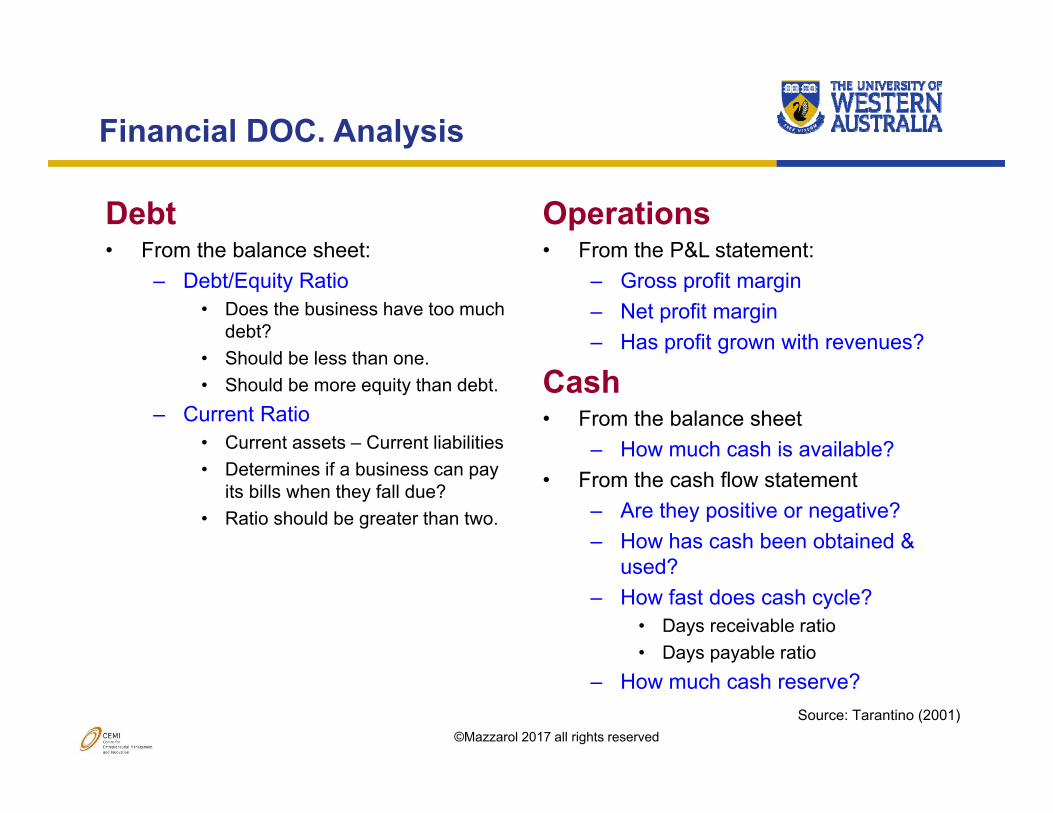
Financial DOC. Analysis
Debt• From the balance sheet:
– Debt/Equity Ratio• Does the business have too much
debt?• Should be less than one.• Should be more equity than debt.
– Current Ratio• Current assets – Current liabilities• Determines if a business can pay
its bills when they fall due?• Ratio should be greater than two.
Operations• From the P&L statement:
– Gross profit margin– Net profit margin– Has profit grown with revenues?
Cash• From the balance sheet
– How much cash is available?• From the cash flow statement
– Are they positive or negative?– How has cash been obtained &
used?– How fast does cash cycle?
• Days receivable ratio• Days payable ratio
– How much cash reserve?Source: Tarantino (2001)
©Mazzarol 2017 all rights reserved
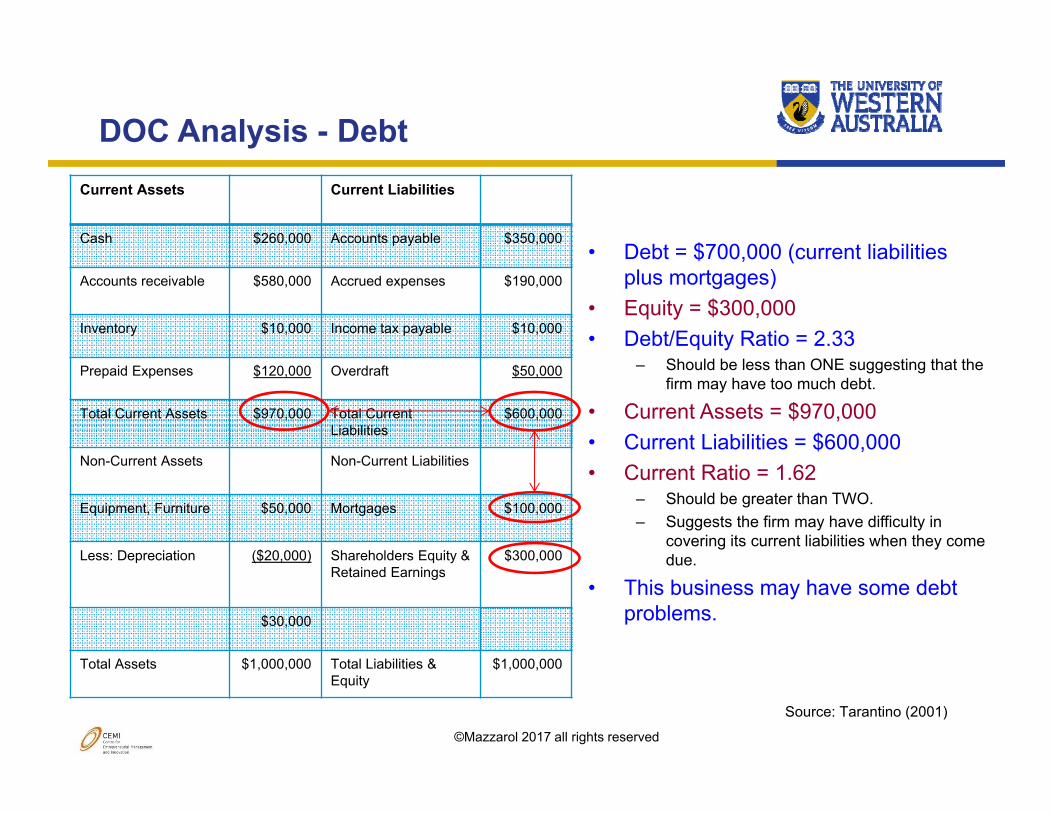
DOC Analysis - DebtCurrent Assets Current Liabilities
Cash $260,000 Accounts payable $350,000
Accounts receivable $580,000 Accrued expenses $190,000
Inventory $10,000 Income tax payable $10,000
Prepaid Expenses $120,000 Overdraft $50,000
Total Current Assets $970,000 Total Current Liabilities
$600,000
Non-Current Assets Non-Current Liabilities
Equipment, Furniture $50,000 Mortgages $100,000
Less: Depreciation ($20,000) Shareholders Equity & Retained Earnings
$300,000
$30,000
Total Assets $1,000,000 Total Liabilities & Equity
$1,000,000
• Debt = $700,000 (current liabilities plus mortgages)
• Equity = $300,000 • Debt/Equity Ratio = 2.33
– Should be less than ONE suggesting that the firm may have too much debt.
• Current Assets = $970,000• Current Liabilities = $600,000• Current Ratio = 1.62
– Should be greater than TWO.– Suggests the firm may have difficulty in
covering its current liabilities when they come due.
• This business may have some debt problems.
Source: Tarantino (2001)

©Mazzarol 2017 all rights reserved
DOC Analysis - Operations
©Mazzarol 2017 all rights reserved
• The business has a positive net income of $350,000 for this period with gross margin of 66.7%.
• However, only a comparison with past years will tell if the firm is trending in the right direction.
• At least three consecutive years of financial statements should be examined to see just how well the business has been trading.
Profit & Loss StatementRevenue $1,500,000
Less: Operating Expenses (COGS)
$500,000
Gross Profit $1,000,000
Less Overhead Costs:
Administration & Salaries $500,000
Depreciation $20,000
Earnings Before Interest & Tax $480,000
Interest charges $20,000
Income Tax Payable $110,000
Net Income $350,000
Source: Tarantino (2001)

©Mazzarol 2017 all rights reserved
DOC Analysis - Cash
©Mazzarol 2017 all rights reservedSource: OECD (2006)
• Business has $260,000 in cash. • Cash Flow Statement shows a positive
cash inflow of $7,000.– But how long to bring new cash in?
• Debtor Collection Period– (365 days x Accounts Receivable) ÷ Sales– (365 x $580,000) ÷ $1,500,000 = 141 days
• It takes around 3.5 months for this business to collect its accounts receivable from debtors.
• This could be too long if working capital is not sufficient.
• Cash reserve should equal 3-4 months– Yearly expenses (COGS + Overheads) ÷ 12
months– $1,000,000 ÷ 12 = $83,333 per month– $83,333 x 3.5 = $291,665 cash required
• Firm lacks sufficient cash reserve.
Current Assets Current Liabilities
Cash $260,000 Accounts payable $350,000
Accounts receivable $580,000 Accrued expenses $190,000
Inventory $10,000 Income tax payable $10,000
Prepaid Expenses $120,000 Overdraft $50,000
Total Current Assets $970,000 Total Current Liabilities
$600,000
Non-Current Assets Non-CurrentLiabilities
Equipment, Furniture $50,000 Mortgages $100,000
Less: Depreciation ($20,000) Shareholders Equity & Retained Earnings
$300,000
$30,000
Total Assets $1,000,000 Total Liabilities & Equity
$1,000,000
Source: Tarantino (2001)

©Mazzarol 2017 all rights reserved
Radar Chart for Financial KPIs
©Mazzarol 2017 all rights reserved
0%
10%
20%
30%
40%
50%
60%
70%Gross Contribution
Net Contribution
Break-even Gap
StockDebtors
Creditors
Net Working Assets
Radar Chart
Year 2 Year 1
Gross margin unchanged
Net margin fallen by 10%
Break Even gap risen by 17%
Stock turnover fallen by 3%
Debtors risen by 6%• Debtor collection >120 days
Creditors fallen by 6%• Creditor payment >60 days
Net Working Assets risen by 10%

©Mazzarol 2017 all rights reserved
Financial control
©Mazzarol 2017 all rights reserved
• Are cash flows being monitored?
• What key financial measures are used?
• Are such measures relevant for this business?
• Do all decision makers understand them?
• Are they used for decision making?
• Is the owner-manager in control?

©Mazzarol 2017 all rights reserved
Gross Profit Margin
©Mazzarol 2017 all rights reserved
• Gross Profit Margin:– The gap between sales and variable costs– The “real income” of the business
Example:Sales $100Direct material cost $40Labour cost $20Delivery cost $ 5 Total $ 65Gross Profit $ 35
• Gross Margin %:– Gross Margin/Sales = Gross Margin %
35 / 100 = 35%

©Mazzarol 2017 all rights reserved
Power of Gross Profit Margin
©Mazzarol 2017 all rights reserved
Sales $ Gross Margin % Gross Margin $
1,000 10%
250 40%
333 30%
500 20%
800 12.5%

©Mazzarol 2017 all rights reserved
Power of Gross Profit Margin
©Mazzarol 2017 all rights reserved
Sales $ Gross Margin % Gross Margin $
1,000 10% 100
250 40% 100
333 30% 100
500 20% 100
800 12.5% 100

©Mazzarol 2017 all rights reserved
Power of Gross Profit Margin
©Mazzarol 2017 all rights reserved
Gross Margin $ Gross Margin % Sales $
100 5%
100 10%
100 20%
100 25%
100 30%
100 40%
100 50%

©Mazzarol 2017 all rights reserved
Power of Gross Profit Margin
©Mazzarol 2017 all rights reserved
Gross Margin $ Gross Margin % Sales $
100 5% 2,000
100 10% 1,000
100 20% 500
100 25% 400
100 30% 333
100 40% 250
100 50% 200

©Mazzarol 2017 all rights reserved
How Gross Profit Margin Impacts Pricing
©Mazzarol 2017 all rights reserved
Chart-A Existing % Gross Margin
5 10 15 20 25 30 35 40 50
% price reduction % volume increase for same gross profit
2.0 67 25 15 11 9 7 6 5 4
3.0 150 43 25 18 14 11 9 8 6
4.0 400 67 36 25 19 15 13 11 9
5.0 100 50 33 25 20 17 14 11
7.5 300 100 60 43 33 27 23 18
10.0 200 100 67 50 40 33 25
15.0 300 150 100 75 60 43
A higher Gross Margin allows more flexibility in pricing strategy

©Mazzarol 2017 all rights reserved
Profitability
©Mazzarol 2017 all rights reserved
• Sales• Gross Profit %• Expenses/Fixed Costs• Breakeven sales• Net profit before tax as %
of sales• Retained profit as % of
sales

©Mazzarol 2017 all rights reserved
Break-Even Point
©Mazzarol 2017 all rights reserved
• The break-even point is the stage where a company’s sales is equal to its cost of production. By definition, the company will lose money if sales are less than this amount, and make a profit if sales are greater than this amount.

©Mazzarol 2017 all rights reserved
Break-Even Graph
©Mazzarol 2017 all rights reservedMonths
Sales Sales$216,000
Profit
$80,000Loss
$70,000
Breakeven Line
The higher a business operates abovethe Breakeven Line the greater its ‘Margin of Safety’

©Mazzarol 2017 all rights reserved
Calculating Break-Even
©Mazzarol 2017 all rights reserved
FIXED COST
GROSS MARGIN %= BREAK EVEN
POINT
Example:
1) Fixed Costs $ 3,0002) Gross Margin 30%3) Break Even $10,000
Sales $ 7,000 @ 30% = $2,100 = Gross MarginLess B/Even $10,000 @ 30% = $3,000 = Fixed costsShort fall ($ 3,000) = ($ 900)

©Mazzarol 2017 all rights reserved
Calculating Break-Even
©Mazzarol 2017 all rights reserved
FIXED COST
GROSS MARGIN %= BREAK EVEN
POINT
Example:
1) Fixed Costs $ 3,0002) Gross Margin 30%3) Break Even $10,000
Sales $ 15,000 @ 30% = $4,500 = Gross MarginLess B/Even $ 10,000 @ 30% = $3,000 = Fixed costsExcess over B/E $ 5,000 = $1,500
$1,500 profit is made on sales of $5,000 over B/Even

©Mazzarol 2017 all rights reserved
Ways to Reduce Break-Even
©Mazzarol 2017 all rights reserved
• Break Even Point can be reduced by:– Cutting fixed costs– Improving gross margin percentage
Example:
1) Fixed Costs reduced by $600 to $2,4002) Gross Margin increased to 40%3) Break Even falls to $6,000
Sales $ 7,000 @ 40% = $2,800 = Gross MarginLess B/Even $ 6,000 @ 40% = $2,400 = Fixed costsExcess over B/E $ 1,000 = $ 400
$400 profit is made on sales of $1,000 over B/Even

©Mazzarol 2017 all rights reserved
Break-Even Example
©Mazzarol 2017 all rights reserved
Annual Forecast1. Sales $216,000
2. Opening stock $76,000
3. Plus purchases $120,000
4. Less closing stock $100,000
5. Goods or materials used (2 + 3 – 4) $96,000
6. Wages or Salaries $64,000
7. Fixed Costs $20,720Projected Profits
1. Sales $216,000
5. Goods or materials used (2 + 3 – 4) $96,000
6. Wages or salaries $64,000
8. Less variable costs ( 5 + 6) $160,000
9. Gross Profit (profit before fixed costs 1 – 8) $56,000
7. Less Fixed Costs $20,720
10. Net Profit (profit after fixed costs 9 – 7) $35,280
• Gross Profit Margin:– (Gross profit x 100) ÷ Sales– ($56,000 x 100) ÷ $216,000 = 25.9%
• If gross profit is reached and fixed costs don’t change break-even is calculated:
– (Fixed Costs x 100) ÷ Gross Profit Margin
– ($20,720 x 100) ÷ 25.9% = $80,000– B/Even turnover required $80,000– OR– $80,000 turnover at 25.9% profit
margin = $20,270 (enough to cover fixed costs)
• Break-Even required per month:– $80,000 ÷ 12 months = $6,666 per
month

©Mazzarol 2017 all rights reserved
Four Types of Manager
©Mazzarol 2017 all rights reserved
S
B
SB
S
B
SB
The Busy Fool
Break-Even rises along with sales wiping out profits.
The Excellent Manager
Break-Even falls as sales rise leading to increasing profits.
The Good Manager
Break-Even falls as Sales fall maintaining profits.
The Bad Manager
Break-Even rises as sales fall eroding profits.

©Mazzarol 2017 all rights reserved
Principles of Financial Control
©Mazzarol 2017 all rights reserved
• Measure break even regularly• Focus on getting break even down relative to
sales and keep it below sales• Reduce break even relative to sales by
improving gross margin or reducing fixed costs
• Improve gross margin by:– Raising prices– Reducing variable costs– Better mix of sales with higher
contribution per product• Avoid trying to increase sales by reducing
prices as this usually increases break even more quickly (Busy Fool)

©Mazzarol 2017 all rights reserved
Case study: Kitsol Pty Ltd
©Mazzarol 2017 all rights reserved
• Assess the financial performance of KITSOL so far, examine its break even, gross profit and working capital requirements. What type of managers have the owners been?
• Prepare a dynamic balance sheet and a radar chart for KITSOL.
• Calculate the funding requirement for KITSOL and determine if the owners can afford to fund a future planned growth strategy.

End of Presentation