sloshing load and response in lng carriers for new designs
TRANSCRIPT

© Gastech 2005
Sloshing load and response in LNG carriers for new designs, new operations and new trades
Wouter Pastoor, Tom Klungseth Østvold, Eirik Byklum, Sverre Valsgård
Det Norske Veritas AS Norway

© Gastech 2005 Pastoor 2
Sloshing load and response in LNG carriers for new designs, new operations and new trades
Wouter Pastoor, Tom Klungseth Østvold,
Eirik Byklum, Sverre Valsgård Det Norske Veritas
ABSTRACT Innovation of LNG carriers is developing in a rapid pace to prepare the industry for desired and demanded changes: LNG terminals and floating production platforms are being built offshore, but with the implication of more severe environmental conditions when loading or discharging. Larger LNG carriers are designed up to sizes of 260.000m3 to cut operational costs. Furthermore an increasing interest for spot market trading is evolving, which demands a greater flexibility of cargo tank fillings. Finally with new trades crossing the North Atlantic, the environmental conditions encountered by LNG carriers, are significantly more severe then on currently operated routes. For all these changes the sloshing of LNG in membrane cargo tanks is one of the issues, which needs to be addressed. The safe development of new carriers and safe introduction of new operational patterns is a prime concern for Class Societies and requires the development of new competence, knowledge and tools in order to assist the industry to manage the associated risks of the anticipated changes. Currently, DNV is actively supporting the LNG shipping industry with dedicated research and development work on LNG sloshing, some of which is presented in this paper. With in-house sloshing model experiments the effects of partially filling, sea state severity and other aspects are being studied. Both numerical and experimental structural studies are conducted to assess the structural strength of the various cargo containment systems as well as the supporting hull structure. This key competence on the LNG sloshing load and response problem is used to develop rules and guidelines for the industry for safe design and assessment of LNG ships. An important next step is proposed to this R&D program comprising a full scale sloshing measurement campaign onboard an LNG carrier. The main objective is to provide the necessary verification of a sloshing load and response guideline in order to be able to assess the absolute strength of cargo containment and hull structure.
© Gastech 2005 Pastoor 3
1 INTRODUCTION The need for sea-borne LNG transportation is increasing rapidly, leading to a doubling of the fleet in just one decade. For the shipbuilding, shipping and gas industry these are busy but exciting times especially since new carrier designs and vessel operations are being introduced. New trades are evolving in arctic waters, larger carriers are built, alternative propulsion systems installed and vessels are likely to operate with partially filled tanks. A review of these developments and the technical challenges associated with these are presented and discussed in the first paragraph. All these changes affect DNV Classification, its products, services and without doubt the responsibility DNV Classification has for safety. Competence development in order to adapt the Classification services and technical assistance is vital to provide the required quality for the customer for safe and economical design and operation of LNG carriers. An overview of the LNG R&D activities at DNV is given in the second paragraph with a specific focus on the sloshing phenomenon, which is treated in more detail.
1.1 LNG shipping developments and associated technical challenges A summary is given of a number of developments, which are going on in the LNG shipping market, with a focus on those having associated technical challenges or other direct links to the work of Classification Societies. A more thorough discussion on the current developments can be found in [1], including a discussion on the principle issues affecting current thinking in LNG shipping and the steps the industry is taking to safeguard the future of LNG shipping. Large LNG carriers In order to cut transportation costs there is a market push towards building LNG carriers of 200.000m3 to 260.000m3 capacity. This implies a significant size increase of today’s maximum vessel size. A number of technical challenges have to be dealt with properly in the design process in order to build and operate these vessel successfully in financial, safety and environmental terms. The size of new increased size carriers will for a 260.000m3 vessel be comparable to VLCCs which may imply draft limitations and an increased beam (up towards 60 m). This means the development of new, wider, shallow draught hull forms that will necessitate some rethinking as regards to, • Aft body design, • Flow around the propeller(s) – wake field distribution, • Propulsion efficiency and • Manoeuvring capabilities With a draft restriction the required propeller diameters cannot be arranged and a twin-screw arrangement is necessary. In addition a twin-screw arrangement improves manoeuvring capabilities and safe handling of the vessels in confined waters. Possibly these vessels will also be equipped with a combination of bow thrusters and stern thrusters. Larger vessels imply different ship motions compared to today’s maximum sized carriers. Combined with the fact that these ships have different tank dimensions the sloshing of the cargo needs to be assessed. From a point of view of building costs a minimum number of tanks is desired, however an increasing tank length implies increasing sloshing loads. Hence an optimum ship design needs to be developed balancing the number of tanks with acceptable sloshing loads. Offshore loading and discharging Furthermore a clear trend is seen towards loading and discharging of gas at offshore terminals, in particular in the US after the 9-11 event in a bid to reduce risk exposure and to minimise environmental impact. Due to the focus on terrorist threats it is becoming difficult to get permission to build new land based LNG receiving terminals in the US. The option is then to construct offshore discharge terminals where off-loading can take place far from densely populated areas and busy ports and estuaries posing a reduced risk to the environment and the people at large. The gas can be either discharged as liquid LNG/LPG into a floating receiving barge or fixed terminal or as gas from a regasification plant onboard the gas carrier via an offshore buoy or platform system to shore ready for distribution into the onshore gas grid. From a ship point of view this will require:

© Gastech 2005 Pastoor 4
• reliable ship to ship LNG transfer systems or • on-board re-gasification before discharge as well as • tank systems capable of operating with all tank fillings. Floating installations, (FSRU – Floating Storage and Regasification Units) as well as floating production units (FLPSU –Floating LNG Production and Storage units), is an upcoming market that will depend on finding acceptable solutions for being able to operate without tank filling restrictions. From an LNG shipping perspective, the re-gasification alternative offers distinct possibilities that can be managed within the scope of, or as an extension to, traditional LNG shipping operations. To serve a certain trade three or more vessels will be necessary depending on transport distance. To avoid ”hiccups” in the discharge pressure two buoys might be needed and placed at the discharge location in order to provide for overlap in gas delivery between the outbound and the inbound carrier if necessary. The Energy Bridge (Excelerate Energy) is an example of this option with Exmar providing the ships, see [2]. Another option is presented by HoeghLNG, see [3]. As such vessels will be moored on-site for some 5 to 7 days while offloading the risk for sloshing in partially filled tanks becomes important. For the Exmar vessels the whole tank containment is built with reinforced NO96 boxes, which is normally applied only for the upper chamfer and tank roof. In order to run a continuous offshore discharge operation with a minimum of downtime, offloading carriers should be capable of operating without tank filling restrictions. Alternatively, they need to be restricted to operation in benign waters and/or operated according to carefully planned cargo handling and discharge procedures in order to reduce the risk of sloshing damages inside the cargo tanks. Short-term contracts and spot-trading While the LNG shipping market has been a market characterised by long-term contracts, more short-term contracts and spot-market trading is foreseen. This is supported by the fact that operators have been ordering ships without having a future trading contract. Furthermore so-called milk-runs are expected, although the number of these is expected to be small. On a milk-run a carrier delivers part of its cargo at different terminals in one voyage. Both developments preferably demand lower filling restrictions of the cargo tanks in order to provide as much flexibility for the operators as possible. Alternative propulsion and machinery Several options exist to replace the traditional steam turbine. Steam turbines are the proven technology option offering high reliability and an easy way of disposing of boil-off gas by using it for fuel. The disadvantage is a low overall energy efficiency, comparatively old designs with no recent developments and a foreseen shortage of experienced engineers. The alternatives are: • Slow speed diesel with re-liquefaction, • Slow speed dual fuel diesel engine, • Medium speed dual fuel engines, geared, • Medium speed diesel electric configuration with gas engines (dual fuel or pure gas plus pure diesel), • Gas turbines with direct propulsion, electric propulsion or electric propulsion combined cycle. In case of re-liquefaction, the operator has the possibility to discharge the entire tank and sail in ballast on the return-trip with tanks at ambient temperatures. Hence the cargo capacity is utilised at maximum. However the number of cooling cycles will be larger than the tank system has been approved for so far. More likely is to sail with a small cargo amount on the ballast return trip and start cooling down when approaching the gas terminal to minimise the loading time at the terminal. More details on the various propulsion options can be found in references [4] and [5] including the various pros and cons. The installation of a slow-speed diesel engine in a LNG carrier introduces a considerable source for vibrations in addition to the propeller. The consequences of this “new” excitation source for the ship structure, the containment system and pump tower have been evaluated by detailed vibration analysis conducted by DNV in close cooperation with industry partners. Slow-speed diesel engines seem to be a feasible option for LNG carriers and are not likely to give larger vibrations than induced by the propeller, but one needs to design the installation properly in combination with detailed local vibration analyses. More details can be found in reference [17].

© Gastech 2005 Pastoor 5
New containment system developments New containment system designs and tank designs are under development. The well-known Moss design is being further developed to enlarge the capacity by stretching the tank in vertical direction. Furthermore the tank foundation deck at the hopper is lowered in order to be charged with a lower Suez-canal fee. Korean Gas (KOGAS) is working on the development of a new containment system, see [7]. OceanLNG has developed a new containment system, see [8]. This tank design is a type B independent tank with a cylindrical shape with dished ends and internal stiffening. In comparison with the Moss design the authors claim to have 30% more cargo capacity. ConocoPhillips has been working on a new tank design, see [9]. A conventional shape has been adopted but the upper chamfers have been stretched higher up giving a reduced tank roof area. DNV will conduct an evaluation of this design with the objective to issue an Approval in Principle for early 2005. Standard GTT containment systems are still applied in this new tank cross sectional design. It is believed this new design reduces the risk of sloshing problems while increasing the tank volume. A disadvantage is the large static head on the bottom and a larger pump tower. Increasing fleet size The gas energy market is in an upswing and will in the future provide an increasing part of the world energy supply and demand. Consequently, the number of LNG carriers is increasing rapidly and will increase further over the next 8 to 10 years. ExxonMobil and ConocoPhillips are cooperating with QatarPetroleum on the RasGas, QatarGas II and QatarGas III projects. The expected total number of newbuildings for these projects is estimated over a 100 vessels. This order bonanza demands a proper planning of all the required competencies for yards, suppliers as well as Class Societies. Trading routes shifting to more severe environments While most of past and current trading routes are in benign waters more trades are evolving in severe environments. An example is the shipment of gas from the Northern Norway gas field Snøhvit to the east coast of the USA. The operation in arctic waters with low temperatures and icebergs demands a careful design of ship, equipment and operations. Other examples are the Sakhalin field and possibly the future production at the Shtokman field. Shifting to more severe wave environments has a great effect on the accumulation of structural fatigue damage. On average, fatigue damage is accumulated twice as rapid for continuous trading on the North-Atlantic than for a world wide operation. With a desire for increased lifespans of LNG carriers and more trading in severe wave environments sufficient fatigue capacity is of paramount importance. More details on fatigue assessments of LNG carriers are described in reference [7]. Maintenance, inspections and CAP With the development of more spot trading and older vessels remaining in operation it becomes more important for charterers to be able to demonstrate that they have taken special care when chartering older vessels. Port State Control and vetting surveys could become more stringent and secondly LNGC specific CAP are introduced by certain Class Societies, [10]. Changing environmental and political factors As previously mentioned a trend is seen to build LNG terminals offshore to minimise risk exposure. Here the public perception is an important factor. A LNG terminal is considered to pose a high risk for potential accidents although unfounded by the track record of the industry todate. Secondly a terminal is seen as a clear target for terrorist attacks and the consequences of such an attack can vary and need therefore proper risk assessments in order to quantify these by well founded research, see for example [11].
1.2 R&D developments at DNV for LNG carriers Many of the current developments in the LNG shipping industry affect ship classification. R&D is a key element to develop the required competence to adapt classification rules and guidances for new ship designs and operations. Consequently DNV applies a significant amount of resources to R&D and has defined a specific R&D portfolio for LNG carriers. From the discussion in the previous paragraph it is clear that key subjects for a class society are: • LNG sloshing • Alternative propulsion arrangements

© Gastech 2005 Pastoor 6
• Vibrations • Hull fatigue DNV is conducting R&D work on these issues. Furthermore, the large number of vessels that are being built and will be built in the future provide a continuous high demand of technical support and follow-up work to shipyards. Consequently, two Class Notes are under development and are expected to be issued in the first part of 2005. One is focussing on the hull and tank structural design of membrane tankers, excluding the containment system. The second Class Note is focussed on spherical tankers. Industry cooperations complement the pure internal R&D work. Joint Industry Projects with yards and shipowners are important for a Class Society to improve the sharing of knowledge and competence and to enhance future cooperation. The main attention in the LNG R&D portfolio has been paid to the first item in the list: LNG sloshing. This R&D work is divided into four projects: • Sloshing loads • Sloshing structural response and strength • Sloshing guideline • Full-scale sloshing measurements onboard a LNG carrier
Prime activities within these projects and the structure in which these projects are linked is depicted in Figure 1. The first two projects are mainly focussing on competence development in order to support DNV classification. Secondly, all the knowledge and competence gained are used to develop a load and structural strength assessment scheme. This forms the basis for a dedicated Class Note on sloshing in membrane LNG tanks due to be issued in 2005. Sloshing is a highly complex problem and despite the huge R&D efforts some aspects or phenomena are still under discussion or difficult to grasp in a practical guideline. Based on this and as a response to market request a sloshing load and response full-scale measurement campaign has been designed by DNV. This measurement campaign is to provide a validation database for sloshing loads and structural responses such that a verified Class Note can be issued.
Figure 1 Integration of sloshing load & response projects
LNG sloshing developments
Sloshing tests • filling level & heading • sea severity • impact area • vessel speed • scaling • pump tower loading • fatigue loading
CFD validity studies
SLOSHING LOADS
Structural tests
STRUCTURAL STRENGTH
Sloshing sensor qualification
Installation qualification
FULL-SCALE MEASUREMENTS
FE calibration & analyses
HAZID - Failure mode analyses
Acceptance criteria
Verified LNG sloshing Class Note
Sloshing load and structural strength assessment scheme
LNG sloshing Class Note (2005)
Capacity determination
Measurement campaign
Measurement analyses

© Gastech 2005 Pastoor 7
2 SLOSHING LOADS Sloshing in LNG cargo tanks is a prime concern as described in the first chapter. The imminent changes in carrier sizes, vessel operations with partially filled tanks and a shift of trading routes to more severe wave environments requires an investment in new sloshing competence building. A simple answer from a Class Society to meet these developments could be to update its rules. However no rules are available for large LNG carriers like the 216.000m3 size carriers recently ordered. Neither are rules available to cover partially filled tank operations for offshore offloading, spot-trading, milk runs or floating receiving terminals. A simple conclusion would thus be that new rules are required. Indeed this would be most desirable and is an objective for the future. However many different large carrier designs and many different concepts of partially filled operations are on the drawing boards and are being discussed in the industry. The required application range of any new rule development can not clearly be focussed yet and is too wide at present to justify an investment in that direction. The aim has therefore been focussed on competence development needed to develop guidance for sloshing assessments of: • Large LNG carriers • Offshore offloading • Partially filled trading Over the past 30 years DNV has gained experience with determining sloshing loads on a variety of vessel types. Model tests have been performed for oil tankers, OBO carriers and LNG carriers, see for example the figures below. Some of the work has been carried out as part of consultancy work for external clients and some for rule development. With respect to LNG carriers model tests have been performed on spherical as well as prismatic tanks for different institutions and companies. Based on this history it has been a logical step for DNV in 2003 to continue with model experiments to develop the required knowledge on sloshing loads for the challenges of LNG carriers of today and the future. A total of 6 sloshing test phases has been executed in 1.5 years time and a description of the test equipment and the tests is found in the subsequent paragraphs. Other publications on part of these tests and subsequent analyses can be found in reference [18] and [19].
Figure 2 Spherical tank sloshing experiments as conducted in
the 70’ties in DNV Laboratories
Figure 3 Sloshing experiments conducted in the 90’ies in
cooperation with DSME.
2.1 Sloshing test equipment, data acquisition and handling A two degree of freedom motion platform has been used to excite a 1/20 scale model of the No. 2 tank of an existing 138.000m3 LNG carrier. The platform is prepared for a tank orientation in head seas (pitch + surge) and beam seas (roll + sway). A picture of the motion platform with the tank in a head seas configuration is shown in Figure 4. The control software can generate motions in manual, regular or irregular mode. For the irregular tests time series of ship motions are provided from a ship motion analyses for a specified sea state. The maximum translation amplitude of the platform is 1.1 meter, while the rotation angle is 22 degrees.

© Gastech 2005 Pastoor 8
The tank models, which are used for the testing are manufactured of steel and dimensioned for ullage depressurisation down to -1 bar, i.e. vacuum. This provides the opportunity to conduct test with depressurised conditions. Furthermore other type of gasses can be slipped inside when the tank is vacuum and hence the effect of different gas densities can be studied as well in sloshing tests. More details of these specialised tests are described in paragraph 2.2.5. All the welds are on the outside of the tanks to create clean sharp corners at chamfer corners, tank roof and side walls. The tanks are tapped for a large number of alternative single pressure transducers. For the tank as pictured in Figure 4 a total of 155 alternative sensor positions was available. A large number of these were organised in clusters of 9 sensors. Such a cluster consists of 3 by 3 single pressure transducers within an area of 6 by 6 cm. This area represents a GTT NO96 box at full scale. The pressure transducers had a sensing area of Ø 7 mm, which gives a diameter at full scale of 14 cm. The pressure sensors are sampled and the full time histories are stored on disk. Sampling frequencies upto 10kHz were used. The time series of the pressure sensors are statistically post-processed to obtain exceedance probability distributions of the pressure peaks. By summing the pressures of pressure sensors located in clusters average pressures for larger areas were composed and statistically post-processed as well. A typical impulse is shown in Figure 5. In theory the time history of such a pulse could be used as load input on a FE model for structural response evaluations. Or the frequency contents of such a pulse should be extracted to define the loading on the FE model. In practice a more simplified approach can be used by characterising the pulse by its peak value, rise time, decay time and impulse. These parameters are of importance to investigate the structural response to these impacts. A large peak with a very short rise time might give less structural responses than a smaller peak with a large rise time, c.q. duration. Further post-processing of the data is thus important in order to investigate the correlations between rise times, decay times, pulse peaks and the impulse of the sloshing impacts. More on this is found in paragraph 3.5.3.
Figure 4 Sloshing test rig with No.2 tank of a 138.00c0 m3
LNGC installed
Decay timeRise time
Peak
val
ue
Figure 5 Sloshing impact characterisation
2.2 Sloshing experiments For most of the testing a 1 to 20 scaled model of the No.2 tank of a 138.000 m3 LNG carrier was used. An additional 1 to 70 scaled model was used for tests specifically investigating the scaling of the model test results to full-scale. In the subsequent paragraphs a summary is presented of the various aspects that have been studied in the 6 sloshing test phases.
2.2.1 Sloshing loads per filling level, heading and sea state severity Traditionally LNG carriers trade on long-term contracts, either fully loaded or in ballast on the return trip. Due to the boil-off the filling level reduces and is hence depending largely on the trading distance. Due to an increasing interest for spot trading and short-term contracts as well as the need to discharge offshore a wider range of filling levels will be the case for future carrier operations. The filling level does have a great influence on the fluid motions inside the tank and hence the sloshing impacts. For the filling ranges, relevant for present trading patterns, the worst filling level was found to be around 95% filling in a head waves condition. However large pressures are measured as well for a filling level of 70% while operating in a beam sea condition. (Note: present filling level

Pastoor 9
restrictions are set to 70% of tank height and 10% of tank length for 4 tank carriers up to a size of 150.000 m3 with either the GTT No96, MkIII or CS1 containment systems. (DNV January 2005)). Figure 6 and Figure 7 show some results of single pressure sensor measurements Froude scaled to full-size. Clearly larger pressures are measured for lower fillings around 30%. Especially in beam seas where the so-called hydraulic jumps can cause high impact loads. In the same figure results are shown for sea states with lower significant wave heights. Although some wave height reductions were around 50% the impact pressures did not reduce that much.
0
10
20
30
40
50
60
70
80
90
100
0 5 10 15 20Froude-scaled pressure [bar]
Fillin
g le
vel [
% ta
nk h
eigh
t] Expected values - 20 yrs HsExpected values - lower Hs
Figure 6 Sloshing impact pressure (single sensor) in head
waves
0
10
20
30
40
50
60
70
80
90
100
0 5 10 15 20Froude-scaled pressure [bar]
Fillin
g le
vel [
% ta
nk h
eigh
t] Expected values - 20 yrs HsExpected values - lower Hs
Figure 7 Sloshing impact pressure (single sensor) in beam
waves
The values as given in Figure 6 and Figure 7 are expected maxima to occur in 3 hours of the sea state, which was identified as the worst condition. However when investigating the probability curves in detail significant differences are seen in the shape of the curves. Figure 8 shows two exceedance probability curves of scaled single sensor pressure measurements for a 5 hours full-scale duration. The red curve is a typical result for a 30% filling case tested in beam waves, while the green curve is a typical curve for 95% filling in head waves. On the vertical axis is the exceedance probability curve given, which is interpreted as follows: Given a randomly selected response peak from an irregular time sequence the exeedance probability gives the probability that this peak value exceeds the value given by the curve. Given the average response period return periods can be drawn in the figures, like the 3 and 30 hour’s level given in the figure. From these the expected extremes to occur in these periods can now be determined from the figure. As seen the expected extreme in 3 hours for the 30% filling case is some 35% larger than the expected extreme for 95% filling. However when looking at a period of 30 hours this percentage is increased to nearly 80% if the extrapolation as plotted is reliable. Bluntly comparing expected extremes for short-term durations without accounting for any significant difference in the statistical curves is to be avoided. This example shows as well that it is important to conduct sufficiently long duration tests in order to obtain reliable statistical data.
0.0001
0.0010
0.0100
0.1000
1.00000 5 10 15 20 25 30
Froude-scaled pressure (bar)
Prob
abilit
y of
exc
eede
nce
30% filling - beam seas
95% filling - head waves
3 hours
30 hours
Figure 8 Example probability curves for single sensor pressure results
Based on all the sloshing tests for varying filling level and for head and beam seas a clear picture is obtained of the most exposed locations inside the tank. Figure 9 and Figure 10 give an overview of this. Clearly is seen that the tank roof is most exposed for the higher fillings in head seas, while the

Pastoor 10
upper chamfer corners are most exposed for lower fillings in beam seas (50 – 70%). For filling levels below 50% the lower corner of the upper chamfer and the tank sides are most exposed.
Figure 9 Main sloshing impact locations for head wave
conditions
Figure 10 Main sloshing impact locations for beam wave
conditions
2.2.2 Sloshing loads for varying subjected areas As written previously a large amount of the alternative pressure locations was arranged in clusters of 3 by 3 sensors. This provides the opportunity to combine the output of 4 sensors and 9 sensors together to evaluate the pressure over different load areas. The areas represent respectively the local loading of a NO96 top plate between internal box stiffeners and a NO96 box. For every filling level and wave heading the worst loaded locations in the tank were equipped with clusters. By statistically post-processing the pressure measurements of the sensors mounted in clusters the expected extreme pressures are determined for three different areas and for head and beam seas respectively. Figure 11 shows a plot of the largest loads for the two wave headings, which were tested. As seen the sloshing loads for larger load areas reduce significantly, however this decrease is not equal for different filling levels.
0
2
4
6
8
10
12
14
0 0.4 0.8 1.2 1.6load area [m2]
Sca
led
slos
hing
pre
ssur
e [b
ar]
95 %, head sea
70 %, beam sea
50 %, beam sea
Figure 11 Sloshing pressures for versus load area
2.2.3 Sloshing loads for varying ship speed Good seamanship demands that the crew takes proper actions when sailing in bad weather. A speed reduction or a course change are applied. This speed reduction is often called voluntary speed reduction, whereas an involuntary speed reduction is caused by added wave resistance of the vessel. How a speed reduction affects the sloshing pressures is investigated by performing tests with identical filling levels for different speeds. In the present case ¾ of the design speed was used, i.e. 14.6 knots and a manoeuvring speed of 5 knots. The figure below gives the results of these tests, showing a significant reduction in sloshing impact pressures for the lower vessel speed.
95%
70%
50%
30%
Transv. bulkhead C.L.
95%
70%
50%
30%
Transv. bulkheadC.L.

Pastoor 11
0
20
40
60
80
100
0 2 4 6 8 10 12Froude-scaled pressure [bar]
Filli
ng le
vel [
%]
5 knots3/4 design speed
Figure 12 Effect of forward speed on sloshing impact pressures in head waves
2.2.4 Long-term distribution of sloshing loads For the determination of ordinary wave loads on ships, like for example hull girder bending or external wave pressures a linear transfer function approach is often used. The great advantage of a linear transfer function approach is the possibility to assess a complete scatter diagram in less than a second by combining easy-to-use spectral and statistical techniques. Neither sloshing experiments nor numerical sloshing simulations can apply such a straight-forward procedure to determine long-term sloshing load distributions. Still there is a clear need for the long-term distribution as discussed subsequently. Considering the structural integrity of the containment system the prime interest is first of all focussed on the ultimate strength and hence on the extreme sloshing impact loads with lifetime return periods. However the fatigue strength needs to be evaluated as well. This implies that the fatigue strength is to be determined by documenting the number of load cycles that are acceptable before a material failure is seen. In addition it is required to know what the number of sloshing load cycles can be expected in operation in order to assess the structural fatigue safety. When evaluating a large LNG carrier or partially filled trading it is possible to compare the sloshing loads for this new design or new operation with the sloshing loads in a conventionally sized LNG carrier operating with the approved filling restrictions. A so-called Comparative Approach evaluates then whether the sloshing loads or resulting responses for the larger carrier or the partially filled operation are equal or less than for the conventionally sized carrier design. Typically the 20 years or 40 years contour of significant wave height and wave periods of the North Atlantic scatter diagram are used in a worst case screening process. Hence the sloshing analyses for the worst storm conditions on this contour are used in the comparison. This means the comparison is based on a short-term sea state only. The implicit precondition is that the ratio of the resulting sloshing loads from this short-term assessment is equal to the ratio of the design sloshing loads, which would be obtained if a complete long-term sloshing analyses would be performed. For ordinary wave load analyses this is a proper assumption. Typically extreme wave loads obtained from a short-term storm assessment are only some 10-15% lower than extreme wave loads from a long-term assessment. However as seen in Figure 6 and Figure 7 it is seen that the sloshing impacts can still be very large for sea states with lower significant wave heights. It is therefore questionable if this precondition is valid. It is simply not possible to test a complete scatter diagram or even a large portion of it. Still an attempt was made despite the drawback that any final long-term distribution curve will be based on significant extrapolation. As basis the tank no.2 of a 138.000 m3 LNG carrier was used, with a filling of 95%. Head and beam waves were tested for a large range of sea states. These sea states were selected by combining the sea states in the North Atlantic scatter diagram in large blocks. From all these tests the sloshing impacts were statistically post-processed and a Weibull function was fitted. At the end all the Weibull curves were combined to estimate a long-term distribution. A continuous 20 years operation was assumed with 50% of time in ballast and 50% of time loaded with 95% tank
Pastoor 12
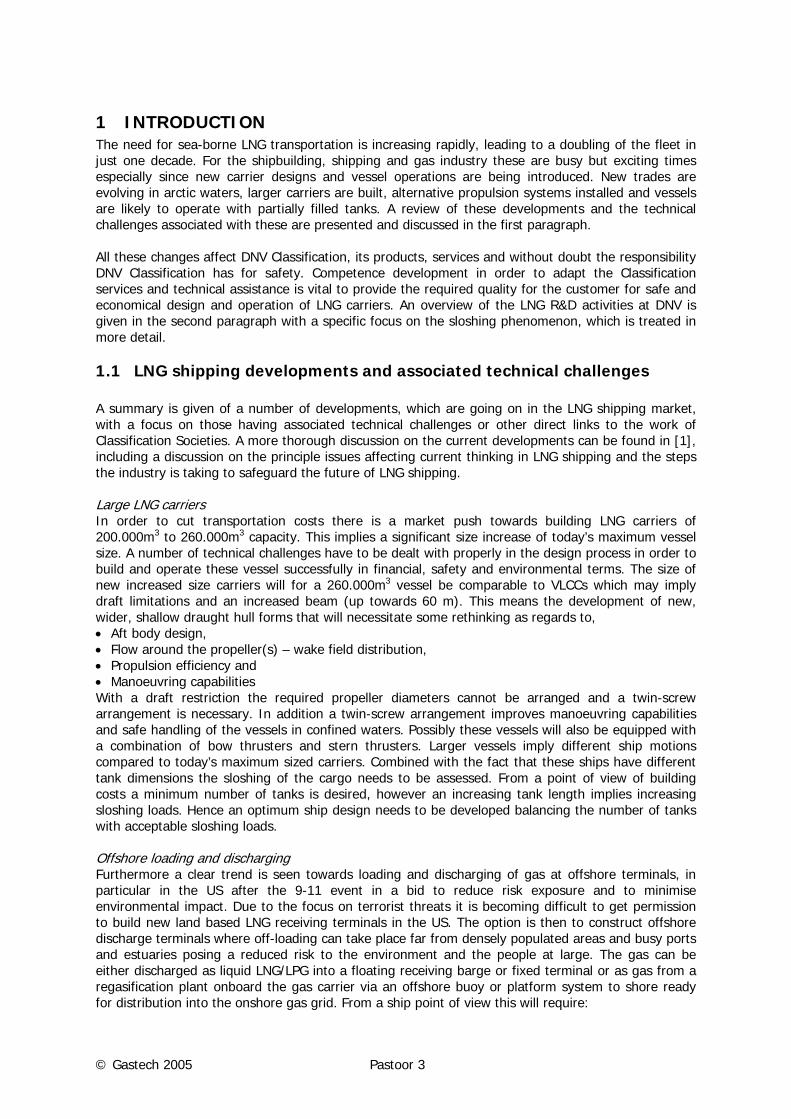
filling. Beam seas was assumed 50% of time and head waves was assumed 50% of time as well. Both single pressure sensor results (patch load) were accumulated as well as a summation of a cluster of 9 sensors (uniform load). The shapes of the final long-term distributions of the patch and uniform loads resembled quite well despite a significant difference of course in absolute values. As said before the curves are based on a significant extrapolation of the intermediate statistical curves. Consequently it is a difficult task to define how to use the obtained long-term curves in an absolute sense as error margins are unknown. A simple conservative approach that can be proposed instead of an absolute treatment of these curves is to use only the shape of these curves and scale the position based on the static ULS capacity. Hence a figure is obtained as depicted in Figure 13. If fatigue testing shows that a sufficient margin is obtained when using this curve as the load distribution curve there is no need to develop a more accurate long-term load distribution.
-1 0 1 2 3 4 5 6LOG(number of cycles)
Slo
shin
g pr
essu
re
ULS capacity
Figure 13 Characteristic shape of long-term sloshing load distribution
2.2.5 Scaling of sloshing model experiments The scaling of sloshing impact pressures is a complex problem and discussed and studied for many years. Reference [12] presented an attempt to determine modelling requirements for LNG sloshing by following Buckingham Pi-theorem. Geometric, Froude and compressible scaling are important without doubt. No conclusive answer could be given however on the effect of viscosity and cavitation. Indeed based on a comparison of the Reynolds numbers at model and full-scale it can be concluded that the viscous damping at full-scale is less and hence the model test pressure results are non-conservative. However the Reynolds number at model scale is still large and other energy dissipation effects are believed to be more dominant, like wave breaking, spray formation or run-ups at the tank sides or bulkheads. As said previously in the introduction of this chapter DNV has a long history of conducting sloshing experiment in the DNV Laboratories. Several of these test programs were focussed or partly focussed on the scaling problem, see for instance [13]. Tests have been done at different geometrical scales, with different ullage pressures and different fluids. The main interest has been first of all in determining a most appropriate scaling of the measured model scale pressures. So far it has been recommended that the ullage pressure in the tank model is Froude scaled in order to avoid over-cushioning of impacts due to gas at model scale being “too stiff” (compressibility property) compared to that in full-scale. When considering an entrapped gas pocket or entrained gas bubbles during a sloshing impact the gas is compressed and momentum is transferred. Where the former is directly affected by the ullage pressure the latter is affected by the density ratio of liquid versus gas. Furthermore in theory the liquid may be assumed incompressible but in case a significant portion of gas is dissolved as tiny bubbles in the fluid the compressibility is likely to be important and hence the gas density might be an important factor. Strict separation of ullage pressure and gas density is not possible as a change in ullage pressure implies a change in gas density. Gas density has not received much attention in the past, for example the gas density was not discussed in the Pi-theorem assessment in reference [12]. Furthermore the time history of a pressure impact is very important as well as the dynamic structural behaviour of the containment systems is to be evaluated. Little attention has been paid to this in the past as well.
Pastoor 13
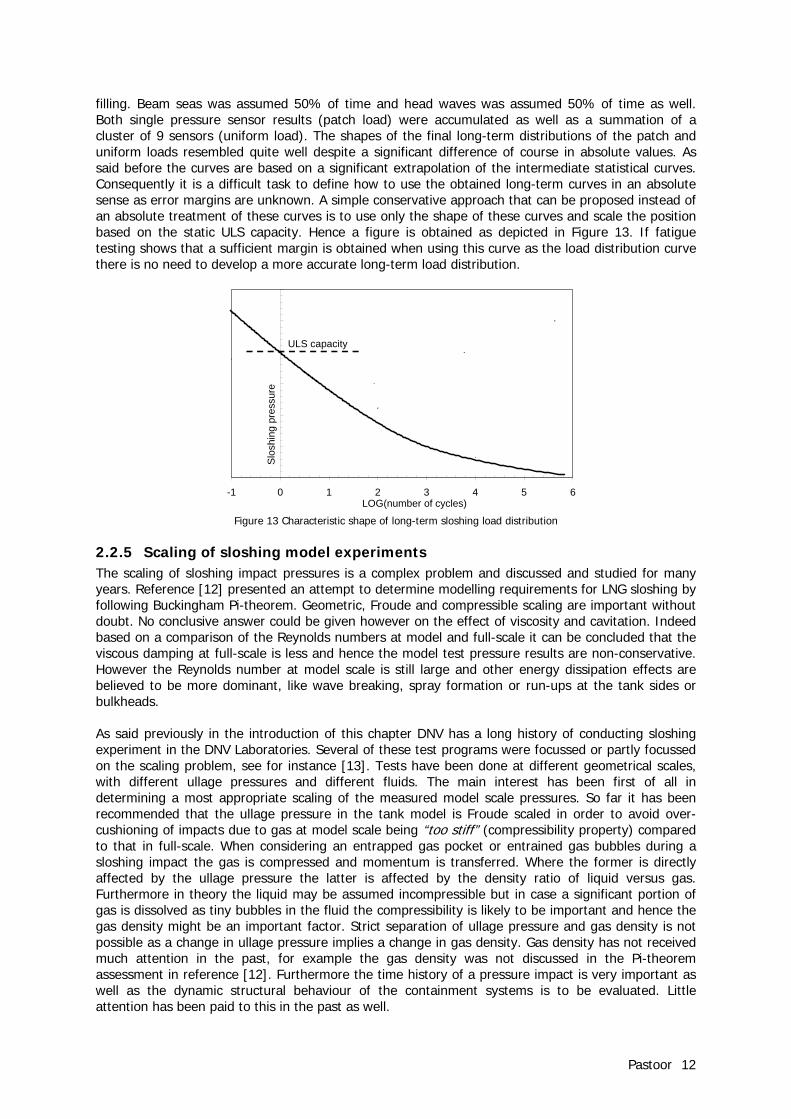
In order to improve the knowledge on the scaling of sloshing impacts a new test program was developed to study specifically the effect of the ullage conditions by varying both the pressure and gas densities inside the tank. Furthermore two identically shaped tanks were used but with different sizes. Figure 14 and Figure 15 show a 1:20 scaled and a 1:70 scaled tank. The diameter of the pressure sensors as used on the small tank were a factor of 3.5 smaller than on the large tank. The sampling rate use for the small tank was twice a large as for the 1:20 scale tank.
Figure 14 A 1:20 scaled tank model of the No.2. tank from a
138.000 m3 LNG carrier.
Figure 15 A 1:70 scaled tank model of the No.2. tank from a
138.000 m3 LNG carrier.
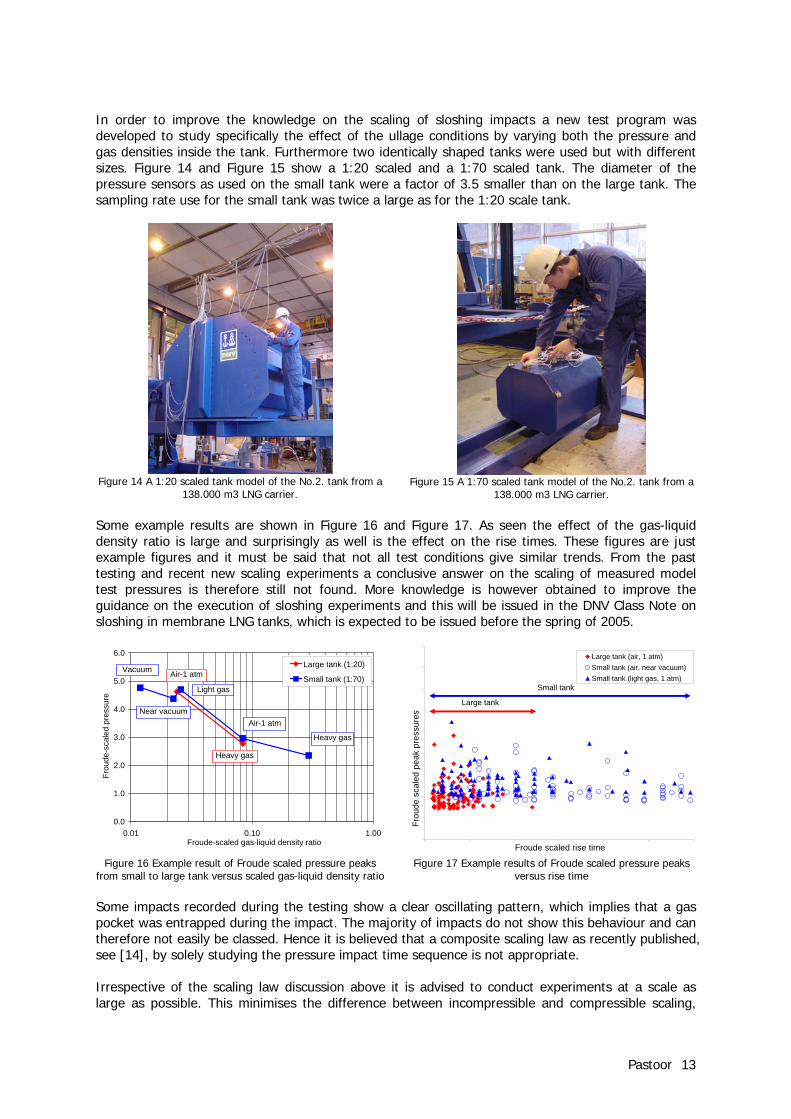
Some example results are shown in Figure 16 and Figure 17. As seen the effect of the gas-liquid density ratio is large and surprisingly as well is the effect on the rise times. These figures are just example figures and it must be said that not all test conditions give similar trends. From the past testing and recent new scaling experiments a conclusive answer on the scaling of measured model test pressures is therefore still not found. More knowledge is however obtained to improve the guidance on the execution of sloshing experiments and this will be issued in the DNV Class Note on sloshing in membrane LNG tanks, which is expected to be issued before the spring of 2005.
0.0
1.0
2.0
3.0
4.0
5.0
6.0
0.01 0.10 1.00Froude-scaled gas-liquid density ratio
Frou
de-s
cale
d pr
essu
re
Large tank (1:20)
Small tank (1:70)Vacuum
Near vacuum
Light gas
Air-1 atm
Heavy gas
Air-1 atm
Heavy gas
Figure 16 Example result of Froude scaled pressure peaks
from small to large tank versus scaled gas-liquid density ratio
Froude scaled rise time
Large tank (air, 1 atm)Small tank (air, near vacuum)Small tank (light gas, 1 atm)
Large tank
Small tank
Frou
de s
cale
d pe
ak p
ress
ures
Figure 17 Example results of Froude scaled pressure peaks
versus rise time
Some impacts recorded during the testing show a clear oscillating pattern, which implies that a gas pocket was entrapped during the impact. The majority of impacts do not show this behaviour and can therefore not easily be classed. Hence it is believed that a composite scaling law as recently published, see [14], by solely studying the pressure impact time sequence is not appropriate. Irrespective of the scaling law discussion above it is advised to conduct experiments at a scale as large as possible. This minimises the difference between incompressible and compressible scaling,
Pastoor 14
reduces the possible effect of an overestimated viscous damping and thirdly reduces the risk for testing errors and manufacturing and instrumentation positioning errors. The scaling of sloshing model test pressures remains a difficult subject and it emphasises the need for the execution of full-scale sloshing measurements onboard LNG carriers as described in chapter 5. The recording of sloshing loads inside a LNG membrane tank combined with the recording of the ship motions, sea conditions and ship operational conditions is considered very valuable to improve the knowledge on sloshing loads inside tanks and the scaling of model tests sloshing loads.
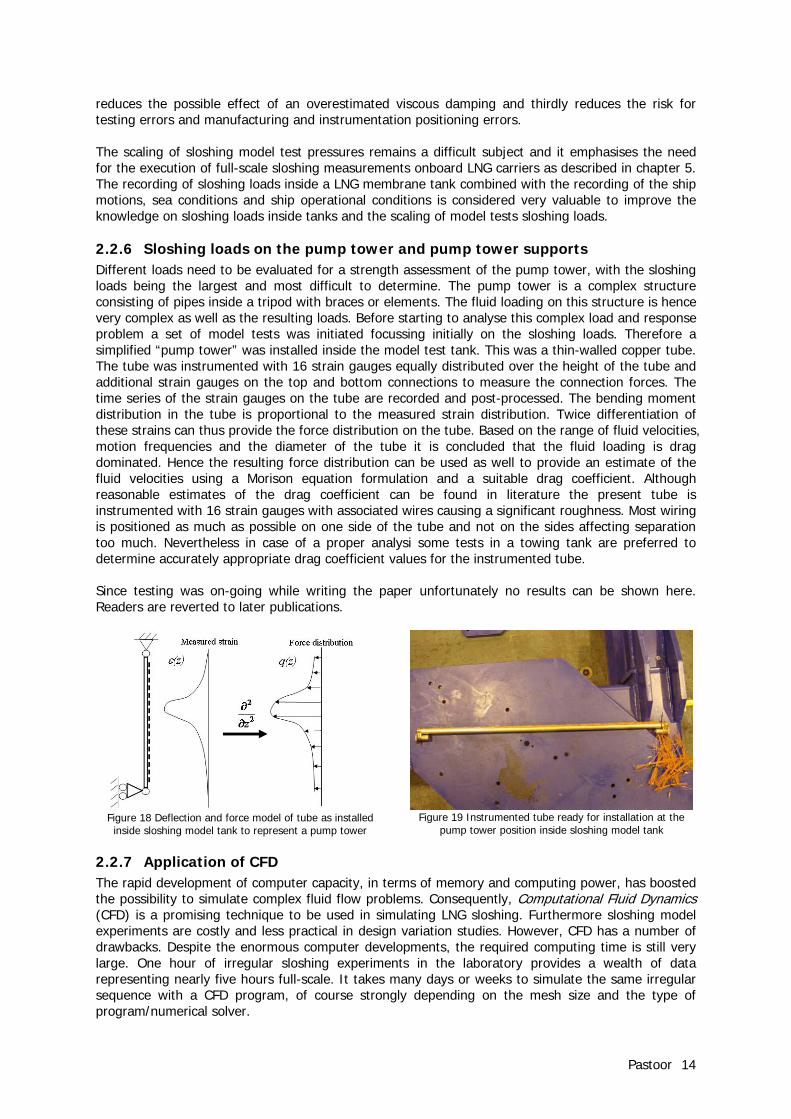
2.2.6 Sloshing loads on the pump tower and pump tower supports Different loads need to be evaluated for a strength assessment of the pump tower, with the sloshing loads being the largest and most difficult to determine. The pump tower is a complex structure consisting of pipes inside a tripod with braces or elements. The fluid loading on this structure is hence very complex as well as the resulting loads. Before starting to analyse this complex load and response problem a set of model tests was initiated focussing initially on the sloshing loads. Therefore a simplified “pump tower” was installed inside the model test tank. This was a thin-walled copper tube. The tube was instrumented with 16 strain gauges equally distributed over the height of the tube and additional strain gauges on the top and bottom connections to measure the connection forces. The time series of the strain gauges on the tube are recorded and post-processed. The bending moment distribution in the tube is proportional to the measured strain distribution. Twice differentiation of these strains can thus provide the force distribution on the tube. Based on the range of fluid velocities, motion frequencies and the diameter of the tube it is concluded that the fluid loading is drag dominated. Hence the resulting force distribution can be used as well to provide an estimate of the fluid velocities using a Morison equation formulation and a suitable drag coefficient. Although reasonable estimates of the drag coefficient can be found in literature the present tube is instrumented with 16 strain gauges with associated wires causing a significant roughness. Most wiring is positioned as much as possible on one side of the tube and not on the sides affecting separation too much. Nevertheless in case of a proper analysi some tests in a towing tank are preferred to determine accurately appropriate drag coefficient values for the instrumented tube. Since testing was on-going while writing the paper unfortunately no results can be shown here. Readers are reverted to later publications.
Figure 18 Deflection and force model of tube as installed inside sloshing model tank to represent a pump tower
Figure 19 Instrumented tube ready for installation at the
pump tower position inside sloshing model tank
2.2.7 Application of CFD The rapid development of computer capacity, in terms of memory and computing power, has boosted the possibility to simulate complex fluid flow problems. Consequently, Computational Fluid Dynamics (CFD) is a promising technique to be used in simulating LNG sloshing. Furthermore sloshing model experiments are costly and less practical in design variation studies. However, CFD has a number of drawbacks. Despite the enormous computer developments, the required computing time is still very large. One hour of irregular sloshing experiments in the laboratory provides a wealth of data representing nearly five hours full-scale. It takes many days or weeks to simulate the same irregular sequence with a CFD program, of course strongly depending on the mesh size and the type of program/numerical solver.

Pastoor 15
For LNG sloshing the focus is concentrated first of all on local impact loads, hence very fine mesh sizes are required posing a constraint on the simulation length or being restrained to regular instead of the preferred irregular motion simulations. Furthermore, local sloshing impacts are characterised by fluid, which hits the tank wall at high velocity. During these impacts gas is or can be entrapped and mixed in the fluid as bubbles of varying sizes. The effect of the gas on the impact pressures can be significant as was illustrated in Figure 16. Reference [15] describes a set of sloshing experiments with a rectangular tank and pressure, PIV and high-speed camera recordings. From this testing the effect of gas entrapment was very clear. Nevertheless many CFD codes incorporate only a mathematical model for the liquid fluid phase, while entrapped and dissolved gas bubbles in the fluid are neglected. Consequently, such a CFD code is a limited representation of the physical problem with hence a limited application range and not qualified to provide approval documentation for important decisions. A second interest for using CFD is to simulate the loads on the pump tower structure. Predicting accurate local velocities is the prime objective. However the strength assessment of the pump tower and support structure are governed by the total loading and only limited by single local velocity quantities. This, combined with the fact that the prediction of velocities is more accurate and reliable than local impact pressures makes that the application of CFD for this type of problem is appropriate. Furthermore mesh sizes can be more coarse for this type of problem and hence computing times are much less. A third interest to use CFD to simulate sloshing is to predict the ship motions and sloshing in a coupled manner. Ship motions induce sloshing, but the resulting sloshing loads influence the ship motions again. In order to simulate this coupled dynamic system a proper prediction of the total forces on the tank due to the fluid is required. This is the least demanding objective for a CFD code to solve of the three subjects discussed here and the application of CFD for this type of problem is appropriate. Based on the above it is believed that CFD in general is not mature enough to assess local flow phenomena like impact pressures to provide the basis for important decisions, as for example partial filling approval. For pump tower loading or for the coupling of ship motion and sloshing CFD is believed to be an appropriate tool. It is emphasised however that a CFD program undergoes proper qualification testing to map the applicability of the program for the problem at hand or the responses to be determined before being used. Despite drawbacks to use CFD for impact pressure calculations CFD is however important to use in development and study work considering this application. Consequently, DNV is actively supporting the further development of CFD with industry cooperations. Recently, DNV has been one of the main initiators of the ComFLOW-2 JIP as a follow-up of the SAFEFLOW JIP and specific sloshing cooperation work between DNV, MARIN (Maritime Research Institute Netherlands) and RuG (State University of Groningen, the Netherlands). The ComFLOW-2 JIP is focussing among other issues on the effect of gas cushioning on fluid impacts, of course sloshing impacts are a prime focus. The recent cooperation MARIN-RuG-DNV comprised a limited comparison study of the improved Volume-of-Fluid code ComFLOW with sloshing model experiments, see reference [16]. The 1:20 scaled model tank as described earlier was used with a filling of 70% of tank height. A regular resonant sway motion was tested and a cluster of 9 pressure sensors at the lower corner of the upper chamfer was installed to measure sloshing pressures. One of the reasons to select this case was the fact that most of the sloshing loads seem to be characterised by fluid hitting the chamfer with no gas entrapped. For this first test case it was thought that gas entrapped impacts should be avoided as the program used did not account for this. The sway motion amplitude was only 1.2 meters (full-scale), hence the measured peak pressure values and associated rise times were not representative for the worst case that can be expected for an LNG carrier in heavy storm conditions. However it is believed that the proper prediction of calm or moderate flow problems need to be assessed prior to any attempt simulating violent flows with

Pastoor 16
extreme impacts. If these moderate cases cannot be simulated properly the program is by definition not qualified to simulate violent flows either. A reasonable comparison was obtained for the measured and predicted sloshing cluster pressures (summation of 9 sensors). However the study confirmed the difficult treatment of numerical spikes. Furthermore fine and coarse mesh sizes were tested and indicated that the physical aspects involved are far from trivial. Detailed flow pattern investigations showed that small fluid flow formations can affect the local pressures. Hence fine mesh sizes are to be used and it is very questionable whether a fine mesh in the pressure sensing area holds or that the fine mesh needs to be extended considerably outside the pressure sensing range. Of course this is a crucial issue and affects the computing time significantly.
3 CONTAINMENT STRUCTURAL STRENGTH
3.1 Introduction The recent experimental sloshing load studies have identified the need for a methodology for strength assessment of the systems under the action of sloshing loads. The experiments have shown that the changes in design and operation not only affects the magnitude of the sloshing load, but that large variations also can be observed for its spatial extent and the time history. Since the time and spatial distribution of the sloshing impact has significant impact on the response of the containment systems, the various sloshing events can only be compared in terms of the strength of the systems. In addition, a rational strength assessment methodology is required to identify the necessary strengthening and design improvements to maintain the required safety margins during the new operation. Even though a significant amount of work has been done over the years to study both the static and the impact strength of the containment systems, the effort has been scattered and does not by itself represent a sufficiently comprehensive documentation for assessing the strength of the systems. A typical shortcoming of the available work is that it represents the strength of the entire system under certain load conditions, and does not give sufficiently detailed information about failure modes, representative material properties etc. DNV has during the last year carried out development work with the aim of developing a methodology for capacity assessment of the mentioned containment systems. The methodology should be sufficiently general to allow for assessment of strength changes caused by moderate structural modifications such as
- Change of plate thickness - Modified distance between lateral supports - Other minor modifications expected to be proposed to add strength to the systems
The scope of the development work includes:
1. Identification of critical failure modes. 2. Experimental and analytical investigation of the identified failure modes. 3. Gathering, developing and/or selection of representative stiffness and strength properties of
the materials used in the insulation systems. 4. Specification and development of requirements and procedures for structural response
assessment. 5. Formulation of strength criteria including dynamic and low temperature effects.
The descriptions given in the following aim at presenting a brief overview of key elements of the work carried out in the project so far, and to highlight and raise certain key issues and challenges faced in this work. Some of the tasks of the development work are still in progress at the time of the submittal of the paper, and the treatment is therefore by no means complete. The ability to present final conclusions and results are limited, and answers are not given to all questions raised.

Pastoor 17
3.2 Some development considerations
3.2.1 Need for comparative strength assessment The membrane type containment systems have a good operational record. In order to draw advantage from this in-service experience, it has been proposed to carry out a comparative strength assessment of the containment systems. In the comparative strength assessment, the acceptance criteria are based on the relative strength between a selected reference case and an investigated target case. The aim is to maintain the same safety level in the target case as in the reference case. Besides making use of existing opertational experience, the advantage of the comparative approach is that the importance of the actual load level is reduced. This is beneficial, since there are uncertainties connected to inevitable differences between test conditions and actual conditions. Mentioned sources of uncertainties are:
- Uncertainties in scaling law from model scale to full scale. - Differences in gas/liquid density ratios and other environmental conditions between
experiment and application. - Effects of structural cushioning (fluid-structure interaction). - Potential gas cushioning caused by the geometry of the primary membrane.
Using the comparative approach, these difficulties become less important than in a direct strength evaluation.
3.2.2 Structural, temperature, and load related issues The rather complex membrane type containment systems are built by assembly of thousands of basic building blocks, or insulation panels. The number of unique building blocks in the system is relatively small, and typically consists of flat panels and corner panels (di-hedrons and tri-hedrons). This configuration represents a simplification and reduction of the scope of the strength assessment task. It is sufficient to assess the strength of the individual insulation panel. On the other hand both the low temperature operational conditions and the short duration dynamic characteristics of the loads add to the complexity of the task:
- Both the material stiffness and strength properties are potentially temperature dependent. The low temperature environment will therefore have impact on both the structural load response and the structural strength.
- Both the structural response and the strength will in some cases depend on the dynamics of the load. The dynamic strength effect may either exist on the material level as strain rate dependency, or on the structural level as an inertia stabilisation effect.
It has been considered important in the development of a strength assessment procedure to consistently account for the low temperature and the dynamics on both the response (load) and the strength (resistance). The availability of knowledge about the behaviour and properties of the materials used in the insulation system is another challenge in this work. Even though both plywood and polyurethane foam are well known engineering materials, the knowledge about their properties and behaviour is limited compared to certain other materials, in particular metals. This is particularly true for low temperature and dynamic applications as well as for fatigue. It also clear that the listed material strength properties for the plywood material is representative of the average production quality, and does not take into account the careful quality control of the material used in LNG containment applications.

Pastoor 18
3.2.3 Acceptance level for the comparative strength assessment In the development of a set of strength criteria for a normal strength evaluation with well defined design loads the developer is free to set the acceptance level for the individual failure modes at any level found necessary from a strength, serviceability or even convenience point of view. The latter could for instance refer to the need to simplify the procedure to increase its user friendliness and attractiveness. This should in most cases only imply increased conservatism from an ultimate strength point of view. This flexibility is not available in the development of the comparative strength assessment procedure. Because the comparative strength assessment in reality represents a calibration of the strength criteria it is implicitly assumed that the load level in the reference case is equal to the capacity of the critical failure mode. If this failure mode is conservatively treated compared to the remaining failure modes, the implied load level will be lower than the actual load level for this case. This means that this calibration is non-conservative with respect to the remaining failure modes. The main goal is to have a physically consistent set of failure criteria that produce a reasonably accurate estimate of the strengths of each failure modes relative to each other, as illustrated in Figure 20 for a set of three failure modes.
Figure 20. Illustration of a consistent and physically correct relationship between failure modes that is important in a
comparative strength assessment procedure. In practice this is best achieved by calibrating all failure modes to the highest load level consistent with the operational experience of the containment systems. With the good operational record of the membrane type containment systems this means that the stress and strain levels have been below the levels causing observable deformations or damages to the structure. However, because the containment systems are sealed and not inspectable during operation the presence of localised damage and inelastic deformations can not be ruled out without further investigations. In cases where the highest load level consistent with the operational experience may be associated with an elasto-plastic load state with localised inelastic deformations and damages, the establishment of the critical load levels may require not only an investigation of the ultimate strength behaviour of the structure but also consideration of low cycle fatigue behaviour. The reason for this is illustrated in Figure 21.
Pastoor 19
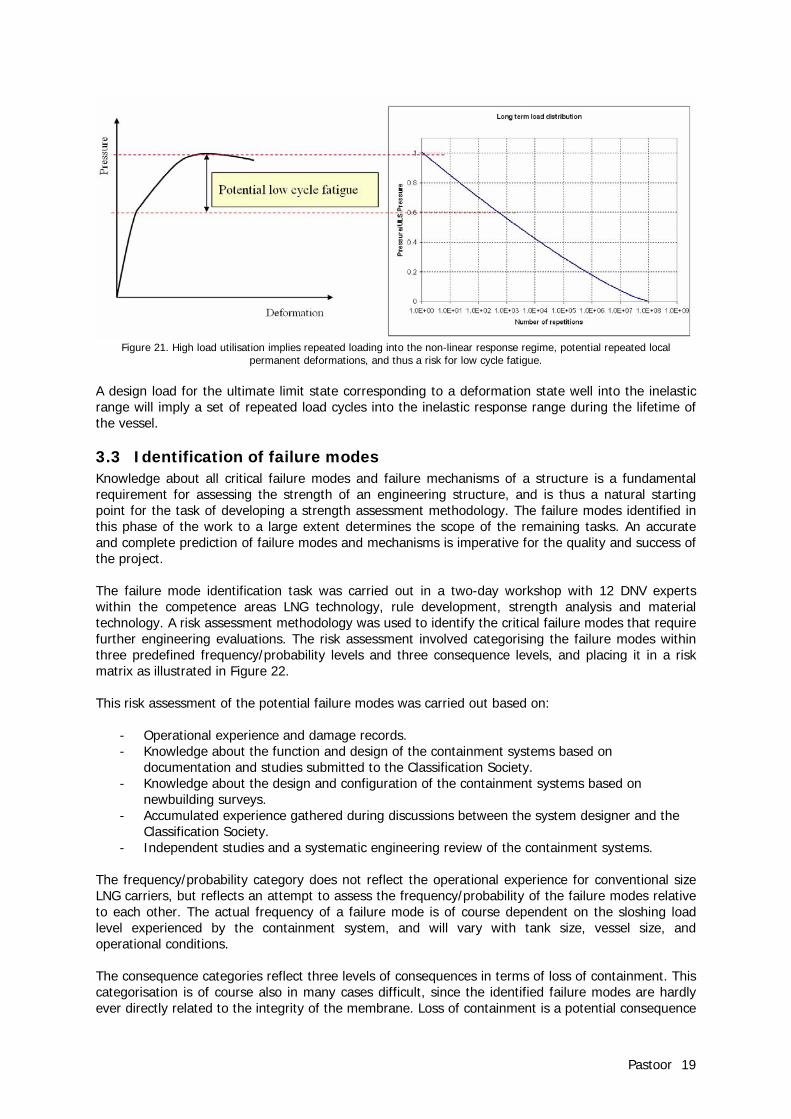
Figure 21. High load utilisation implies repeated loading into the non-linear response regime, potential repeated local
permanent deformations, and thus a risk for low cycle fatigue. A design load for the ultimate limit state corresponding to a deformation state well into the inelastic range will imply a set of repeated load cycles into the inelastic response range during the lifetime of the vessel.
3.3 Identification of failure modes Knowledge about all critical failure modes and failure mechanisms of a structure is a fundamental requirement for assessing the strength of an engineering structure, and is thus a natural starting point for the task of developing a strength assessment methodology. The failure modes identified in this phase of the work to a large extent determines the scope of the remaining tasks. An accurate and complete prediction of failure modes and mechanisms is imperative for the quality and success of the project. The failure mode identification task was carried out in a two-day workshop with 12 DNV experts within the competence areas LNG technology, rule development, strength analysis and material technology. A risk assessment methodology was used to identify the critical failure modes that require further engineering evaluations. The risk assessment involved categorising the failure modes within three predefined frequency/probability levels and three consequence levels, and placing it in a risk matrix as illustrated in Figure 22. This risk assessment of the potential failure modes was carried out based on:
- Operational experience and damage records. - Knowledge about the function and design of the containment systems based on
documentation and studies submitted to the Classification Society. - Knowledge about the design and configuration of the containment systems based on
newbuilding surveys. - Accumulated experience gathered during discussions between the system designer and the
Classification Society. - Independent studies and a systematic engineering review of the containment systems.
The frequency/probability category does not reflect the operational experience for conventional size LNG carriers, but reflects an attempt to assess the frequency/probability of the failure modes relative to each other. The actual frequency of a failure mode is of course dependent on the sloshing load level experienced by the containment system, and will vary with tank size, vessel size, and operational conditions. The consequence categories reflect three levels of consequences in terms of loss of containment. This categorisation is of course also in many cases difficult, since the identified failure modes are hardly ever directly related to the integrity of the membrane. Loss of containment is a potential consequence

Pastoor 20
of the failure. It is, however, fairly easy to judge the severity of failure modes relative to each other. In cases of doubt the failure mode is moved up in the consequence categories. The outcome of the risk assessment categorisation and identification of critical failure modes are illustrated in Figure 22, and show that 11-15 failure modes have been identified for further analytical and experimental investigation.
Figure 22. Risk matrix illustration of the outcome of the failure mode identification. 15 critical failure modes were identified for
further investigations. The probability and the consequence should be considered relative quantities.
3.4 Experimental investigations of failure modes
3.4.1 General The failure mode identification carried out by the expert group represents a starting point for the further experimental and analytical work towards developing a set of strength criteria to govern the strength of the insulation systems. The objective of this part of the work is to if possible narrow down the number of failure modes even further, and to provide insight and knowledge necessary to formulate failure criteria for the final set of critical failure modes. The work has involved laboratory testing of representative components and sub-assemblies of the containment systems to study failure modes in more detail and to determine the capacity of the component/sub-assembly in terms of well defined response parameters. The test specimens have as far as possible been kept sufficiently simple to allow for a direct interpretation of the strength in terms of what is believed to be the critical response parameters. Where in doubt about the critical response parameter, or in particular in cases where it has been suspected that the failure may be governed by a combination of response parameters, the test setup has been varied to produce different combinations of the potentially critical responses. Care has been taken to create similarity between the load situation in the test and in the application. The testing has been carried out under room temperature and quasi-static conditions based on the assumption that corrections for low temperature and dynamic effects can be carried out separately. This is discussed further in Sec.3.6. Tests at representative in-service conditions would be extremely difficult to execute. In addition, interpretation of the results is difficult due to the different dynamic effects inherently present in the results. The test campaign undertaken in the project includes:

Pastoor 21
- Ultimate strength and fatigue tests of a Mark III sub-assembly. - Ultimate strength and fatigue tests of plywood plates in shear. - Ultimate strength test of plywood plates in bending. - Buckling strength test of plywood plates. - Indentation strength test of plywood plates.
A short description of these tests and their purpose is given in the following. The test results will be used together with the results from supplementary finite element analyses and literature reviews to formulate strength criteria, as discussed in Sec.3.6.
3.4.2 Ultimate strength and fatigue tests of a Mark III sub-assembly The Mark III sub-assembly identified and illustrated in Figure 23 have been tested both for ultimate static capacity and for fatigue. The purpose of the ultimate strength test was primarily to investigate the ability of the foam material to sustain localised inelastic deformations without the development of cracks or other damages, and to establish appropriate load levels for the fatigue tests. Five specimens were tested, and no signs of cracks or degradation of the strength of the component were noticed.
Figure 23. Identification of the tested Mark III sub-assembly.
The fatigue tests were carried out at three load levels measured relative to the established ultimate capacity:
- 95% of the ultimate capacity. - 85% of the ultimate capacity. - 75% of the ultimate capacity.
Three specimens were tested at each load level, and the results were used to develop an S-N curve for the sub-assembly. The S-N curve was subsequently used together with a traditional linear damage accumulation calculation to develop a critical load spectrum indicating full fatigue strength utilisation. This load spectrum was ultimately used in a proof test to determine the applicability and conservatism of the S-N curve. The proof test was carried out on two test specimens, and no damage was observed.
3.4.3 Ultimate strength and fatigue tests of plywood plates in shear The test setup for shear failure of the plywood plates is illustrated in Figure 24. A block of the reinforced polyurethane foam used in the Mark III and the CS 1 containment systems are used to produce a distributed load on the plywood beam. This test has been devised to study the shear strength of the bottom plywood plates of the Mark III and the CS 1 systems and the cover plates of the NO96 system. Ultimate strength tests were carried out for:
- 9mm thick plates in the strong and the weak direction of the laminate. - 12mm thick plates in the strong and the weak direction of the laminate. - 100mm and 120mm plate span.

Pastoor 22
The load level associated with the first sign of shear cracks in the laminate, as well as the load level associated with shear failure of the plate was recorded. The latter was observed to occur at excessive rotations and deformations of the specimen.
Figure 24. Test setup for ultimate strength and fatigue testing of plywood plates in shear. Results apply to the strength of the
bottom plate of the Mark III and CS 1 containment systems as well as the cover plates of the NO96 system. Fatigue tests were carried out for 9mm thick plates in the two main directions of the laminate, and for a free span of 120mm. The tests were carried out for five test specimens at 95% and 85% of the ultimate load, and a proof tests as described for the foam in the previous section was carried out a for three specimens for each load direction. No crack development was observed for the investigated load spectrum.
3.4.4 Ultimate strength tests of plywood plates in bending The test setup for bending failure of plywood plates is illustrated in Figure 25 and is essentially a three point bending test. This test has been devised to study the bending strength of the bottom plywood plates of the Mark III and the CS 1 systems and the cover plates of the NO96 system. Ultimate strength tests were carried out for:
- 9mm thick plates in the strong direction of the laminate for 60, 120 and 155mm plate span. - 12mm thick plates in the strong direction of the laminate for 120mm plate span.
Five specimens are tested for each thickness and span, and the results are used to relate the in-plane strength values available for the plywood plates to the bending strength. A statistical indication is obtained by combining the results of the five identical tests.

Pastoor 23
Figure 25. Test setup for ultimate strength and fatigue testing of plywood plates in bending. Results apply to the strength of
the bottom plate of the Mark III and CS 1 containment systems as well as the cover plates of the NO96 system.
3.4.5 Buckling strength tests of plywood plates Buckling strength tests of plywood plates have been carried out to establish a buckling strength curve for the vertical load carrying bulkheads in the NO96 insulation boxes. Tests have been carried out for both uniformly loaded plates (columns) and for plates loaded over only a ten percent fraction of the length. The setup used for the latter tests are illustrated in Figure 26. Several combinations of plate thickness and height have been tested to obtain buckling strength data to cover the application slenderness range and to get a good impression of the shape of the strength curve:
- 230x12mm (h x t), uniform and part load. - 300x12mm (h x t), uniform and part load. - 230x9mm (h x t), uniform and part load. - 300x12mm (h x t), uniform and part load.
The test results are presented along with the selected buckling strength curve in Figure 27, where σu denotes the buckling strength, σF denotes the material proportionality limit or yield stress, and the slenderness λ is defined as:
F
E
σσλ =
The σE that occurs in the numerator of this expression denotes the elastic buckling stress of the structure for the given load condition. The buckling strength curve is a special fit of the buckling curve given in the DNV Classification Notes No. 30.1 [20].

Pastoor 24
Figure 26. Test setup for buckling capacity testing of partly loaded plywood plates.
0
0.1
0.2
0.3
0.4
0.5
0.6
0.7
0.8
0.9
1
0 0.5 1 1.5 2 2.5Slenderness
σu/σ
f
Test, uniform loadTest, part load Design curve
Figure 27. Buckling test results and selected buckling strength curve.
3.4.6 Indentation tests for plywood plates The indentation strength of the plywood plates have been investigated using the test setup shown in Figure 28. This test is relevant for the possible indentation of the vertical plywood bulkheads into the top and bottom cover plates of the NO96 insulation boxes, and in particular at the locations where the bulkheads of the primary and the secondary boxes intersect. Five tests have been carried out for each of the following plate thickness combinations:
- 12mm vertical and 12mm horizontal plates.
Slenderness, λ

Pastoor 25
- 12mm vertical and 9mm horizontal plates. - 9mm vertical and 12mm horizontal plates. - 9mm vertical and 9mm horizontal plates.
Figure 28. Test setup for the indentation test of the plywood plates. The test is used to assess the possible indentation of the
vertical bulkheads of the NO96 insulation boxes into the cover plates of the boxes. The test results showed a very distinct change of indentation stiffness at a certain load level. For loads above this level, the load is still monotonically increasing for increasing indentation in the horizontal plate. For large indentations, however, fracture occurs in the face ply of the horizontal plate. In some of the tests a localised delamination and crushing of the face plies of the vertical plate could be observed, as illustrated in Figure 29.
Figure 29. Localised delamination and crushing of the face plies of the vertical plate.
3.5 Structural response assessment
3.5.1 General Analysis of the dynamic response of the tank insulation system due to the sloshing impact loads is governed by the time and spatial variation of the sloshing loads and the structural properties of the insulation system. A simplified approach for the structural response analysis is proposed that represents the detailed dynamic response with reasonable accuracy under certain conditions. The simplified approach involves calculation of the dynamic response by multiplying the equivalent quasi-static response due to the peak impact load by a dynamic amplification factor (DAF):

Pastoor 26
systeminsulation of stiffnessl StructuraKload impact sloshingPeak P
factor ionamplificat Dynamic DAF systeminsulation tank of response static-quasi Equivalent R
systeminsulation tank of response Dynamic RKP
R
DAFRR
LNG
slosh
stat
dyn
LNG
sloshstat
statdyn
===
=
=
=
⋅=
Using this approach, the static response is determined first from quasi-static analysis. Dynamic amplification factors for a wide range of load time histories are then determined by running a large number of dynamic finite element analyses, and comparing the resulting response with the corresponding quasi-static response. Appropriate DAF-curves are determined using the calculated factors, and the dynamic response is obtained using the results from the quasi-static analysis together with the DAF-curves.
3.5.2 Static response assessment The static response is determined by running a series of quasi-static, linear response analyses. Several load cases are considered, all with uniform pressure acting over a certain area. The load areas believed to be most critical with regards to the failure modes relevant for the containment system are selected. It is assumed that any spatial variation of sloshing pressure can be enveloped by considering uniform pressure acting over this set of critical load areas and positions. Temperature effects are included by specifying temperature-dependent material properties. A linear temperature profile is used across the height of the containment system. Two set of material properties are then specified, one for the room temperature case and one for the low temperature case. For intermediate temperatures, the material properties are assumed to be linearly dependent of the temperature. It is crucial that there is consistency between the chosen strength acceptance level and the response analyses. Since the strength acceptance level is such that deformations into the non-linear response regime is allowed for, this must also be reflected in the response analyses. For the NO96 system, the response is found to be close to linear until the point of collapse, and linear response analyses is therefore adequate. For the MKIII system, however, local inelastic deformations must be accounted for in the response analyses.
3.5.3 Dynamic response assessment A large number of detailed dynamic finite element response analyses of the tank insulation systems is carried out. Different load areas and rise times are considered, and the resulting responses are compared with the quasi-static response in order to derive a set of DAF-curves. Based on a review of the shapes of the recorded pressure histories of model tests, the sloshing impact history is idealised by a triangular pulse with a decay time of 1.5 times the pulse rise time, see Figure 30. The slightly skewed pulse shape is chosen in order to be on the conservative side, since the dynamic response resulting from this pulse is slightly higher than that resulting from a symmetrical pulse. The effect of the decay time is only significant, however, for very fast pulses.

Pastoor 27
Figure 30. Idealisation of sloshing impact pulse.
The pressure pulse is thereby uniquely described by the magnitude of the peak pressure and the pulse rise time, Tr. These parameters are to be determined from scaled-up results of sloshing model tests. The pulse rise time is an uncertain parameter, due to the scaling from model scale to full scale and differences in gas/liquid density ratios between experiment and application. In addition, the post-processing of the sloshing test results adds to the uncertainty, since it is not obvious how the rise time of an actual pressure pulse should be defined. In order to reduce the consequence of this uncertainty, a design DAF curve is used instead of the actual calculated DAF curves. The Dynamic Amplification Factor to be used for the containment systems is a function of the Tr/Tn ratio, Tr being the rise time of the pressure pulse considered, and Tn being the natural period of the containment system for a specific structural configuration and loadcase. When the natural period is calculated, the temperature effect must be accounted for. Low temperature implies increased material stiffness, and thereby a reduced natural period. The design DAF curve is taken as a piecewise linear function of the pressure pulse rise time. A piece-wise linear curve is used because of the uncertainties involved in determining the rise time of the pressure pulse. Due to this uncertainty, the design curve is specified to envelope the maximum-points on the actual calculated DAF-curves. The design DAF curve is illustrated in Figure 31, together with an actual DAF curve calculated for a single degree of freedom system. For a specific containment system, the dynamic amplification of the response will vary with the position of the response variable. In general, the DAF increases with the distance from the load surface. Therefore, for each containment system considered, one design curve is specified for the upper part, one for the middle part, and one for the lower part of the system.
Tr 2.5Τr
p
t

Pastoor 28
0 0.5 1 1.5 2 2.5 3Rise time/Natural period
DAF (-)
SDOF curve
Design curve
Figure 31. Illustration of design curve for dynamic amplification factor (DAF).
3.6 Development of strength criteria
3.6.1 General The results from the experimental strength investigations summarised in Sec.3.4 can generally not be applied directly in the development of the strength criteria. The results must be supplemented by existing knowledge, available literature, and finite element analyses to interpret the experimental results in terms of the actual failure mode. Finite element analyses are used to relate the experimental results to the low temperature and high load rate dynamic operational conditions. The current knowledge is dominated by confidential documents provided to the Classification Society by the designer and license owner of the systems and can of course not be referenced or published. The failure criteria developed are generally quite simple. There has been little need for developing interaction equations to account for the simultaneous action of different stress components. An example is the shear strength tests presented in section 3.4.3, which revealed that the shear strength is unsensitive to simultaneously acting bending moment. Based on this, the strength criterion for this failure mode could be established by considering only the average shear stress across the thickness of the plywood plate. The strength criteria are for generality formulated on a partial safety factor format, as follows:
M
kkF
RTSFDSFSDAF
γγ
⋅⋅≤⋅⋅ , where
γF is the partial load factor
DAF is the dynamic response amplification factor
Sk is the characteristic quasi-static load response
γM is the partial resistance factor
DSF is the dynamic strength factor caused by either dynamic phenomena at either the material or the
structural level.
TSF is the temperature strength factor
Rk is the characteristic structural resistance

Pastoor 29
This equation is more conceptual than practical, since the temperature effect is implicitly present both in the response and the resistance, rather than as a separate factor. It serves as an overview, however, of the effects that must be taken into account in the strength criteria. The dynamic effects (DAF and DSF) and the temperature effect (TSF) are discussed in the next two sections. Then, examples of supplementary analysis work carried out to develop failure criteria for two potential failure modes are given.
3.6.2 Dynamic effects Dynamic effects enter the strength evaluation on both the response and the resistance side of the strength criteria. The response effect is treated using dynamic amplification factors, as discussed in Sec.3.5.3. A short discussion of the dynamic strength effects and the treatment of these effects is given below. There are in general two sources of dynamic strength effects that need to be considered in the sloshing strength problem:
1. Increase of material resistance due to high rate loading (strain rate dependent strength). 2. Increase of structural strength due to dynamic effects on the structural level.
Effect 1) is a characteristic of the material, and can only be determined through experimental measurements of the material behaviour. This effect is included for the foam, in which it is very distinct and significant. Finite element analyses have been carried out to better understand how to interpret the strain rate dependent strength in terms of non-uniform deformation histories in the material. Effect 2) is due to inertia effects for the second order out-of-plane response, and applies only to the problem of buckling of bulkheads of the NO96 insulation boxes. This effect has been studied by literature reviews and dynamic finite element analyses, and is briefly discussed in section 3.6.4.
3.6.3 Low temperature effects The temperature generally affects the stiffness and the strength of engineering materials. The plywood and polyurethane foam material used in the membrane type containment systems show significant stiffness and strength increase for decreasing operational temperature. The large operational temperature range in the LNG insulation application (-163°C - 20°C) increase the importance of this effect. The temperature therefore also enters the strength evaluation on both the response and the resistance side of the strength criteria:
- The static structural response must be obtained for material stiffness properties relevant for the temperature distribution through the thickness of the insulation panel.
- The dynamic amplification of the structural response depends on the temperature, since the temperature effect must be accounted for when the natural period of the system is calculated.
- The material resistance for a failure mode must be determined according to the temperature distribution through the thickness of the insulation panel.
- The buckling strength of the bulkheads must be determined according to the temperature relevant for each bulkhead.
3.6.4 Example – Criteria for buckling strength assessment of NO96 bulkheads The static buckling strength experiments carried out provide a basis for assessment of the buckling strength of the bulkheads in the NO96 containment system. In addition to the tests, a series of finite element analyses is carried out in order to investigate effects not included in the experiments. Based on the findings from tests and analyses, buckling strength criteria are established. The buckling strength is expressed using a buckling strength curve as illustrated in Figure 27, but with correction factors to account for the effect of

Pastoor 30
- End restraints imposed by the contact between the bulkhead and the top and bottom cover
plates of the boxes - Bending moment imposed by deformation of the top cover plate - Varying load area - Dynamic strength increase - Temperature strength increase
The end restraint effect is a result of the relatively large thickness/height-ratio of the bulkheads. When the ends of the bulkheads start to rotate, the horizontal plates will set up a counteracting bending moment. This effect will increase the buckling strength as compared to the simply supported case. It is found that the smaller the buckling load, the larger is the restraining effect. The reason is that the bending moment set up by the horizontal plates depends on the through-thickness stiffness of the plates. Tests have shown that this stiffness is quite non-linear, with a gradually decreasing tangent stiffness modulus for increasing through-thickness stress. The correction factor used to account for the end restraint effect is therefore a function of the buckling load, giving largest correction for the bulkheads with the lowest buckling load. For the end bulkheads in the primary box, the top cover plate has the opposite effect on the buckling strength. When the top plate is deformed due to the applied lateral pressure, a bending moment is enforced on the upper end of the bulkhead. This bending moment acts in the same direction as the rotation occuring due to the vertical load, and the buckling load is therefore reduced. This effect could be present for any of the bulkheads in the primary box if part loads are applied, but is most important for the end bulkheads due to the discontinuity of the plating at these locations. A bending-buckling interaction equation is used to account for the bending moment effect. The effect of varying load area was investigated by carrying out buckling strength experiments both for uniform loading and for load acting over only 10% of the length. In addition, finite element analyses were carried out for part loads acting on various intermediate areas, as illustrated in Figure 32.
Figure 32. Illustration of part load buckling analysis.
The buckling load for a partly loaded bulkhead is increased as compared with a uniformly loaded bulkhead, due to the re-distribution of the stress from the load point and downwards. Based on the results from the tests and analyses, a correction factor for the part load effect is derived. This factor is a function of the bulkhead height, the bulkhead width, and the load width. The correction factor gives a reduced slenderness for a partly loaded plate, and thereby increased buckling strength. The dynamic strength increase is due to inertia effect on the out-of-plane deflection of the bulkheads. The eigenperiod of the out-of-plane deflection is much larger than the eigenperiod of the in-plane deflection. Therefore, if the load pulse is fast enough, the bulkhead will not have time to buckle out of the plane, even for loads that are higher than the static buckling strength. This effect is investigated by running a series of dynamic buckling analyses. One example is illustrated in Figure 33.

Pastoor 31
0.00 0.01 0.01 0.02 0.02 0.03 0.03Time (s)
Load
t=1.25mst=2.5mst=5mst=10mst=50ms
Figure 33. Results from dynamic buckling analyses for various rise times.
By comparing the dynamic buckling load with the static buckling load, a dynamic strength factor (DSF) is derived. Based on the results, a design DSF curve is made, as was done for the DAF. The design DSF curve is illustrated in Figure 34. It is seen that the DSF is a function of the tr/Te, tr being the response rise time for the vertical stress in the bulkhead and Te being the eigenperiod of the out-of-plane deflection of the bulkhead. It should be noted that the rise time of the stress response is generally not the same as the rise time of the pressure pulse. In addition, the magnitude of the DSF depends on the slenderness of the bulkhead. The temperature effect on the buckling strength is accounted for by simply adjusting the stiffness properties of the material. Low temperature gives increased stiffness, which gives reduced slenderness and increased buckling strength.
Figure 34. Illustration of design curve for dynamic strength factor (DSF).
3.6.5 Example – Strength of NO96 primary/secondary bulkhead crossing The load transfer from the loaded primary box to the supporting secondary box of the NO96 system occurs mainly at the locations where the orthogonal vertical bulkheads cross, as indicated in Figure 35. The bulkheads are not in direct contact, but are separated by the cover plate of the secondary box, the bottom plate of the primary box, and the secondary membrane. Because of the high and localised stress at the bulkhead crossings there is a risk that the bulkhead plates will penetrate and damage the cover plates of the boxes, and also that the bulkhead plates themselves will be damaged. The former will lead to increased flexibility and deformation of the
1
f1(λ)
0.55 1.5
DSF
tr/Te
f2(λ)

Pastoor 32
structure under loading. The latter may in addition potentially lead to a reduction of the buckling capacity of the bulkheads. The test relevant for this failure mode is the plywood plate indentation test presented in Sec. 3.4.6. The results can, however, not be applied directly for this failure mode. Detailed finite element analyses of the bulkhead crossings, as illustrated in Figure 36 have been carried out to facilitate the interpretation of the test results. Linear elastic analyses have been carried out to determine a stress concentration factor for the crossings for potential use in comparison with strength values obtained from the laboratory tests.
Figure 35. Identification of the load-transferring intersections between bulkheads in the primary and the secondary insulation
boxes.
Analyses using non-linear material properties have also been carried out to study the redundancy of the crossings, i.e. its ability to distribute the forces over larger cross-sectional regions as the inelastic deformations grow locally. The analyses show that the load distribution capabilities of the crossing detail are very limited because of a high relative flexibility of the horizontal plates compared to the crossing.
Figure 36. Finite element model used to study the stress concentration at the bulkhead crossings.

Pastoor 33
4 SLOSHING ASSESSMENT PROCEDURE As depicted in Figure 1 the sloshing load and response R&D projects develop the required new competence to develop a dedicated Class Note on LNG sloshing in membrane tanks. This Class Note has as main objective to provide guidance to conduct sloshing assessments for three applications: • Large LNG carriers • Offshore offloading • Partially filled trading These three have distinct characteristics and are therefore treated separately although there are overlapping issues. Since there are no rules available (yet) for these three the guidance is to be as complete as possible in order to assist the user to develop sufficient documentation to request approval from the Class Society. A flowchart of the basic application of the Class Note is given in Figure 37, which is described in more detail subsequently. In principle a comparative approach is followed, which evaluates whether the sloshing loads or resulting responses for the larger carrier or the partially filled operation are equal or less than for the conventionally sized carrier design. The larger carrier or the partially filled carrier are designated target ship, while the conventionally sized carrier trading with a current, normal trading pattern is designated reference ship. The latter may also be called generic ship.
Figure 37 Sloshing assessment scheme
The first step in the assessment starts by defining the various Limit States and the specifications that are needed for the assessment.
Prismatic membrane
tank?
Apply Class Note
Approval request
Approval?
yes no
yes
Limit State Analysis & specifications
Design & operational conditions
Sloshing Analysis
Sloshing loads
Known containment
system? no
yes
Structural Safety Assessment
Strength Assessment
Analysis report
Need sloshing assessmemt

Pastoor 34
Limit States With respect to the Limit States that need consideration, are both the Ultimate and Fatigue Limit States obvious. It is believed that the Accidental Limit State can be important as well. Consider for example an offshore discharging re-gasification vessel moored to a buoy. In general this vessel lies only a limited time on site in a weather-vaning condition. Hence it might be reasonable to assume that severe beam wave conditions are unlikely to encounter and hence not part of the load sets for the ULS assessment. An ALS condition is typically defined in order to guarantee sufficient residual capacity when an accident or other unlikely event might though happen. In other words any event that is considered highly unlikely but however does occur might in fact not lead to a total loss or comparable consequences. Hence beam sea conditions for a low filling condition are advised to be defined in the ALS. (An ALS example is for example an offshore structure that is still required to be able to withstand a 10 years storm condition in the Gulf of Mexico while being damaged.) Wave environment A separate treatment of the three applications is furthermore necessary as the wave scatter diagrams are different. For the large LNG carrier typically the North-Atlantic scatter diagram is specified, while the spot trading tanker might require a specific scatter diagram for a target route. An offshore discharging vessel can be assessed using a site-specific scatter diagram. Loading condition The loading condition needs to be selected. At least two loading conditions should be selected for the ship motion calculation; fully loaded and ballast loaded. For a partially filled operation at least one partly loaded condition is to be selected if this can be identified as the worst condition otherwise more intermediate conditions are advised to be analysed. This does imply that only one tank filling is assessed. If the ship motions are significantly changed for various tank filling conditions these need to be taken into account. In practice this would mean that different motion RAOs are used corresponding to the filling level as tested during the sloshing tests. Tank selection/geometry If the most forward tank is of the same size as the rest of the tanks this tank should be used in the analysis, otherwise the no.2 is advised to be used. Ship speed For an assessment of a large carrier and a spot trading tanker typically two or three speeds are advised: manoeuvring speed, an average sustained speed in a seaway for FLS analyses (e.g. 2/3 or ¾ design speed) and a sustained speed for ULS analyses, for example ½ design speed. For an offshore discharging vessel zero speed and manoeuvring speed are advised. When the assessment is based on a comparative approach typically the beam sea conditions for the offshore discharging vessel might give severe sloshing loads, which in the evaluation are to be compared to the loads as experienced in the reference ship, a generic trading ship. Typically the largest sloshing loads for this generic ship occur in head waves with a filling of 95%. As seen in Figure 12 forward speed is an important parameter. By selecting a high forward speed for the generic ship a larger “margin” is obtained to allow the partially filled ship to operate with. Or in other words, by selecting an (unrealistic) high forward speed a non-conservative approach is followed for the assessment of a partially filled tank. Tank filling rates To determine design loads the test program should cover all filling levels within the ship operation. For unrestricted filling operation the following levels may be used initially; 10, 30%, 50%, 70%, 80%, 90% and 95%. Based on the results for these filling levels extra tests for intermediate filling levels might be necessary especially around 25% to 35% and from 90% to 97%. The resulting information from the first step in the assessment are a set of design and operational conditions, which form the basis for the subsequent sloshing analysis. The steps in this analysis are subsequently described.

Pastoor 35
Ship motion analysis The motions of the LNG tank are to be determined by a ship motion analysis; either by a model test program or by using a verified computer code. Important aspects are the calculation of surge and roll. Although the pitch motion in head waves is dominant for the sloshing motions, the surge motion is important as well. Not all computer codes, can handle the surge motion equation well, therefore a 3D code is preferred. The roll motion is of great influence on the sloshing motions in beam seas. Proper estimating the viscous roll damping is required in order to determine realistic roll motion amplitudes. Worst case screening Irregular time series of the tank motions can be generated using the ship motion transfer functions with specified wave spectra. It is advised to model sea states on a contour of Hs and Tz. This contour is chosen as that relevant for the prescribed ship lifetime or longer, e.g. a 20 or 40 years contour. In order to find the most critical sea state for a given speed, loading condition and filling level, a set of sea states on the contour is selected and assessed (tested). Typically these screening tests last 15 to 30 minutes (full scale). For partially filled operation a contour with lower return period might be used. As described in paragraph 2.1 the measured pressure histories need statistical post-processing to determine sloshing loads at specified probability levels and secondly to determine correlations between peak values, rise times, decay times and impulses. Based on this representative pressure pulses can be determined. As the probability curves can have significant differences in slope, see Figure 8, the reliability of estimating statistical values from these curves, like expected extremes, varies. Hence the test duration is to be chosen such that proper convergence of the statistical results is obtained. Design case analysis Based on the worst case screening process in the previous step a design sea state is identified and tested for a sufficiently long duration. Determine long-term correction factor In principle the comparative approach as outlined so far is focussing on an assessment for worst case storm conditions, which means it analyses a short-term sea state only. As said in paragraph 2.2.4 there is an implicit precondition behind this approach stating that the ratio of the resulting sloshing loads from this short-term assessment is equal to the ratio of the design sloshing loads, which would be obtained if a complete long-term sloshing analysis would be performed. If there is doubt that this precondition holds some further sloshing analyses might be necessary to evaluate this in more detail. An approach could be to conduct an extra set of sloshing tests for sea states with lower significant wave heights but identical wave periods as the identified design sea state. By combining the results and the probability of occurrence for these sea states from the scatter diagram a rough assessment or estimate can be made of the difference in long-term design values for the reference and target ships. To support the discussion a simple example is shown based on the sloshing experiments as described in chapter 2. From these experiments it was shown that the expected largest pressures to occur in less severe sea states decrease only slightly for lower filling cases in beam seas, whereas a more-or-less linear relation is seen for high fillings in head seas. Figure 38 illustrates this effect. From this it is easily understood that the ratio of the results for a short-term and for a long-term assessment are different for a high filling case in head waves and a low filling case in beam seas. If the high-filling case would represent the reference ship and the low filling case the target ship a comparative approach based only on direct comparison of the short-term results is improper.

Pastoor 36
0.0
0.2
0.4
0.6
0.8
1.0
0.0 0.2 0.4 0.6 0.8 1.0Hs / Hs-20yrs
Pre
ssur
e 3-
hrs
/ Pre
ssur
e 3-
hrs-
20yr
s
low filling - beam seas
high filling - head seas
Figure 38 Short-term expected extreme pressure for varying wave heights and filling level
In addition to the above discussion it should be noted that the situation can become even more different as the shapes of the exceedance probability functions for sloshing impact pressures for high filling and low filling can be significantly different, as pictured in Figure 8. This affects the ratio of the short-term and long-term design values. Consequently, if the two effect described here are important for the case under investigation it needs to be accounted for by a correction factor in the comparative approach study based on short-term sea state comparisons. Having conducted all the sloshing analyses, the results are used in a comparative evaluation. This evaluation is based on a comparative strength assessment. The development of this is on-going when writing this paper and is not further discussed. Readers are reverted to the Class Note due to be issued or subsequent papers. The results of the experiments and analysis is to be reported and can form the basis to request an Class approval.
5 FULL-SCALE SLOSHING MEASUREMENTS As outlined in the introduction sloshing has become and important issue in the past years. Increasing LNG carrier sizes and the need for ship-owners to operate with partially filled tanks for spot-trading and offshore offloading has triggered an enormous amount of R&D into the sloshing phenomenon by the oil & gas companies, yards and Class Societies. In the previous chapters is sketched what Det Norske Veritas has been working on in order to develop sufficient new competence and the required guidance for the industry. Although a large effort has been undertaken a number of aspects or phenomena are still under discussion and difficult to fully clarify and grasp in a practical guideline. Based on these reasons and as a response to market requests DNV has designed in the past period of time a full-scale sloshing measurement program in order to obtain a full-scale sloshing measurement validation database. The objectives of a full-scale measurement program are: • Development of a full-scale LNG sloshing measurement system • Obtain full-scale validation data • Validate sloshing assessment procedure Of prime interest is of course the measurement of sloshing pressures. Traditional pressure sensors cannot be used inside the containment system, hence a new sensor has been developed and qualified. The newly developed sensor is based on fibre-optic measurement technique and consists of a thin-walled circular plate with the fibre-optic sensor mounted on the circular edge. By pressing on the plate it widens and the elongation of the fibre on the perimeter can very accurately be measured and can be calibrated to provide the acting pressure on the plate.

Pastoor 37
DNV has provided experimental testing at the DNV Laboratories to qualify the sensor for the intended use, see pictures below. These tests comprised among others; uniform load test, partial load tests, bending tests, hammer tests, test while mounted inside an insulation box, temperature fluctuation tests and cryogenic tests. A final test was done with a small sensor mounted inside the 1:20 scaled sloshing tank as described earlier in chapter 2. The measured pressures were compared with conventional piezo-electric type pressure sensors mounted in a mirror tank position. Statistical post-processing of both measurements should good comparison, see Figure 39.
0.00010
0.00100
0.01000
0.10000
1.000000 1 2 3 4 5 6
Froude-scaled pressure [bar]E
xcee
danc
e pr
obab
ility
Fibre-optic sensorConventional piezo-electric (cluster)
Figure 39 Comparison of fibre-optic pressure sensor measurement with conventional piezo-electric sensors
Figure 40 Example of fibre-optic pressure sensor qualification
test – uniform loading test
Figure 41 Example of fibre-optic pressure sensor qualification
test – partial loading test
Figure 42 Example of fibre-optic pressure sensor qualification
test – sensor positioned on top of a GTT MkIII box
Figure 43 Example of fibre-optic pressure sensor qualification
test – sensor testing under cryogenic conditions
As said the main objective with a full-scale measurement program is to obtain validation data. Hence it is believed of vital importance to integrate the full-scale measurements with sloshing load and structural response assessments, see Figure 44.

Pastoor 38
Figure 44 Full-scale measurement and analysis structure
In order to be able to perform the analyses and validation as depicted in Figure 44 strain measurements in the containment structure and hull support structure need to complement the sloshing pressure measurements. Mounting of a sloshing pressure and strain gauges inside a containment box requires a modification of the box. A proper design of this and a qualification of this measurement set-up is a pre-requisite for a sound measurement campaign. As said often “measuring is knowing”, however this is only applicable if “you know what you are measuring”… Furthermore this test-up need to be qualified for approval by the containment licensor and the Classification Society. A typical installation lay-out will comprise at least a set of instrumented containment boxes inside tank no. 2 at positions likely to encounter the highest sloshing loads, see Figure 9 and Figure 10.
6 CONCLUSIONS An overview has been presented of the R&D developments DNV is working on to build new competence to assess LNG sloshing in new LNG carriers, partially filled trading carriers and offshore discharging vessels. The work has been focussed on the sloshing loads and structural responses. In order to obtain validation data a full-scale sloshing measurement program has been designed. All the R&D work is used to develop a guideline for the industry which is planned to be issued before spring 2005. This guidance will be written in the form of a Class Note and is to provide guidance for the applications as described above. Further work Most of the experimental and analytical work needed to create a basis for strength assessment of membrane type containment systems for LNG is completed at the time of submittal of this paper. The on-going work aims at developing and documenting a detailed and integrated procedure for practical execution of the strength evaluation. This includes items such as:
- Application of load history statistics for the reference case for idealisation of impact pressure
pulses in terms of pressure magnitudes and pulse rise times. - Determination of dynamic amplification factors (DAF’s) based on relevant pressure pulse rise
times. - Determination of dynamic strength factors (DSF’s) based on relevant response rise times. - Case studies of various targes cases (new tank configurations and filling levels), in order to
evaluate the practical consequences of the proposed strength assessment procedure.
6-DOF sloshing experiments
Full scale measurements
Structural strength analyses
Verified guideline for sloshing load & response
Sensor and instrumentation development

Pastoor 39
Another and separate item that requires future attention is the strength of the inner hull structure of the LNG carriers supporting the sloshing exposed containment systems. The main concern is the high and relatively widely spatially distributed sloshing impact loads observed in particular for low and intermediate filling levels, but also for 70-80% filling in beam sea conditions. The sloshing impact loads for high filling levels are very limited in spatial extent and therefore represent a relatively small total force on the inner hull, even though the pressure magnitude may be very high. A pilot study on hull structure sloshing impact strength was carried out in DNV in 2004. The structural response of the tanktop (95% filling) and the tank side (70% filling) was investigated under the action of experimentally measured sloshing loads. This work will be pursued further this year. REFERENCES [1] Clifton-Samuel, J. (2004) “Technical and operational challenges facing the LNG shipping
industry – advancing into a new era”, Proceedings of the 17th annual Lloyd’s shipping economist Ship Finance 2004, London.
[2] Cook, J. (2004) “Global LNG markets: an overview”, SNAME Texas conference, “LNG: from source to market”, Houston.
[3] Larsen, B.O., Markussen, B.K. (2004) “SRV – the LNG Shuttle and regas vessel system”, Proceedings of the 35th Offshore Technology Conference, paper no. OTC 16580, Houston.
[4] SNAME Texas conference, “LNG: from source to market”, Houston. [5] RINA conference on design and operation of gas carriers, London, September 2004. [6] Lindemark, T., Kamsvåg, F., Valsgård, S.(2004) “Fatigue Analysis of Gas Carriers”, RINA
conference on design and operation of gas carriers, London, September 2004. [7] Oh, B.T., Hong, S.H., Yang, Y.M., Yoon, I.S., Kim, Y.K. (2003) “The development of KOGAS
membrane for LNG storage tank”, Proceedings of ISOPE conference, Honolulu Hawaii, 2003. [8] Faafeng, K., Karlsen, T. (2004) “The next generation LNG tank containment system and lng
carrier designs”, Proc. 14th Offshore Symposium, LNG: from source to market, SNAME Texas, Houston.
[9] Noble, P., Levine, R., Colton, T (2004) ”Planning the design, construction and operation of a new LNG transportation system – ships, terminals and operations”, RINA conference on design and operation of gas carriers, London.
[10] Venner, F. (2004) “Condition assessment program for LNG carriers”, RINA conference on design and operation of gas carriers, London, September 2004.
[11] Pitblado, R.M., Baik, J., Hughes, G.J., Ferro, C., Shaw, S.J. (2004) “Consequence of LNG marine incidents”, CCPS conference, Orlando.
[12] Abramson, H.N., Bass, R.L., Faltinsen, O., Olsen, H.A. (1974) ”Liquid slosh in LNG carriers”, 10th Symposium on Naval Hydrodynamics, Boston.
[13] Berg, A. (1987) “Scaling laws and statistical distributions of impact pressures in liquid sloshing”, Det Norske Veritas, Technical Report no. 87-2008.
[14] Lee, H., Kim, J.W. Kim, Hwang, C. (2004) “Dynamic strength analysis for membrane type LNG containment system due to sloshing impact load”, RINA conference on design and operation of gas carriers, London.
[15] Rognebakke, O.F., Faltinsen, O.M. “Sloshing induced impacts in rectangular tanks with a high filling ratio”, Centre for Ships and Ocean Structures, NTNU, Trondheim, To be published.
[16] Loots, E., Pastoor, W., Buchner, B., Tveitnes, T. (2004) “The numerical simulation of LNG sloshing with an improved volumne of fluid method”, Proceedings of the 23rd OMAE conference, paper no. 51085, Vancouver.
[17] Smogeli, H.A. (2004) "Vibration Excitation from Slow Speed Large Bore Diesel Engines in LNG Carriers. Consequences for Containment Systems." SNAME Texas conference, “LNG: from source to market”, Houston.
[18] Pastoor, W. Tveitnes, T., Valsgård, S., Sele, H.O. (2004) “Sloshing in partially filled LNG tanks – an experimental survey”, Proceedings of the 35th Offshore Technology Conference, paper no. OTC 16581, Houston.
[19] Tveitnes, T., Østvold, T., Pastoor, W., Sele, H.O. (2004) “Sloshing in partially filled LNG tanks – an experimental survey”, Proceedings of the 35th Offshore Technology Conference, Houston.

Pastoor 40
[20] Det Norske Veritas (1995) “Buckling Strength Analyses”, DNV Classification Notes No. 30.1, July 1995.
AUTHORS Wouter Pastoor, Ph.D., is working as a senior engineer at Det Norske Veritas. He is mainly working on development projects to improve prediction and assessment methods for ship motions and loads for both fatigue, ultimate loading and seakeeping assessments of ships. Currently, he is project manager for LNG R&D projects and coordinates technical competence building on LNG. Other activities are concentrated on consultancy studies on behalf of clients and DNV Classification. Tom Klungseth Østvold, M.Sc., is working as a senior engineer at Det Norske Veritas. He is mainly working on development projects to improve calculation procedures and acceptance criteria for ultimate strength assessment of (ship) structures. Currently he is working as task leader on strength assessment of LNG cargo containment systems and tank structures exposed to sloshing impact loads. Other activities include strength assessment consultancy studies on behalf of clients and DNV Classification. Eirik Byklum, Ph.D., is working as a senior engineer at Det Norske Veritas. He is mainly working with development of procedures and calculation tools for ultimate strength assessment of marine structures. Currently he is working on strength assessment of LNG cargo containment systems and tank structures exposed to sloshing impact loads. He is also involved in strength assessment consultancy studies on behalf of clients and DNV Classification. Sverre Valsgård, Ph.D., is a Senior Principal engineer at Det Norske Veritas and is currently working with LNG/CNG carrier marketing and development and has more than 30 years of experience from DNV on consultancy and R&D on ships and offshore structures as well as experience from management positions. He has worked with and been responsible for structural analysis of marine structures, Finite Element analysis (linear and non-linear), buckling, collapse and integrity of structures, collision and grounding, fatigue and fracture and has been involved in all current LNG systems as well as the new CNG/PNG designs.