slope failures in tropical residual soils - … · chapter 5 slope failures in tropical residual...
TRANSCRIPT
CHAPTER 5
Slope failures in tropical residual soils
Liew Shaw-Shong Gue & Partners Sdn Bhd, Kuala Lumpur, Malaysia
Six case histories of landslides in three cut slopes, two filled slopes and one natural slope in Malaysia with underlying formations of post-glacial deposits, weathered soils derived from igneous rocks, meta-sedimentary and sedimentary formations have been investigated and will be presented in this chapter. Investigating processes consisting of site reconnaissance, topography survey, subsurface investigation, laboratory testing, back-analyses, instrumentation scheme for slip surface detection and groundwater regime establishment will be discussed in detail. Rainfall records spanning the period before landslide incident till the end of investi-gation were gathered to reveal the relationship between the landslide and rainfall. Comparisons have also been carried out between the laboratory strengths interpreted from consolidated isotropically undrained triax-ial tests and direct shear box tests and the back-analyzed strengths from both conventional limit equilibrium stability analyses and finite element analyses. The c-φ strength reduction method is used in the finite ele-ment analyses for back-analyzing the mobilized strength of the slopes investigated. In some case histories, finite element analyses have successfully demonstrated the mechanism of progressive failure in the case study with high cut slopes, in which stress distribution within the slope body is highly non-uniform, particularly at the developed slip surface. Comprehensive instrumentation was implemented at certain sites to provide valuable information for investigation and to offer insight of the post-failure behavior of the distressed slopes. The back-calculated residual strengths of the failed slope are somehow deviated from the common residual strength correlation with the liquid limit and the clay size fraction.
5.1 INTRODUCTION
General Generally, it is more common to hear about failures in residual soil slopes than other types of geotechni-cal structures. Among the failed slopes, cut slopes are the top statistics except for some man made slopes, which are poorly engineered and constructed. Unlike the engineered filled slopes, the inherent variation of the earth material properties, geological structures, groundwater regime and the subsequent weathering processes in the materials of the cut slopes are usually unforeseen and difficult to be identified during the design. Following the failure in natural materials, this chapter will also discuss the failures on engineered filled slopes.
Characteristics of Residual Soils Common definitions of residual soil refer to it as the remaining depleted soil in which most soluble ele-ments in the soil have been dissolved. This, in fact, implies that residual soils are normally undergoing
extensive physical and chemical alteration through the processes called natural weathering. Weather-ing processes can result in various degree of gradual degradation or breaking down of the parent rock ma-terial from fresh rock to fine particles of clay size. Throughout the process, physical characteristics such as bonding, strength, permeability and density, will change drastically.
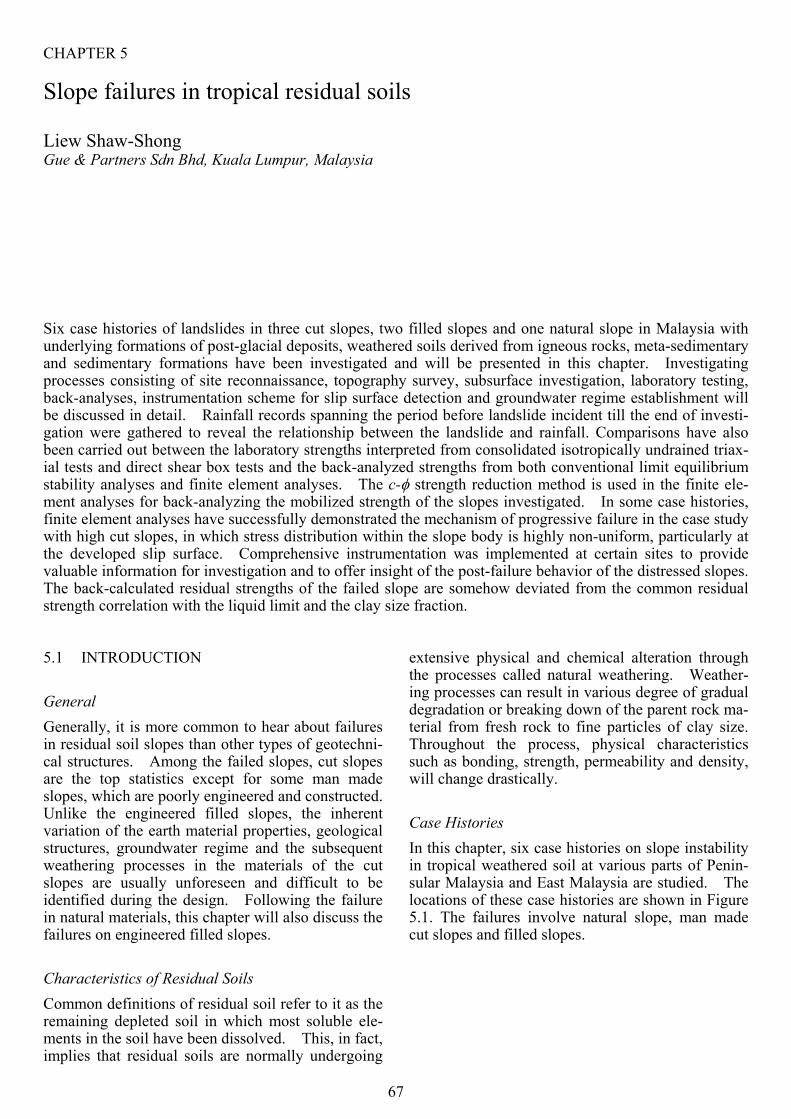
Case Histories In this chapter, six case histories on slope instability in tropical weathered soil at various parts of Penin-sular Malaysia and East Malaysia are studied. The locations of these case histories are shown in Figure 5.1. The failures involve natural slope, man made cut slopes and filled slopes.
67
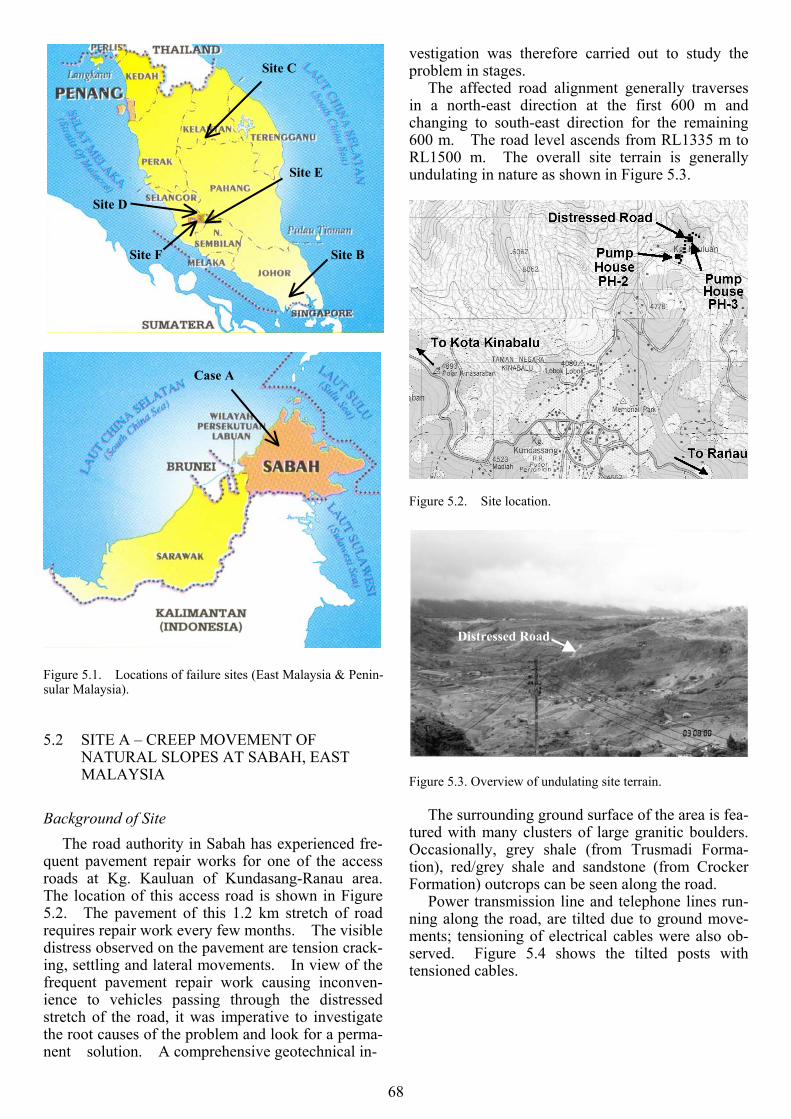
Figure 5.1. Locations of failure sites (East Malaysia & Penin-sular Malaysia).
5.2 SITE A – CREEP MOVEMENT OF NATURAL SLOPES AT SABAH, EAST MALAYSIA
Background of Site The road authority in Sabah has experienced fre-
quent pavement repair works for one of the access roads at Kg. Kauluan of Kundasang-Ranau area. The location of this access road is shown in Figure 5.2. The pavement of this 1.2 km stretch of road requires repair work every few months. The visible distress observed on the pavement are tension crack-ing, settling and lateral movements. In view of the frequent pavement repair work causing inconven-ience to vehicles passing through the distressed stretch of the road, it was imperative to investigate the root causes of the problem and look for a perma-nent solution. A comprehensive geotechnical in-
vestigation was therefore carried out to study the problem in stages. Site C
The affected road alignment generally traverses in a north-east direction at the first 600 m and changing to south-east direction for the remaining 600 m. The road level ascends from RL1335 m to RL1500 m. The overall site terrain is generally undulating in nature as shown in Figure 5.3. Site E
Site D
Figure 5.2. Site location.
Site F Site B
Case A
Figure 5.3. Overview of undulating site terrain.
Distressed Road
The surrounding ground surface of the area is fea-
tured with many clusters of large granitic boulders. Occasionally, grey shale (from Trusmadi Forma-tion), red/grey shale and sandstone (from Crocker Formation) outcrops can be seen along the road.
Power transmission line and telephone lines run-ning along the road, are tilted due to ground move-ments; tensioning of electrical cables were also ob-served. Figure 5.4 shows the tilted posts with tensioned cables.
68

Figure 5.4. Tilted electrical & telephone posts.
There is an abandoned pump house (PH-2) at the
left hand side after turning into the road and another pump house (PH-3) at the right hand side near the end of the affected chainage of the road as shown in Figure 5.2. These pump houses were built for the Mesilau Mini Hydro project as part of the irrigation scheme providing irrigation for horticulture in the Kundasang areas and was also intended to be the power scheme for Sabah Electricity Board (SEB). The Mesilau Mini Hydro project was commissioned in 1983 but has not been used since 1985. In Octo-ber 1987, a massive slip occurred and tilted the pump house, PH-2 and part of the pipeline. From the site observation, the pump house has suffered seri-ous distress due to differential settlement and lateral ground movements. Figure 5.5 shows the shear cracks on the wall as a result of the ground move-ments.
As a result of ground movement, the roadside
concrete drains on the higher ground also showed serious cracks due to shearing and tensioning. No indication of damage on drains due to compressive thrust at the lower passive zone was observed except some distortions of the T-junction concrete drain
sump. This is because the concrete drains were constructed within the active wedge areas where ten-sion cracks occur and probably did not extend to the passive wedge at the lower portion of the landslide masses. Repair works have been carried out to seal the cracked drain.
Tilted electrical/telephone posts
The road pavement along the affected chainage generally shows tension cracks, potholes and settle-ment and bearing capacity failure, probably due to weak subgrade as a result of ground movement. The rapid rate of distress on the pavement indicates that ground movements are still very active.
Topography & Geological Conditions The site is located at the toe of fan shaped deposits of Pinosuk Gravels from Mt. Kinabalu as shown in Figure 5.6. Rivers, namely Sg. Kuamanan, Sg. Mesi-lau, Sg. Tarawas and Sg. Mantaki, and their tributar-ies bisect the Pinosuk Plateau and form many gul-lies. The catchments of these rivers are shown in Figure 5.7. The overall gradient of the natural ground at the studied area is about 10°.
Figure 5.6. Deposition of Pinosuk Gravels. (Sarma & Komoo 2000)
Cracks
The studied area is surrounded by a number of
rivers namely Sg. Mesilau on the east and Sg. Kua-manan on the west. Most rivers near the studied area originate from Mt. Kinabalu and run towards south and south-eastern directions. These rivers bi-sect the post-glacial deposits by erosion process and form potentially unstable bisected fragments of soil masses.
Figure 5.5. Structural cracks on the wall.
The Kundasang-Ranau area is the only area in Malaysia which possesses a temperate climatic in this tropical country and a unique landscape formed by glaciation and ancient mudflow. These geologi-cal transportation processes have brought the depos-its even to Ranau, a small town 13 km from Kina-balu National Park.
69
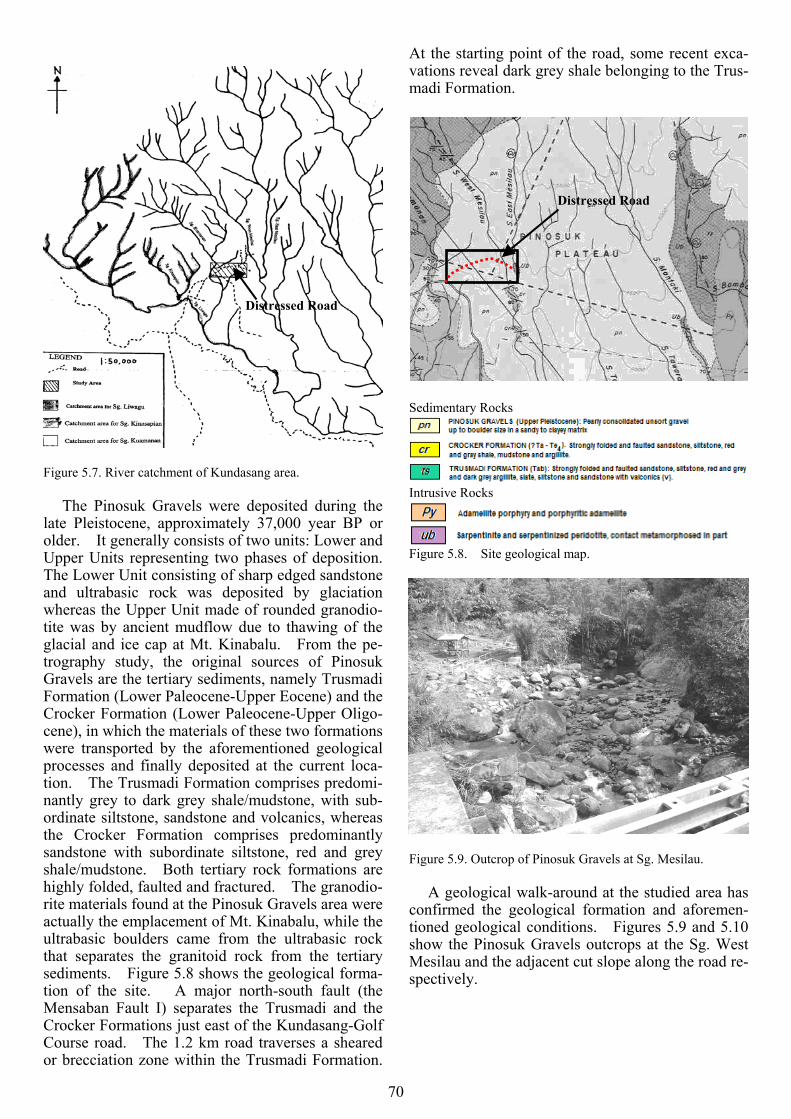
Figure 5.7. River catchment of Kundasang area.
The Pinosuk Gravels were deposited during the
late Pleistocene, approximately 37,000 year BP or older. It generally consists of two units: Lower and Upper Units representing two phases of deposition. The Lower Unit consisting of sharp edged sandstone and ultrabasic rock was deposited by glaciation whereas the Upper Unit made of rounded granodio-tite was by ancient mudflow due to thawing of the glacial and ice cap at Mt. Kinabalu. From the pe-trography study, the original sources of Pinosuk Gravels are the tertiary sediments, namely Trusmadi Formation (Lower Paleocene-Upper Eocene) and the Crocker Formation (Lower Paleocene-Upper Oligo-cene), in which the materials of these two formations were transported by the aforementioned geological processes and finally deposited at the current loca-tion. The Trusmadi Formation comprises predomi-nantly grey to dark grey shale/mudstone, with sub-ordinate siltstone, sandstone and volcanics, whereas the Crocker Formation comprises predominantly sandstone with subordinate siltstone, red and grey shale/mudstone. Both tertiary rock formations are highly folded, faulted and fractured. The granodio-rite materials found at the Pinosuk Gravels area were actually the emplacement of Mt. Kinabalu, while the ultrabasic boulders came from the ultrabasic rock that separates the granitoid rock from the tertiary sediments. Figure 5.8 shows the geological forma-tion of the site. A major north-south fault (the Mensaban Fault I) separates the Trusmadi and the Crocker Formations just east of the Kundasang-Golf Course road. The 1.2 km road traverses a sheared or brecciation zone within the Trusmadi Formation.
At the starting point of the road, some recent exca-vations reveal dark grey shale belonging to the Trus-madi Formation.
Distressed Road
Distressed Road
Sedimentary Rocks
Intrusive Rocks
Figure 5.8. Site geological map.
Figure 5.9. Outcrop of Pinosuk Gravels at Sg. Mesilau. A geological walk-around at the studied area has
confirmed the geological formation and aforemen-tioned geological conditions. Figures 5.9 and 5.10 show the Pinosuk Gravels outcrops at the Sg. West Mesilau and the adjacent cut slope along the road re-spectively.
70
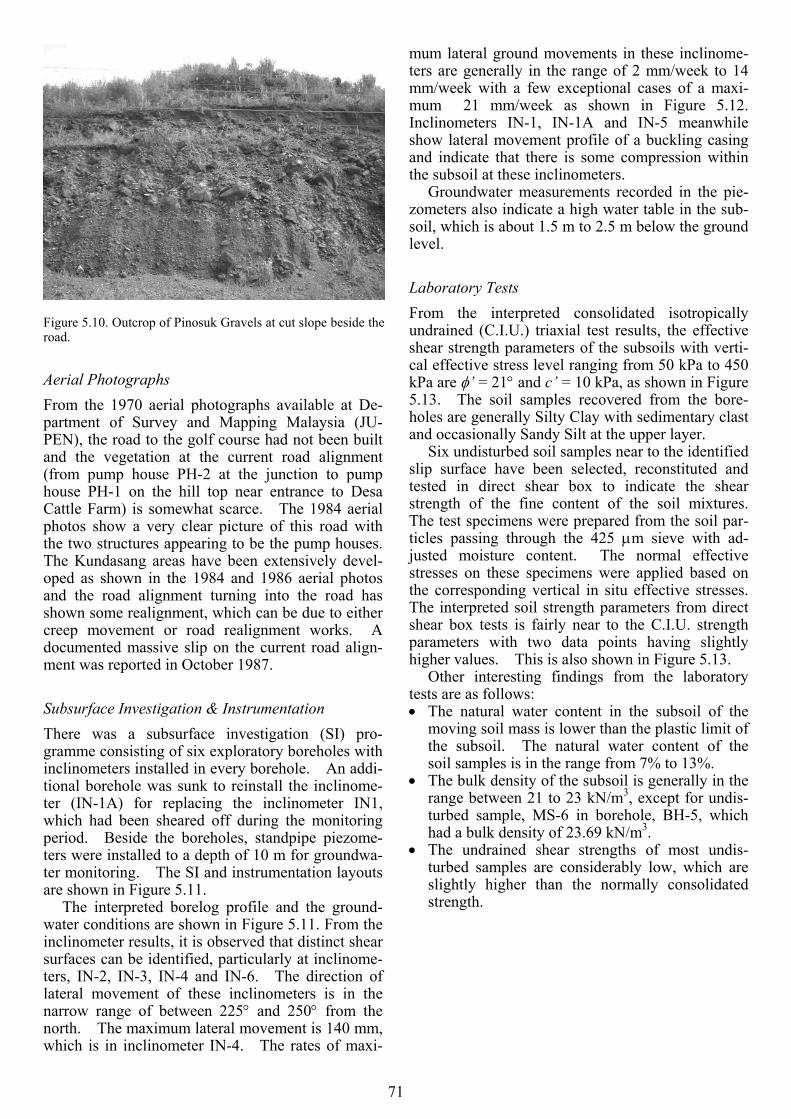
Figure 5.10. Outcrop of Pinosuk Gravels at cut slope beside the road.
Aerial Photographs From the 1970 aerial photographs available at De-partment of Survey and Mapping Malaysia (JU-PEN), the road to the golf course had not been built and the vegetation at the current road alignment (from pump house PH-2 at the junction to pump house PH-1 on the hill top near entrance to Desa Cattle Farm) is somewhat scarce. The 1984 aerial photos show a very clear picture of this road with the two structures appearing to be the pump houses. The Kundasang areas have been extensively devel-oped as shown in the 1984 and 1986 aerial photos and the road alignment turning into the road has shown some realignment, which can be due to either creep movement or road realignment works. A documented massive slip on the current road align-ment was reported in October 1987.
Subsurface Investigation & Instrumentation There was a subsurface investigation (SI) pro-gramme consisting of six exploratory boreholes with inclinometers installed in every borehole. An addi-tional borehole was sunk to reinstall the inclinome-ter (IN-1A) for replacing the inclinometer IN1, which had been sheared off during the monitoring period. Beside the boreholes, standpipe piezome-ters were installed to a depth of 10 m for groundwa-ter monitoring. The SI and instrumentation layouts are shown in Figure 5.11.
The interpreted borelog profile and the ground-water conditions are shown in Figure 5.11. From the inclinometer results, it is observed that distinct shear surfaces can be identified, particularly at inclinome-ters, IN-2, IN-3, IN-4 and IN-6. The direction of lateral movement of these inclinometers is in the narrow range of between 225° and 250° from the north. The maximum lateral movement is 140 mm, which is in inclinometer IN-4. The rates of maxi-
mum lateral ground movements in these inclinome-ters are generally in the range of 2 mm/week to 14 mm/week with a few exceptional cases of a maxi-mum 21 mm/week as shown in Figure 5.12. Inclinometers IN-1, IN-1A and IN-5 meanwhile show lateral movement profile of a buckling casing and indicate that there is some compression within the subsoil at these inclinometers.
Groundwater measurements recorded in the pie-zometers also indicate a high water table in the sub-soil, which is about 1.5 m to 2.5 m below the ground level.
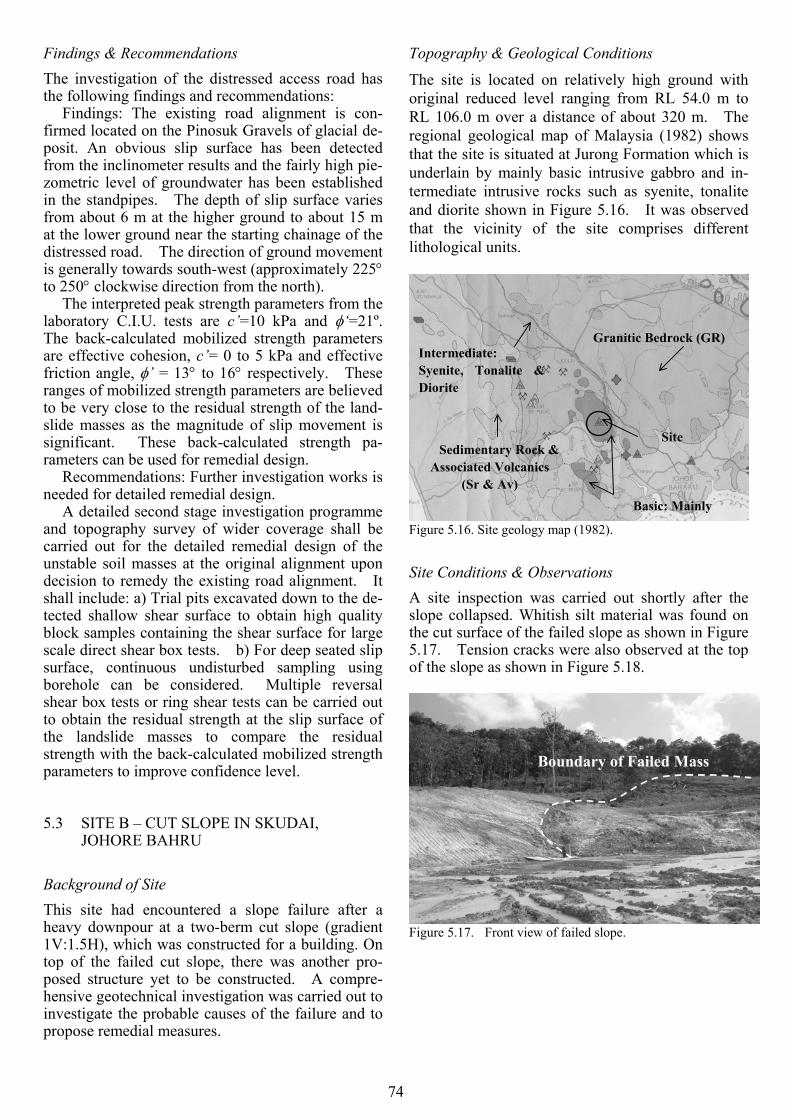
Laboratory Tests From the interpreted consolidated isotropically undrained (C.I.U.) triaxial test results, the effective shear strength parameters of the subsoils with verti-cal effective stress level ranging from 50 kPa to 450 kPa are φ’ = 21° and c’ = 10 kPa, as shown in Figure 5.13. The soil samples recovered from the bore-holes are generally Silty Clay with sedimentary clast and occasionally Sandy Silt at the upper layer.
Six undisturbed soil samples near to the identified slip surface have been selected, reconstituted and tested in direct shear box to indicate the shear strength of the fine content of the soil mixtures. The test specimens were prepared from the soil par-ticles passing through the 425 µm sieve with ad-justed moisture content. The normal effective stresses on these specimens were applied based on the corresponding vertical in situ effective stresses. The interpreted soil strength parameters from direct shear box tests is fairly near to the C.I.U. strength parameters with two data points having slightly higher values. This is also shown in Figure 5.13.
Other interesting findings from the laboratory tests are as follows: • The natural water content in the subsoil of the
moving soil mass is lower than the plastic limit of the subsoil. The natural water content of the soil samples is in the range from 7% to 13%.
• The bulk density of the subsoil is generally in the range between 21 to 23 kN/m3, except for undis-turbed sample, MS-6 in borehole, BH-5, which had a bulk density of 23.69 kN/m3.
• The undrained shear strengths of most undis-turbed samples are considerably low, which are slightly higher than the normally consolidated strength.
71

Figure 5.11. Subsoil profile and borehole layout.
VERTICAL ROAD
Sandstone
Premix
GravelSilt
Borehole Location
Sand
Clay
Fill Material
Major/Minor
Shale
Distance (m)
800
1300
0
0
0
SP T - N 5 0
RQ D( % )1 0 0
=
=
8
10
16
25
28
58
5161
82
93115
6012074
54118
125127
BH4 RL.1407.27m
Red
uced
Lev
el (m
)
RL.1401.30mBH3
RL.1372.52mBH5
RL.1353.96mBH6
188
120
125
114
120
32
2146363
75020
18
106
14
7
42
0
0
SP T - N 5 0
RQ D( % )1 0 0
=
=
58
167
82
250
78
36
46
2734
115150
34
375136
37
30
11
2412
9
1715
7
0
0
SP T - N 5 0
RQ D( % )1 0 0
=
=
1320
1330
1340
1350
1360
1370
1380
1390
1400
1410
1420
1430
1440
1450
1460
1470
BH1 RL.1460.35m
150
143
88
61
130
108
120
60
115
5078
136125
41
41
150136
15018
7
3
0
0
SP T - N 5 0
RQ D( % )1 0 0
=
=
100 200 300 400 500 600 700
1310
0
10
20
30
40
Dep
th (m
,bgl
)
0 -202040Lateral Disp (mm)
0
10
20Dep
th (m
,bgl
)
300 -2020406080
Lateral Disp (mm)
0 -2020406080Lateral Disp (mm)
Dep
th (m
,bgl
)
30
20
10
0
0
0
SP T - N 5 0
RQ D( % )1 0 0
=
=
5
13
16
19
15
40
57
60
500100
102
104
115
120
115
Lateral Disp (mm)160 120 80 40 0
Dep
th (m
,bgl
)
30
20
10
0
Lateral Disp (mm)20 10 -200 -10
Dep
th (m
,bgl
)
30
20
10
0
Lateral Disp (mm)40 20 -200
16/02/200109/02/200102/02/200126/01/200119/01/200112/01/200108/01/200129/12/200022/12/200015/12/200008/12/200002/12/200027/11/200017/11/200003/11/200027/10/200020/10/200006/10/200029/09/200023/09/200015/09/200008/09/200001/09/200025/08/200018/08/2000
%%UA-DIRECTION MOVEMENT
IN-1/1AINCLINOMETER
INCLINOMETER IN-2
INCLINOMETER IN-3
INCLINOMETER IN-4
INCLINOMETER IN-6
INCLINOMETER IN-5
Dep
th (m
,bgl
)
30
20
10
0
0
0
SP T - N 5 0
RQ D( % )1 0 0
=
=
10
11
23
31
33
31
44
46
44
106
125
112
115
150
125
115
115
BH2 RL.1434.45m
?
?
?
?
?
?
?
?
Horizontal Scale - 1:1600Vertical Scale - 1:500
Suspected Slip Plane
Slip Plane
? ?
METERN 66
5547
.046
E 7651
26.30
4
Ht 137
2.516
Ht 134
9.966
E 7650
24.18
2
N 6654
45.98
5
1330
1330
1330
1330
TP
1340
Culvert
TBM 11.28m. dia.
Ht 1335.679
E 764944.885
N 665386.793SIGNBOARD
BOARDSIGN
BOAR
DS I
GN
SIG
NBO
ARD
TP
1340
1340
L 41340.44
L 41340.44
0.75m. CONC. D
RA IN
TPTP
0.45m.DIA
CULVERTC
RAC
K TP 1
1350
1370
13691369
ROCK
1362
3113551355
CR
ACK
1350
CR
ACK
1 35876R
O CK
820114
1354
13531351
1350CRAC
K
1 35258191350C
RAC
K
12135678
1360
371364TP
METER
BH 6
PIEZON 66
5461
.848
Ht 135
3.957
E 7650
39.59
0
CRAC
K
1360651360
136049
TP
441370
37136813691368
811366
RO CK
59101362136345RO CK
46
1360
137013
60TP TP
2Ht 1
364.8
49
E 7650
83.95
5
N 6655
07.62
6PVCPIP
E
1370.32CRACK
TP 1.17m. DIA.CULVERT
CONC . DRAIN
1369 .92
2PVCPIPE
1370
1374
.492P
VCPIPE
1369
137184
1370664629137042
ROC KROCK
0.5m. STREAM
137013694369137113
7035 2413
7058897213
69421369B
H 5
1371
METALLED R
OAD
1370
138 6 .30
CRACK
PIEZO
TP
CRACK
1380
N 6655
71.59
4
E 76
5145
.167
Ht 1
378.4
38
TP 3
1380
1380
TP
CRACK
0.85m
. CONC. D
RAIN
ROCK
1385
91138613
84L 5
5707
TP 1390
1390
CRACK0.85m. CONC . D
RAIN
1390
TP
BH 3E 765236.570
Ht 1401.302
EP
TP
1400
0.85m. DIA.
1400
1400GRAVELLED ROAD
N 665665.4181.5m. STREAM
EPTP
2.8m. DIA.
CULVERT
1403.04
L 39TP
5714061406
CULVERT
1406
ROCK140735711406.60
L38
TP
14111410
1411
1410
961410
1410
LANDSLIDE
26111411
269214
1014
104516RO
CK52
1 4 1 1 .1 8
L 3 71411
ROCK1410TP
CULVERT2.8m . DIA.
19
141 3 .2 3
L 3 6082514
1377RO
CK14
13
1411950414
1114
113314116714
12
14167214
1667
1 4 1 6 .1 5
L 3 5
TP
1421
1420
1420
GULLY
142055L 341420 .34
STRE AM
R OC K
1420142414229433
1424 .23
L 33
TP
143014 30 .37L 3 2
1430TP
L 614 34 .81
T P
1460
14301430143074591430
194814
4014391439 1450
L 261453.40 1457.26
L 25
1490
M U SH R OOM
HOU SE
1470
1465.13L 23
PIEZOMETERN 665761.441
BH 1E 765564.831
Ht 1460.351
L 241461.03
1460
L 221470
1469.651474.94L 21
1470
T P
L 71480.571480
1480
L 201479.161482.51L 19
0.3m . W idth
C onc . D rain
1488.25L 17
1485.48L 18
TP 1480
CU
LVER
T
STORE
STR EAM
CRACK
BH 2E 765403.344Ht 1434.454N 665785.2981 43 4 .1 3L 31PIEZOMETERGULL Y
TP
1440
L 3 014 3 7.4 1143447143479
14 4 1.4 3L 2 9
TP
14 4 5.4 2L 2 8144493144338 9214 4 6ROCK
TP
0514 4 6SUM P1449.52L 27
1450
1450 GUL LYTP
TP 1460
1500
1490.74L 1614
90 1490
1493.44L 15S UMP
FENCE1490
1 49 5 .7 3L 14
S UMPL 1 01 49 5.3 3L 81494.87
(ON TOP OF MANHOLE)
N 665696.068
E 765862.194
Ht 1500.142
1497.76L 13
1500L 121499 .50TBM 2
TP
1500TPE
PM H15
00
1500
1500TP1499.84
L 9
EP
AoMAJO
R AXIS
D IRECTIO
N OF
AoDIR
ECTION O
F
MAJOR A
XIS
BH 4Ht 1
407.2
71
E 7652
88.77
6
N 6656
15.92
0
PIEZO
METER
(224 deg. N)
(218 d
eg. N
)
Ao(234 deg. N)
MAJOR AXIS
DIRECTION OF
(270 deg. N)DIRECTION OFMAJOR AXISAoAo(278 deg. N)
MAJOR AXISDIRECTION OF
MATCH LINE G-G
Scale 1: 5000
ALIGNMENT PROFILE
%%UMEASUREMENT DATE
BH2
BH5
BH4
BH3
N 665
547.0
46
E 765
126.3
04
Ht 13 72
.516
Ht 13 49
.966
E 765
024.1
82
N 665
445.9
85
1330
1330
1330
1330
1340
TBM 1Ht 1335.679E 764944.885N 665386.793
1340
1340
TP 1
1350
1370
1350
1350
136 0
BH 6N 66
5461
.848
Ht 135
3.957
E 76 50
39.59
0
1360
1370
1 3 60
1 37 0
1360
T P 2Ht 136
4.849
E 76 50
83.95
5
N 6655
07.62
6
1370
1370
BH 5
1370
1380
N 665 57
1.594
E 76 51
45.16
7
Ht 137
8.438
TP 3
1380
1380
1 390
1390
1390
BH 3E 7
6523
6 .570
Ht 14 01
.3 02
1400
1400
1400
N 6656
65.4 18
1410
14 1 0
1410
1420
14 20
1420
1430
1 430
1460
1430
1430
1 440 145 0
1 490
1470
N 665761.441
BH 1E 765564.831Ht 1460.351
1460
1470
14 70
1 480
1480
1480
BH 2E 765403.344Ht 1434.454
N 665785.298
1440
1450
145 0
1460
1500
1490
1490
1490
N 665696.068E 765862 .194Ht 1500.142
1500
TBM 2
1500
1500
1500
1500
Ao
Ao
BH 4Ht 1
4 07.2 71
E 765
288 .77
6
N 6656
15.9 20
A o
Ao
A o
MATCH LINE G
-G
72
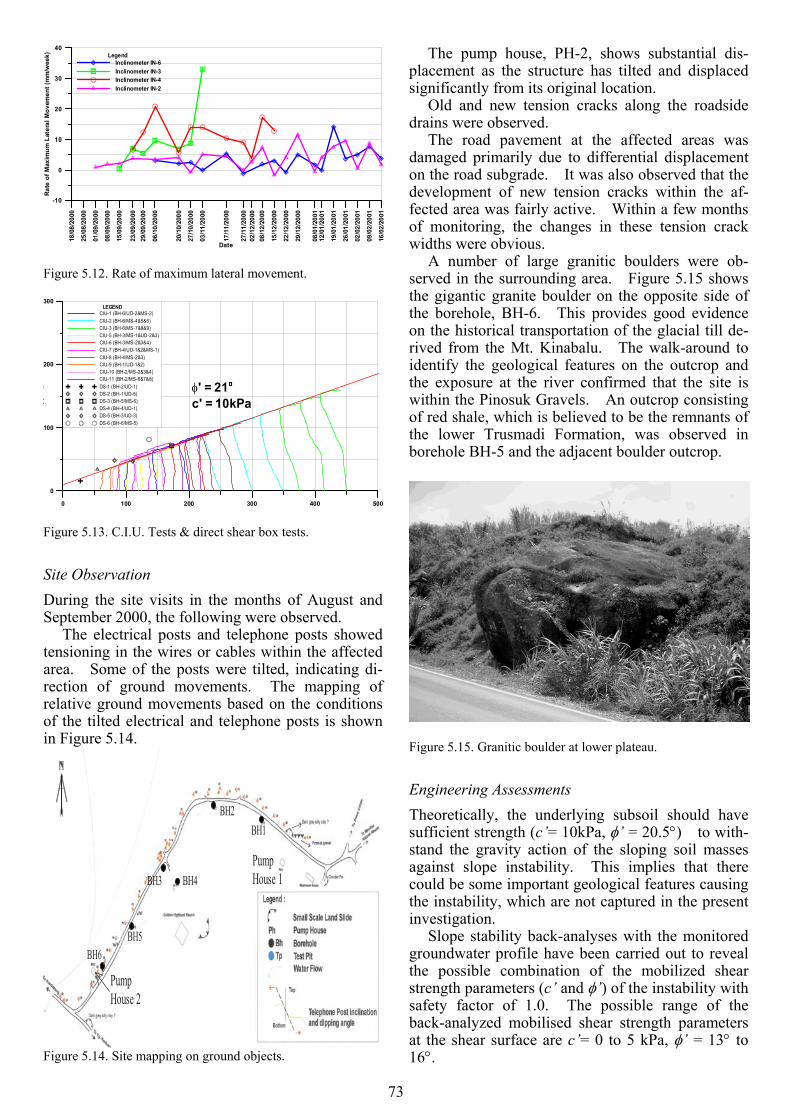
Figure 5.12. Rate of maximum lateral movement.
Figure 5.13. C.I.U. Tests & direct shear box tests.
Site Observation During the site visits in the months of August and September 2000, the following were observed.
The electrical posts and telephone posts showed tensioning in the wires or cables within the affected area. Some of the posts were tilted, indicating di-rection of ground movements. The mapping of relative ground movements based on the conditions of the tilted electrical and telephone posts is shown in Figure 5.14.
BH6 BH5
BH4
BH2
BH3
BH1
Pump House 1
Pump House 2
Figure 5.14. Site mapping on ground objects.
The pump house, PH-2, shows substantial dis-placement as the structure has tilted and displaced significantly from its original location.
18/0
8/20
00
25/0
8/20
00
01/0
9/20
00
08/0
9/20
00
15/0
9/20
00
23/0
9/20
0029
/09/
2000
06/1
0/20
00
20/1
0/20
00
27/1
0/20
00
03/1
1/20
00
17/1
1/20
00
27/1
1/20
0002
/12/
2000
08/1
2/20
00
15/1
2/20
00
22/1
2/20
00
29/1
2/20
00
08/0
1/20
0112
/01/
2001
19/0
1/20
01
26/0
1/20
01
02/0
2/20
01
09/0
2/20
01
16/0
2/20
01
Date
-10
0
10
20
30
40Ra
te o
f Max
imum
Lat
eral
Mov
emen
t (m
m/w
eek) Legend
Inclinometer IN-6Inclinometer IN-3Inclinometer IN-4Inclinometer IN-2
Old and new tension cracks along the roadside drains were observed.
The road pavement at the affected areas was damaged primarily due to differential displacement on the road subgrade. It was also observed that the development of new tension cracks within the af-fected area was fairly active. Within a few months of monitoring, the changes in these tension crack widths were obvious.
A number of large granitic boulders were ob-served in the surrounding area. Figure 5.15 shows the gigantic granite boulder on the opposite side of the borehole, BH-6. This provides good evidence on the historical transportation of the glacial till de-rived from the Mt. Kinabalu. The walk-around to identify the geological features on the outcrop and the exposure at the river confirmed that the site is within the Pinosuk Gravels. An outcrop consisting of red shale, which is believed to be the remnants of the lower Trusmadi Formation, was observed in borehole BH-5 and the adjacent boulder outcrop.
0 100 200 300 400 500
0
100
200
300
q(
)
LEGENDCIU-1 (BH-6/UD-2&MS-2)CIU-2 (BH-6/MS-4&5&6)CIU-3 (BH-6/MS-7&8&9)CIU-5 (BH-3/MS-1&UD-2&3)CIU-6 (BH-3/MS-2&3&4)CIU-7 (BH-4/UD-1&2&MS-1)CIU-8 (BH-4/MS-2&3)CIU-9 (BH-1/UD-1&2)CIU-10 (BH-2/MS-2&3&4)CIU-11 (BH-2/MS-6&7&8)DS-1 (BH-2/UD-1)DS-2 (BH-1/UD-5)DS-3 (BH-5/MS-6)DS-4 (BH-4/UD-1)DS-5 (BH-3/UD-3)DS-6 (BH-6/MS-5)
φ' = 21°c' = 10kPa
Figure 5.15. Granitic boulder at lower plateau.
Engineering Assessments Theoretically, the underlying subsoil should have sufficient strength (c’= 10kPa, φ’ = 20.5°) to with-stand the gravity action of the sloping soil masses against slope instability. This implies that there could be some important geological features causing the instability, which are not captured in the present investigation.
Slope stability back-analyses with the monitored groundwater profile have been carried out to reveal the possible combination of the mobilized shear strength parameters (c’ and φ’) of the instability with safety factor of 1.0. The possible range of the back-analyzed mobilised shear strength parameters at the shear surface are c’= 0 to 5 kPa, φ’ = 13° to 16°.
73
Findings & Recommendations The investigation of the distressed access road has the following findings and recommendations:
Findings: The existing road alignment is con-firmed located on the Pinosuk Gravels of glacial de-posit. An obvious slip surface has been detected from the inclinometer results and the fairly high pie-zometric level of groundwater has been established in the standpipes. The depth of slip surface varies from about 6 m at the higher ground to about 15 m at the lower ground near the starting chainage of the distressed road. The direction of ground movement is generally towards south-west (approximately 225° to 250° clockwise direction from the north).
The interpreted peak strength parameters from the laboratory C.I.U. tests are c’=10 kPa and φ‘=21º. The back-calculated mobilized strength parameters are effective cohesion, c’= 0 to 5 kPa and effective friction angle, φ’ = 13° to 16° respectively. These ranges of mobilized strength parameters are believed to be very close to the residual strength of the land-slide masses as the magnitude of slip movement is significant. These back-calculated strength pa-rameters can be used for remedial design.
Recommendations: Further investigation works is needed for detailed remedial design.
74
A detailed second stage investigation programme and topography survey of wider coverage shall be carried out for the detailed remedial design of the unstable soil masses at the original alignment upon decision to remedy the existing road alignment. It shall include: a) Trial pits excavated down to the de-tected shallow shear surface to obtain high quality block samples containing the shear surface for large scale direct shear box tests. b) For deep seated slip surface, continuous undisturbed sampling using borehole can be considered. Multiple reversal shear box tests or ring shear tests can be carried out to obtain the residual strength at the slip surface of the landslide masses to compare the residual strength with the back-calculated mobilized strength parameters to improve confidence level.
5.3 SITE B – CUT SLOPE IN SKUDAI, JOHORE BAHRU
Background of Site This site had encountered a slope failure after a heavy downpour at a two-berm cut slope (gradient 1V:1.5H), which was constructed for a building. On top of the failed cut slope, there was another pro-posed structure yet to be constructed. A compre-hensive geotechnical investigation was carried out to investigate the probable causes of the failure and to propose remedial measures.
Topography & Geological Conditions
The site is located on relatively high ground with original reduced level ranging from RL 54.0 m to RL 106.0 m over a distance of about 320 m. The regional geological map of Malaysia (1982) shows that the site is situated at Jurong Formation which is underlain by mainly basic intrusive gabbro and in-termediate intrusive rocks such as syenite, tonalite and diorite shown in Figure 5.16. It was observed that the vicinity of the site comprises different lithological units.
Figure 5.16. Site geology map (1982).
Intermediate: Syenite, Tonalite & Diorite
Sedimentary Rock & Associated Volcanics
(Sr & Av)
Site
Granitic Bedrock (GR)
Basic: Mainly
Site Conditions & Observations A site inspection was carried out shortly after the slope collapsed. Whitish silt material was found on the cut surface of the failed slope as shown in Figure 5.17. Tension cracks were also observed at the top of the slope as shown in Figure 5.18.
Figure 5.17. Front view of failed slope.
Boundary of Failed Mass

Tension cracks at slope crest
Figure 5.18. Tension cracks at top of slope.
Figure 5.19. Water seepage at berm.
Subsurface Investigation & Instrumentation Figure 5.19 shows water seepage at various loca-tions, indicating potential high groundwater level at the failed slope. Small boulders were also ob-served on the slope surrounding. The existence of boulders (diorite and gabbro) within the subsoil was further confirmed during the borehole exploration.
Subsurface investigation and instrumentation programmes consisting of ten boreholes, three incli-nometers, six observation wells and one standpipe piezometer were planned and implemented to inves-tigate the causes of failure, to propose remedial measures and for geotechnical design of the upper proposed building. The layout of the boreholes and instrumentations is shown in Figure 5.20. Three boreholes, namely BH-1, BH-2 and BH-3, were sunk within the failed mass. Upon completion of boring operation and sample collection, inclinome-ters, IN-1, IN-2 and IN-3 were installed in the bore-holes. Apart from the inclinometers, three observa-tion wells, OW-1, OW-2 and OW-3 were also installed at 1m away from boreholes BH-1, BH-2 and BH-3 respectively. The overburden material is generally weak, with SPT-N ranging from 0 to 15.
Water seepage at berm
Figure 5.20. Layout of borehole and instrumentation plan. When the inclinometers detected a slip surface
within the failed slope, an additional borehole, BH-10 was sunk 1m away from BH-2 to collect undis-turbed samples near the identified slip surface for laboratory strength tests. A standpipe piezometer, SP-1 was also installed in borehole BH-10 with a piezometer tip located at 11.0 m below ground sur-face, where the slip surface was identified.
Inclinometers IN-1 and IN-2 were sheared off at 10.5 m and 12.0 m below ground level shortly after installation. Subsequent monitoring revealed that inclinometer IN-2 was sheared off again at another higher location, at 6.0 m below ground level. Fi-nally, IN-3 was sheared off at 2.5 m below ground level. The first major slip surface was identified when the three inclinometers were sequentially sheared off. The three shear-off points of the incli-nometers resemble a well defined circular slip sur-face when joined together. The circular slip sur-face also agrees well with the tension cracks and bulging of the slope toe indicating where the slip surface starts and ends on the slope profile. The second shear off point at inclinometer IN-2 revealed another minor slip surface formed after the first ma-jor slip surface. The inclinometer results are shown in Figure 5.21, which shows the interpreted multiple slip surfaces in the failed slope. Figure 5.21 indicates that the collapsed mass experienced resul-tant movements towards the south-west direction.
The rates of maximum movement of the incli-nometers are shown in Figure 5.22 together with the daily and cumulative rainfall records. Inclinometer IN-2 registered the largest movement rate during the initial monitoring period as it was installed in the middle of the collapsed mass. The trend of move-ment rate for the other inclinometers was very simi-lar and consistent. The movement rate started with a peak and reduced gradually. However, during in-
75
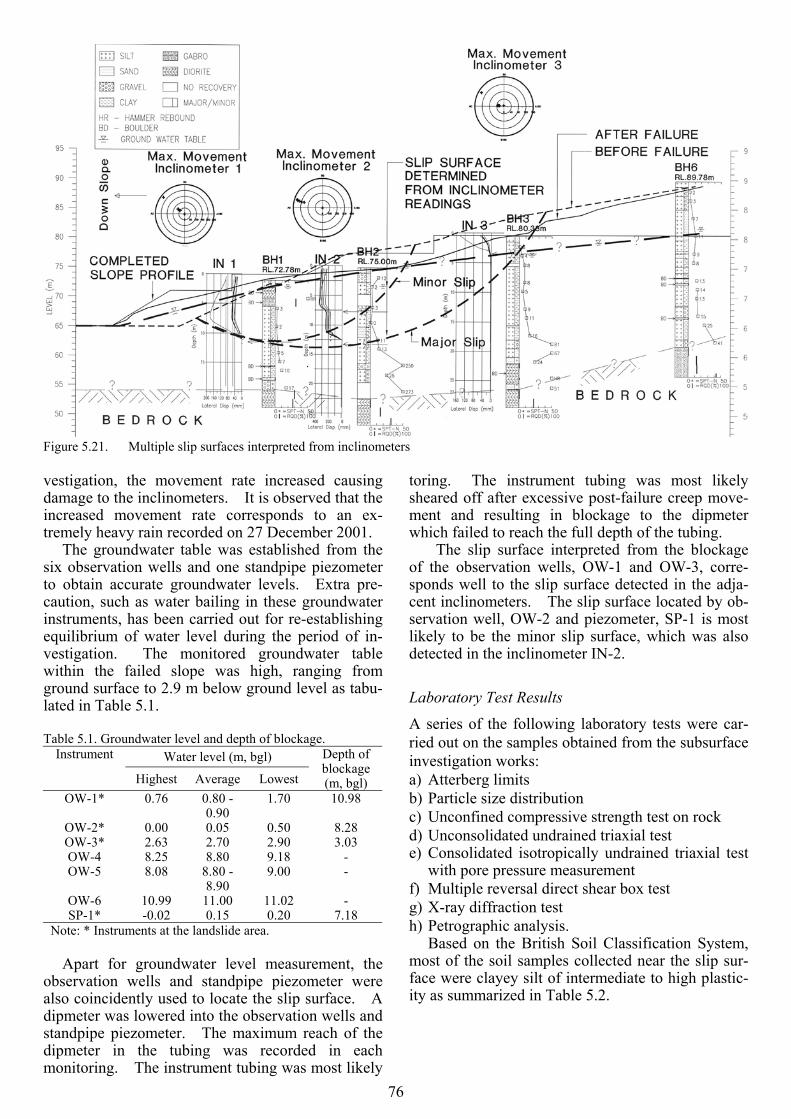
Figure 5.21. Multiple slip surfaces interpreted from inclinometers vestigation, the movement rate increased causing damage to the inclinometers. It is observed that the increased movement rate corresponds to an ex-tremely heavy rain recorded on 27 December 2001.
The groundwater table was established from the six observation wells and one standpipe piezometer to obtain accurate groundwater levels. Extra pre-caution, such as water bailing in these groundwater instruments, has been carried out for re-establishing equilibrium of water level during the period of in-vestigation. The monitored groundwater table within the failed slope was high, ranging from ground surface to 2.9 m below ground level as tabu-lated in Table 5.1. Table 5.1. Groundwater level and depth of blockage.
Water level (m, bgl) Instrument
Highest Average Lowest
Depth of blockage (m, bgl)
OW-1* 0.76 0.80 - 0.90
1.70 10.98
OW-2* 0.00 0.05 0.50 8.28 OW-3* 2.63 2.70 2.90 3.03 OW-4 8.25 8.80 9.18 - OW-5 8.08 8.80 -
8.90 9.00 -
OW-6 10.99 11.00 11.02 - SP-1* -0.02 0.15 0.20 7.18
Note: * Instruments at the landslide area. Apart for groundwater level measurement, the
observation wells and standpipe piezometer were also coincidently used to locate the slip surface. A dipmeter was lowered into the observation wells and standpipe piezometer. The maximum reach of the dipmeter in the tubing was recorded in each monitoring. The instrument tubing was most likely
toring. The instrument tubing was most likely sheared off after excessive post-failure creep move-ment and resulting in blockage to the dipmeter which failed to reach the full depth of the tubing.
The slip surface interpreted from the blockage of the observation wells, OW-1 and OW-3, corre-sponds well to the slip surface detected in the adja-cent inclinometers. The slip surface located by ob-servation well, OW-2 and piezometer, SP-1 is most likely to be the minor slip surface, which was also detected in the inclinometer IN-2.
Laboratory Test Results
A series of the following laboratory tests were car-ried out on the samples obtained from the subsurface investigation works: a) Atterberg limits b) Particle size distribution c) Unconfined compressive strength test on rock d) Unconsolidated undrained triaxial test e) Consolidated isotropically undrained triaxial test
with pore pressure measurement f) Multiple reversal direct shear box test g) X-ray diffraction test h) Petrographic analysis.
Based on the British Soil Classification System, most of the soil samples collected near the slip sur-face were clayey silt of intermediate to high plastic-ity as summarized in Table 5.2.
76
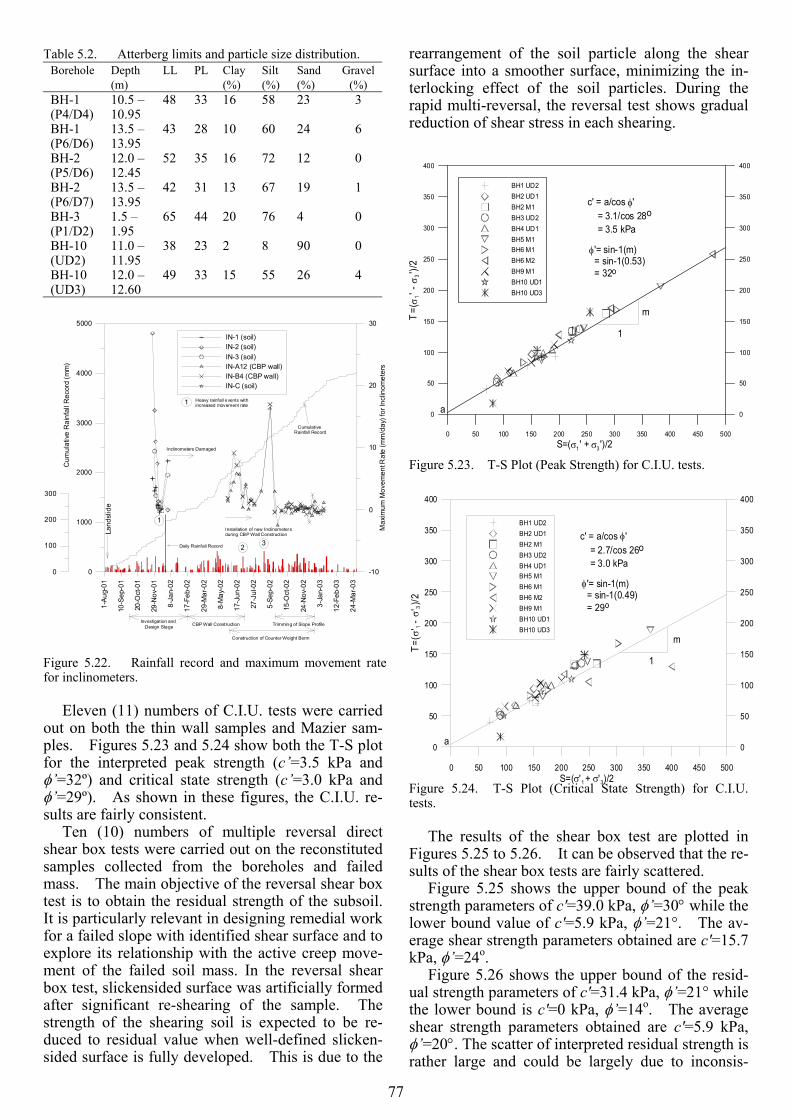
Table 5.2. Atterberg limits and particle size distribution. Borehole Depth
(m) LL PL Clay
(%) Silt (%)
Sand (%)
Gravel (%)
BH-1 (P4/D4)
10.5 – 10.95
48 33 16 58 23 3
BH-1 (P6/D6)
13.5 – 13.95
43 28 10 60 24 6
BH-2 (P5/D6)
12.0 – 12.45
52 35 16 72 12 0
BH-2 (P6/D7)
13.5 – 13.95
42 31 13 67 19 1
BH-3 (P1/D2)
1.5 – 1.95
65 44 20 76 4 0
BH-10 (UD2)
11.0 – 11.95
38 23 2 8 90 0
BH-10 (UD3)
12.0 – 12.60
49 33 15 55 26 4
Figure 5.22. Rainfall record and maximum movement rate for inclinometers.
Eleven (11) numbers of C.I.U. tests were carried
out on both the thin wall samples and Mazier sam-ples. Figures 5.23 and 5.24 show both the T-S plot for the interpreted peak strength (c’=3.5 kPa and φ’=32º) and critical state strength (c’=3.0 kPa and φ’=29º). As shown in these figures, the C.I.U. re-sults are fairly consistent.
Ten (10) numbers of multiple reversal direct shear box tests were carried out on the reconstituted samples collected from the boreholes and failed mass. The main objective of the reversal shear box test is to obtain the residual strength of the subsoil. It is particularly relevant in designing remedial work for a failed slope with identified shear surface and to explore its relationship with the active creep move-ment of the failed soil mass. In the reversal shear box test, slickensided surface was artificially formed after significant re-shearing of the sample. The strength of the shearing soil is expected to be re-duced to residual value when well-defined slicken-sided surface is fully developed. This is due to the
rearrangement of the soil particle along the shear surface into a smoother surface, minimizing the in-terlocking effect of the soil particles. During the rapid multi-reversal, the reversal test shows gradual reduction of shear stress in each shearing.
Figure 5.23. T-S Plot (Peak Strength) for C.I.U. tests.
13
Figure 5.24. T-S Plot (Critical State Strength) for C.I.U. tests.
1 3
The results of the shear box test are plotted in
Figures 5.25 to 5.26. It can be observed that the re-sults of the shear box tests are fairly scattered.
Figure 5.25 shows the upper bound of the peak strength parameters of c'=39.0 kPa, φ’=30° while the lower bound value of c'=5.9 kPa, φ’=21°. The av-erage shear strength parameters obtained are c'=15.7 kPa, φ’=24o.
Figure 5.26 shows the upper bound of the resid-ual strength parameters of c'=31.4 kPa, φ’=21° while the lower bound is c'=0 kPa, φ’=14o. The average shear strength parameters obtained are c'=5.9 kPa, φ’=20°. The scatter of interpreted residual strength is rather large and could be largely due to inconsis-
0 100 200 300 400 50050 150 250 350 450S=(σ'1 + σ'3)/2
0
100
200
300
400
50
150
250
350
T=(σ
'-
σ ')/2
BH1 UD2BH2 UD1BH2 M1BH3 UD2BH4 UD1BH5 M1BH6 M1BH6 M2BH9 M1BH10 UD1BH10 UD3
0
100
200
300
400
50
150
250
350c' = a/cos φ' = 2.7/cos 26o = 3.0 kPa
φ'= sin-1(m) = sin-1(0.49) = 29o
a
m
1
0 100 200 300 400 50050 150 250 350 450S=(σ1' + σ3')/2
0
100
200
300
400
50
150
250
350
T=(
σ' -
σ')/
2
BH1 UD2BH2 UD1BH2 M1BH3 UD2BH4 UD1BH5 M1BH6 M1BH6 M2BH9 M1BH10 UD1BH10 UD3
0
100
200
300
400
50
150
250
350c' = a/cos φ' = 3.1/cos 28o = 3.5 kPa
φ'= sin-1(m) = sin-1(0.53) = 32o
a
m
1
1-Au
g-01
17-F
eb-0
2
5-Se
p-02
24-M
ar-0
3
10-S
ep-0
1
20-O
ct-0
1
29-N
ov-0
1
8-Ja
n-02
29-M
ar-0
2
8-M
ay-0
2
17-J
un-0
2
27-J
ul-0
2
15-O
ct-0
2
24-N
ov-0
2
3-Ja
n-03
12-F
eb-0
3
0
1000
2000
3000
4000
5000
Cum
ulat
ive
Rai
nfal
l Rec
ord
(mm
)
0
100
200
300
-10
0
10
20
30
Max
imum
Mov
emen
t Rat
e (m
m/d
ay) f
or In
clin
omet
ers
IN-1 (soil)IN-2 (soil)IN-3 (soil)IN-A12 (CBP wall)IN-B4 (CBP wall)IN-C (soil)
CBP Wall ConstructionInvestigation and Design Stage
Land
slid
e
Inclinometers Damaged
1 Heavy rainfall events withincreased movement rate
1
2 3
Cumulative Rainfall Record
Daily Rainfall Record
Installation of new Inclinometersduring CBP Wall Construction
Trimming of Slope Profile
Construction of Counter Weight Berm
77
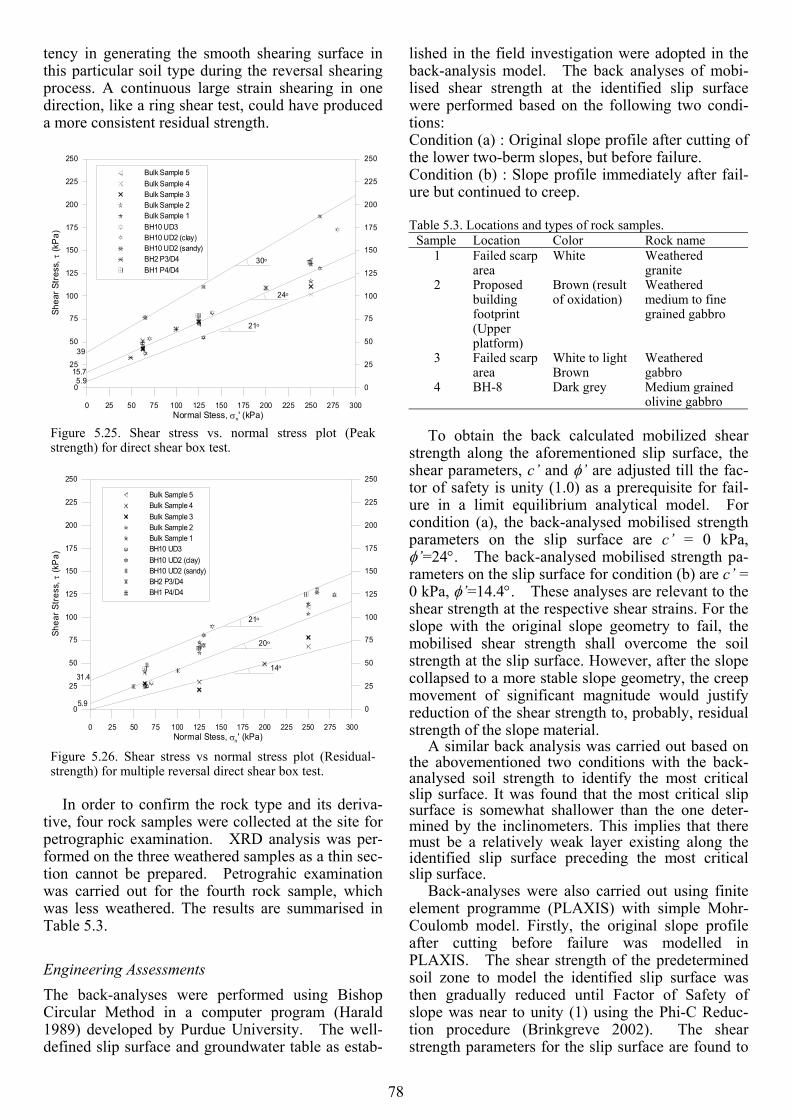
tency in generating the smooth shearing surface in this particular soil type during the reversal shearing process. A continuous large strain shearing in one direction, like a ring shear test, could have produced a more consistent residual strength.
Figure 5.25. Shear stress vs. normal stress plot (Peak strength) for direct shear box test.
Figure 5.26. Shear stress vs normal stress plot (Residual-strength) for multiple reversal direct shear box test.
In order to confirm the rock type and its deriva-
tive, four rock samples were collected at the site for petrographic examination. XRD analysis was per-formed on the three weathered samples as a thin sec-tion cannot be prepared. Petrograhic examination was carried out for the fourth rock sample, which was less weathered. The results are summarised in Table 5.3.
Engineering Assessments The back-analyses were performed using Bishop Circular Method in a computer program (Harald 1989) developed by Purdue University. The well-defined slip surface and groundwater table as estab-
lished in the field investigation were adopted in the back-analysis model. The back analyses of mobi-lised shear strength at the identified slip surface were performed based on the following two condi-tions: Condition (a) : Original slope profile after cutting of the lower two-berm slopes, but before failure.
0 50 100 150 200 250 30025 75 125 175 225 275Normal Stess, σn' (kPa)
0
50
100
150
200
250
25
75
125
175
225
Shea
r Str
ess,
τ (k
Pa)
Bulk Sample 5Bulk Sample 4Bulk Sample 3Bulk Sample 2Bulk Sample 1BH10 UD3BH10 UD2 (clay)BH10 UD2 (sandy)BH2 P3/D4BH1 P4/D4
0
50
100
150
200
250
25
75
125
175
225
30o
24o
21o
39
15.75.9
Condition (b) : Slope profile immediately after fail-ure but continued to creep.
Table 5.3. Locations and types of rock samples.
Sample Location Color Rock name 1 Failed scarp
area White Weathered
granite 2 Proposed
building footprint (Upper platform)
Brown (result of oxidation)
Weathered medium to fine grained gabbro
3 Failed scarp area
White to light Brown
Weathered gabbro
4 BH-8 Dark grey Medium grained olivine gabbro
To obtain the back calculated mobilized shear
strength along the aforementioned slip surface, the shear parameters, c’ and φ’ are adjusted till the fac-tor of safety is unity (1.0) as a prerequisite for fail-ure in a limit equilibrium analytical model. For condition (a), the back-analysed mobilised strength parameters on the slip surface are c’ = 0 kPa, φ’=24°. The back-analysed mobilised strength pa-rameters on the slip surface for condition (b) are c’ = 0 kPa, φ’=14.4°. These analyses are relevant to the shear strength at the respective shear strains. For the slope with the original slope geometry to fail, the mobilised shear strength shall overcome the soil strength at the slip surface. However, after the slope collapsed to a more stable slope geometry, the creep movement of significant magnitude would justify reduction of the shear strength to, probably, residual strength of the slope material. 0 100 200 30025 50 75 125 150 175 225 250 275
Normal Stess, σn' (kPa)
0
100
200
25
50
75
125
150
175
225
250
Shea
r Str
ess,
τ (k
Pa)
Bulk Sample 5Bulk Sample 4Bulk Sample 3Bulk Sample 2Bulk Sample 1BH10 UD3BH10 UD2 (clay)BH10 UD2 (sandy)BH2 P3/D4BH1 P4/D4
0
100
200
25
50
75
125
150
175
225
250
21o
20o
14o
31.4
5.9
A similar back analysis was carried out based on the abovementioned two conditions with the back-analysed soil strength to identify the most critical slip surface. It was found that the most critical slip surface is somewhat shallower than the one deter-mined by the inclinometers. This implies that there must be a relatively weak layer existing along the identified slip surface preceding the most critical slip surface.
Back-analyses were also carried out using finite element programme (PLAXIS) with simple Mohr-Coulomb model. Firstly, the original slope profile after cutting before failure was modelled in PLAXIS. The shear strength of the predetermined soil zone to model the identified slip surface was then gradually reduced until Factor of Safety of slope was near to unity (1) using the Phi-C Reduc-tion procedure (Brinkgreve 2002). The shear strength parameters for the slip surface are found to
78
be c’ = 0.5 kPa, φ’=25.9° when the factor of safety is reduced to 1.04. The back-analysed shear strength is lower than the interpreted laboratory critical state strength parameters which are c’ = 3.0 kPa, φ’=29°. In a detailed review of the shear stress along the de-veloped slip surface, it is noticed that the mobilised shear stress is highly non-uniform. This implies dif-ferent levels of mobilised shear strength along the slip surface. In this case study, the average mobi-lised shear strength is lower than laboratory peak strength, even slightly lower than the laboratory critical state strength. This is a common phenome-non called progressive failure.
The slope profile after failure was also modelled using the same process as mentioned above. The back analysed shear strength parameters are c’=0.5 kPa, φ’=15° with a factor of safety of 1.03.
In general, the back-analysed strength parameters in both methods are fairly similar, except the friction angle of PLAXIS in Condition (a) is about 2 o higher than that of PC-STABL6. Table 5.4 summarises the back-analysed results. Table 5.4. Back analysed strength using PCSTABL and PLAXIS.
Condition (a) Condition (b) Methodology c'(a) φ'(a) c'(b) φ'(b)
1. Back Analysis (PCSTABL)
0 24o 0 14.4o
2. Back Analysis (PLAXIS)
0.5 25.9o 0.5 15o
The back-analyzed shear strength in conditions
(a) and (b) are expected to correspond to critical state strength and residual strength respectively.
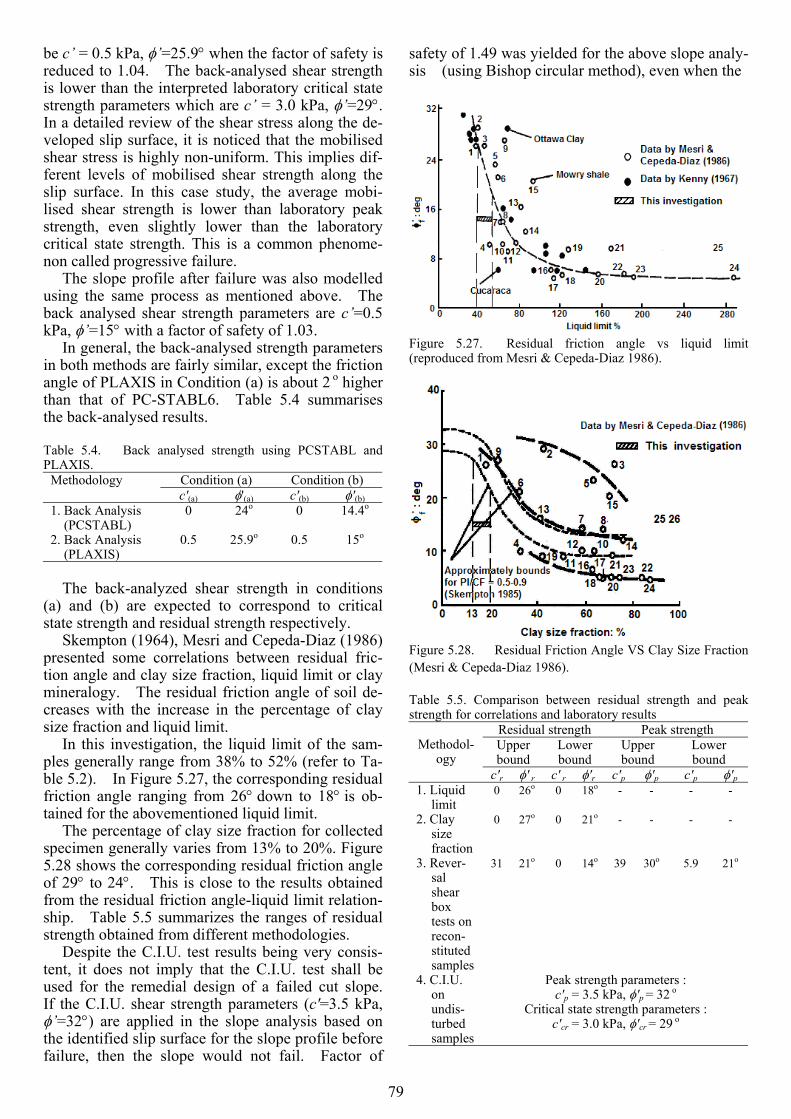
Skempton (1964), Mesri and Cepeda-Diaz (1986) presented some correlations between residual fric-tion angle and clay size fraction, liquid limit or clay mineralogy. The residual friction angle of soil de-creases with the increase in the percentage of clay size fraction and liquid limit.
In this investigation, the liquid limit of the sam-ples generally range from 38% to 52% (refer to Ta-ble 5.2). In Figure 5.27, the corresponding residual friction angle ranging from 26° down to 18° is ob-tained for the abovementioned liquid limit.
The percentage of clay size fraction for collected specimen generally varies from 13% to 20%. Figure 5.28 shows the corresponding residual friction angle of 29° to 24°. This is close to the results obtained from the residual friction angle-liquid limit relation-ship. Table 5.5 summarizes the ranges of residual strength obtained from different methodologies.
Despite the C.I.U. test results being very consis-tent, it does not imply that the C.I.U. test shall be used for the remedial design of a failed cut slope. If the C.I.U. shear strength parameters (c'=3.5 kPa, φ’=32°) are applied in the slope analysis based on the identified slip surface for the slope profile before failure, then the slope would not fail. Factor of
safety of 1.49 was yielded for the above slope analy-sis (using Bishop circular method), even when the
Figure 5.27. Residual friction angle vs liquid limit (reproduced from Mesri & Cepeda-Diaz 1986).
Figure 5.28. Residual Friction Angle VS Clay Size Fraction (Mesri & Cepeda-Diaz 1986). Table 5.5. Comparison between residual strength and peak strength for correlations and laboratory results
Residual strength Peak strength Upper bound
Lower bound
Upper bound
Lower bound
Methodol-
ogy c'r φ' r c' r φ'r c'p φ'p c'p φ'p
1. Liquid limit
0 26o 0 18o - - - -
2. Clay size fraction
0 27o 0 21o - - - -
3. Rever-sal shear box tests on recon-stituted samples
31 21o 0 14o 39 30o 5.9 21o
Peak strength parameters : c'p = 3.5 kPa, φ'p = 32 o
4. C.I.U. on undis-turbed samples
Critical state strength parameters : c'cr = 3.0 kPa, φ'cr = 29 o
79
groundwater table is close to the ground surface. Therefore, it is credible to deduce that there is an ex-istence of a thin layer at the slip surface of excep-tionally low shear strength than the corresponding shear strengths in both conditions (a) and (b). This slip surface is difficult to be determined accurately in the subsurface investigation unless with the help of inclinometer results. Such a thin weak layer is be-lieved to have experienced substantial shearing strain prior to the incidence of failure and therefore exhibits an average mobilized shear strength lower than critical state strength in condition (a) and a lower bound of residual strength in condition (b).
Based on the above discussion, it can be con-cluded that the shear strength on the critical slip sur-face must be sufficiently low for the original cut slope to collapse. Therefore, the shear strength to be used for the remedial design should be close to the residual strength.
5.4 SITE C – CUT SLOPE AT GUA MUSANG, KELANTAN
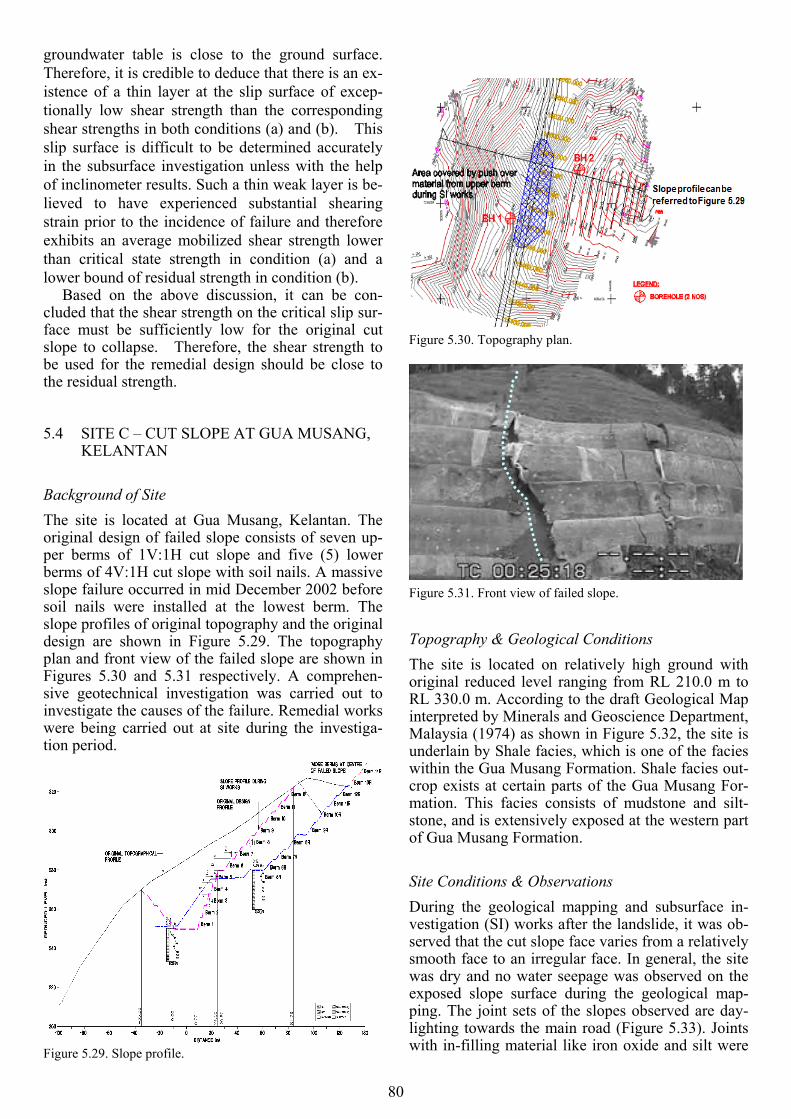
Background of Site The site is located at Gua Musang, Kelantan. The original design of failed slope consists of seven up-per berms of 1V:1H cut slope and five (5) lower berms of 4V:1H cut slope with soil nails. A massive slope failure occurred in mid December 2002 before soil nails were installed at the lowest berm. The slope profiles of original topography and the original design are shown in Figure 5.29. The topography plan and front view of the failed slope are shown in Figures 5.30 and 5.31 respectively. A comprehen-sive geotechnical investigation was carried out to investigate the causes of the failure. Remedial works were being carried out at site during the investiga-tion period.
Figure 5.30. Topography plan.
Figure 5.31. Front view of failed slope.
Topography & Geological Conditions The site is located on relatively high groundoriginal reduced level ranging from RL 210.0RL 330.0 m. According to the draft Geologicainterpreted by Minerals and Geoscience DeparMalaysia (1974) as shown in Figure 5.32, the underlain by Shale facies, which is one of the within the Gua Musang Formation. Shale faciecrop exists at certain parts of the Gua Musangmation. This facies consists of mudstone anstone, and is extensively exposed at the westerof Gua Musang Formation.
Site Conditions & Observations During the geological mapping and subsurfavestigation (SI) works after the landslide, it wserved that the cut slope face varies from a relasmooth face to an irregular face. In general, thwas dry and no water seepage was observed oexposed slope surface during the geologicalping. The joint sets of the slopes observed arelighting towards the main road (Figure 5.33). with in-filling material like iron oxide and sil
Figure 5.29. Slope profile.
80
with m to l Map tment, site is facies s out- For-
d silt-n part
ce in-as ob-tively e site n the
map- day-Joints t were
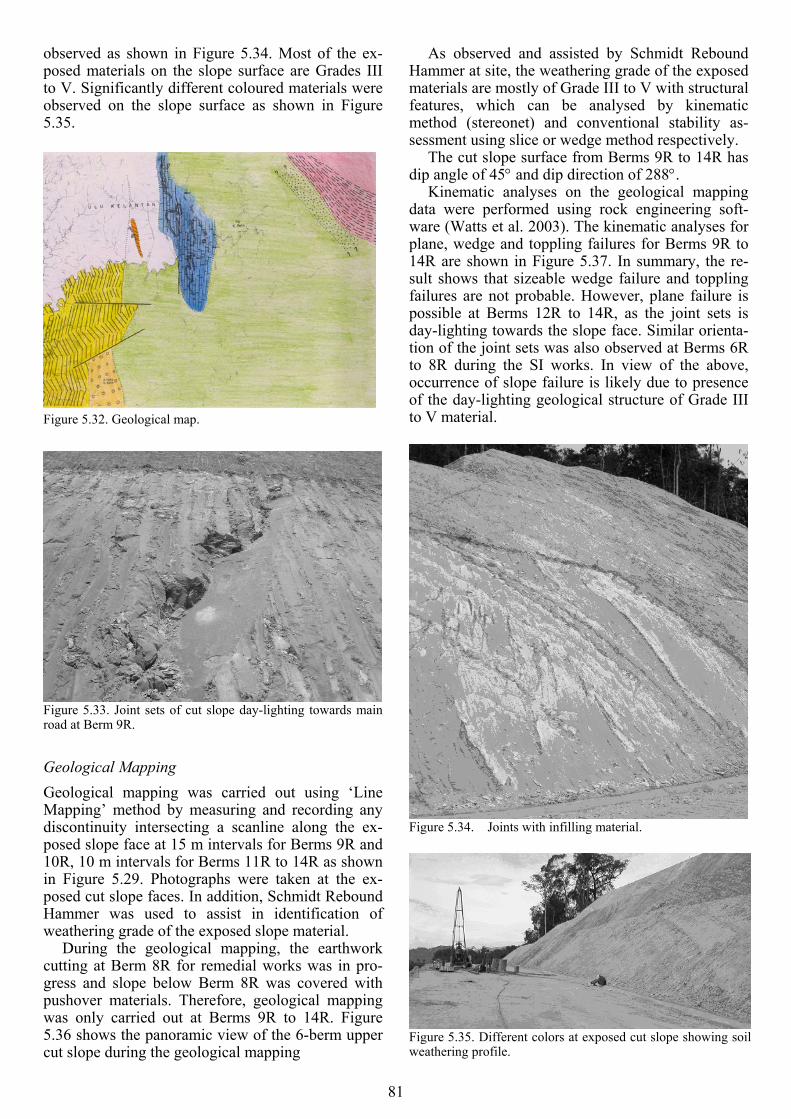
observed as shown in Figure 5.34. Most of the ex-posed materials on the slope surface are Grades III to V. Significantly different coloured materials were observed on the slope surface as shown in Figure 5.35.
Figure 5.32. Geological map.
Figure 5.33. Joint sets of cut slope day-lighting towards main road at Berm 9R.
Geological Mapping Geological mapping was carried out using ‘Line Mapping’ method by measuring and recording any discontinuity intersecting a scanline along the ex-posed slope face at 15 m intervals for Berms 9R and 10R, 10 m intervals for Berms 11R to 14R as shown in Figure 5.29. Photographs were taken at the ex-posed cut slope faces. In addition, Schmidt Rebound Hammer was used to assist in identification of weathering grade of the exposed slope material.
During the geological mapping, the earthwork cutting at Berm 8R for remedial works was in pro-gress and slope below Berm 8R was covered with pushover materials. Therefore, geological mapping was only carried out at Berms 9R to 14R. Figure 5.36 shows the panoramic view of the 6-berm upper cut slope during the geological mapping
As observed and assisted by Schmidt Rebound Hammer at site, the weathering grade of the exposed materials are mostly of Grade III to V with structural features, which can be analysed by kinematic method (stereonet) and conventional stability as-sessment using slice or wedge method respectively.
The cut slope surface from Berms 9R to 14R has dip angle of 45° and dip direction of 288°.
Kinematic analyses on the geological mapping data were performed using rock engineering soft-ware (Watts et al. 2003). The kinematic analyses for plane, wedge and toppling failures for Berms 9R to 14R are shown in Figure 5.37. In summary, the re-sult shows that sizeable wedge failure and toppling failures are not probable. However, plane failure is possible at Berms 12R to 14R, as the joint sets is day-lighting towards the slope face. Similar orienta-tion of the joint sets was also observed at Berms 6R to 8R during the SI works. In view of the above, occurrence of slope failure is likely due to presence of the day-lighting geological structure of Grade III to V material.
Figure 5.34. Joints with infilling material.
Figure 5.35. Different colors at exposed cut slope showing soil weathering profile.
81
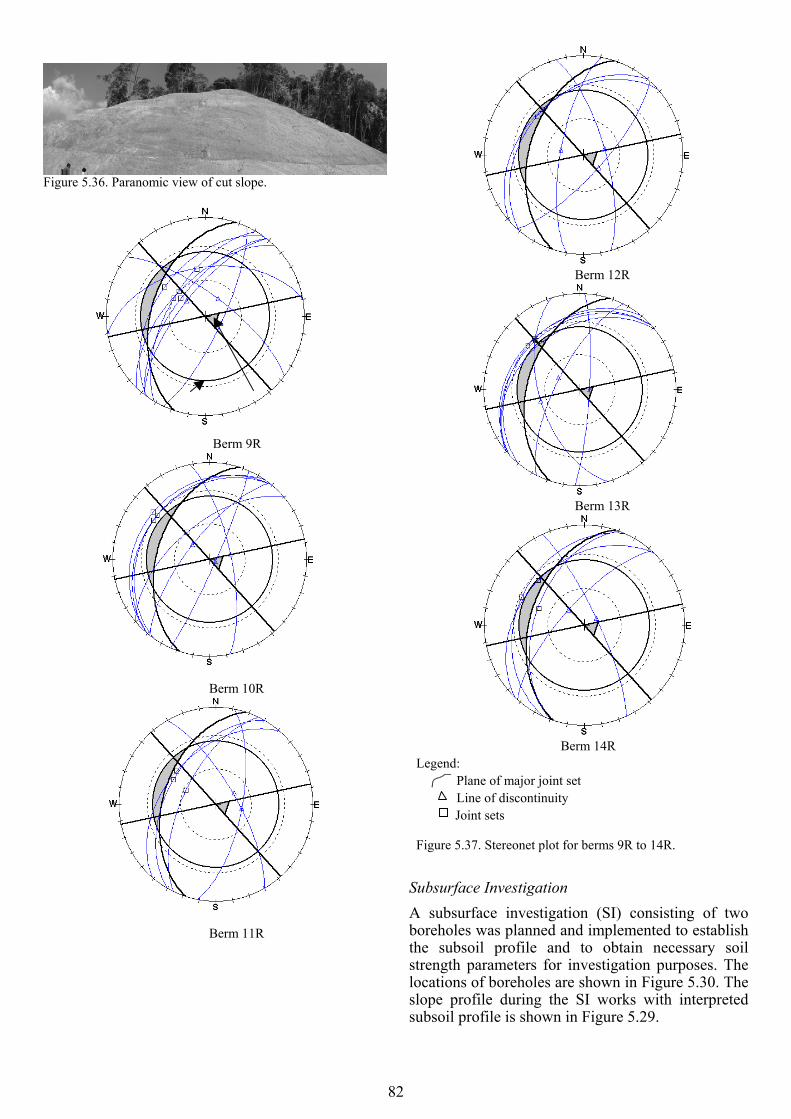
Figure 5.36. Paranomic view of cut slope.
Berm 9R
Berm 10R
Berm 11R
Berm 12R
Berm 13R
Berm 14R
Legend: Plane of major joint set Line of discontinuity
Joint sets Figure 5.37. Stereonet plot for berms 9R to 14R.
Subsurface Investigation A subsurface investigation (SI) consisting of two boreholes was planned and implemented to establish the subsoil profile and to obtain necessary soil strength parameters for investigation purposes. The locations of boreholes are shown in Figure 5.30. The slope profile during the SI works with interpreted subsoil profile is shown in Figure 5.29.
82
Laboratory Tests A series of laboratory tests was carried out on the samples obtained from the subsurface investigation works. The tests performed included Atterberg lim-its, particle size distribution, multiple reversal direct shear box test, consolidated isotropically undrained triaxial test with pore pressure measurement and petrographic analysis test. Selected test results are presented in the following section.
Based on the British Soil Classification System, most of the tested soil / rock samples are silt of in-termediate to high plasticity. Table 5.6 summarises the Atterberg limits and particle size distribution of the cut slope materials. Table 5.6. Atterberg limits and particle size distribution for selected specimens collected from the SI works.
Bore- hole
Depth (m)
LL PL Clay (%)
Silt (%)
Sand (%)
Gravel (%)
BH1 (P2/D3)
3.0-3.45
N.A. N.A. 16 70 11 3
BH1 (MZ1)
6.0-7.00
48 33 10 84 6 0
BH1 (P4/D5)
7.5-7.91
55 33 9 87 4 0
BH1 (MZ2)
10.5-11.50
46 33 10 75 13 2
BH1 (P7D8)
13.5-13.78
49 32 6 70 18 6
BH2 (P2/D3)
3.0-3.45
46 31 16 70 11 3
BH2 (MZ2)
7.5-8.50
35 26 5 73 15 7
BH2 (MZ3)
12.0-13.00
N.A. N.A. 3 63 28 6
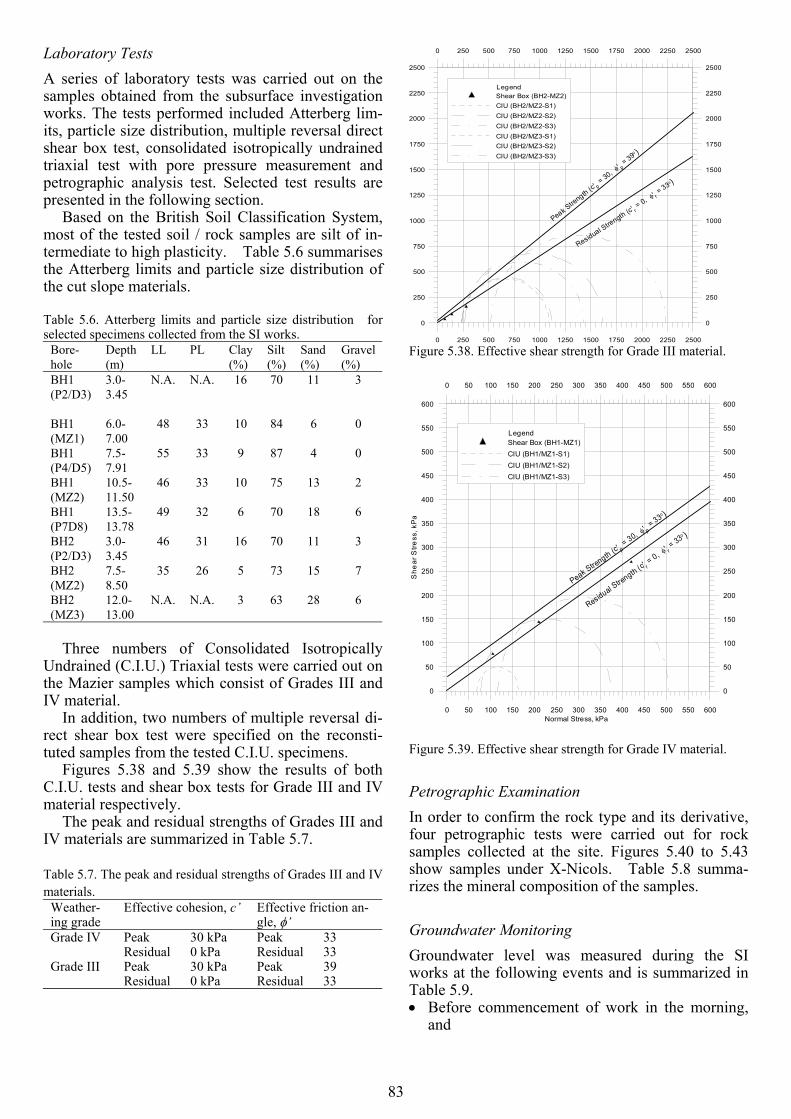
Three numbers of Consolidated Isotropically
Undrained (C.I.U.) Triaxial tests were carried out on the Mazier samples which consist of Grades III and IV material.
In addition, two numbers of multiple reversal di-rect shear box test were specified on the reconsti-tuted samples from the tested C.I.U. specimens.
Figures 5.38 and 5.39 show the results of both C.I.U. tests and shear box tests for Grade III and IV material respectively.
The peak and residual strengths of Grades III and IV materials are summarized in Table 5.7. Table 5.7. The peak and residual strengths of Grades III and IV materials.
Weather-ing grade
Effective cohesion, c’ Effective friction an-gle, φ’
Peak 30 kPa Peak 33 Grade IV Residual 0 kPa Residual 33 Peak 30 kPa Peak 39 Grade III Residual 0 kPa Residual 33
0 250 500 750 1000 1250 1500 1750 2000 2250 2500
0
250
500
750
1000
1250
1500
1750
2000
2250
2500
LegendShear Box (BH2-MZ2)CIU (BH2/MZ2-S1)CIU (BH2/MZ2-S2)CIU (BH2/MZ2-S3)CIU (BH2/MZ3-S1)CIU (BH2/MZ3-S2)CIU (BH2/MZ3-S3)
0
250
500
750
1000
1250
1500
1750
2000
2250
2500
0 250 500 750 1000 1250 1500 1750 2000 2250 2500
Residual Strength (c' r = 0, φ
' r = 33o )
Peak Stre
ngth (c' p = 30, φ
' p = 39o )
Figure 5.38. Effective shear strength for Grade III material.
0 50 100 150 200 250 300 350 400 450 500 550 600Normal Stress, kPa
0
50
100
150
200
250
300
350
400
450
500
550
600S
hear
Stre
ss, k
Pa
0 50 100 150 200 250 300 350 400 450 500 550 600
0
50
100
150
200
250
300
350
400
450
500
550
600
LegendShear Box (BH1-MZ1)CIU (BH1/MZ1-S1)CIU (BH1/MZ1-S2)CIU (BH1/MZ1-S3)
Residual Strength (c' r = 0, φ
' r = 33o )
Peak Strength (c' p = 30, φ
' p = 33o )
Figure 5.39. Effective shear strength for Grade IV material.
Petrographic Examination In order to confirm the rock type and its derivative, four petrographic tests were carried out for rock samples collected at the site. Figures 5.40 to 5.43 show samples under X-Nicols. Table 5.8 summa-rizes the mineral composition of the samples.
Groundwater Monitoring Groundwater level was measured during the SI works at the following events and is summarized in Table 5.9. • Before commencement of work in the morning,
and
83
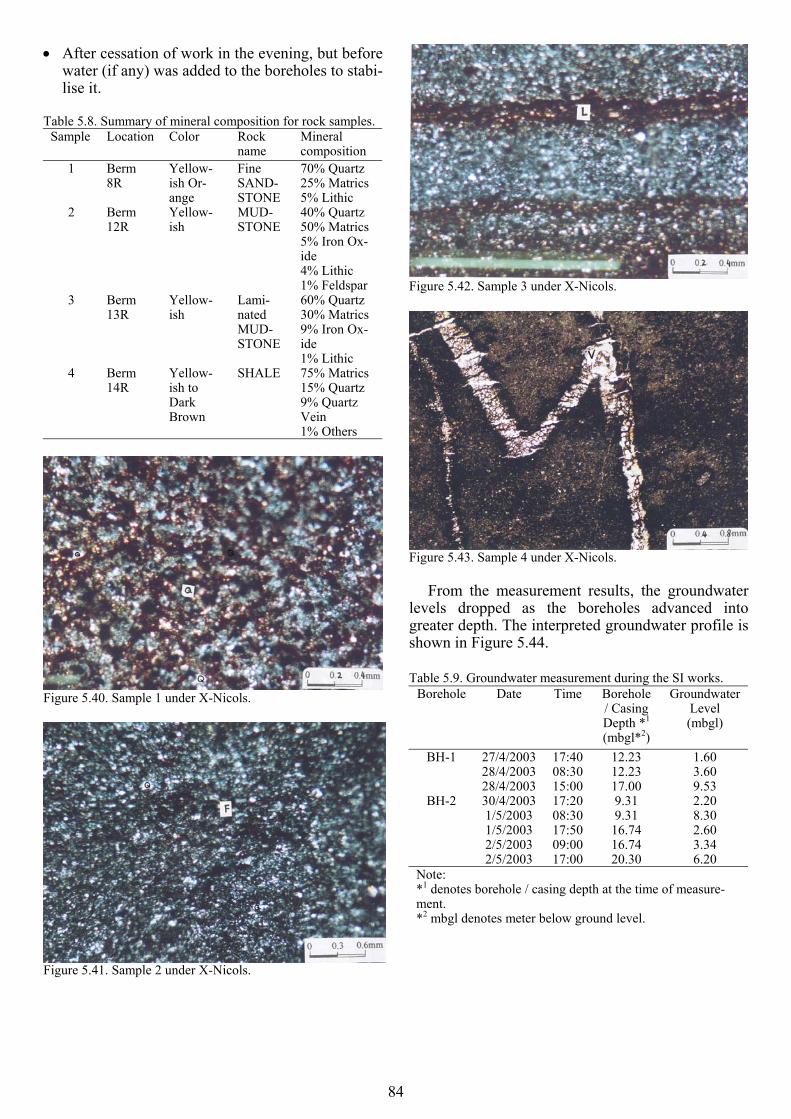
• After cessation of work in the evening, but before water (if any) was added to the boreholes to stabi-lise it.
Table 5.8. Summary of mineral composition for rock samples.
Sample Location Color Rock name
Mineral composition
1 Berm 8R
Yellow-ish Or-ange
Fine SAND-STONE
70% Quartz 25% Matrics 5% Lithic
2 Berm 12R
Yellow-ish
MUD-STONE
40% Quartz 50% Matrics 5% Iron Ox-ide 4% Lithic 1% Feldspar
3 Berm 13R
Yellow-ish
Lami-nated MUD-STONE
60% Quartz 30% Matrics 9% Iron Ox-ide 1% Lithic
4 Berm 14R
Yellow-ish to Dark Brown
SHALE 75% Matrics 15% Quartz 9% Quartz Vein 1% Others
Figure 5.40. Sample 1 under X-Nicols.
Figure 5.41. Sample 2 under X-Nicols.
Figure 5.42. Sample 3 under X-Nicols.
Figure 5.43. Sample 4 under X-Nicols.
From the measurement results, the groundwater levels dropped as the boreholes advanced into greater depth. The interpreted groundwater profile is shown in Figure 5.44. Table 5.9. Groundwater measurement during the SI works.
Borehole Date Time Borehole / Casing Depth *1
(mbgl*2)
Groundwater Level (mbgl)
BH-1 27/4/2003 17:40 12.23 1.60 28/4/2003 08:30 12.23 3.60 28/4/2003 15:00 17.00 9.53
BH-2 30/4/2003 17:20 9.31 2.20 1/5/2003 08:30 9.31 8.30 1/5/2003 17:50 16.74 2.60 2/5/2003 09:00 16.74 3.34 2/5/2003 17:00 20.30 6.20
Note: *1 denotes borehole / casing depth at the time of measure-ment. *2 mbgl denotes meter below ground level.
84
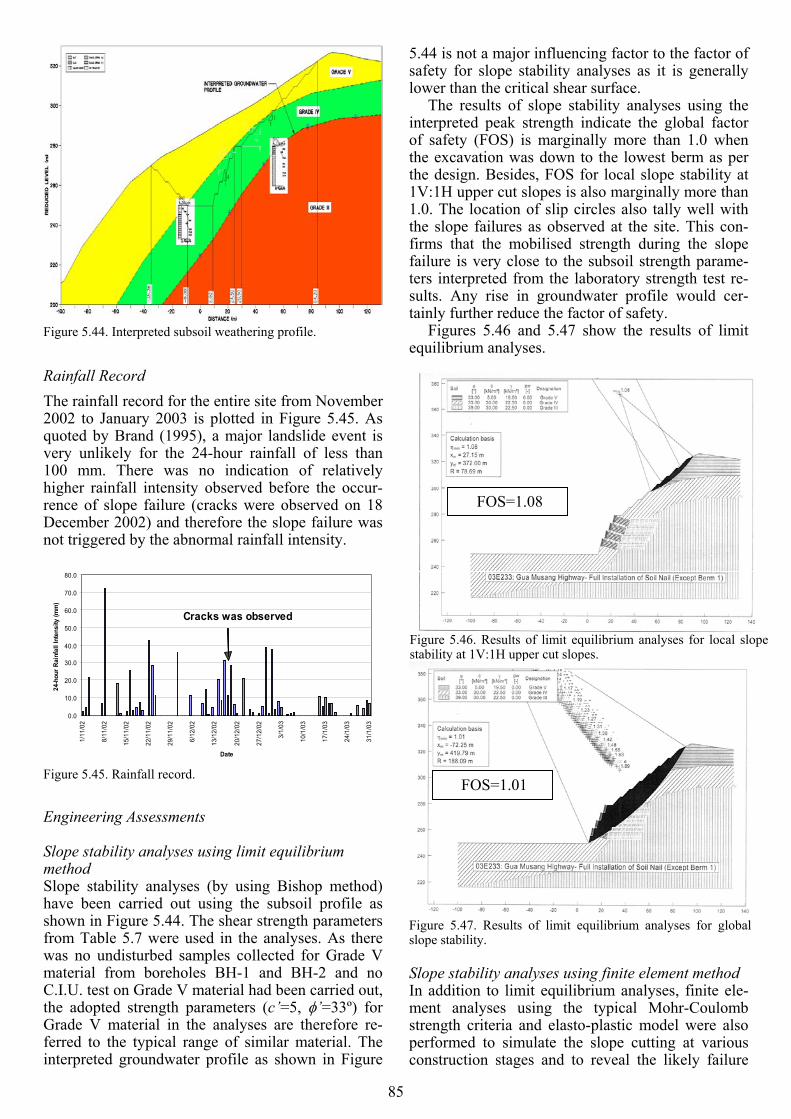
Figure 5.44. Interpreted subsoil weathering profile.
Rainfall Record The rainfall record for the entire site from November 2002 to January 2003 is plotted in Figure 5.45. As quoted by Brand (1995), a major landslide event is very unlikely for the 24-hour rainfall of less than 100 mm. There was no indication of relatively higher rainfall intensity observed before the occur-rence of slope failure (cracks were observed on 18 December 2002) and therefore the slope failure was not triggered by the abnormal rainfall intensity.
0.0
10.0
20.0
30.0
40.0
50.0
60.0
70.0
80.0
1/11
/02
8/11
/02
15/1
1/02
22/1
1/02
29/1
1/02
6/12
/02
13/1
2/02
20/1
2/02
27/1
2/02
3/1/
03
10/1
/03
17/1
/03
24/1
/03
31/1
/03
Date
24-h
our R
ainf
all I
nten
sity
(mm
)
Cracks was observed
Figure 5.45. Rainfall record.
Engineering Assessments
Slope stability analyses using limit equilibrium method Slope stability analyses (by using Bishop method) have been carried out using the subsoil profile as shown in Figure 5.44. The shear strength parameters from Table 5.7 were used in the analyses. As there was no undisturbed samples collected for Grade V material from boreholes BH-1 and BH-2 and no C.I.U. test on Grade V material had been carried out, the adopted strength parameters (c’=5, φ’=33º) for Grade V material in the analyses are therefore re-ferred to the typical range of similar material. The interpreted groundwater profile as shown in Figure
5.44 is not a major influencing factor to the factor of safety for slope stability analyses as it is generally lower than the critical shear surface.
The results of slope stability analyses using the interpreted peak strength indicate the global factor of safety (FOS) is marginally more than 1.0 when the excavation was down to the lowest berm as per the design. Besides, FOS for local slope stability at 1V:1H upper cut slopes is also marginally more than 1.0. The location of slip circles also tally well with the slope failures as observed at the site. This con-firms that the mobilised strength during the slope failure is very close to the subsoil strength parame-ters interpreted from the laboratory strength test re-sults. Any rise in groundwater profile would cer-tainly further reduce the factor of safety.
Figures 5.46 and 5.47 show the results of limit equilibrium analyses.
Figure 5.46. Results of limit equilibrium analyses for local slope stability at 1V:1H upper cut slopes.
Figure 5.47. Results of limit equilibrium analyses for global slope stability.
FOS=1.08
FOS=1.01
Slope stability analyses using finite element method In addition to limit equilibrium analyses, finite ele-ment analyses using the typical Mohr-Coulomb strength criteria and elasto-plastic model were also performed to simulate the slope cutting at various construction stages and to reveal the likely failure
85

mechanism. From the finite element analyses model-ling each excavation stage as shown in Figures 5.48 to 5.53, it is clear that the development of plastic points within the soil body indicates mobilisation of the peak strength in these soil elements. When the cutting is in progress, significant stress relief due to massive earthwork removal tends to reduce the ef-fective shear strength, therefore resulting in more plastic points developing and propagating to other areas. Eventually a well-defined shear surface is formed when the excavation reached the lowest berm. This finite element result demonstrates the phenomenon of progressive failure of the failed slope as the cutting is in progress. The soil nails failed to provide significant strengthening action to the overall slope due to inadequate nail length in re-lation to the entire failed slope geometry.
Conclusions Based on the analysis results, the possible causes of failure are summarised as follows: a. The gradient of the upper cut slope of 1V:1H is
steep and is not stable in long term, as FOS for the localised stability is only about 1.08. As dem-onstrated in the finite element analyses, progres-sive failure developed a continuous shear surface with the progression of the slope cutting.
b. The provided length of soil nail (12 m) is inade-quate with respect to the global stability, in which the failure surface is mostly behind the soil nails. Hence, the soil nails cannot provide sufficient re-sistance to prevent instability.
c. The day-lighting geological structures of Grade III to V materials at the cut slope of steep slope gradient forming preferential weak shear surface also contributed to the failure.
d. Significant stress relief due to massive earthwork removal tends to reduce the effective overburden stress and the shear strength of the cut slope. Cut-ting of the original slope to steeper profile will therefore increase the mobilised shear stress along the slip surface and eventually reduce the FOS until failure.
e. As demonstrated in the finite element analyses, progressive failure as a result of different degrees of strength mobilisation and localised stress con-centration during various stages of slope cutting led to the development of a continuous shear sur-face causing the global slope failure.
Figure 5.48. Development of plastic points in finite element model (After cutting of two upper berms).
Cutting Earthworks
Figure 5.49. Development of plastic points in finite element model (After cutting of four upper berms).
Cutting Earthworks
Figure 5.50. Development of plastic points in finite element model (After cutting of seven upper berms).
Cutting Earthworks
86
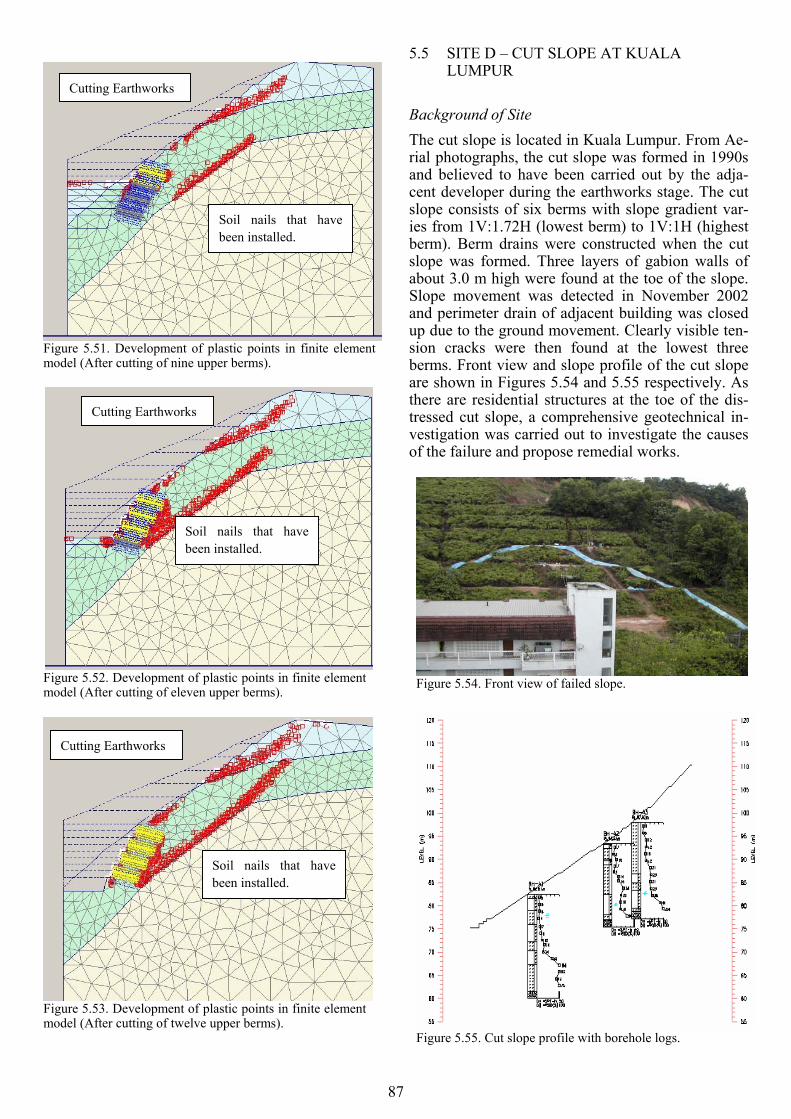
Figure 5.51. Development of plastic points in finite element model (After cutting of nine upper berms).
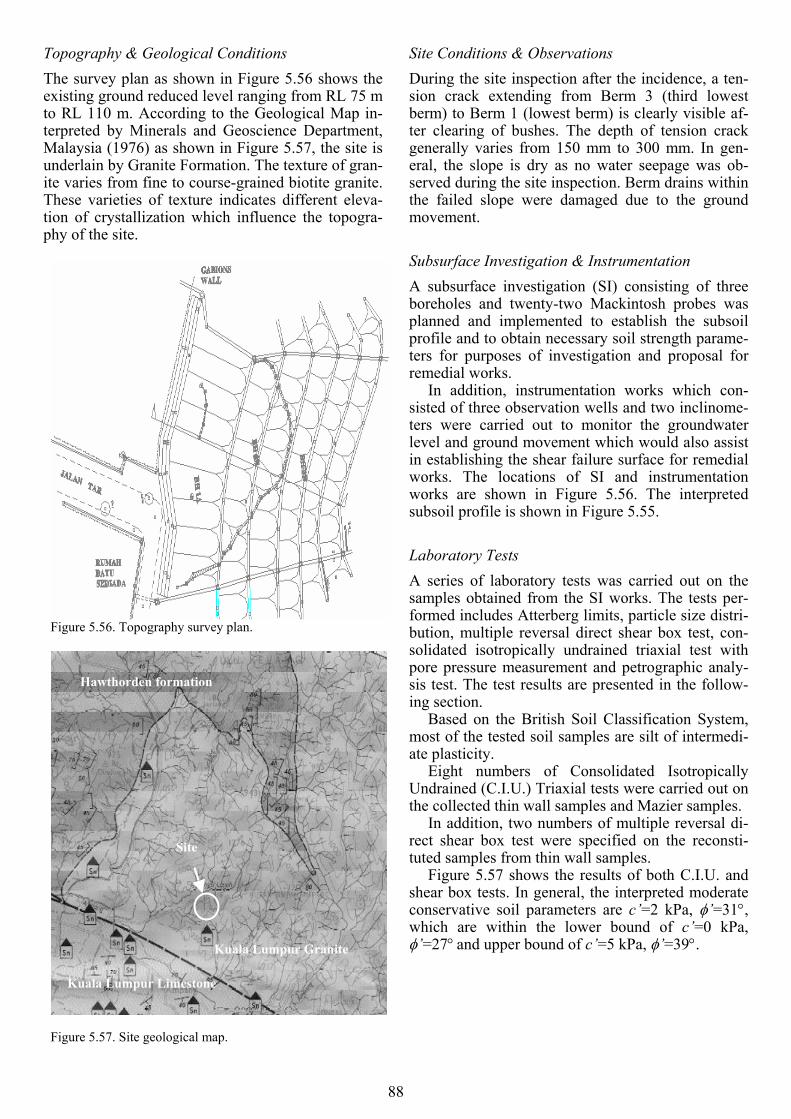
Figure 5.52. Development of plastic points in finite element model (After cutting of eleven upper berms).
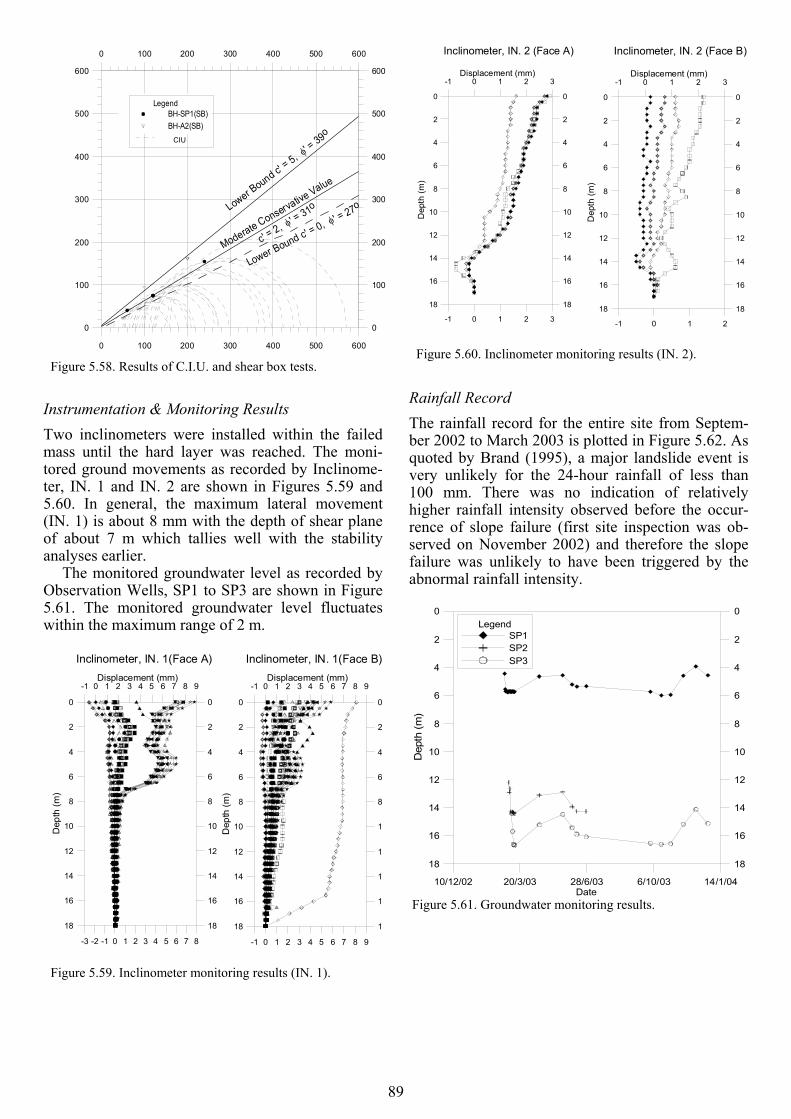
Figure 5.53. Development of plastic points in finite element model (After cutting of twelve upper berms).
5.5 SITE D – CUT SLOPE AT KUALA LUMPUR
Cutting Earthworks
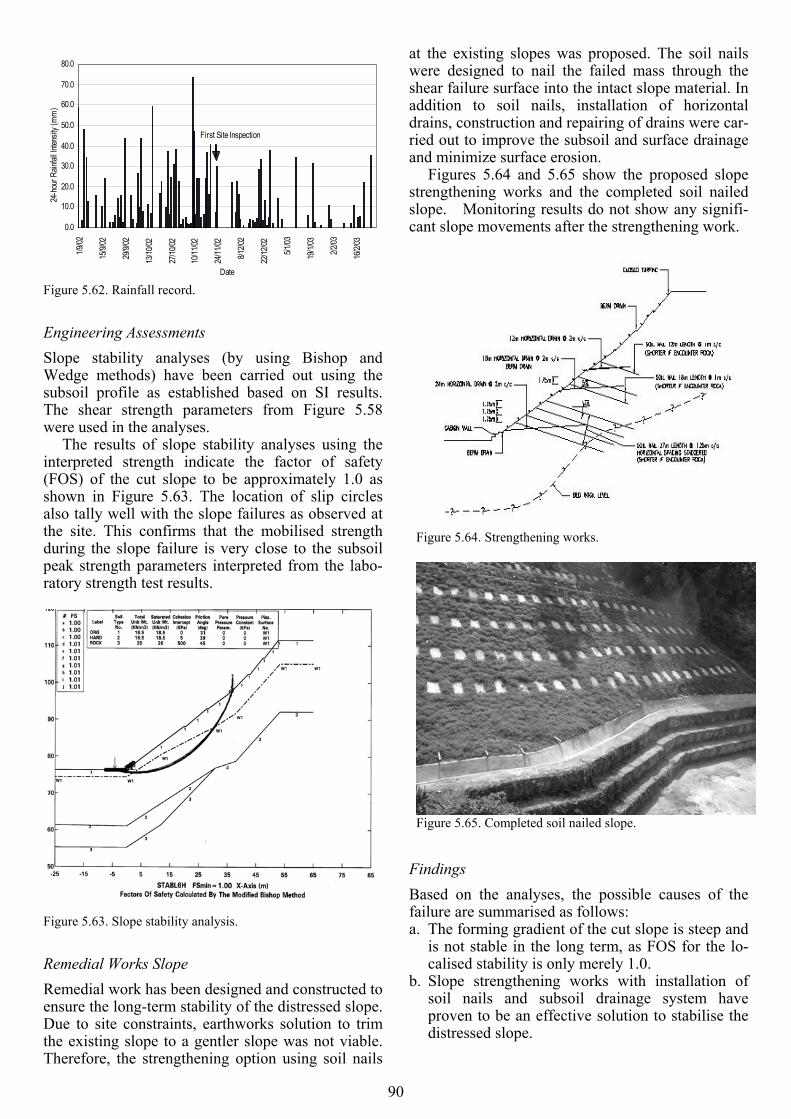
Background of Site The cut slope is located in Kuala Lumpur. From Ae-rial photographs, the cut slope was formed in 1990s and believed to have been carried out by the adja-cent developer during the earthworks stage. The cut slope consists of six berms with slope gradient var-ies from 1V:1.72H (lowest berm) to 1V:1H (highest berm). Berm drains were constructed when the cut slope was formed. Three layers of gabion walls of about 3.0 m high were found at the toe of the slope. Slope movement was detected in November 2002 and perimeter drain of adjacent building was closed up due to the ground movement. Clearly visible ten-sion cracks were then found at the lowest three berms. Front view and slope profile of the cut slope are shown in Figures 5.54 and 5.55 respectively. As there are residential structures at the toe of the dis-tressed cut slope, a comprehensive geotechnical in-vestigation was carried out to investigate the causes of the failure and propose remedial works.
Soil nails that have been installed.
Cutting Earthworks
Figure 5.54. Front view of failed slope.
Soil nails that have been installed.
Figure 5.55. Cut slope profile with borehole logs.
Cutting Earthworks
Soil nails that have been installed.
87
Topography & Geological Conditions The survey plan as shown in Figure 5.56 shows the existing ground reduced level ranging from RL 75 m to RL 110 m. According to the Geological Map in-terpreted by Minerals and Geoscience Department, Malaysia (1976) as shown in Figure 5.57, the site is underlain by Granite Formation. The texture of gran-ite varies from fine to course-grained biotite granite. These varieties of texture indicates different eleva-tion of crystallization which influence the topogra-phy of the site.
Figure 5.56. Topography survey plan.
Figure 5.57. Site geological map.
Site Conditions & Observations During the site inspection after the incidence, a ten-sion crack extending from Berm 3 (third lowest berm) to Berm 1 (lowest berm) is clearly visible af-ter clearing of bushes. The depth of tension crack generally varies from 150 mm to 300 mm. In gen-eral, the slope is dry as no water seepage was ob-served during the site inspection. Berm drains within the failed slope were damaged due to the ground movement.
Subsurface Investigation & Instrumentation A subsurface investigation (SI) consisting of three boreholes and twenty-two Mackintosh probes was planned and implemented to establish the subsoil profile and to obtain necessary soil strength parame-ters for purposes of investigation and proposal for remedial works.
In addition, instrumentation works which con-sisted of three observation wells and two inclinome-ters were carried out to monitor the groundwater level and ground movement which would also assist in establishing the shear failure surface for remedial works. The locations of SI and instrumentation works are shown in Figure 5.56. The interpreted subsoil profile is shown in Figure 5.55.
Laboratory Tests A series of laboratory tests was carried out on the samples obtained from the SI works. The tests per-formed includes Atterberg limits, particle size distri-bution, multiple reversal direct shear box test, con-solidated isotropically undrained triaxial test with pore pressure measurement and petrographic analy-sis test. The test results are presented in the follow-ing section.
Hawthorden formation
Based on the British Soil Classification System, most of the tested soil samples are silt of intermedi-ate plasticity.
Eight numbers of Consolidated Isotropically Undrained (C.I.U.) Triaxial tests were carried out on the collected thin wall samples and Mazier samples.
In addition, two numbers of multiple reversal di-rect shear box test were specified on the reconsti-tuted samples from thin wall samples.
Site
Figure 5.57 shows the results of both C.I.U. and shear box tests. In general, the interpreted moderate conservative soil parameters are c’=2 kPa, φ’=31°, which are within the lower bound of c’=0 kPa, φ’=27° and upper bound of c’=5 kPa, φ’=39°. Kuala Lumpur Granite
Kuala Lumpur Limestone
88
0 100 200 300 400 500 600
0
100
200
300
400
500
600
0 100 200 300 400 500 600
0
100
200
300
400
500
600
LegendBH-SP1(SB)BH-A2(SB)
Moderate Conservative Value
c' = 2, φ' = 31o
Lower Bound c' = 0, φ' = 27oLower Bound c'
= 5, φ' = 39oCIU
Figure 5.58. Results of C.I.U. and shear box tests.
Instrumentation & Monitoring Results Two inclinometers were installed within the failed mass until the hard layer was reached. The moni-tored ground movements as recorded by Inclinome-ter, IN. 1 and IN. 2 are shown in Figures 5.59 and 5.60. In general, the maximum lateral movement (IN. 1) is about 8 mm with the depth of shear plane of about 7 m which tallies well with the stability analyses earlier.
The monitored groundwater level as recorded by Observation Wells, SP1 to SP3 are shown in Figure 5.61. The monitored groundwater level fluctuates within the maximum range of 2 m.
-3 -2 -1 0 1 2 3 4 5 6 7 8
18
16
14
12
10
8
6
4
2
0
Dep
th (m
)
18
16
14
12
10
8
6
4
2
0
-1 0 1 2 3 4 5 6 7 8 9Displacement (mm)
Inclinometer, IN. 1(Face A)
-1 0 1 2 3 4 5 6 7 8 9
18
16
14
12
10
8
6
4
2
0
Dep
th (m
)
1
1
1
1
1
8
6
4
2
0
-1 0 1 2 3 4 5 6 7 8 9Displacement (mm)
Inclinometer, IN. 1(Face B)
Figure 5.59. Inclinometer monitoring results (IN. 1).
-1 0 1 2 3
18
16
14
12
10
8
6
4
2
0
Dep
th (m
)
-1 0 1 2 3Displacement (mm)
18
16
14
12
10
8
6
4
2
0
Inclinometer, IN. 2 (Face A)
-1 0 1 2
18
16
14
12
10
8
6
4
2
0
Dep
th (m
)
-1 0 1 2 3Displacement (mm)
18
16
14
12
10
8
6
4
2
0
Inclinometer, IN. 2 (Face B)
Figure 5.60. Inclinometer monitoring results (IN. 2).
Rainfall Record The rainfall record for the entire site from Septem-ber 2002 to March 2003 is plotted in Figure 5.62. As quoted by Brand (1995), a major landslide event is very unlikely for the 24-hour rainfall of less than 100 mm. There was no indication of relatively higher rainfall intensity observed before the occur-rence of slope failure (first site inspection was ob-served on November 2002) and therefore the slope failure was unlikely to have been triggered by the abnormal rainfall intensity.
10/12/02 20/3/03 28/6/03 6/10/03 14/1/04Date
18
16
14
12
10
8
6
4
2
0
Dep
th (m
)
18
16
14
12
10
8
6
4
2
0Legend
SP1SP2SP3
Figure 5.61. Groundwater monitoring results.
89
Engineering Assessments Slope stability analyses (by using Bishop and Wedge methods) have been carried out using the subsoil profile as established based on SI results. The shear strength parameters from Figure 5.58 were used in the analyses.
The results of slope stability analyses using the interpreted strength indicate the factor of safety (FOS) of the cut slope to be approximately 1.0 as shown in Figure 5.63. The location of slip circles also tally well with the slope failures as observed at the site. This confirms that the mobilised strength during the slope failure is very close to the subsoil peak strength parameters interpreted from the labo-ratory strength test results.
Figure 5.63. Slope stability analysis.
Remedial Works Slope Remedial work has been designed and constructed to ensure the long-term stability of the distressed slope. Due to site constraints, earthworks solution to trim the existing slope to a gentler slope was not viable. Therefore, the strengthening option using soil nails
at the existing slopes was proposed. The soil nails were designed to nail the failed mass through the shear failure surface into the intact slope material. In addition to soil nails, installation of horizontal drains, construction and repairing of drains were car-ried out to improve the subsoil and surface drainage and minimize surface erosion.
0.0
10.0
20.0
30.0
40.0
50.0
60.0
70.0
80.0
1/9/02
15/9/
02
29/9/
02
13/10
/02
27/10
/02
10/11
/02
24/11
/02
8/12/0
2
22/12
/02
5/1/03
19/1/
03
2/2/03
16/2/
03
Date
24-h
our R
ainfal
l Inten
sity (
mm
)
First Site Inspection
Figure 5.62. Rainfall record.
Figures 5.64 and 5.65 show the proposed slope strengthening works and the completed soil nailed slope. Monitoring results do not show any signifi-cant slope movements after the strengthening work.
Figure 5.64. Strengthening works.
Figure 5.65. Completed soil nailed slope.
Findings Based on the analyses, the possible causes of the failure are summarised as follows: a. The forming gradient of the cut slope is steep and
is not stable in the long term, as FOS for the lo-calised stability is only merely 1.0.
b. Slope strengthening works with installation of soil nails and subsoil drainage system have proven to be an effective solution to stabilise the distressed slope.
90
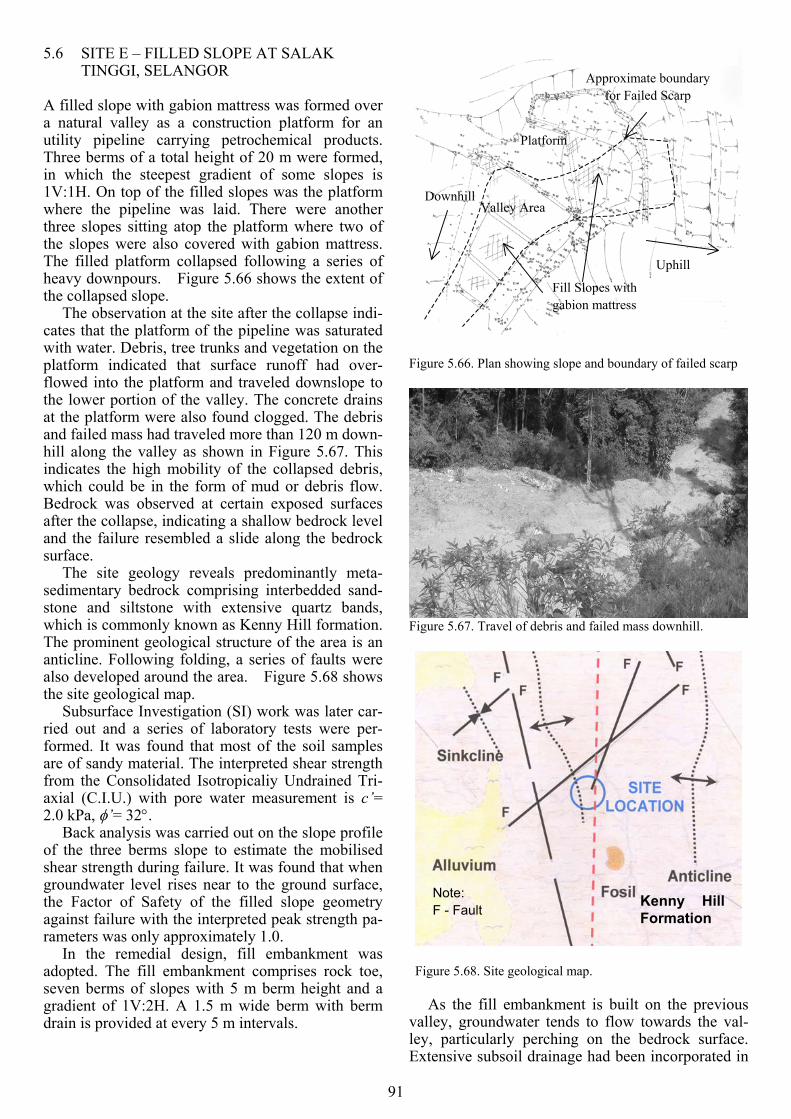
5.6 SITE E – FILLED SLOPE AT SALAK TINGGI, SELANGOR Approximate boundary
for Failed Scarp A filled slope with gabion mattress was formed over a natural valley as a construction platform for an utility pipeline carrying petrochemical products. Three berms of a total height of 20 m were formed, in which the steepest gradient of some slopes is 1V:1H. On top of the filled slopes was the platform where the pipeline was laid. There were another three slopes sitting atop the platform where two of the slopes were also covered with gabion mattress. The filled platform collapsed following a series of heavy downpours. Figure 5.66 shows the extent of the collapsed slope.
Platform
Downhill Valley Area
Uphill
Fill Slopes with gabion mattress The observation at the site after the collapse indi-
cates that the platform of the pipeline was saturated with water. Debris, tree trunks and vegetation on the platform indicated that surface runoff had over-flowed into the platform and traveled downslope to the lower portion of the valley. The concrete drains at the platform were also found clogged. The debris and failed mass had traveled more than 120 m down-hill along the valley as shown in Figure 5.67. This indicates the high mobility of the collapsed debris, which could be in the form of mud or debris flow. Bedrock was observed at certain exposed surfaces after the collapse, indicating a shallow bedrock level and the failure resembled a slide along the bedrock surface.
The site geology reveals predominantly meta-sedimentary bedrock comprising interbedded sand-stone and siltstone with extensive quartz bands, which is commonly known as Kenny Hill formation. The prominent geological structure of the area is an anticline. Following folding, a series of faults were also developed around the area. Figure 5.68 shows the site geological map.
Subsurface Investigation (SI) work was later car-ried out and a series of laboratory tests were per-formed. It was found that most of the soil samples are of sandy material. The interpreted shear strength from the Consolidated Isotropicaliy Undrained Tri-axial (C.I.U.) with pore water measurement is c’= 2.0 kPa, φ’= 32°.
Back analysis was carried out on the slope profile of the three berms slope to estimate the mobilised shear strength during failure. It was found that when groundwater level rises near to the ground surface, the Factor of Safety of the filled slope geometry against failure with the interpreted peak strength pa-rameters was only approximately 1.0.
In the remedial design, fill embankment was adopted. The fill embankment comprises rock toe, seven berms of slopes with 5 m berm height and a gradient of 1V:2H. A 1.5 m wide berm with berm drain is provided at every 5 m intervals.
Figure 5.66. Plan showing slope and boundary of failed scarp
Figure 5.67. Travel of debris and failed mass downhill.
Figure 5.68. Site geological map.
Note: F - Fault Kenny Hill
Formation
As the fill embankment is built on the previous
valley, groundwater tends to flow towards the val-ley, particularly perching on the bedrock surface. Extensive subsoil drainage had been incorporated in
91
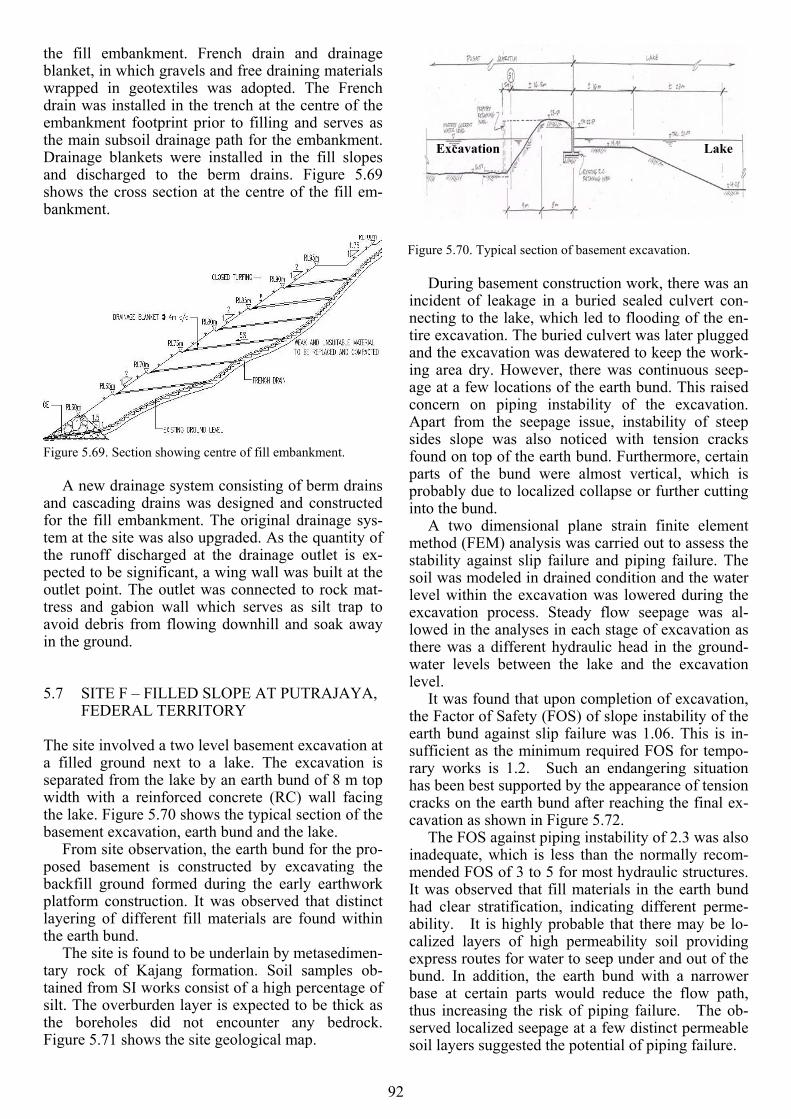
the fill embankment. French drain and drainage blanket, in which gravels and free draining materials wrapped in geotextiles was adopted. The French drain was installed in the trench at the centre of the embankment footprint prior to filling and serves as the main subsoil drainage path for the embankment. Drainage blankets were installed in the fill slopes and discharged to the berm drains. Figure 5.69 shows the cross section at the centre of the fill em-bankment.
Figure 5.69. Section showing centre of fill embankment.
A new drainage system consisting of berm drains
and cascading drains was designed and constructed for the fill embankment. The original drainage sys-tem at the site was also upgraded. As the quantity of the runoff discharged at the drainage outlet is ex-pected to be significant, a wing wall was built at the outlet point. The outlet was connected to rock mat-tress and gabion wall which serves as silt trap to avoid debris from flowing downhill and soak away in the ground.
5.7 SITE F – FILLED SLOPE AT PUTRAJAYA, FEDERAL TERRITORY
The site involved a two level basement excavation at a filled ground next to a lake. The excavation is separated from the lake by an earth bund of 8 m top width with a reinforced concrete (RC) wall facing the lake. Figure 5.70 shows the typical section of the basement excavation, earth bund and the lake.
From site observation, the earth bund for the pro-posed basement is constructed by excavating the backfill ground formed during the early earthwork platform construction. It was observed that distinct layering of different fill materials are found within the earth bund.
The site is found to be underlain by metasedimen-tary rock of Kajang formation. Soil samples ob-tained from SI works consist of a high percentage of silt. The overburden layer is expected to be thick as the boreholes did not encounter any bedrock. Figure 5.71 shows the site geological map.
Figure 5.70. Typical section of basement excavation.
Excavation Lake
During basement construction work, there was an
incident of leakage in a buried sealed culvert con-necting to the lake, which led to flooding of the en-tire excavation. The buried culvert was later plugged and the excavation was dewatered to keep the work-ing area dry. However, there was continuous seep-age at a few locations of the earth bund. This raised concern on piping instability of the excavation. Apart from the seepage issue, instability of steep sides slope was also noticed with tension cracks found on top of the earth bund. Furthermore, certain parts of the bund were almost vertical, which is probably due to localized collapse or further cutting into the bund.
A two dimensional plane strain finite element method (FEM) analysis was carried out to assess the stability against slip failure and piping failure. The soil was modeled in drained condition and the water level within the excavation was lowered during the excavation process. Steady flow seepage was al-lowed in the analyses in each stage of excavation as there was a different hydraulic head in the ground-water levels between the lake and the excavation level.
It was found that upon completion of excavation, the Factor of Safety (FOS) of slope instability of the earth bund against slip failure was 1.06. This is in-sufficient as the minimum required FOS for tempo-rary works is 1.2. Such an endangering situation has been best supported by the appearance of tension cracks on the earth bund after reaching the final ex-cavation as shown in Figure 5.72.
The FOS against piping instability of 2.3 was also inadequate, which is less than the normally recom-mended FOS of 3 to 5 for most hydraulic structures. It was observed that fill materials in the earth bund had clear stratification, indicating different perme-ability. It is highly probable that there may be lo-calized layers of high permeability soil providing express routes for water to seep under and out of the bund. In addition, the earth bund with a narrower base at certain parts would reduce the flow path, thus increasing the risk of piping failure. The ob-served localized seepage at a few distinct permeable soil layers suggested the potential of piping failure.
92
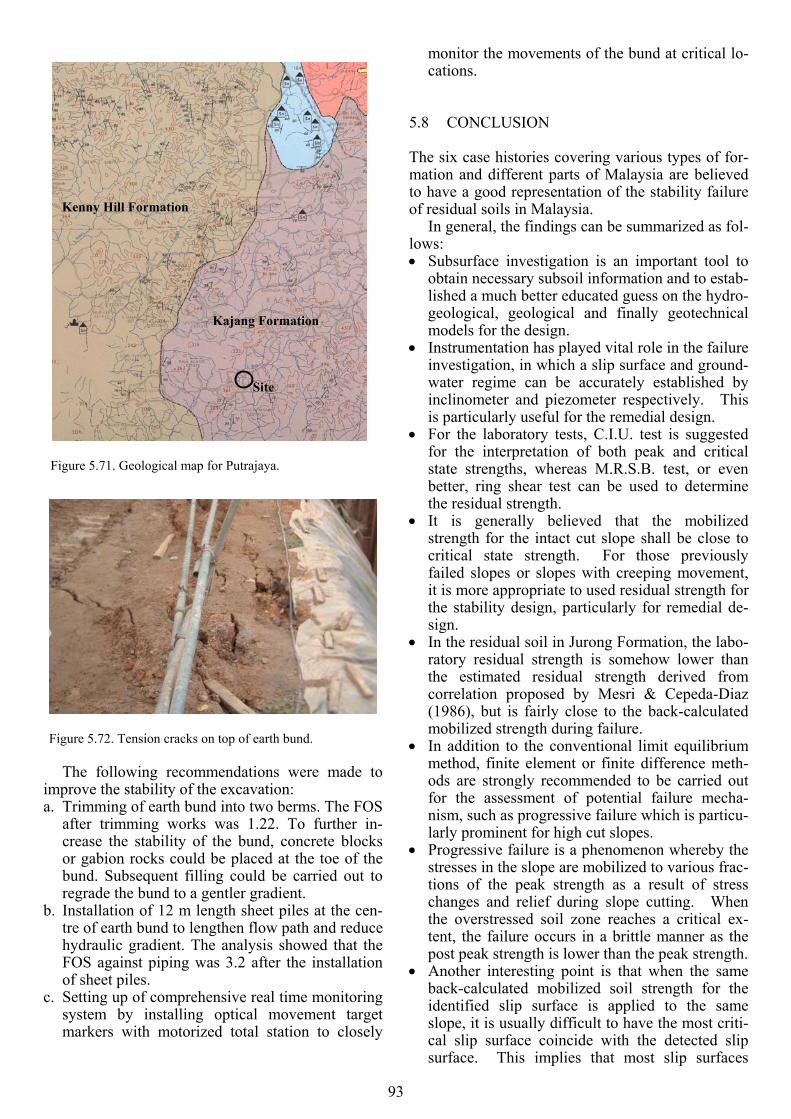
Figure 5.71. Geological map for Putrajaya.
Figure 5.72. Tension cracks on top of earth bund.
The following recommendations were made to
improve the stability of the excavation: a. Trimming of earth bund into two berms. The FOS
after trimming works was 1.22. To further in-crease the stability of the bund, concrete blocks or gabion rocks could be placed at the toe of the bund. Subsequent filling could be carried out to regrade the bund to a gentler gradient.
b. Installation of 12 m length sheet piles at the cen-tre of earth bund to lengthen flow path and reduce hydraulic gradient. The analysis showed that the FOS against piping was 3.2 after the installation of sheet piles.
c. Setting up of comprehensive real time monitoring system by installing optical movement target markers with motorized total station to closely
monitor the movements of the bund at critical lo-cations.
5.8 CONCLUSION
The six case histories covering various types of for-mation and different parts of Malaysia are believed to have a good representation of the stability failure of residual soils in Malaysia. Kenny Hill Formation
In general, the findings can be summarized as fol-lows: • Subsurface investigation is an important tool to
obtain necessary subsoil information and to estab-lished a much better educated guess on the hydro-geological, geological and finally geotechnical models for the design. Kajang Formation
• Instrumentation has played vital role in the failure investigation, in which a slip surface and ground-water regime can be accurately established by inclinometer and piezometer respectively. This is particularly useful for the remedial design.
Site
• For the laboratory tests, C.I.U. test is suggested for the interpretation of both peak and critical state strengths, whereas M.R.S.B. test, or even better, ring shear test can be used to determine the residual strength.
• It is generally believed that the mobilized strength for the intact cut slope shall be close to critical state strength. For those previously failed slopes or slopes with creeping movement, it is more appropriate to used residual strength for the stability design, particularly for remedial de-sign.
• In the residual soil in Jurong Formation, the labo-ratory residual strength is somehow lower than the estimated residual strength derived from correlation proposed by Mesri & Cepeda-Diaz (1986), but is fairly close to the back-calculated mobilized strength during failure.
• In addition to the conventional limit equilibrium method, finite element or finite difference meth-ods are strongly recommended to be carried out for the assessment of potential failure mecha-nism, such as progressive failure which is particu-larly prominent for high cut slopes.
• Progressive failure is a phenomenon whereby the stresses in the slope are mobilized to various frac-tions of the peak strength as a result of stress changes and relief during slope cutting. When the overstressed soil zone reaches a critical ex-tent, the failure occurs in a brittle manner as the post peak strength is lower than the peak strength.
• Another interesting point is that when the same back-calculated mobilized soil strength for the identified slip surface is applied to the same slope, it is usually difficult to have the most criti-cal slip surface coincide with the detected slip surface. This implies that most slip surfaces
93

probably occur at the soil band with relatively weak strength, whereas the strength outside this weak soil band is comparatively higher.
• It seems that cut slopes have a relatively high fre-quency of failure. This is probably due to many uncertainties in identifying the weak structure and establishing the adverse groundwater regime during design stage. Frequent design review and design modification during earthwork cutting will certainly help to mitigate the risk of failure, particularly early identification of weak geologi-cal features on exposed slope surface for design change. However, a filled slope could be equally unstable if not designed and constructed properly.
• The building up of pore water pressure in relation to rainfall over a certain period is still not well understood. This area needs more research work and practical design approaches for slope design.
• Provision of surface and subsoil drainage should not be overlooked as one of the key failure caus-ing factors.
REFERENCES
Brand, E.W. 1995. Slope stability and landslides under tropi-cal conditions – A review symposium on hillside develop-ment, Kuala Lumpur.
Brinkgreve, R.B.J. 2002. Plaxis-Finite element code for soil and rock analyses version 8. A.A. Balkema.
Directorate of National Mapping, Malaysia. 1986. Topography plan of Kota Kinabalu, Sabah.
Directorate of National Mapping, Malaysia. 1986. Topography plan of Ranau, Sabah.
Geological Survey of Malaysia. Draft geological map of Sepang area.
Geological Survey of Malaysia. 1974. Geological map of Kuala Betis, Kelantan.
Geological Survey of Malaysia. 1976. Geological map of Gunung Kinabalu area, Sabah, East Malaysia.
Geological Survey of Malaysia. 1976. Geological map of Se-langor.
Geological Survey of Malaysia. 1982. Mineral resources map of Johor.
Harald, W.Van Aller, P.E. 1989. Sted Version 6.5, The smart editor for Pcstabl.
Mesri, G. & Cepeda-Diaz, A.F. 1986. Residual shear strength of clays and shales. Geotechnique 36(2): 269-274.
Sarman, M. & Komoo, I. 2000. Kundasang-Ranau: Dataran warisan ais gunung, Geological society of Malaysia annual geological conference 2000, 8-9 September 2000, Pulau Pinang : 211-221.
Skempton, A.W. 1964. Long term stability of clay slopes, Geo-technique 14(2): 75-101.
Watts, C.F. & Gilliam, Daniel R., Hrovatic, Marc D, & Han Hong. 2003. User’s Manual Rockpack III for Windows.
94