rock slope failures, liquefaction and permanent de
TRANSCRIPT

1
Rock slope failures, liquefaction and permanent de-formation in 2015 Gorkha earthquake, Nepal
Hitoshi MATSUBARA1, Ömer AYDAN2, Kazuo KONAGAI3, Rama Mohan POKHREL4 and Masataka SHIGA5
1Member of JSCE, Associate Professor, Dept. of Civil Eng. And Architecture, University of the Ryukyus
(Senbaru 1, Nishihara-cho, Okinawa 903-0213, Japan) E-mail:[email protected]
2Member of JSCE, Professor, Dept. of Civil Eng. and Architecture, University of the Ryukyus (Senbaru 1, Nishihara-cho, Okinawa 903-0213, Japan)
E-mail:[email protected] 3Fellow of JSCE, Professor, Graduate School of Urban Innovation, Yokohama National University
(Tokiwadai 79-1, Hodogaya-ku, Yokohama 240-8501, Japan) E-mail:[email protected]
4Member of JSCE, JSPS Research Fellow, Institute of Industrial Science, University of Tokyo Komaba 4-6-1, Meguro-ku, Tokyo 153-8505, Japan)
E-mail:[email protected] 5Undergraduate student, Dept. of Civil Eng., Yokohama National University
(Tokiwadai 79-1, Hodogaya-ku, Yokohama 240-8501, Japan) E-mail:[email protected]
Key Facts ・ Hazard Type: Earthquake ・ Date of the disaster: April 25th, 2015 ・ Location of the survey: Kathmandu, Sunkoshi, Melamchi, Dhunche, Bungamati ・ Date of the field survey: May 27th to June 2nd, 2015 ・ Survey tools: GPS receiver ・ Key findings: Failure modes of rock slopes, In-situ initial stress state, Ground liquefaction, Spectrum
of aftershock
Key Words : Gorkha Earthquake, failure modes, initial stress, ground liquefaction, spectrum analyses
1. INTRODUCTION In Nepal, the Gorkha earthquake of Mw7.8 (USGS) occurred at 11:56 NST on 25 April 2015 with an epicentre 77 km northwest of Kathmandu that is home to nearly 1.5 million inhabitants, and at a focal depth of approximately 10-15 km. This earthquake was the one of the most powerful earthquakes to strike Nepal since the 1934 Nepal-Bihar earthquake of Mw8.1. Based on the information by the United Nations, eight million people have been affected by the massive 2015 earthquake in Nepal, more than a quarter of the Nepal’s population. The earthquake mainly resulted in about loss of
more than 8,600 people as of May 26, 2015 and it may rise again in the coming days as collapsed and
heavy damaged structures cleared away. Particularly in Nepal, historical dried masonry buildings and temples were destroyed, leaving massive piles of debris in streets. Also, this earthquake induced many mass move-
ments in mountainous areas and resulted in landslide lakes, which could be another cause of secondary disasters. The mass movements and deformation of weathered soft soil cover are the main causes of the collapse or heavy damage to buildings and heavy casualties in mountainous areas. This report outlines the findings obtained through
the field survey of the JSCE Landslide survey group, JSCE/ Japanese Geotechnical Society (JGS)/ Japan Association for Earthquake Engineering (JAEE) Joint Investigation Team for the 2015 Gorkha
JSCE Journal of Disaster FactSheets, FS2016-E-0001, 2016

2
Earthquake Disaster. In particular, we focus on the rock failures, liquefaction and newly recorded af-tershock in Nepal. 2. SLOPE FAILURE MODES AND IN-SITU STRESS STATE (1) Failure mode of rock slopes The Himalayan front in the western Nepal is char-acterized by several discontinuous segments of the Himalayan frontal thrust fault and its subsidiary faults1). This region belongs to Himalaya Arc, which was suffered repeatedly very large earthquakes with
a magnitude Mw 7.5 or more in 1100, 1505, 1555, 1724, 1803, 1833, 1883, 1897, 2005, 1947, 1950, 2005 during historical period and the instrumental period, respectively2)-4). Fig. 1 shows the focal plane solutions for the mainshock and aftershocks (Mw>6.3) of the 2015 Gorkha earthquake based on the coupled moment tensor solutions of USGS da-tabase5). Obviously, these shocks were caused by the movement of a part of the Himalaya frontal fold and thrust belt. In Nepal, sedimentary and metamorphic rocks are
heavily folded and faulted due to the tectonic movements resulting from the collision of the Indian plate with the Euro-Asian plate and subjected to
Fig.1 Illustration of focal plane solutions for the mainshock and aftershocks (Mw > 6.3). MS: Mainshock, AS: Aftershocks
MS Mw=7.8
Depth=8.2 km Apr. 25, 2015
AS1 Mw=6.6
Depth=10.0 km Apr. 25, 2015
AS2 Mw=6.7
Depth=22.9 km Apr. 26, 2015
AS3 Mw=7.3
Depth=15.0 km May 12, 2015
AS4 Mw=6.3
Depth=15.0 km May 12, 2015
Fig.2 Landslides extracted from satellite imageries6)-8) and liquefaction locations.
JSCE Journal of Disaster FactSheets, FS2016-E-0001, 2016
3
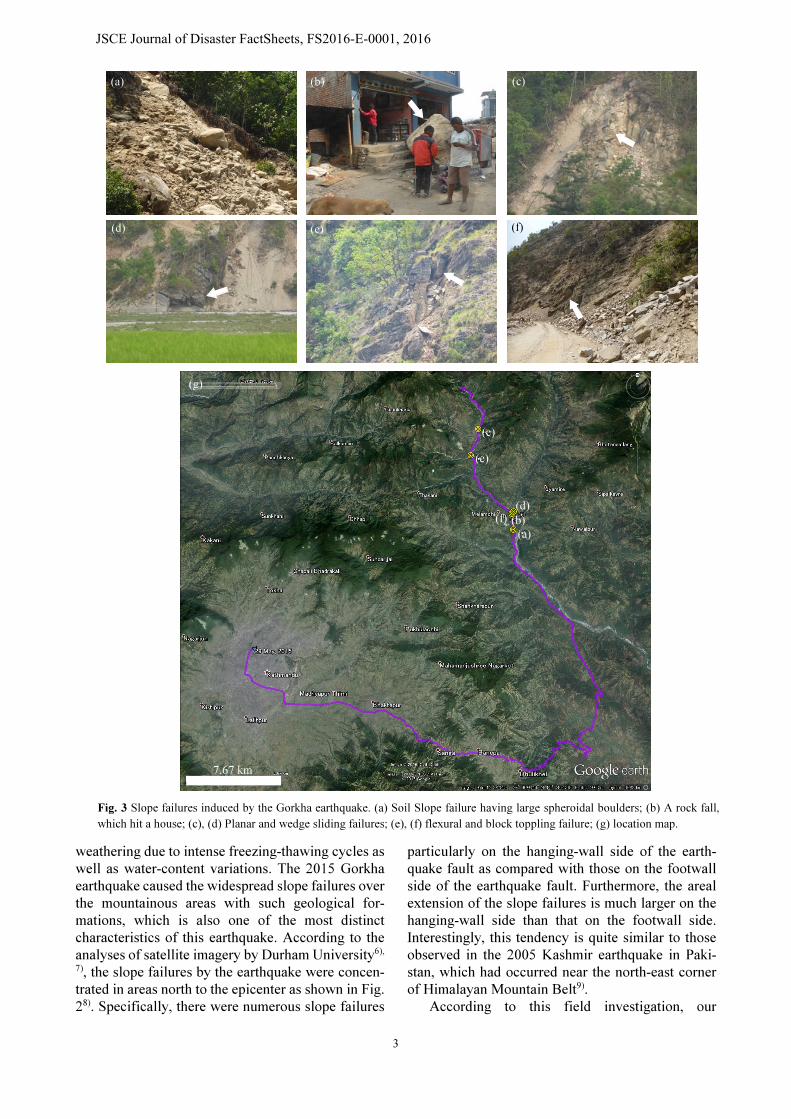
weathering due to intense freezing-thawing cycles as well as water-content variations. The 2015 Gorkha earthquake caused the widespread slope failures over the mountainous areas with such geological for-mations, which is also one of the most distinct characteristics of this earthquake. According to the analyses of satellite imagery by Durham University6), 7), the slope failures by the earthquake were concen-trated in areas north to the epicenter as shown in Fig. 28). Specifically, there were numerous slope failures
particularly on the hanging-wall side of the earth-quake fault as compared with those on the footwall side of the earthquake fault. Furthermore, the areal extension of the slope failures is much larger on the hanging-wall side than that on the footwall side. Interestingly, this tendency is quite similar to those observed in the 2005 Kashmir earthquake in Paki-stan, which had occurred near the north-east corner of Himalayan Mountain Belt9). According to this field investigation, our
Fig. 3 Slope failures induced by the Gorkha earthquake. (a) Soil Slope failure having large spheroidal boulders; (b) A rock fall, which hit a house; (c), (d) Planar and wedge sliding failures; (e), (f) flexural and block toppling failure; (g) location map.
(b) (c)
(d) (e) (f)
7.67 km
(a) (b) (d) (f)
(e) (c)
(g)
(a)
JSCE Journal of Disaster FactSheets, FS2016-E-0001, 2016

4
observations on the 2005 Kashmir Earthquake1) and some information from the world wide web network, the common forms of slope failures by this earth-quake may be categorized as (i) surficial plastic de-formations and flow of top soil or weathered zone, (ii) planar and wedge sliding and (iii) flexural or block toppling as shown in Fig. 3. Some soil slopes failures consisting of spheroidal boulders deposits were also observed (Fig. 3(a)). These type ground conditions were mainly observed in valleys carved by fast-flowing rivers. Many large granitic or gneissic boulders in a heavily weathered rocks be-come loose due to intense shaking and damaged living environment as shown in Fig. 3(b). These rock falls were observed along rivers with steep slopes. Planar and wedge sliding failures were observed
mainly in Schist, Phyllite, and Shale (Fig. 3(c), (d)). The flexural or block toppling failure caused by strong shaking induced by the earthquake were also observed in the slopes consisting of weathered metamorphosed rocks, whose schistosity plane dip-ping into mountain (Fig. 3(e), (f)). The planar failure of rock slopes was mainly due to sliding on schis-tosity planes of metamorphic rocks or bedding planes of sedimentary rocks mainly at the slopes facing the causative fault plane. For references, Fig. 4 shows some rock samples, which were collected through this investigation from the sites large slope failures. Although the available data are quite limited, an attempt was made on the attenuation of strong mo-tion together with observed and inferred data from the collapsed or toppled structures in Fig. 5. In the figure, ‘Simples Structures’ imply block models 10)-12), through which we may infer the acceleration levels of earthquake for different failure modes in areas without some recording devices. The data is generally consistent with available empirical rela-tions proposed by various researchers13)-18).
Fig. 6 compares the relationship between the earthquake magnitude and the hypocentral distance of failed slopes according to the relation of Aydan et al 19)-21). This relationship is given by the following form.
CAeR wMB −−+⋅= ⋅ )sin5.1sin5.03( 20 θθ (1)
where R0, θ, Mw are the hypocentral distance, the angle between the observation point and the strike of the fault and the moment magnitude, respectively. When the values of angle (θ ) are 90 and 270, they correspond to pure hanging wall (HW) and footwall
(d)
(a) (b) (c)
(e) (f)
Fig.4 Rock samples. (a) phyllite at Sunkoshi, (b) quarzitic schist at Melamchi, (c) schist with quartzite nodule at Sunkoshi, (d) schist at Dhumche, (e) gneiss at Melamchi, (f) quartzite at Sunkoshi
Fig.5 Comparison of various empirical relations for attenu-ation of maximum ground acceleration with observed and inferred data.
JSCE Journal of Disaster FactSheets, FS2016-E-0001, 2016

5
(FW) conditions, respectively. A, B and C are em-pirical constants, and their values differ depending upon the characteristics of the earthquake19). The values of A, B and C in coherent condition are 0.2, 0.8, 30, respectively. Whereas, in disrupted condi-tion, A, B and C are 0.3, 0.8 and 25, respectively. From Fig. 6, The plotted case histories are quite consistent with estimations from this empirical rela-tion.
(2) In-situ stress state An extensive in-situ full stress tensor inferences were carried out at the epicenter of mainshock and aftershocks shown in Fig. 1 by using Aydan’s method22), 23) based on the USGS database5). In these measurements, the friction angle of the fault was set to 30° for the stress inference computations. Fig. 7 shows examples of the computer-output diagrams for the mainshock on April 25th, 2015 (MS in Fig. 1) and the aftershock on May 12th, 2015 (AS3 in Fig. 1). Table 1 summarized the inferred results together (MS, AS1-4). As a result, the largest horizontal stress will act in the direction of NNE-SSW ( 8.6=
Hdσ ),
which is nearly perpendicular of the Himalayan frontal thrust fault. Note that the horizontal stress of the aftershock are larger than that of the mainshock. Additionally, we computed the stress state of four major earthquakes in the Himalayan area from their focal plane solutions based on USGS data base. Computation results are also given in Table 1. The
Fig.6 Comparison of empirical relations with observations. (c) Disrupted
(b) Coherent slopes
(a) Mapped landslides
Fig.7 Examples of inferred initial stress state for the Gorkha earthquake: Upper hemisphere equal angle projection. (a) Mainshock on April 25th, 2015, (b) Aftershock on May 12th, 2015. (■: σ1/ σv, ◆: σ2/ σv, ▲: σ3/ σv, ●: Compression, ●: Tension)
(a)(a) σH/ σv
σh/ σv
(b)(b)
σh/ σv
σH/ σv
JSCE Journal of Disaster FactSheets, FS2016-E-0001, 2016

6
maximum horizontal stresses inferred by the focal mechanism solutions are also close to those by the Gorkha Earthquakes.
3. GROUND LIQUEFACTION Bungamati is a village located in Lalitpur district of central Nepal, and the village is approximately 9 km
Table 1 Comparison of computed results with measurements for USGS
Fig.8 Bungamati liquefaction locations and some observed ground raptures.
61 m
BungamatiGround Raptures
Fig.9 Bungamati liquefaction location. (a) Overview; (b) Example of a rupture; (c) Boiled sand.
(a) (b) (c)
JSCE Journal of Disaster FactSheets, FS2016-E-0001, 2016

7
away from Katmandu in direction of SSW (Fig. 8). In this region, Kalimati clay (lacustrine facies) is dis-tributed24), and there are some ponds, so called Bungamati pond. In this investigation, the wide spread ground liquefaction was observed in the Bungamati region as shown in Fig. 9. From satellite image analysis and field survey, the liquefaction area was presumably 0.25 km2. At this particular location, there are four ground ruptures at least (see Fig. 8), the length of the ruptures ranges from 20 to over 50 m, and the separation of the ruptures was approxi-mately 5 to 20 cm. On the ground anywhere, boiled soils were observed. The inhabitants at this village mentioned that the ejected boiled soil reached 1 m or more above the ground. Grain-size distribution and shear tests were car-
ried out on soil samples from these sand boils. The grain size distribution of boiled soil samples ranged from fine to coarse visually (Fig. 10). Fig. 11 and Table 2 shows the results of shear test, and Fig. 12 shows grain size distributions of soil samples to-gether with liquefaction limits. As noted from Fig. 12, most of the grain-size distributions fall within easily liquefiable zone. Therefore, the observation of widespread ground liquefaction occurred in the Bungamati region by the 25th April, 2015 earthquake was a consequence of natural ground conditions in this region.
Table 2 Results of the shear test on boiled sands. Sample-1 Sample-2
Internal friction angle (φ: deg.) 25.6 41.5
Apparent cohesion (c: kN/m2) 10.6 11.0
Also, there were some reports that ground lique-faction was also observed at several locations nearby Bungamati such as Imadol and Bihar in India. There are several relations to estimate the limiting epicen-tral/hypocentral distances for the site of liquefac-tion25)-28). An equation based on moment magnitude with the consideration of orientation of the earth-quake fault is proposed by Aydan and given as fol-lows26):
)sin5.1sin5.03(08.0 29.01 θθ −+⋅= wMeR (2)
where R1, θ, Mw are the hypocentral distance, the angle between the observation point and the strike of the fault and the moment magnitude, respectively. Estimations from this equation together with other available equations are compared with the ground liquefaction data of the 2015 Gorkha Earthquake in Fig. 13 with the considerations of magnitude
(a) (b)
Fig.10 Sampled sands. (a) Coarse sand (sample-1); (b) Fine sand (sample-2).
0
50
100
150
200
250
0 50 100 150 200 250 300
Shear
stren
gth (k
N/m2
)
Normal stress σ (kN/m2)
Sample-1Sample-2
Fig.11 Relationship between normal stress and shear strength.
Fig.12 Comparison of grain size distribution of boiled soil samples with liquefiability bounds.
0
25
50
75
100
0.001 0.01 0.1 1 10
Perce
ntage
passi
ng (%
)
Grain size (mm)
Sample-1Sample-2
Boundaries for potentially liquefiable soils
Boundaries for most liquefiable soils
JSCE Journal of Disaster FactSheets, FS2016-E-0001, 2016

8
conversion as well as the difference between epi-central and hypocenter distances. All of the empiri-cal relations provide good bounds for the maximum limiting distance for ground liquefaction, and Eq. (2) takes into account the faulting orientation also. On the other hand, the detail mechanism of ex-
tensive sand boiling in Bungamati has not been clarified yet. However, the clarification of the phe-nomena may be also one of the important issues in relation to structural safety of super structures and housing on such ground conditions. 4. ACCELERATION AND PERMANENT
DEFORMATION IN KATHMANDU – Potable strong motion instrumentation
The permanent deformation is estimated by using acceleration records in Kanthi-path at Kathmandu. Although there are various procedures for evaluating ground velocity and ground displacement from ac-celeration records, the Erratic Pattern Screening (EPS) method proposed by Ohta and Aydan29) and Aydan and Ohta14) was employed in this study as this method takes into account the fault rupture duration, p-s wave arrival time difference, instrumental noises and triggering levels. Fig. 14 shows the permanent deformations with
acceleration and velocity in direction of NW, EW and UD. The recorded acceleration data is provided by the Center for Engineering Strong Motion Data (CESMD)30). From this figure, we can infer that the ground was moved by 3.2 m (= 22 12.241.2 + ) in direction of SE, and was uplifted by 1.8 m. In this manner, it is possible to evaluate crustal defor-mations associated with earthquakes from the measured acceleration records. However, there is only one strong motion station in Kathmandu city
(a)
(b)
Fig.15 Views of stand-alone-type accelerometer. (a) Instal-lation condition, (b) Zooming in of the instrument.
Fig.14 The permanent deformations in Kanthi-path at Kathmandu city.
(a) North-South direction
(b) East-West direction
(c) Up-Down direction
Fig.13 Comparison of empirical relations with observed data on ground liquefaction.
JSCE Journal of Disaster FactSheets, FS2016-E-0001, 2016

9
established by USGS in Nepal and there is great necessity to monitor strong motions in much broader area using a dense network of strong motions like Japan. Usually, such extensive strong motion in-strumentation and its maintenance may be too ex-pensive for developing countries such as Nepal. In this investigation, a compact portable
stand-alone type accelerometer was installed in the hotel at Kathmandu city (N27° 43′ 9.5″, E85° 19′ 17.5″) as shown in Fig. 15. This accelerometer has been developed by Aydan et al., which can be set to a trigger mode at a selected acceleration level and having a storage capacity of 2 GB. Fig. 16 shows an acceleration record taken during an aftershock (May 30th, 2015(GMT+5:45)). The primary wave and the secondary wave are clearly recorded. Fig. 17 shows the Fourier spectra and acceleration
response spectra of the observed ground motion. Spectra of horizontal direction (X) exhibit well correlated peak acceleration in the vicinity of 1 Hz whereas there is the highest value in the lower fre-quency area. Although we need to examine the
characteristics of recorded waves in detail by using large number of dataset, this device could be useful for assessing the response of free-field ground mo-tions as well as responses of structures during earthquakes. 5. CONCLUSION The authors reported the field survey results and their analytical results of 2015 Gorkha earthquake in Nepal regarding the slope failures, in-situ stress state, ground liquefaction, permanent deformation and obtained aftershock-waves. From this study, the following conclusions would be described: (1) The earthquake caused the widespread slope
failures over the mountainous, which were par-ticularly concentrated on the hanging-wall side of the earthquake fault as compared with those on the footwall side of the earthquake fault. This tendency was quite similar to those observed in the 2005 Kashmir earthquake in Pakistan.
0 0.5 1 1.5 2 2.5 3
Accel
eratio
n (ga
ls)
Time (seconds)
0
50
NS max. = 19.6
EW max. = 14.7
UD max. = 50.0
Fig.16 Acceleration records taken on May 30th, 2015 aftershock at Kathmandu.
0102030405060
70
0.05 0.5 5
Accel
eratio
n spe
ctra (
gals)
Period (Seconds)
X (h=0.0) Y (h=0.0) Z (h=0.0)X (h=0.1) Y (h=0.1) Z (h=0.1)
0
0.1
0.2
0.3
0.4
0.5
0.6
0.8 8
Accel
eratio
n pow
er spe
ctra (
gal2 )
Frequency (Hz)
XYZ
(a) (b)
Fig.17 Results of spectral analyses for May 30th aftershock. (a) Fourier power spectra, (b) Acceleration response spectra.
JSCE Journal of Disaster FactSheets, FS2016-E-0001, 2016

10
(2) The common forms of slope failures by this earthquake may be categorized as (i) surficial plastic deformations and flow of top soil or weathered zone, (ii) planar and wedge sliding and (iii) flexural or block toppling.
(3) The comparison studies with various empirical relations for attenuation of maximum ground acceleration and magnitude were carried out.
(4) From the analysis of in-situ stress state, the largest horizontal stress acts in the direction of NNE-SSW, which is nearly perpendicular of the Himalayan frontal thrust fault. The maximum horizontal stresses inferred by the focal mecha-nism solutions of other four earthquakes oc-curred at Himalayan region were also close to those inferred for the Gorkha Earthquakes.
(5) The wide spread ground liquefaction and many ground ruptures were observed in the Bungamati region. From the grain size distribution test of the boil sands, most of the grain-size distribu-tions fall within easily liquefiable zone. Addi-tionally, according to the comparison study of empirical relations on ground liquefaction, some empirical relations provide good bounds for the maximum limiting distance for ground liquefac-tion.
(6) The clarification of the mechanism of extensive sand boiling phenomenon may be one of the important issues in relation to structural safety of super structures and housing on such ground conditions.
(7) The permanent deformation was estimated by using acceleration records in Kanthi-path at Kathmandu.
(8) A compact portable stand-alone type accel-erometer, which can be used anywhere and any-time, was installed in the hotel at Kathmandu city, and an acceleration record taken during an aftershock. These kinds of device may be of great help for engineers for assessing the seismic response and stability as well as design of structures.
ACKNOWLEDGMENT: We would express our sincere special thanks to the authors go to Mr. Masashi Ogawa, Ambassador, Mr. Shinya Machida, Counsellor, and Mr. Makoto Oyama, First Secretary at the Embassy of Japan, Kath-mandu, Nepal, who have provided the authors with briefing of the earthquake-induced damage, and organized an information exchange meeting among Japanese reconnaissance teams. Additionally, the students of Geo-technical and Geo-environmental
Laboratory at University of the Ryukyus have helped the experiment presented in this report and we would like to express our appreciation to all of them. REFERENCES 1) Aydan, Ö.: Geological and seismological aspects of Kash-
mir earthquake of October 8, 2005 and a geotechnical evaluation of induced failures of natural and cut slopes, Journal of the School of Marine Science and Technology, Vol. 4(1), pp.25-44, 2006.
2) Bilham, R.: Earthquakes in India and the Himalaya: tec-tonics, geodesy and history, Annals of Geophysics, Vol. 47, No. 2-3, pp. 839-857, 2004.
3) Bilham, R.: The seismic future of cities, Bulletin of Earth-quake Engineering, Vol. 7(4), pp.839-887, 2009.
4) Bilham, R., Gaur, V.K. and Moinar, P.: Himalayan seismic hazard, Science, Vol. 293, No. 5534, pp. 1442-1444, 2001.
5) USGS: Earthquake Hazards Program M7.8 – 36km E of Khudi, Nepal (http://www.usgs.gov/), 2015.
6) Durham University / BGS Team, Nepal earthquake land-slide locations, 8 May 2015, https://data.hdx.rwlabs.org/dataset/lands
7) Durham / BGS Team, Nepal: UPDATED (28 May) land-slide inventory following 25 April Nepal earthquake, etc., http://ewf.nerc.ac.uk/blog/
8) Konagai, K., Pokharel, R.M., Matsubara, H. and Shiga, M.: Geotechnical aspect of the damage caused by the April 25th Gorkha earthquake of Nepal, JSCE Journal of Disaster FactSheets, FS2015-E-0002, 2015.
9) Aydan, Ö., Ohta, Y. and Hamada, M.: Geotechnical evalu-ation of slope and ground failures during the 8 October 2005 Muzaffarabad earthquake, Pakistan, Journal of Seis-mology, Vol. 13(3), pp. 399-413, 2009.
10) Okamoto, S.: Introduction to earthquake engineering, Univ. Tokyo Press., 1973.
11) Aydan, Ö., Shimizu Y. and Ichikawa Y.: The Effective Failure Modes and Stability of Slopes in Rock Mass with Two Discontinuity Sets, Rock Mechanics and Rock Engi-neering, Vol. 22, pp. 163-188, 1989.
12) Aydan, Ö.: The Inferences of Earthquake Fault and Strong Motions in Kutch Earthquake, India of January 26, 2001, Proceedings of the Symposium on Recent Damaging Earthquakes around the World, pp. 135-140, 2002.
13) Aydan, Ö.: Comparison of suitability of submerged tunnel and shield tunnel for subsea passage of Bosphorus (in Turkish), Geological Engineering Journal, Vol. 25(1), pp. 1-17, 2001.
14) Aydan, Ö. and Ohta, Y.: A new proposal for strong ground motion estimations with the consideration of characteristics of earthquake fault, Seventh National Conference on Earthquake Engineering, Istanbul, Turkey Paper No 65, 10p, 2011.
15) Fukushima, Y., Tanaka, T. and Kataoka, S.: A new attenu-ation relationship for peak ground acceleration derived from strong motion accelerograms, 9th World Congress of Earthquake Engineering, Tokyo, pp. 343-348, 1988.
16) Joyner, W.B. and Boore, D.M.: Peak horizontal acceleration and velocvity from strong motion records from the 1979 Imperial Valley California Earthquake, Bulletin of Seis-mological Society of America, Vol. 71(6), pp./ 2011-2038, 1981.
17) Campbel, K.W.: Near source attenuation of peak horizontal acceleration, Bulletin of Seismological Society of America,
JSCE Journal of Disaster FactSheets, FS2016-E-0001, 2016
11
Vol. 71(6), 2039-2070, 1981. 18) Ulusay, R., Tuncay, E., Sonmez, H. and Gokceoglu, C.: An
attenuation relationship based on Turkish strong motion data and iso-acceleration map of Turkey, Engineering Ge-ology, Vol. 74, pp. 265-291, 2004.
19) Aydan, Ö., Ohta, Y. and Hamada, M.: Geotechnical evalu-ation of slope and ground failures during the 8 October 2005 Muzaffarabad earthquake, Pakistan, Journal of Seis-mology, Vol. 13(3), pp. 399-413, 2009.
20) Aydan, Ö., Ulusay, R., Hamada, M. and Beetham, D.: Ge-otechnical aspects of the 2010 Darfield and 2011 Christ-church earthquakes of New Zealand and geotechnical damage to structures and lifelines. Bulletin of Engineering Geology and Environment Vol. 71, pp. 637–662, 2012.
21) Aydan, Ö. and Tano, H.: The damage to abandoned mines and quarries by the Great East Japan Earthquake on March 11, 2011, Proceedings of the international symposium on engineering lessons learned from the 2011 Great East Japan Earthquake, Tokyo, pp. 981-992, 2012.
22) Aydan, Ö.: A new stress inference method from the stress state of Earth’s crust and its applications, Yerbilimleri, Vol. 22, pp. 223-236, 2000.
23) Aydan, Ö. and Kim, Y.: The inference of crustal stresses and possible earthquake faulting mechanism in Shizuoka Pre-fecture from the striations of faults, Journal of the School of Marine Science and Technology, Tokai University, No. 54, pp. 21-35, 2002.
24) HarutakaK, S.: Stratigraphic division sedimentary facies of
the Kathmandu basin group, Central Nepal, Journal of Nepal Geological Society, Vol. 25, PP. 19-32, 2001.
25) Ambrasseys, N.N.: Engineering Seismology, Earthq Eng Struct Dynam, Vol. 5(17), pp. 1-105, 1988.
26) Aydan, Ö., Ulusay, R., Kumsar, H., Sönmez, H. and Tuncay, E.: A site investigation of June 27, 1998 Adana-Ceyhan earthquake, Turkish Earthquake Foundation, TDV/DR 006-03, p131, 1998.
27) Kuribayashi, E. and Tatsuoka, F.: Brief review of soil liq-uefaction during earthquakes in Japan, Soils Found, Vol. 15(4), pp. 81-92, 1975.
28) Wakamatsu, K.: Liquefaction history, 416-1997, Japan, Proceedings of 12th World Conference on earthquake en-gineering, Paper No. 2270, p8, 2000.
29) Ohta, Y. and Aydan, Ö.: An integration technique for ground displacement from acceleration records and its ap-plication to actual earthquake records, Journal of the School of Marine Science and Technology, Tokai University, Vol. 5(2), pp. 1-12, 2007.
30) Center for Engineering Strong Motion Data: http://www.strongmotioncenter.org/
(Received January 11, 2016)
JSCE Journal of Disaster FactSheets, FS2016-E-0001, 2016