slinking into the future (display industry spirals)
TRANSCRIPT

Slinking into the Future
Looking back on two decades of displays —David Barnes, May 2015

Slinky Business—loops within loops
16 May 2015 Slinking into the Future 2
C1
D1
B2
A3 A2
Excitement
Disappointment Experiment
Discouragement
… and onto the next!
The FPD industry and its markets loop from cycle to cycle as producers loop from product to product in a cycle of experiment–discouragement–excitement–disappointment… then another experiment.

Slinky Business–some prior loops
Experiment Discouragement Excitement Disappointment
Display–PDP 1992: color PDP 1996: Plasmaco sale 2000: NHK HD 2008: exits begin
Nation–Taiwan 1990: Unipac, et alli 1998: ITRI stymied 2004: Securities! 2010: China policy
Product–DPF 2000: novelty 2005: usage model? 2007: $388 m peak 2012: bargain bins
Feature–s3D 1997: FLC shutter 2002: Picvue et alli 2010: Blue-ray 3D 2013: content?
Process–IJCF 2001: Toppan et. al. 2005: PI app only 2009: Sharp Sakai 2012: restructure
16 May 2015 Slinking into the Future 3
Prior to 2008, next-gen fabs or PC upgrades drove major loops in nominal three-year cycles. Since then, product-market development such as iPhone have been necessary for substantial cycles. Novel value propositions such as 3D have generated short-cycle loops. The omnipresent opportunity for “hi-rez” panels is a classic example of endless spirals.

0 5
10 15 20 25 30
1999 2004 2009 2014
TV
Mobile
PC
z'Rest
$0 $1,000 $2,000 $3,000 $4,000 $5,000 $6,000
1999 2004 2009 2014
TV
Mobile
PC
z'Rest
Display Industry Review—flat TV and mobile displays
16 May 2015 Slinking into the Future 4
Thanks to IHS, we have three decades of great data to study. TV screen area surged after 2004 with ever larger panels and smaller prices. In 2014, TV screens comprised 45% of display sales and 70% of area. Without the mobile revolution sales would have grown 6% a year instead of 8% (with a surge since 2007).
Increasing diversity has kept total price decay to 3% a year.
0 30 60 90
120 150 180
1999 2004 2009 2014
z'Rest
PC
Mobile
TV
$0 $25 $50 $75
$100 $125 $150
1999 2004 2009 2014
z'Rest
PC
Mobile
TV
USD billions
m² millions
WADE”
USD/m²
Note: WADE is the weighted-average display edge in inches: Sqrt(area)

Display Technology Review—AMLCD predominates
16 May 2015 Slinking into the Future 5
0%
20%
40%
60%
80%
100%
1999 2004 2009 2014
Other
CRT
PDP
PMFPD
AMFPD
$0 $25 $50 $75
$100 $125 $150
1999 2004 2009 2014
Proj.
FED
EL
VFD
CRT
PMFPD
PDP
AMFPD
CRT captured 54% of display sales and delivered 90% of screen area in 1999. By 2014 those figures were near zero. Many challengers came and went. Remember FED, TFEL, PDP, EPD and electrowetting technologies? Aggressive investment in a capacity race made AMLCD the predominate display technology and even a close variant, AMOLED, remains a distant challenger this decade. Capacity leadership has shifted from Japan to Korea, to Taiwan and now to China as nations supported champions. Panel makers have acted as non-profit contributors to national infrastructure and have realized returns only after restructure.
So, will China be the last national entrant? Will AMLCD slink into maturity or will it march towards rejuvenation?
USD billions
Area Share
AMLCD Review—value flows to consumers
16 May 2015 Slinking into the Future 6
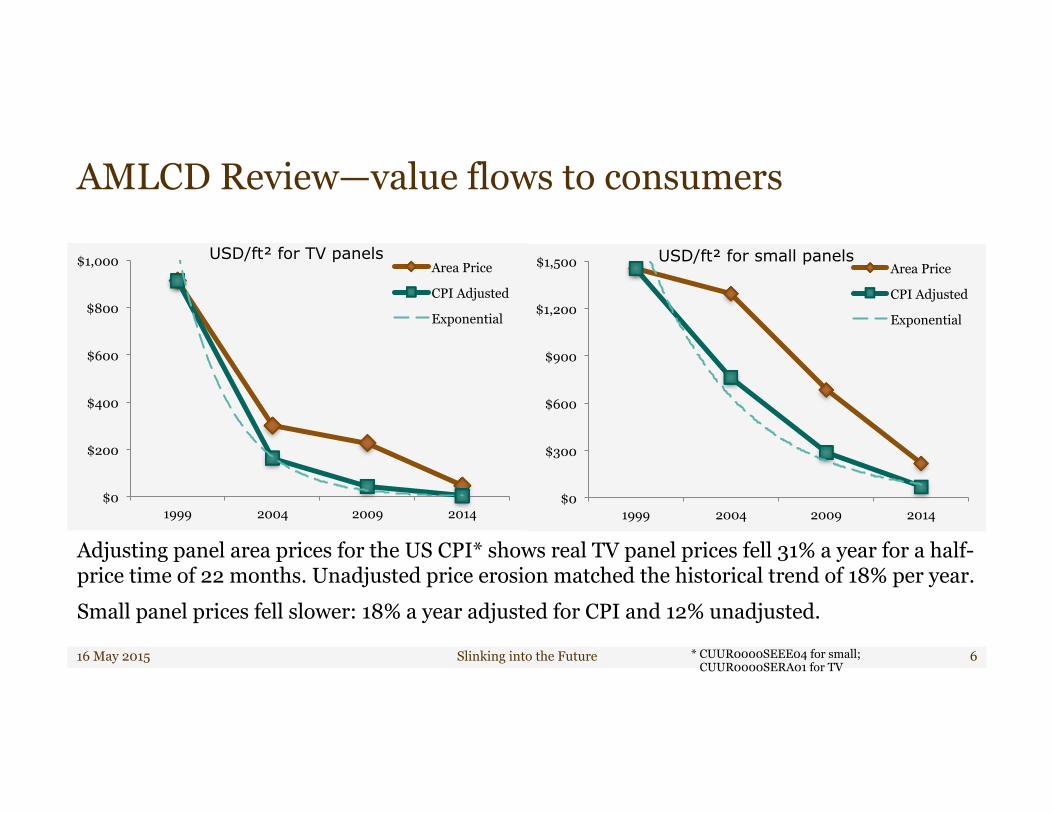
Adjusting panel area prices for the US CPI* shows real TV panel prices fell 31% a year for a half-price time of 22 months. Unadjusted price erosion matched the historical trend of 18% per year. Small panel prices fell slower: 18% a year adjusted for CPI and 12% unadjusted.
$0
$200
$400
$600
$800
$1,000
1999 2004 2009 2014
Area Price
CPI Adjusted
Exponential
$0
$300
$600
$900
$1,200
$1,500
1999 2004 2009 2014
Area Price
CPI Adjusted
Exponential
USD/ft² for TV panels USD/ft² for small panels
* CUUR0000SEEE04 for small; CUUR0000SERA01 for TV

45% 30%
40%
16% 26%
18%
15% 25% 10%
10% 13%
13%
14% 6% 20%
0%
20%
40%
60%
80%
100%
2004 2009 2014
Labor+OH
Polarizers
Substrates
Backlights
IC & other
63% 71% 60%
10% 5%
15%
19% 14% 14%
7% 11% 11%
0%
20%
40%
60%
80%
100%
2004 2009 2014
Expenses
Depreciation
Labor+OH
Material
AMLCD Review—value flows to suppliers
16 May 2015 Slinking into the Future 7
Even leading AMLCD makers see 75% of their cost as variable, material cost primarily. For LGD, we see effects of new technology projects on labor and affiliated sourcing of glass. Notice also the normalization of backlight cost as LED suppliers became efficient.
LGD Cost Structure Cash COS Structure
0
2
4
6
8
10
Q1'90 Q1'95 Q1'00 Q1'05 Q1'10 Q1'14
First Fabs
Model
AMLCD Review—capacity expansion peaked in 2009
16 May 2015 Slinking into the Future 8
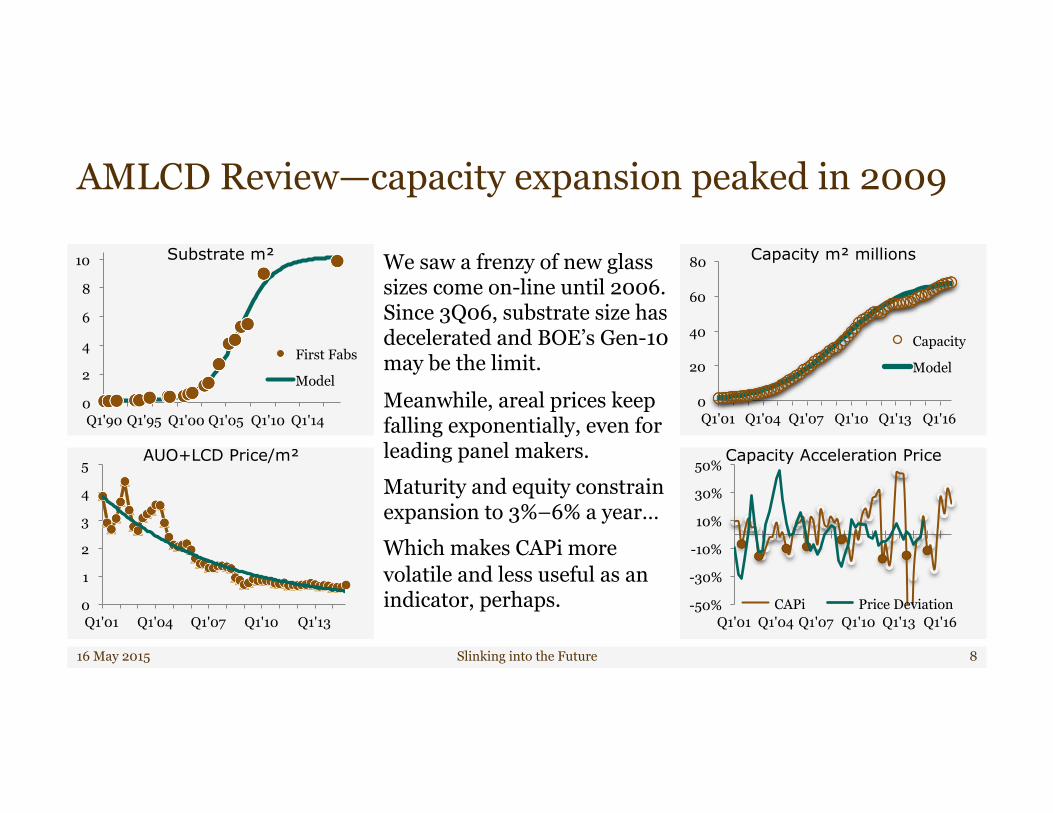
We saw a frenzy of new glass sizes come on-line until 2006. Since 3Q06, substrate size has decelerated and BOE’s Gen-10 may be the limit.
Meanwhile, areal prices keep falling exponentially, even for leading panel makers. Maturity and equity constrain expansion to 3%–6% a year… Which makes CAPi more volatile and less useful as an indicator, perhaps.
0
20
40
60
80
Q1'01 Q1'04 Q1'07 Q1'10 Q1'13 Q1'16
Capacity
Model
Capacity m² millions Substrate m²
-50%
-30%
-10%
10%
30%
50%
Q1'01 Q1'04 Q1'07 Q1'10 Q1'13 Q1'16 CAPi Price Deviation 0
1
2
3
4
5
Q1'01 Q1'04 Q1'07 Q1'10 Q1'13
AUO+LCD Price/m² Capacity Acceleration Price
-20% 0%
20% 40% 60% 80%
100%
0 10 20 30 40 1999 2004 2009 2014
0% 20% 40% 60% 80%
100%
0.0 0.5 1.0 1.5 2.0
1999 2004 2009 2014
AMLCD Review—the rise of wireless diversity
16 May 2015 Slinking into the Future 9
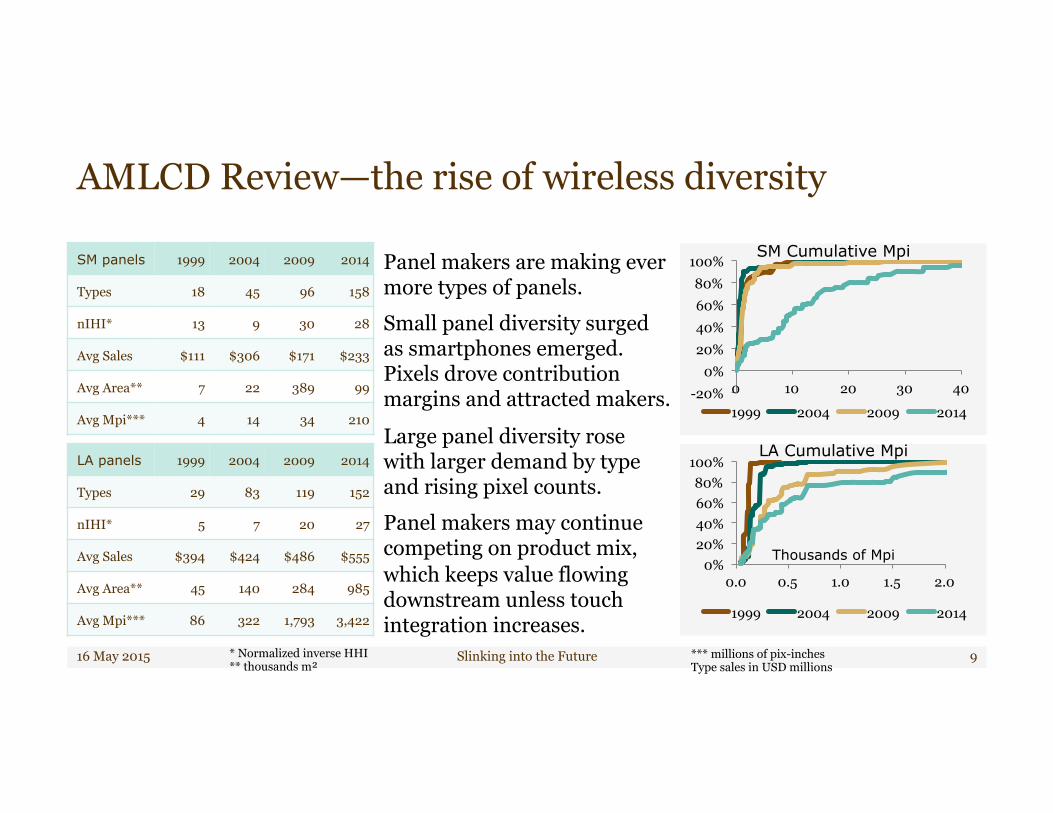
Panel makers are making ever more types of panels. Small panel diversity surged as smartphones emerged. Pixels drove contribution margins and attracted makers.
Large panel diversity rose with larger demand by type and rising pixel counts. Panel makers may continue competing on product mix, which keeps value flowing downstream unless touch integration increases.
SM Cumulative Mpi
LA Cumulative Mpi
SM panels 1999 2004 2009 2014
Types 18 45 96 158
nIHI* 13 9 30 28
Avg Sales $111 $306 $171 $233
Avg Area** 7 22 389 99
Avg Mpi*** 4 14 34 210
LA panels 1999 2004 2009 2014
Types 29 83 119 152
nIHI* 5 7 20 27
Avg Sales $394 $424 $486 $555
Avg Area** 45 140 284 985
Avg Mpi*** 86 322 1,793 3,422
* Normalized inverse HHI ** thousands m²
*** millions of pix-inches Type sales in USD millions
Thousands of Mpi

AMLCD Review—the fall of Taiwan
16 May 2015 Slinking into the Future 10
Left— Taiwan’s panel makers remain unprofitable and have generated negative free cash flow of $11.7 billion. It would look worse if AUO had not stopped investing so much. Right—AUO+LGD enjoy elastic demand. Average area price should decline 30% if industry doubles but these leaders became ΣFCF positive after 15 years… hoorah! So there is some hope for leaders who expand slowly.
5
6
7
8
15 16 17 18 19
LN(P) vs LN(Q) 2X 2014 Output ŋ = –1.75
($8)
($4)
$0
$4
$8
2001 2004 2007 2010 2013
FCF
∑ FCF
($25) ($20) ($15) ($10)
($5) $0 $5
$10
2001 2004 2007 2010 2013
Annual CFO Annual PP&E Cumulative FCF
($10) $0
$10 $20 $30 $40 $50
2001 2004 2007 2010 2013
Sales EBITDA EBIT AUO+LGD Elasticity
AUO+LGD (USD b) Taiwan (USD b)
Taiwan (USD b)

Slinky Business—future loops depend on funding
16 May 2015 Slinking into the Future 11
Who will fund more capacity after China digs several more money pits? Will we see project funding (JV, etc.), supply funding (e.g. Apple) or creative vertical integration (perhaps state sponsored)? … or will we see FPD slink into a CRT-like future of cash management?
* light-field display
Excitement
Disappointment Experiment
Discouragement
… and onto India? OLED
EPD
China
Taiwan
IGZO
LFD* OLET

Our services…
16 May 2015 Slinking into the Future 12
Growth
§ Market entry § Business structure § Phase gates, R&D
Technologies
§ Market sensing § Market & IP value § Consortia synergy
Alliances
§ M&A candidates § Partnerships, JVs § Integration plans
Plans
§ Strategic audits § Investor insights § Business valuation
Materials
§ Pricing policies § Market strategies § Licenses, royalties
Performance
§ Price position § Cost reduction § Portfolio balance
CapEx
§ Factory plans § Tool selections § Plant conversions
Sourcing
§ Make/buy § Value chains § Supplier selection