sleep and wake classi cation with ecg and respiratory e ... · wake classi cation with ecg and...
TRANSCRIPT
PreprintCitation: Karlen, W, Mattiussi, C and Floreano, D (2009) Sleep andWake Classification With ECG and Respiratory Effort Signals IEEE Trans-actions on Biomedical Circuits and Systems, To appear
The definitive version of this article will be available at:http://ieeexplore.ieee.org
Sleep and Wake Classification With ECG and Respiratory EffortSignals
Walter Karlen∗, Claudio Mattiussi and Dario Floreano
Laboratory of Intelligent Systems, Ecole Polytechnique Federale de Lausanne (EPFL), Lausanne, Switzerland
We describe a method for the online classification of sleep/wake states based on cardiorespiratory signalsproduced by wearable sensors. The method was conceived in view of its applicability to a wearable sleepinessmonitoring device. The method uses a Fast Fourier Transform as the main feature extraction tool and afeed-forward Artificial Neural Network as a classifier. We show that when the method is applied to datacollected from a single young male adult, the system can correctly classify on average 95.4% of unseen datafrom the same user. When the method is applied to classify data from multiple users with the same age andgender, its accuracy is reduced to 85.3%. However, a Receiver Operating Characteristic analysis shows that,compared to actigraphy, the proposed method produces a more balanced correct classification of sleep andwake periods. Additionally, by adjusting the classification threshold of the neural classifier, 86.7% of correctclassification is obtained.
biomedical signal analysis | wearable computing | sleep and wake classification | electrocardiography | respi-ratory effort | neural classifier
Introduction
Increased sleepiness over daytime has been identified as animportant cause of accidents in transportation and factoryplants (1). It is therefore a major health interest to con-tinuously monitor and report the sleepiness level of high riskpersons such as pilots, truck drivers or shift workers. Continu-ously updated information about the persons’ ”need for sleep”could help these persons to better schedule their breaks andsleep times. Currently, transport industries focus mainly onemergency situation prevention by means of vehicle centeredsystems that alert the user either by monitoring the vehicleperformances (e.g. lane deviation) or operators’ behavioral re-sponses (e.g. eye blinks). Other fatigue detection techniquesinclude fitness-for-duty tests and mathematical alertness mod-els (2; 3). Our approach consists in using mathematical mod-els in combination with physiological measurements to estab-lish a continuous sleepiness profile of the subject and givewarnings even before a certain task begins or an emergencysituation related to fatigue can occur.
Different mathematical models to estimate sleepiness havebeen suggested (4). These models are mainly based on theprevious sleep and wake durations (homeostatic process), anddaily alertness rhythms (circadian process). In this paperwe describe a method for the estimation of the homeostaticcomponent with a wearable device. In order to be wearable,the sleep/wake detection device should be energetically au-tonomous. Since the person is expected to wear it for severaldays, the device should also be light-weight and comfortable.This puts tight restrictions not only on the choice of signals forthe classification task, but also on the signal recording, pro-cessing, and on the computational requirements of the classi-
fier. In addition, such a device is intended for a large public.Therefore, it should be easy to use and should not depend oncomplicated calibration methods.
The gold standard for assessing sleep in humans is theanalysis of brain wave patterns (EEG) first described byRechtschaffen and Kales (5). The most common sleep analy-sis method is called polysomnography (PSG), which combinesEEG recordings with different physiological signals like elec-tromyography (EMG), electrooculography (EOG), respiratoryeffort, blood oxygen saturation, electrocardiograms (ECG)and video analysis. In PSG, 30-second epochs of the signalsare used for decision making. The method is normally car-ried out in a controlled hospital environment and needs medi-cal assistance for setting up sensors, monitoring and analysis.Although the analysis is typically computer-assisted (6), itstill requires a sleep expert and is therefore expensive andtime consuming. It is difficult to integrate PSG sensors intoa wearable device, as they are rather bulky, power-consumingand highly susceptible to noise. Furthermore, EEG recordingsrequire many electrodes to be glued to the scalp, which makesit very cumbersome and uncomfortable for the user.
In home environments, where PSG is typically not avail-able, physicians rely on actigraphy for sleep monitoring (7).In this method, the acceleration of the extremities (typicallywrist) are recorded over several days with a watch-like de-vice using miniature accelerometers and a storage medium.Periods of low activity are later classified as sleep by offlinecomputer processing. Many different classification algorithms
∗To whom correspondence may be addressed. E-mail: [email protected]
Karlen et al: Sleep and Wake Classification With ECG and Respiratory Effort Signals 1

1
4
2
3
Heally recording system mounted on a shirt. 1) ECG gel electrodes; 2)inductive belt sensor; 3) electronics modules; 4) NiMH battery. The EMGand EOG electrodes are not shown.
have been suggested for actigraphy (8; 9), but often they can-not cope with the problem of misclassifying low activity taskslike reading and watching television or the case where thesensor band is not worn (7; 9). Recently, alarm clocks usingaccelerometers have been commercialized (10; 11). The ac-tivity is used to detect the best sleep phase for easy wake-upin a given time window (10 to 30 minutes). However, the ac-celerometers are only active at night and the clocks do notcalculate sleep duration.
Changes in the activity of the Autonomic Nervous System(ANS) during sleep/wake transitions have been successfullyidentified as a reliable source of information (12). Changesin activity of the ANS are reflected in various physiologicalsignals such as heart rate, blood pressure, skin conductance,etc. The main focus of current research is on fluctuations ofheart rate variability (HRV) during sleep (13; 14; 15). How-ever, due to differences in the methods used to calculate HRV,the results are sometimes contradictory (16). Moreover, HRVmeasures are very susceptible to noise. A wearable applicationof this technique is therefore difficult.
Recently, Redmond and Heneghan (17) have added res-piratory signals to the HRV to show the feasibility of us-ing cardiorespiratory signals for discriminating sleep stagesin subjects with obstructive sleep apnea. The advantage ofcardiorespiratory signals is that they are relatively easy tomeasure and the sensors can be applied by non-experiencedusers.
For this reason, we decided to use cardiorespiratory signalstogether with an Artificial Neural Network (ANN) in our sleepdetection system. Cardiorespiratory signals recorded fromwearable sensors typically contain artifacts due to movementsof the subject wearing the sensors. Instead of filtering outthese artifacts with sophisticated signal reconstruction andartifact-rejection algorithms, our method treats the artifactsas relevant information in the signal. Within this perspec-tive, movement artifacts can give an indication of the activityof the user as actigraphy would do, but without the need ofusing an additional sensor. Contrary to all other studies, werely on day and night recordings obtained in a non-hospital
environment to obtain more realistic data. We have selectedANN classifiers because of their capabilities for nonlinear classseparation and the possibility to efficiently program them intoa microcontroller.
Method
The raw data used in the current study consist of ECG andrespiratory effort signals of different subjects recorded overday and night periods. Additionally, video, EMG and EOGwere recorded for labeling the users’ state as wake or sleep by atechnician. This information was used for training the neuralclassifier. The preprocessing consisted in calculating an esti-mation of the power spectral density (PSD) for the raw ECGand respiratory signals with the help of a Fast Fourier Trans-form (FFT). Three classifier architectures were designed, eachhaving as input either the PSD values of ECG, respiration ortheir combination (Fig. 2). For each architecture, an ANNwas first trained and tested using data from a single user. Toinvestigate its capability to generalize to multiple users, eacharchitecture was then trained and tested using data from mul-tiple users.
Data Recordings.We conducted home recordings with 6healthy male subjects, aged between 23 and 29 years. ECGand respiratory effort were recorded with a Heally system(Fig. 1, Koralewski Industrie Elektronik, Celle, Germany).The Heally system is a portable recording system that usesan inductive belt sensor for measuring ribcage respiratory ef-fort and gel electrodes for measuring ECG. We have chosenthe sampling frequencies f according to the requirements fordigitalized PSG (6). The respiratory signal is sampled atfResp = 50 Hz and the 1-lead ECG at fECG = 100 Hz. Ad-ditionally, the Heally system offers the possibility to measurethe EMG (recorded from the right shoulder muscle trapeziusat 200 Hz) and EOG (recorded at 200 Hz) as reference. EOGwas only measured during the night, in order not to disturbthe subjects too much during daily activities. During night-time a video of the upper part of the body was recorded. Wedid not consider the possibility of recording EEG signals, be-cause subjects wearing the monitoring device were expectedto move freely and perform undisturbed daily activities.
In order to obtain an equal amount of data for both sleepand wake, subjects wore the recording system for 16 hoursper session. This recording time corresponds to the double ofthe average sleep time for the studied age group (18). Therecording started approximatively 4 hours before the regularbed time of the subject. A total of 18 recording sessions werecarried out, 8 sessions for one subject (subject A) and 2 ses-sions for each of the other subjects (subject B, C, D, E andF). Each session contained a mean of 7.19 ± 1.65 hours ofsleep and 8.45 ± 3.19 hours of wake. A total of 130.47 hoursof sleep and 161.64 hours of wake were analyzed. In case ofsensor failure or detachment, the corresponding data segmentswere discarded. The subjects reported no major discomfortduring sleep because of the recording system. However, atthe end of the recording, itching at the electrode sites wasreported.
The videos were analyzed by a human expert to determineif the subject was asleep or not. We did not distinguish be-tween light, deep or REM sleep, because the binary discrim-ination between sleep and wake was sufficient for the presentstudy. The video was divided into segments of 10 seconds and
2 Karlen et al: Sleep and Wake Classification With ECG and Respiratory Effort Signals
Raw signals FFT Preprocessing
2468
10
ECG
Fre
qu
en
cy [H
z]
2
4
6
8
Re
spFr
eq
ue
ncy
[Hz]
−120 −100 −80 −60 −40 −20 0
ANN Classifier
1 2 3 4 5 6 7 8 9 10 11 12 13 14 15 16Experiment duration [hours]
0 2 4 6 8 10
−1.49
−1.47
[seconds]
Resp
[mV]
−0.4
0
0.4
ECG
[mV]
Σ
Respw
−4 0 4
−1
0
1
Output
thresholdwake: y(x)<0sleep: y(x)≥0
ECGw}}
log(S(ω))^
log(S(ω))^
wake sleep wake
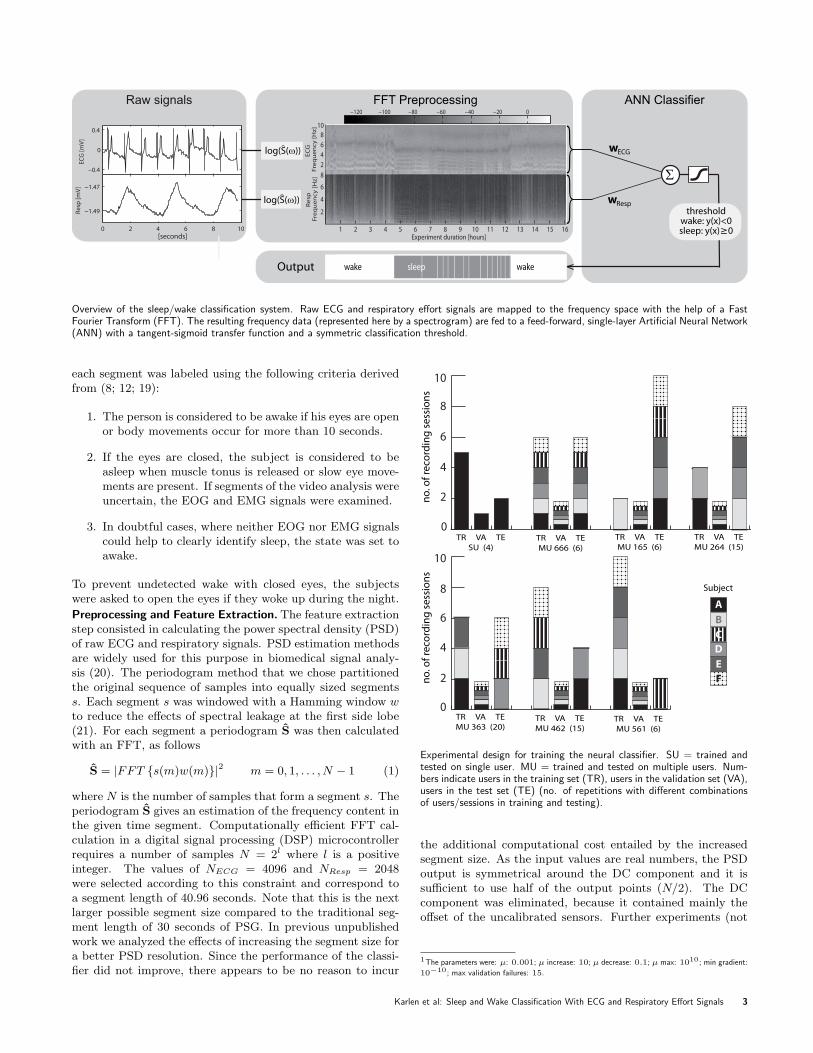
Overview of the sleep/wake classification system. Raw ECG and respiratory effort signals are mapped to the frequency space with the help of a FastFourier Transform (FFT). The resulting frequency data (represented here by a spectrogram) are fed to a feed-forward, single-layer Artificial Neural Network(ANN) with a tangent-sigmoid transfer function and a symmetric classification threshold.
each segment was labeled using the following criteria derivedfrom (8; 12; 19):
1. The person is considered to be awake if his eyes are openor body movements occur for more than 10 seconds.
2. If the eyes are closed, the subject is considered to beasleep when muscle tonus is released or slow eye move-ments are present. If segments of the video analysis wereuncertain, the EOG and EMG signals were examined.
3. In doubtful cases, where neither EOG nor EMG signalscould help to clearly identify sleep, the state was set toawake.
To prevent undetected wake with closed eyes, the subjectswere asked to open the eyes if they woke up during the night.
Preprocessing and Feature Extraction. The feature extractionstep consisted in calculating the power spectral density (PSD)of raw ECG and respiratory signals. PSD estimation methodsare widely used for this purpose in biomedical signal analy-sis (20). The periodogram method that we chose partitionedthe original sequence of samples into equally sized segmentss. Each segment s was windowed with a Hamming window wto reduce the effects of spectral leakage at the first side lobe(21). For each segment a periodogram S was then calculatedwith an FFT, as follows
S = |FFT {s(m)w(m)}|2 m = 0, 1, . . . , N − 1 (1)
where N is the number of samples that form a segment s. Theperiodogram S gives an estimation of the frequency content inthe given time segment. Computationally efficient FFT cal-culation in a digital signal processing (DSP) microcontrollerrequires a number of samples N = 2l where l is a positiveinteger. The values of NECG = 4096 and NResp = 2048were selected according to this constraint and correspond toa segment length of 40.96 seconds. Note that this is the nextlarger possible segment size compared to the traditional seg-ment length of 30 seconds of PSG. In previous unpublishedwork we analyzed the effects of increasing the segment size fora better PSD resolution. Since the performance of the classi-fier did not improve, there appears to be no reason to incur
0
2
4
6
8
10
no
. of
reco
rdin
g s
ess
ion
s
0
2
4
6
8
10
no
. of
reco
rdin
g s
ess
ion
s
TR VA TE
SU (4)TR VA TE
MU 666 (6)
TR VA TE
MU 165 (6)
Subject
ABCDEF
TR VA TE
MU 264 (15)
TR VA TE
MU 363 (20)TR VA TE
MU 462 (15)TR VA TE
MU 561 (6)
Experimental design for training the neural classifier. SU = trained andtested on single user. MU = trained and tested on multiple users. Num-bers indicate users in the training set (TR), users in the validation set (VA),users in the test set (TE) (no. of repetitions with different combinationsof users/sessions in training and testing).
the additional computational cost entailed by the increasedsegment size. As the input values are real numbers, the PSDoutput is symmetrical around the DC component and it issufficient to use half of the output points (N/2). The DCcomponent was eliminated, because it contained mainly theoffset of the uncalibrated sensors. Further experiments (not
1The parameters were: µ: 0.001; µ increase: 10; µ decrease: 0.1; µ max: 1010; min gradient:
10−10; max validation failures: 15.
Karlen et al: Sleep and Wake Classification With ECG and Respiratory Effort Signals 3
detailed in this paper) showed that the high frequency compo-nents of the ECG and respiratory spectrogram can be prunedwithout degrading the performance of the classifier. We foundexperimentally that the ECG spectrogram can be truncatedat 10 Hz and the respiratory spectrogram can be truncated at8 Hz. Correspondingly, we reduced the input size of the ANNfrom NECG/2 and NResp/2 to nECG = 409 and nResp = 327,respectively.
Neural Classifier. We used a feed-forward ANN with no hid-den layers and one single output unit with a tangent-sigmoidtransfer function (see Fig. 2, ANN classifier). We also exper-imented with an ANN with one hidden layer, but the perfor-mance was not better and the training time increased consid-erably. To train the ANN and update the synaptic weightswe used the Levenberg-Marquardt backpropagation algorithm(22)1. We studied three different architectures, which differedin the type of input signal. The input vector of the first ar-chitecture ECG+Resp was composed of the logarithm of theperiodograms SECG and SResp (Fig. 2). The other two ar-chitectures ECG and Resp used only the logarithm of theperiodogram of one of the two signals, ECG or respiratoryeffort, respectively.
Initialization of the weights was done with the Nguyen-Widrow method (23). The output of the neuron was thresh-olded so that y(x) ≥ 0 is mapped to sleep and y(x) < 0 ismapped to wake. To train the networks, the data were dividedinto three sets: training, validation and test. The training set(TR) contained the data used to update the synaptic weights.The performance of the network was evaluated on the valida-tion set (VA) after each iteration and the training was stoppedif the performance of VA did not increase for more than 15training iterations or the minimal gradient was reached. Thetest set (TE) was used to measure the performance of thenetwork after the training.
Experiments.
Single-User Experiments
With this set of experiments, we investigated the performanceof the method when trained and tested on the same person.We used subject A, for whom we had the highest number ofrecording sessions. The 8 available sessions were randomlydivided into TR containing 5 sessions, VA containing 1 ses-sion, and TE containing 2 sessions. 5 independent runs wereperformed from different initial weight values. In order to pre-vent performance biases due to the choice of sessions used fortraining and testing, we repeated the experiment 4 times withdifferent sessions in the training and testing set.
Multi-User Experiments
Most algorithms for sleep/wake detection are based on datafrom a multitude of users and are expected to generalize toother users (24; 25; 9). We investigated the performance ofour method when trained on a single person and tested onmultiple persons, and when trained on multiple persons andtested on multiple persons. Six experiments were carried out,each with an increasing number of persons in the training set(1 to 6) and all remaining persons in the testing set (in theonly case when all 6 persons were in the training set, we madesure that the two sets contained different recording sessions).
The validation set was composed of 2 hours of data from eachuser, randomly sampled over the available 2 sessions and con-taining an equal amount of sleep an wake labels. This datawas neither used for training nor for testing. Five indepen-dent runs of each experiment were performed from differentinitial weight values.
In order to prevent performance biases due to the choice ofsessions, we repeated each experiment with all possible com-binations of sessions in the testing and training set, makingsure that the same session did not appear both in the train-ing and in the testing set (the number of repetitions for eachexperiment is indicated between brackets in Fig. 2).
Results and Discussion
We determined the accuracy of our algorithm by calculatingthe percentage of true (correct) classifications of sleep andwake of TE according to Eq. 2)
accuracy =true sleep + true wake
all sleep + all wake(2)
To further quantify the performance of the system we com-puted two additional quantities: the number of segments clas-sified as sleep per session total sleep time, which is an impor-tant parameter in the sleepiness estimation model described inthe introduction, and the awakenings (total number of sleep-to-wake transitions during the period between the first andlast segment labeled as sleep in a session), which is an indica-tor of sleep quality of the subject.
The comparison of the total sleep time labeled accordingto the video data and estimated by the classifier does nottake into account whether the estimated sleep epochs are cor-rectly classified. we plotted a series of Receiver OperatingCharacteristic (ROC) curves (Fig. 5). ROC curves allow theassessment of the results of classifier data in which the classesare not equally distributed (which is the case for our data).For this reason it is often used in medical decision making andhas been introduced in sleep analysis comparisons by Tryon(26). An ROC curve shows the fraction of correctly classi-fied sleep points called sensitivity (Eq. 3) vs. the fraction ofwrongly classified wake points (1-specificity, Eq. 4), when theclassification threshold of the ANN output is varied from -1to 1.
sensitivity =true sleep
true sleep + false sleep(3)
specificity =true wake
true wake + false wake(4)
In such a representation the output of an ideal classifier islocated at (0,1), which corresponds to perfect classification ofall wake and sleep states.
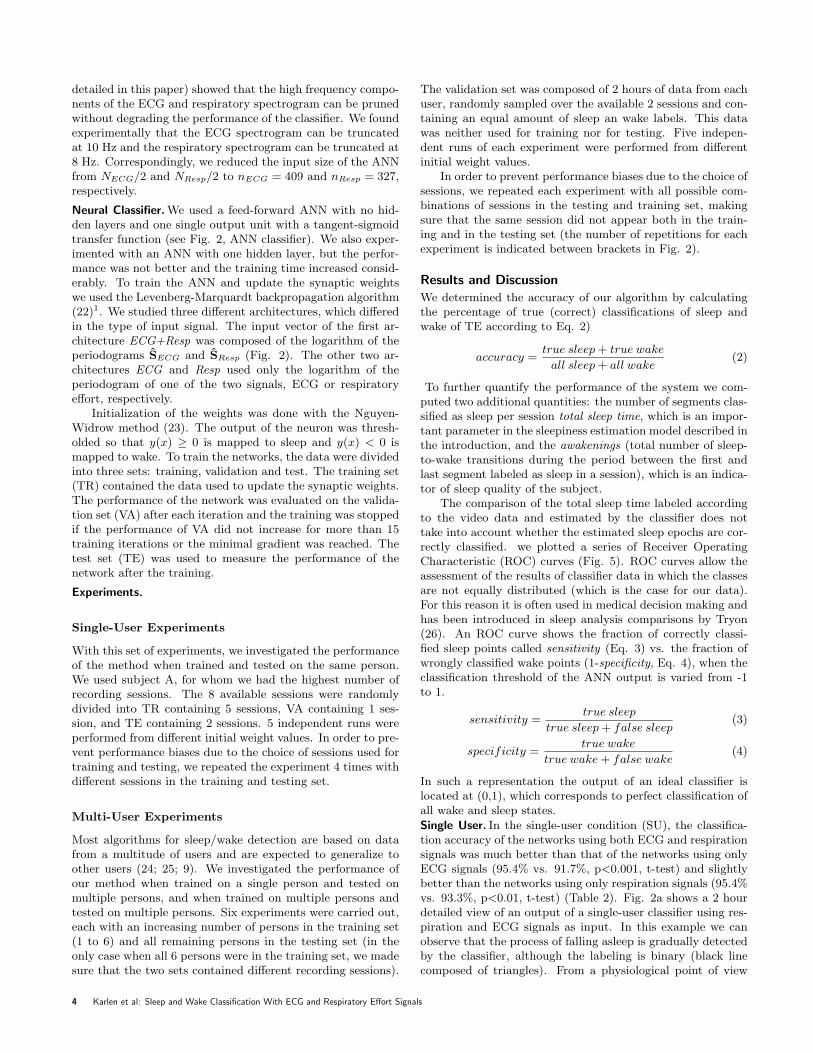
Single User. In the single-user condition (SU), the classifica-tion accuracy of the networks using both ECG and respirationsignals was much better than that of the networks using onlyECG signals (95.4% vs. 91.7%, p<0.001, t-test) and slightlybetter than the networks using only respiration signals (95.4%vs. 93.3%, p<0.01, t-test) (Table 2). Fig. 2a shows a 2 hourdetailed view of an output of a single-user classifier using res-piration and ECG signals as input. In this example we canobserve that the process of falling asleep is gradually detectedby the classifier, although the labeling is binary (black linecomposed of triangles). From a physiological point of view
4 Karlen et al: Sleep and Wake Classification With ECG and Respiratory Effort Signals

3.2 3.4 3.6 3.8 4 4.2 4.4 4.6 4.8 5
−1
Wake
0
Sleep
1
experiment duration [hours]
(a) SU ECG+Resp
11.2 11.4 11.6 11.8 12 12.2 12.4 12.6 12.8 13
−1
Wake
0
Sleep
1
experiment duration [hours]
(b) SU Resp
Unthresholded output of a single-user classifier on two different sessionswith a) ECG and respiratory effort and b) respiratory effort only. Thecrosses represent correctly classified segments when a classifier thresholdof 0 is applied, the circles represent the wrong classifications. The blacktriangles are the labeling values from the technician.
Single-user (SU) test classification accuracies and stan-dard deviations in percent
Experiment ECG Resp ECG + Resp
SU 91.67 ± 2.74 93.27 ± 1.48 95.42 ± 1.61
Comparison of SU sleep parameters
Mean differenceSleep parametersa Mean ± SD from Video ± SD
1. Total sleep time (hours)Video (label) 7.55 ± 1.7SU ECG 7.79 ± 2.11 -0.25 ± 1.22SU Resp 7.46 ± 1.54 0.09 ± 0.3SU ECG+Resp 7.77 ± 1.74 -0.22 ± 0.44
2. Awakenings (numbers)Video (label) 23.75 ± 8.81SU ECG 88.71 ± 86.96 -64.96 ± 85.24SU Resp 92.61 ± 39.67 -68.86 ± 36.52SU ECG+Resp 49.6 ± 24.37 -25.85 ± 20.61
a The sleep parameters are calculated on each session individ-ually and not over the entire test set that contains severalsessions.
this makes sense because sleep onset is a gradual, rather thana discrete process. A more detailed probabilistic classificationtaking into account the uncertainty of the classification wouldpresumably reveal that the uncertainty increases in this tran-sition phase, reducing the reliability of the classification. Thesame figure also shows that the first awakening of the subject
Tuned multi-user (MU) test classification accuracies andstandard deviations in percent
Experiments ECG Resp ECG + Resp
MU 165 67.30 ± 6.71 84.06 ± 3.47 77.75 ± 5.53MU 264 68.28 ± 5.06 86.64 ± 2.39 82.45 ± 3.68MU 363 69.93 ± 5.87 87.75 ± 2.44 84.32 ± 3.13MU 462 71.32 ± 8.30 88.68 ± 2.88 85.76 ± 3.37MU 561 75.18 ± 11.29 89.52 ± 3.79 86.68 ± 5.33MU 666 78.98 ± 1.78 90.24 ± 1.29 89.04 ± 2.25
after 48 minutes could not be correctly classified. This diffi-culty to detect short awakenings inside long sleep epochs hasalso been reported by various actigraphy studies (24; 25; 9).
In comparison, the only other study in the literature whereboth ECG and respiration signals from a single subject werecombined, reported an accuracy of 81% (17). However, a di-rect comparison of the two results is difficult, for the following
Multi-user (MU) test classification accuracies and stan-dard deviations in percent
Experiments ECG Resp ECG + Resp
MU 165 65.54 ± 7.76 83.09 ± 2.78 76.53 ± 5.39MU 264 66.74 ± 5.88 85.69 ± 2.05 81.65 ± 3.82MU 363 68.17 ± 5.98 86.64 ± 2.33 83.59 ± 3.21MU 462 68.63 ± 8.99 87.34 ± 2.91 84.96 ± 3.52MU 561 69.51 ± 14.96 87.31 ± 4.68 85.25 ± 5.25MU 666 78.72 ± 1.66 89.77 ± 1.37 88.34 ± 2.30
Multi-user (MU) mean training accuracies and standarddeviations in percent
Experiments ECG Resp ECG + Resp
MU 165 96.63 ± 1.81 95.81 ± 1.45 99.53 ± 0.34MU 264 92.62 ± 1.99 93.83 ± 1.25 97.62 ± 1.12MU 363 90.31 ± 2.04 93.06 ± 0.84 96.02 ± 0.89MU 462 88.46 ± 1.98 92.64 ± 0.60 95.05 ± 0.67MU 561 86.92 ± 1.63 92.34 ± 0.34 94.63 ± 0.56MU 666 88.35 ± 3.31 92.72 ± 1.07 95.84 ± 1.02
Comparison of MU 561 sleep parameters
Mean differenceSleep parametersa Mean ± SD from Video ± SD
1. Total sleep time (hours)Video (label) 4.27 ± 1.14MU 561 ECG 4.44 ± 3.07 -0.17 ± 2.6MU 561 Resp 3.88 ± 1.12 0.38 ± 0.9MU 561 ECG+Resp 4.17 ± 1.6 0.09 ± 0.9
2. Awakenings (numbers)Video (label) 31.38 ± 13.27MU 561 ECG 118.5 ± 68.7 -86.79 ± 67.52MU 561 Resp 106.08 ± 50.99 -74.7 ± 50.49MU 561 ECG+Resp 98.82 ± 52.59 -67.82 ± 49.84
a The sleep parameters are calculated on each session individ-ually and not over the entire test set that contains severalsessions.
Karlen et al: Sleep and Wake Classification With ECG and Respiratory Effort Signals 5

0 0.2 0.4 0.6 0.8 10
0.2
0.4
0.6
0.8
1
0 0.2 0.4 0.6 0.8 10
0.2
0.4
0.6
0.8
1
0 0.2 0.4 0.6 0.8 10
0.2
0.4
0.6
0.8
1
ECG RespM
U 5
61se
nsiti
vity
SUse
nsiti
vity
1-specificity 1-specificity 1-specificity
ECG+Resp
0 0.2 0.4 0.6 0.8 10
0.2
0.4
0.6
0.8
1
0 0.2 0.4 0.6 0.8 10
0.2
0.4
0.6
0.8
1
0 0.2 0.4 0.6 0.8 10
0.2
0.4
0.6
0.8
1
Sadeh Cole
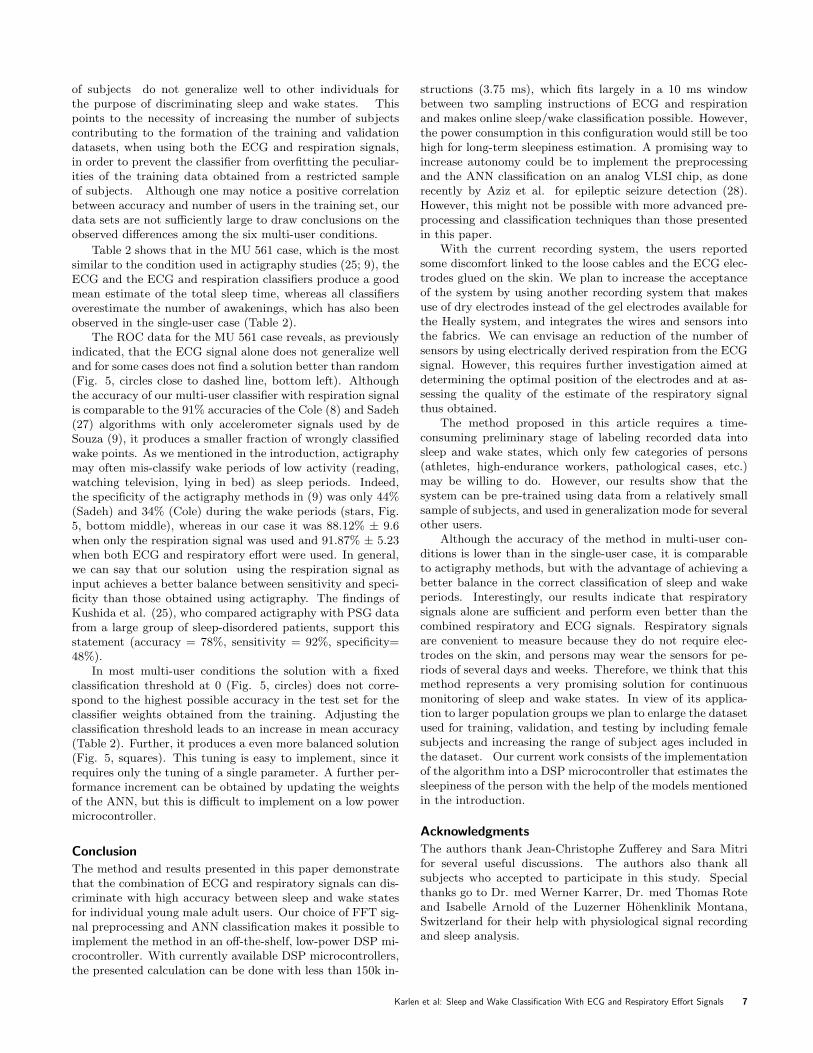
Receiver Operating Characteristics (ROC) curves of the three neural classifiers for the SU (top) and the MU 561 (bottom) configuration. Each curvecorresponds to a different run obtained by changing the training set configuration or the initial network weights. The circles are the ROC points of theactual classification of the test set with the same classification threshold as in the training. The squares are the ROC points with the highest accuracyusing the same weights as obtained in the training, but with a tuned classification threshold. Bottom left: The dashed line corresponds to the ROC lineof a random classifier. Bottom middle: The stars correspond to the ROC points obtained by the two actigraphy algorithms proposed by Cole (8) andSadeh (27) that were used in (9). Bottom right: The dotted line corresponds to ROC points with perfectly balanced sensitivity and specificity.
reasons:
a) the value reported in (17) was measured in the more diffi-cult task of classifying wake, sleep, and REM sleep;
b) it was obtained with data recorded in a controlled hospitalenvironment using PSG equipment;
c) it used only data from night recordings; and
d) it used a computationally expensive pre-processing algo-rithm calculating 27 features, which may be difficult toimplement in a low-power and wearable device.
Table 2.1 shows that on average the ECG and the ECGand respiration classifiers overestimate the total sleep time,whereas the classifier using only respiratory data slightly un-derestimates the total sleep time. Similar findings were re-ported in actigraphy studies (25; 9). A possible explanationof sleep overestimation when ECG signal is used as an inputis that the ECG signal might vary substantially between dif-ferent sleep stages. This might be the case for REM-sleep forexample, but further analysis with a more detailed labeling ofthe sleep data would be needed to confirm this statement.
Table 2.2 shows that the mean number of awakenings isoverestimated by all classifiers. This can be explained by arelatively noisy output of the classifier around the classifica-tion threshold, where consecutive epochs are classified alter-natively as sleep and wake and therefore counted as severalawakenings. An example of this phenomenon can be observed
in Fig. 2b. The occasional mis-labeling of the video datamight also contribute to this overestimation. Note that thecombination of ECG and respiration performs relatively bet-ter in terms of the estimate of the number of awakenings.
The circles in the top of the ROC graphs for the single-user experiments shown in the top of Fig. 5 correspond to theoutput of the test set with a classification threshold set to 0(the value used in the training). We observe equally balancedsensitivity and specificity in most cases, which means that theclassifier classifies sleep as accurately as wake.
Multiple Users. In all six multi-user conditions (MU), the ac-curacies in the test condition dropped compared to the single-user conditions. The accuracy drop was the largest for thenetworks using only ECG signals (Table 2, first column). Ta-ble 2 shows that, as expected, the training performance ofthe networks using both ECG and respiratory signals alwaysimproves with respect to the training performance of the net-works using only one of the two signals. However, the net-works using both ECG and respiration signals (Table 2, thirdcolumn) displayed lower accuracy in the test condition thanthe networks using only respiration signals (Table 2, secondcolumn). Also, the variability of the accuracy across multiplereplications was higher when respiration was used in combina-tion with ECG as compared to the condition when respirationalone was used. These results suggest that ECG signals haveunique features that are specific to each individual, so thatnetworks trained on the data obtained from a small number
6 Karlen et al: Sleep and Wake Classification With ECG and Respiratory Effort Signals
of subjects do not generalize well to other individuals forthe purpose of discriminating sleep and wake states. Thispoints to the necessity of increasing the number of subjectscontributing to the formation of the training and validationdatasets, when using both the ECG and respiration signals,in order to prevent the classifier from overfitting the peculiar-ities of the training data obtained from a restricted sampleof subjects. Although one may notice a positive correlationbetween accuracy and number of users in the training set, ourdata sets are not sufficiently large to draw conclusions on theobserved differences among the six multi-user conditions.
Table 2 shows that in the MU 561 case, which is the mostsimilar to the condition used in actigraphy studies (25; 9), theECG and the ECG and respiration classifiers produce a goodmean estimate of the total sleep time, whereas all classifiersoverestimate the number of awakenings, which has also beenobserved in the single-user case (Table 2).
The ROC data for the MU 561 case reveals, as previouslyindicated, that the ECG signal alone does not generalize welland for some cases does not find a solution better than random(Fig. 5, circles close to dashed line, bottom left). Althoughthe accuracy of our multi-user classifier with respiration signalis comparable to the 91% accuracies of the Cole (8) and Sadeh(27) algorithms with only accelerometer signals used by deSouza (9), it produces a smaller fraction of wrongly classifiedwake points. As we mentioned in the introduction, actigraphymay often mis-classify wake periods of low activity (reading,watching television, lying in bed) as sleep periods. Indeed,the specificity of the actigraphy methods in (9) was only 44%(Sadeh) and 34% (Cole) during the wake periods (stars, Fig.5, bottom middle), whereas in our case it was 88.12% ± 9.6when only the respiration signal was used and 91.87% ± 5.23when both ECG and respiratory effort were used. In general,we can say that our solution using the respiration signal asinput achieves a better balance between sensitivity and speci-ficity than those obtained using actigraphy. The findings ofKushida et al. (25), who compared actigraphy with PSG datafrom a large group of sleep-disordered patients, support thisstatement (accuracy = 78%, sensitivity = 92%, specificity=48%).
In most multi-user conditions the solution with a fixedclassification threshold at 0 (Fig. 5, circles) does not corre-spond to the highest possible accuracy in the test set for theclassifier weights obtained from the training. Adjusting theclassification threshold leads to an increase in mean accuracy(Table 2). Further, it produces a even more balanced solution(Fig. 5, squares). This tuning is easy to implement, since itrequires only the tuning of a single parameter. A further per-formance increment can be obtained by updating the weightsof the ANN, but this is difficult to implement on a low powermicrocontroller.
Conclusion
The method and results presented in this paper demonstratethat the combination of ECG and respiratory signals can dis-criminate with high accuracy between sleep and wake statesfor individual young male adult users. Our choice of FFT sig-nal preprocessing and ANN classification makes it possible toimplement the method in an off-the-shelf, low-power DSP mi-crocontroller. With currently available DSP microcontrollers,the presented calculation can be done with less than 150k in-
structions (3.75 ms), which fits largely in a 10 ms windowbetween two sampling instructions of ECG and respirationand makes online sleep/wake classification possible. However,the power consumption in this configuration would still be toohigh for long-term sleepiness estimation. A promising way toincrease autonomy could be to implement the preprocessingand the ANN classification on an analog VLSI chip, as donerecently by Aziz et al. for epileptic seizure detection (28).However, this might not be possible with more advanced pre-processing and classification techniques than those presentedin this paper.
With the current recording system, the users reportedsome discomfort linked to the loose cables and the ECG elec-trodes glued on the skin. We plan to increase the acceptanceof the system by using another recording system that makesuse of dry electrodes instead of the gel electrodes available forthe Heally system, and integrates the wires and sensors intothe fabrics. We can envisage an reduction of the number ofsensors by using electrically derived respiration from the ECGsignal. However, this requires further investigation aimed atdetermining the optimal position of the electrodes and at as-sessing the quality of the estimate of the respiratory signalthus obtained.
The method proposed in this article requires a time-consuming preliminary stage of labeling recorded data intosleep and wake states, which only few categories of persons(athletes, high-endurance workers, pathological cases, etc.)may be willing to do. However, our results show that thesystem can be pre-trained using data from a relatively smallsample of subjects, and used in generalization mode for severalother users.
Although the accuracy of the method in multi-user con-ditions is lower than in the single-user case, it is comparableto actigraphy methods, but with the advantage of achieving abetter balance in the correct classification of sleep and wakeperiods. Interestingly, our results indicate that respiratorysignals alone are sufficient and perform even better than thecombined respiratory and ECG signals. Respiratory signalsare convenient to measure because they do not require elec-trodes on the skin, and persons may wear the sensors for pe-riods of several days and weeks. Therefore, we think that thismethod represents a very promising solution for continuousmonitoring of sleep and wake states. In view of its applica-tion to larger population groups we plan to enlarge the datasetused for training, validation, and testing by including femalesubjects and increasing the range of subject ages included inthe dataset. Our current work consists of the implementationof the algorithm into a DSP microcontroller that estimates thesleepiness of the person with the help of the models mentionedin the introduction.
Acknowledgments
The authors thank Jean-Christophe Zufferey and Sara Mitrifor several useful discussions. The authors also thank allsubjects who accepted to participate in this study. Specialthanks go to Dr. med Werner Karrer, Dr. med Thomas Roteand Isabelle Arnold of the Luzerner Hohenklinik Montana,Switzerland for their help with physiological signal recordingand sleep analysis.
Karlen et al: Sleep and Wake Classification With ECG and Respiratory Effort Signals 7

References
1. T. Akerstedt, “Consensus statement: fatigue and accidents intransport operations.” Journal of Sleep Research, vol. 9, no. 4, p.395, 2000.
2. D. Dinges, M. Mallis, G. Maislin, and J. Powell, “Evaluation oftechniques for ocular measurement as an index of fatigue and thebasis for alertness management,” Tech. Rep., 1998.
3. T. Horberry, L. Hartley, G. Krueger, and N. Mabbott, “Fatiguedetection technologies for drivers: a review of existing operator-centred systems,” Human Interfaces in Control Rooms, Cockpitsand Command Centres, 2001. People in Control. The Second In-ternational Conference on (IEE Conf. Publ. No. 481), pp. 321–326, 2001.
4. P. Achermann and A. A. Borbely, “Mathematical models of sleepregulation,” Frontiers in Bioscience, vol. 8, pp. 683–93, 2003.
5. A. Rechtschaffen, A. Kales, R. Berger, and W. Dement, “A man-ual of standardized terminology, techniques and scoring systemfor sleep stages of human subjects,” Public Health Service, USGovernment Printing Office, 1968.
6. T. Penzel and R. Conradt, “Computer based sleep recordingand analysis,” Sleep Medicine Reviews, vol. 4, no. 2, pp. 131–148,2000.
7. A. Sadeh and C. Acebo, “The role of actigraphy in sleepmedicine.” Sleep Medicine Reviews, vol. 6, no. 2, pp. 113–124,2002.
8. R. J. Cole, D. F. Kripke, W. Gruen, D. J. Mullaney, and J. C.Gillin, “Automatic sleep/wake identification from wrist activity,”Sleep, vol. 15, no. 5, pp. 461–9, 1992.
9. L. de Souza, A. A. Benedito-Silva, M. L. Pires, D. Poyares, S. Tu-fik, and H. M. Calil, “Further validation of actigraphy for sleepstudies,” Sleep, vol. 26, no. 1, pp. 81–5, 2003.
10. (2007) Sleeptracker. [Online]. Available: http://www.sleeptracker.com
11. (2007) Axbo shop. [Online]. Available: http://www.axbo.com
12. R. D. Ogilvie, “The process of falling asleep,” Sleep MedicineReviews, vol. 5, no. 3, pp. 247–270, 2001.
13. M. H. Bonnet and D. L. Arand, “Heart rate variability: sleepstage, time of night, and arousal influences,” Electroencephalog-raphy and Clinical Neurophysiology, vol. 102, no. 5, pp. 390–396,1997.
14. S. Telser, M. Staudacher, Y. Ploner, A. Amann, H. Hinterhu-ber, and M. Ritsch-Marte, “Can one detect sleep stage transitionsfor on-line sleep scoring by monitoring the heart rate variability?”Somnologie, vol. 8, no. 2, pp. 33–41, 2004.
15. Z. Shinar, S. Akselrod, Y. Dagan, and A. Baharav, “Auto-nomic changes during wake-sleep transition: A heart rate vari-ability based approach.” Autonomic Neuroscience, vol. 130, no.1-2, pp. 17–23, 2006.
16. T. F. of the European Society of Cardiology and the NorthAmerican Society of Pacing Electrophysiology, “Heart rate vari-ability : Standards of measurement, physiological interpretation,and clinical use,” Circulation, vol. 93, no. 5, pp. 1043–1065, 1996.
17. S. Redmond and C. Heneghan, “Cardiorespiratory-based sleepstaging in subjects with obstructive sleep apnea,” IEEE Trans-actions on Biomedical Engineering, vol. 53, no. 3, pp. 485–496,2006.
18. A. Steptoe, V. Peacey, and J. Wardle, “Sleep duration andhealth in young adults,” Archives of Internal Medicine, vol. 166,no. 16, pp. 1689–1692, 2006.
19. S. J. Closs, “Assessment of sleep in hospital patients: a reviewof methods.” Journal of Advanced Nursing, vol. 13, no. 4, pp.501–510, 1988.
20. A. Cohen, Biomedical Engineering Handbook, 3rd ed., ser. Theelectrical engineering handbook series. Boca Raton : CRC Tay-lor & Francis, 2006, vol. 2, ch. Biomedical Signal Analysis, pp.I1–I22.
21. F. Harris, “On the use of windows for harmonic analysis withthe discrete fourier transform,” Proceedings of the IEEE, vol. 66,no. 1, pp. 51–83, Jan 1978.
22. M. Hagan and M. Menhaj, “Training feedforward networkswith the marquardt algorithm,” IEEE Transactions on NeuralNetworks, vol. 5, no. 6, pp. 989–993, 1994.
23. D. Nguyen and B. Widrow, “Improving the learning speed of2-layer neural networks by choosing initial values of the adaptiveweights,” in Proceedings of the International Joint Conference onNeural Networks IJCNN, vol. 3, 1990, pp. 21–26.
24. C. P. Pollak, W. W. Tryon, H. Nagaraja, and R. Dzwonczyk,“How accurately does wrist actigraphy identify the states of sleepand wakefulness?” Sleep, vol. 24, no. 8, pp. 957–965, Dec 2001.
25. C. A. Kushida, A. Chang, C. Gadkary, C. Guilleminault,O. Carrillo, and W. C. Dement, “Comparison of actigraphic,polysomnographic, and subjective assessment of sleep parame-ters in sleep-disordered patients.” Sleep Medicine, vol. 2, no. 5,pp. 389–396, Sep 2001.
26. W. W. Tryon, Activity Measurement in Psychology andMedicine, ser. Applied Clinical Psychology. Plenum Press, NewYork, 1991, ch. 6. Activity and sleep, pp. 149–195.
27. A. Sadeh, K. M. Sharkey, and M. A. Carskadon, “Activity-based sleep-wake identification: an empirical test of methodolog-ical issues.” Sleep, vol. 17, no. 3, pp. 201–207, Apr 1994.
28. J. N. Y. Aziz, R. Karakiewicz, R. Genov, A. W. L. Chiu, B. L.Bardakjian, M. Derchansky, and P. L. Carlen, “On-silicon neuralactivity monitoring and time-frequency analysis for early detec-tion of epileptic seizures,” IEEE Transactions on Neural Systemsand Rehabilitation Engineering, to be published.
8 Karlen et al: Sleep and Wake Classification With ECG and Respiratory Effort Signals