skypeople fruit juice, inc. - ftft.top fileskpl10q_sep302011.htm 9/4/18, 1:19 pm page 3 of 53 table...
TRANSCRIPT

9/4/18, 1:19 PMskpl10q_sep302011.htm
Page 1 of 53https://www.sec.gov/Archives/edgar/data/1066923/000141588911001281/skpl10q_sep302011.htm
10-Q 1 skpl10q_sep302011.htm 10-QUNITED STATES
SECURITIES AND EXCHANGE COMMISSIONWASHINGTON, D.C. 20549
FORM 10-Q
x QUARTERLY REPORT PURSUANT TO SECTION 13 OR 15(d) OF THESECURITIES EXCHANGE ACT OF 1934
For the quarterly period ended September 30, 2011
OR
o TRANSITION REPORT PURSUANT TO SECTION 13 OR 15(d) OF THESECURITIES EXCHANGE ACT OF 1934
For the transition period from ________________ to ________________
Commission file number: 000-32249
SKYPEOPLE FRUIT JUICE, INC.(Exact name of registrant as specified in its charter)
Florida 98-0222013
(State or other jurisdiction ofincorporation or organization)
(I.R.S. EmployerIdentification No.)
16F, National Development Bank Tower,
No. 2, Gaoxin 1st. Road, Xi’an, PRC(Address of principal executive offices)
710075(Zip Code)
86-29-88377161
(Registrant’s telephone number, including area code)
N/A(Former name, former address and former fiscal year, if changed since last report)
Indicate by check mark whether the registrant (1) has filed all reports required to be filed by Section 13 or 15(d) of the SecuritiesExchange Act of 1934 during the preceding 12 months (or for such shorter period that the registrant was required to file such reports), and(2) has been subject to such filing requirements for the past 90 days. Yes x No o Indicate by check mark whether the registrant has submitted electronically and posted on its corporate Web site, if any, every InteractiveData File required to be submitted and posted pursuant to Rule 405 of Regulation S-T during the preceding 12 months (or for such shorterperiod that the registrant was required to submit and post such files). Yes x No o Indicate by check mark whether the registrant is a large accelerated filer, an accelerated filer, a non-accelerated filer or a smaller reportingcompany. See the definitions of “large accelerated filer,” “accelerated filer” and “smaller reporting company” in Rule 12b-2 of theExchange Act. Large accelerated filer o Accelerated filer o

9/4/18, 1:19 PMskpl10q_sep302011.htm
Page 2 of 53https://www.sec.gov/Archives/edgar/data/1066923/000141588911001281/skpl10q_sep302011.htm
Non-accelerated filer o Smaller reporting company x
Indicate by check mark whether the registrant is a shell company (as defined in Rule 12b-2 of the Exchange Act).Yes o No xIndicate the number of shares outstanding of each of the issuer's classes of common stock, as of the latest practicable date.
Class Outstanding at November 10, 2011Common Stock, $0.001 par value per share 25,690,402 sharesPreferred Stock, $0.001 par value per share 1,456,647 shares

9/4/18, 1:19 PMskpl10q_sep302011.htm
Page 3 of 53https://www.sec.gov/Archives/edgar/data/1066923/000141588911001281/skpl10q_sep302011.htm
Table of Contents
SKYPEOPLE FRUIT JUICE, INC.
INDEX Page Part I. Financial Information Item 1. Financial Statements (a) Condensed Consolidated Balance Sheets as of September 30, 2011 (Unaudited) and December 31, 2010 1 (b) Condensed Consolidated Statements of Income and Comprehensive Income for the Three and Nine
Months Ended September 30, 2011 and 2010 (Unaudited)2
(c) Condensed Consolidated Statements of Cash Flows for the Nine Months Ended September 30, 2011 and2010 (Unaudited)
3
(d) Notes to Condensed Consolidated Financial Statements (Unaudited) 4Item 2. Management’s Discussion and Analysis of Financial Condition and Results of Operations 22Item 3. Quantitative and Qualitative Disclosures about Market Risk 35Item 4. Controls and Procedures 36 Part II Other Information Item 1. Legal Proceedings 37Item 1A. Risk Factors 37Item 2. Unregistered Sales of Equity Securities and Use of Proceeds 38Item 3. Defaults Upon Senior Securities 38Item 4. Removed and Reserved 38Item 5. Other Information 38Item 6. Exhibits 38 Signatures 39Exhibits Certifications
-i-

9/4/18, 1:19 PMskpl10q_sep302011.htm
Page 4 of 53https://www.sec.gov/Archives/edgar/data/1066923/000141588911001281/skpl10q_sep302011.htm
Table of Contents
PART I. FINANCIAL INFORMATIONITEM 1. FINANCIAL STATEMENTS SKYPEOPLE FRUIT JUICE, INC.CONDENSED CONSOLIDATED BALANCE SHEETS AS OF SEPTEMBER 30, 2011 (UNAUDITED) AND DECEMBER 31,2010
September 30,
2011 December 31,
2010 ASSETS (Unaudited) CURRENT ASSETS
Cash and equivalents $ 76,425,179 $ 49,350,385 Restricted cash 1,207,328 505,581 Accounts receivable, net allowance of $45930 and $44,405 as of September 30, 2011 andDecember 31, 2010, respectively 21,492,651 46,029,962 Other receivables 1,296,059 1,272,648 Inventories 8,082,189 5,436,117 Prepaid expenses and other current assets 431,753 31,604
Total current assets 108,935,159 102,626,297 PROPERTY, PLANT AND EQUIPMENT, Net 35,670,262 36,337,251 LAND USAGE RIGHT, Net 6,632,390 6,541,825 OTHER ASSETS 7,227,011 1,694,486 TOTAL ASSETS $ 158,464,822 147,199,859 LIABILITIES AND STOCKHOLDERS' EQUITY CURRENT LIABILITIES
Accounts payable $ 3,163,526 $ 3,446,797 Accrued expenses 3,518,630 4,871,934
Income tax payable 675,831 4,377,039 Advances from customers 54,654 573,609 Short-term bank loans 13,159,956 10,238,856 Short-term notes payable 1,185,023 505,581
Total current liabilities 21,757,620 24,013,816 Commitments and contingencies (Note 10) STOCKHOLDERS' EQUITY Preferred Stock, $0.001 par value; 10,000,000 shares authorized; 1,456,647 Series B PreferredStock issued and outstanding as of September 30, 2011 and December 31, 2010, respectively 1,457 1,457 Common Stock, $0.001 par value; 66,666,666 shares authorized; 25,690,402 shares issued andoutstanding as of September 30, 2011 and December 31, 2010, respectively 25,690 25,690 Additional Paid-in capital 59,189,374 59,189,374 Retained earnings 60,011,823 51,418,283 Accumulated other comprehensive income 11,951,211 7,823,967 Total SkyPeople Fruit Juice, Inc. stockholders' equity 131,179,555 118,458,771 Non-controlling interests 5,527,647 4,727,272 TOTAL EQUITY 136,707,202 123,186,043

9/4/18, 1:19 PMskpl10q_sep302011.htm
Page 5 of 53https://www.sec.gov/Archives/edgar/data/1066923/000141588911001281/skpl10q_sep302011.htm
TOTAL LIABILITIES AND STOCKHOLDERS' EQUITY $ 158,464,822 $ 147,199,859
See accompanying notes to condensed consolidated financial statements.
-1-

9/4/18, 1:19 PMskpl10q_sep302011.htm
Page 6 of 53https://www.sec.gov/Archives/edgar/data/1066923/000141588911001281/skpl10q_sep302011.htm
Table of Contents SKYPEOPLE FRUIT JUICE, INC.CONDENSED CONSOLIDATED STATEMENTS OF INCOME AND COMPREHENSIVE INCOME FOR THE THREE ANDNINE MONTHS ENDED SEPTEMBER 30, 2011 AND 2010 (UNAUDITED) Three Months Ended Nine Months Ended September 30 September 30 September 30 September 30 2011 2010 2011 2010 Revenue $ 17,437,105 $ 18,188,781 $ 49,062,726 $ 49,306,860 Cost of sales 12,595,983 11,604,046 31,448,900 29,201,392 Gross Margin 4,841,122 6,584,735 17,613,826 20,105,468 Operating Expenses
General and administrative expenses 1,217,206 622,883 3,042,100 2,237,222 Selling expenses 638,211 237,599 1,741,814 816,477 Research and development expenses 145,413 271,453 420,121 816,786
Total operating expenses 2,000,830 1,131,935 5,204,035 3,870,485 Income from Operations 2,840,292 5,452,800 12,409,791 16,234,983 Other Income (Expenses)
Interest expense (308,447) (214,348) (648,635) (654,264)Interest income 81,720 20,355 223,806 67,108 Subsidy income 50,632 132,984 622,396 2,381,389 Other income (expenses) (118) (46,725) 39,454 (45,291)Change in fair value of warrant liabilities - - - (2,103,832) Total other expenses (176,213) (107,734) 237,021 (354,890)
Income Before Income Tax Expenses 2,664,079 5,345,066 12,646,812 15,880,093 Income Tax Expenses 726,239 1,395,109 3,419,625 4,823,980 Net Income $ 1,937,840 $ 3,949,957 $ 9,227,187 $ 11,056,113 Less: Net income attributable to noncontrolling interests 124,420 378,311 633,642 1,056,038 Net Income Attributable to Common Shares $ 1,813,420 $ 3,571,646 $ 8,593,545 $ 10,000,075 Earnings Per Share: Basic earnings per share $ 0.07 $ 0.15 $ 0.32 $ 0.46 Diluted earnings per share $ 0.07** $ 0.15* $ 0.32** $ 0.46* Weighted Average Shares Outstanding Basic 25,690,402 22,437,576 25,690,402 20,336,417 Diluted 26,661,501 23,510,552 26,661,501 21,895,610 Comprehensive Income Net income $ 1,937,840 $ 3,949,957 $ 9,227,187 $ 11,056,113 Foreign currency translation adjustment 1,342,180 1,334,576 4,293,977 1,833,711

9/4/18, 1:19 PMskpl10q_sep302011.htm
Page 7 of 53https://www.sec.gov/Archives/edgar/data/1066923/000141588911001281/skpl10q_sep302011.htm
Comprehensive Income $ 3,280,020 $ 5,284,533 $ 13,521,164 $ 12,889,824 Comprehensive income attributable to the noncontrollinginterest (182,649) (511,193) (800,375) (1,158,522)Comprehensive income attributable to SkyPeople FruitJuice, Inc. $ 3,097,371 $ 4,773,340 $ 12,720,789 $ 11,731,302 * The effect of 1,228,334 shares of warrants and the related change in fair value of warrant liability were not included for the computationof diluted earnings per share for the period ended as the inclusion would be anti-dilutive. ** The effect of 175,000 shares of warrants were not included for the computation of diluted earnings per share for the period ended asthe inclusion would be anti-dilutive.
See accompanying notes to condensed consolidated financial statements.
-2-

9/4/18, 1:19 PMskpl10q_sep302011.htm
Page 8 of 53https://www.sec.gov/Archives/edgar/data/1066923/000141588911001281/skpl10q_sep302011.htm
Table of Contents SKYPEOPLE FRUIT JUICE, INC.CONDENSED CONSOLIDATED STATEMENTS OF CASH FLOWS FOR THE NINE MONTHS ENDED SEPTEMBER 30,2011 AND 2010 (UNAUDITED) September 30, September 30, 2011 2010 Cash Flow from Operating Activities
Net income $ 9,227,187 $ 11,056,113 Adjustments to reconcile net income to net cash flow provided by (used in) operatingactivities Depreciation and amortization 2,674,081 1,665,932 Change in fair value of warrant liabilities - 2,103,832
Changes in operating assets and liabilities Accounts receivables 25,987,583 (1,282,841) Other receivables 19,660 (2,171,733) Prepaid expenses and other current assets (399,945) 1,463,095 Inventories (2,442,658) (1,814,795) Accounts payables (398,972) 470,799 Accrued expenses (1,491,478) (1,788,675) Advances from customers (535,017) (736,649) Income taxes payable (3,825,519) (683,110)
Net cash provided by operating activities 28,814,922 8,281,968 Cash Flow from Investing Activities
Prepayment for other assets (5,894,322) (7,873,540)Additions to property, plant and equipment (138,927) (1,087,965)Additions to construction progress (46,437) -
Net cash used in investing activities (6,079,686) (8,961,505) Cash Flow from Financing Activities
Restricted cash (679,744) - Proceeds from stock issuance - 27,014,217 Proceeds from short-term bank loans 7,733,603 6,895,231 Repayment of short-term loan bank loans (5,181,670) (2,902,480)Short-term notes payable 657,590 739,130
Net cash provided by financing activities 2,529,779 31,746,098 NET INCREASE IN CASH AND CASH EQUIVALENTS 25,265,015 31,066,561 CASH AND CASH EQUIVALENTS, BEGINNING OF PERIOD 49,350,385 14,404,500
Effect of Changes in Exchange Rate 1,809,779 621,740 CASH AND CASH EQUIVALENTS, END OF PERIOD $ 76,425,179 $ 46,092,801 Supplementary Information Of Cash Flows
Cash paid for interest $ 648,635 $ 638,181 Cash paid for tax $ 7,245,144 $ 5,505,089 Change in fair value of warrant liability - (2,103,832)Exercise of warrants - 5,481,749 Transfer from other assets to property, plant and equipment and construction in progress 457,070 2,096,507

9/4/18, 1:19 PMskpl10q_sep302011.htm
Page 9 of 53https://www.sec.gov/Archives/edgar/data/1066923/000141588911001281/skpl10q_sep302011.htm
See accompanying notes to condensed consolidated financial statements.
-3-

9/4/18, 1:19 PMskpl10q_sep302011.htm
Page 10 of 53https://www.sec.gov/Archives/edgar/data/1066923/000141588911001281/skpl10q_sep302011.htm
Table of Contents
SKYPEOPLE FRUIT JUICE, INC.NOTES TO CONDENSED CONSOLIDATED FINANCIAL STATEMENTS (UNAUDITED) 1. BASIS OF PRESENTATION
The accompanying unaudited interim condensed consolidated financial statements have been prepared in accordance with theinstructions to Form 10-Q and Article 10 of Regulation S-X. Accordingly, they do not include all of the information andfootnotes normally required by accounting principles generally accepted in the United States of America for financialstatements. The accompanying condensed consolidated financial statements do reflect all the adjustments that, in the opinion ofmanagement, are necessary to present fairly the financial position, results of operations and cash flows for the interim periodsreported. Such adjustments are of a normal and recurring nature. Our operating results for the three and nine months endedSeptember 30, 2011 are not necessarily indicative of the results that may be expected for the year ending December 31, 2011.
These condensed consolidated financial statements should be read in conjunction with the audited consolidated financialstatements and notes to consolidated financial statements included in our Annual Report on Form 10-K for the year endedDecember 31, 2010. There have been no material changes in the significant accounting policies followed by us during the threeand nine months ended September 30, 2011.
2. SUMMARY OF SIGNIFICANT ACCOUNTING POLICIES
The principal activities of the Company consist of production and sales of fruit concentrate, fruit juice beverages, and other fruitrelated products in the PRC and overseas markets. All activities of the Company are principally conducted by subsidiariesoperating in the PRC
Basis of Preparation
These condensed consolidated financial statements have been prepared in accordance with generally accepted accountingprinciples in the United States (“U.S. GAAP”).
Principles of Consolidation The accompanying condensed consolidated financial statements include the accounts of subsidiaries of the Company. The majorsubsidiaries of the Company include (i) SkyPeople Fruit Juice, Inc. (“SkyPeople”), (ii) Pacific Industry Holding Group Co., Ltd.(“Pacific”), a company incorporated under the laws of the Republic of Vanuatu and a wholly owned subsidiary of SkyPeople,(iii) Harmony MN Inc. (“HMN”), a company organized under the laws of Delaware and a wholly owned subsidiary ofSkyPeople, (iv) SkyPeople Juice Group Co., Ltd., formerly known as Shaanxi Tianren Organic Food Co., Ltd. as of December18, 2009 (“SkyPeople (China)”), a company incorporated under the laws of the People’s Republic of China (the “PRC”) and a99.78% owned subsidiary of Pacific, (v) Shaanxi Qiyiwangguo Modern Organic Agriculture Co., Ltd. (“ShaanxiQiyiwangguo”), a company incorporated under the laws of the PRC and 91.15% owned subsidiary of SkyPeople (China), (vi)Huludao Wonder Fruit Co., Ltd. (“Huludao Wonder”), a company incorporated under the laws of the PRC and a wholly ownedsubsidiary of SkyPeople (China), (vii) Yingkou Trusty Fruit Co., Ltd. (“Yingkou”), a company incorporated under the laws ofthe PRC and a wholly owned subsidiary of SkyPeople (China), and (viii) China Kiwi King Ltd., a company incorporated underthe laws of Hong Kong and a wholly owned subsidiary of Pacific. All material inter-company accounts and transactions havebeen eliminated in consolidation. Pacific and SkyPeople (China) were entities under common control and accordingly carryover basis was used for SkyPeople(China). Reverse acquisition accounting was applied to the consolidation of SkyPeople with Pacific. Purchase accounting wasapplied to the consolidation of China Kiwi King Ltd. with Pacific and HMN with SkyPeople.
-4-

9/4/18, 1:19 PMskpl10q_sep302011.htm
Page 11 of 53https://www.sec.gov/Archives/edgar/data/1066923/000141588911001281/skpl10q_sep302011.htm
Table of ContentsNOTES TO CONDENSED CONSOLIDATED FINANCIAL STATEMENTS (UNAUDITED), CONTINUED
SkyPeople (China) holds a 91.15% interest in Shaanxi Qiyiwangguo since June 2006, after it acquired 21.05% of the shares heldby Shaanxi Xirui Co. Ltd. In July 2009, the Company canceled the registration of Shaanxi Qiyiwanguo with Xi’an StateAdministration for Industry and Commerce and registered with Zhouzhi County State Administration for Industry andCommerce. As of September 30, 2011, the record of Zhouzhi County State Administration for Industry and Commerce had notyet been updated to reflect the increase in the Company’s interest percentage of Shaanxi Qiyiwangguo in June 2006. In June2011, the Company submitted the stock transfer agreement between SkyPeople (China) and Shaanxi Xirui Co. Ltd. dated June26, 2006, which proves SkyPeople (China)’s ownership interest of 91.15% in Shaanxi Qiyiwangguo, to the Zhouzhi CountyState Administration for Industry and Commerce and requested to update its record of information.
Use of Estimates
The Company’s condensed consolidated financial statements have been prepared in accordance with accounting principlesgenerally accepted in the United States of America and this requires management to make estimates and assumptions that affectthe reported amounts of assets and liabilities and disclosure of contingent assets and liabilities at the date of the condensedconsolidated financial statements and reported amounts of revenue and expenses during the reporting period. The significantareas requiring the use of management estimates include, but are not limited to, the allowance for doubtful accounts receivable,estimated useful life and residual value of property, plant and equipment, provision for staff benefits, valuation for the fair valueof warrant liability, recognition and measurement of deferred income taxes, valuation allowance for deferred tax assets, netrealizable value of inventories and loss contingency. Although these estimates are based on management’s knowledge of currentevents and actions management may undertake in the future, actual results may ultimately differ from those estimates. Cash and Cash Equivalents
Cash and cash equivalents included cash on hand and demand deposits placed with banks which are unrestricted as towithdrawal and use and with an original maturity of three months or less.
Restricted Cash
Restricted cash consists of cash equivalents used as collateral to obtain a short-term notes payable and to settle a short-term loaninterest payable.
Impairment of Long-Lived Assets
In accordance with the Financial Accounting Standards Board (“FASB”) Accounting Standards Codification (“ASC”) 360-10,Accounting for the Impairment or Disposal of Long-Lived Assets, long-lived assets, such as property, plant and equipment andpurchased intangibles subject to amortization are reviewed for impairment whenever events or changes in circumstances indicatethat the carrying value of an asset may not be recoverable, or it is reasonably possible that these assets could become impaired asa result of technological or other industrial changes. The determination of recoverability of assets to be held and used is made bycomparing the carrying amount of an asset to future undiscounted cash flows to be generated by the assets. If such assets areconsidered to be impaired, the impairment to be recognized is measured as the amount by which the carrying amount of theassets exceeds the fair value of the assets. Assets to be disposed of are reported at the lower of the carrying amount or fair valueless cost to sell. During the reporting periods there was no impairment loss of long-lived assets recognized.
Fair Value of Financial Instruments FASB Accounting Standards Codification Topic on Fair Value Measurements andDisclosures (“ASC 820”) requires that the Company disclose estimated fair values of financial instruments.
-5-

9/4/18, 1:19 PMskpl10q_sep302011.htm
Page 12 of 53https://www.sec.gov/Archives/edgar/data/1066923/000141588911001281/skpl10q_sep302011.htm
Table of ContentsNOTES TO CONDENSED CONSOLIDATED FINANCIAL STATEMENTS (UNAUDITED), CONTINUED
Earnings Per Share
Under ASC 260-10, Earnings Per Share, basic EPS excludes dilution for Common Stock equivalents and is calculated bydividing net income available to common stockholders by the weighted-average number of Common Stock outstanding for theperiod. Our Series B Convertible Preferred Stock is a participating security. Consequently, the two-class method of incomeallocation is used in determining net income available to common stockholders.
Diluted EPS is calculated by using the treasury stock method, assuming conversion of all potentially dilutive securities, such asstock options and warrants. Under this method, (i) exercise of options and warrants is assumed at the beginning of the period andshares of Common Stock are assumed to be issued, (ii) the proceeds from exercise are assumed to be used to purchase CommonStock at the average market price during the period, and (iii) the incremental shares (the difference between the number of sharesassumed issued and the number of shares assumed purchased) are included in the denominator of the diluted EPS computation.The numerators and denominators used in the computations of basic and diluted EPS are presented in the following table.
Three Months Ended Nine Months Ended September 30, September 30, September 30, September 30, 2011 2010 2011 2010 NUMERATOR FOR BASIC AND DILUTED EPS Net income $ 1,813,420 $ 3,571,646 $ 8,593,545 $ 10,000,075 Net income allocated to Preferred Stock (66,008) (161,160) (312,805) (705,005) Net income to common stockholders (Basic) $ 1,747,412 $ 3,410,486 $ 8,280,740 $ 9,295,070 Net income $ 1,813,420 $ 3,571,646 $ 8,593,545 $ 10,000,075 Change in fair value of warrant liability* - - - - Net income (numerator for Diluted EPS) $ 1,813,420 $ 3,571,646 $ 8,593,545 $ 10,000,075 DENOMINATORS FOR BASIC AND DILUTEDEPS Weighted average Common Stock outstanding 25,690,402 22,437,576 25,690,402 20,336,417 DENOMINATOR FOR BASIC EPS 25,690,402 22,437,576 25,690,402 20,336,417 Add: Weighted average Preferred Stock as ifconverted 971,099 1,070,098 971,099 1,542,031 Add: Weighted average stock warrants outstanding - 2,878 - 17,162
DENOMINATOR FOR DILUTED EPS 26,661,501 23,510,552 26,661,501 21,895,610 EPS – Basic $ 0.07 $ 0.15 $ 0.32 $ 0.46 EPS – Diluted $ 0.07** $ 0.15* $ 0.32** $ 0.46*
* The effect of 1,228,334 shares of warrants and the related change in fair value of warrant liability were not included for thecomputation of diluted earnings per share for the period ended as the inclusion would be anti-dilutive. ** The effect of 175,000 shares of warrants were not included for the computation of diluted earnings per share for the period as theinclusion would be anti-dilutive.
-6-

9/4/18, 1:19 PMskpl10q_sep302011.htm
Page 13 of 53https://www.sec.gov/Archives/edgar/data/1066923/000141588911001281/skpl10q_sep302011.htm
Table of ContentsNOTES TO CONDENSED CONSOLIDATED FINANCIAL STATEMENTS (UNAUDITED), CONTINUED
Shipping and Handling Costs
Shipping and handling amounts billed to customers in related sales transactions are included in sales revenues and shippingexpenses incurred by the Company are reported as a component of selling expenses. The shipping and handling expenses of$361,076 and $123,394 for the three months ended September 30, 2011 and 2010, respectively, and $903,820 and $650,883 forthe nine months ended September 30, 2011 and 2010, respectively, are reported in the Condensed Consolidated Statements ofIncome and Comprehensive Income as a component of selling expenses.
Accounts Receivable
Accounts receivable are recognized and carried at the original invoice amount less an allowance for any uncollectible amount.Allowance is made when collection of the full amount is no longer probable. The Company periodically evaluates its receivablesfor collectability based on historical experience, current economic climate, as well as recent account activities and the length oftime receivables are past due, and writes off receivables when they become uncollectible. The Company believed that itsallowance for doubtful accounts was adequate as of September 30, 2011 and December 31, 2010.
Inventories
Inventories consist of raw materials, packaging materials (which include ingredients and supplies) and finished goods (whichinclude finished juice in the bottling and canning operations). Inventories are valued at the lower of cost or market. Wedetermine cost on the basis of the weighted average method. The Company periodically reviews inventories for obsolescenceand any inventories identified as obsolete are reserved or written off.
Revenue Recognition
The Company recognizes revenue in accordance with ASC 605, Revenue Recognition. Revenue from sales of products isrecognized upon shipment or delivery to customers, provided that persuasive evidence of sales arrangements exist, title and riskof loss have been transferred to the customers, the sales amounts are fixed and determinable and collection of the revenue isreasonably assured and customers have no contractual right to return products. Historically, the Company has not had anyreturned products. Accordingly, no provision has been made for returnable goods.
Government Subsidies
A government subsidy is recognized only when the Company complies with any conditions attached to the grant and there isreasonable assurance that the grant will be received.
The government subsidies recognized were $50,632 and $132,984 for the three months ended September 30, 2011 and 2010,respectively, and were $622,396 and $2,381,389 for the nine months ended September 30, 2011 and 2010, respectively. Thegovernment subsidies are included in other income of the Condensed Consolidated Statements of Income and ComprehensiveIncome. The government subsidies recognized for the three and nine months ended September 30, 2011 were mainly for the VATrebates on the export to foreign countries, and the government subsidies recognized for the three and nine months endedSeptember 30, 2010 were mainly for research and development activities.
-7-

9/4/18, 1:19 PMskpl10q_sep302011.htm
Page 14 of 53https://www.sec.gov/Archives/edgar/data/1066923/000141588911001281/skpl10q_sep302011.htm
Table of ContentsNOTES TO CONDENSED CONSOLIDATED FINANCIAL STATEMENTS (UNAUDITED), CONTINUED
Advertising and Promotional Expense
Advertising and promotional costs are expensed as incurred and are included in selling expenses. The Company incurred$24,230 and $1,457 in advertising and promotional costs for the three months ended September 30, 2011 and 2010, respectively,and $34,281 and $3,437 for the nine months ended September 30, 2011 and 2010, respectively.
Property, Plant and Equipment
Property, plant and equipment are stated at cost less accumulated depreciation and any impairment losses. Depreciation iscomputed using the straight-line method over the useful lives of the assets. Major renewals and betterments are capitalized anddepreciated; maintenance and repairs that do not extend the life of the respective assets are expensed as incurred. Upon disposalof assets, the cost and related accumulated depreciation are removed from the accounts and any gain or loss is included in theCondensed Consolidated Statements of Income and Comprehensive Income.
Construction in progress primarily represents the renovation costs of plant, machinery and equipment stated at cost less anyaccumulated impairment loss, which is not depreciated. Costs and interest on borrowings incurred are capitalized and transferredto property and equipment upon completion, at which time depreciation commences. Cost of repairs and maintenance isexpensed as incurred.
Depreciation related to property, plant and equipment used in production is reported in cost of sales. We estimated that theresidual value of the Company’s property and equipment ranges from 3% to 5%. Property, plant and equipment are depreciatedover their estimated useful lives as follows:
Buildings 10-30 yearsMachinery and equipment 5-10 yearsFurniture and office equipment 3-5 yearsMotor vehicles 5 years
Depreciation expense included in general and administration expenses for the three months ended September 30, 2011 and 2010was $54,989 and $26,249, respectively, and was $184,761 and $104,795 for the nine months ended September 30, 2011 and2010, respectively. Depreciation expense included in cost of sales for the three months ended September 30, 2011 and 2010 was$824,505 and $486,393, respectively, and was $2,356,037and $1,371,586 for the nine months ended September 30, 2011 and2010, respectively.
Foreign Currency and Comprehensive Income
The accompanying condensed consolidated financial statements are presented in U.S. dollars (“USD”). The financial statementsof the Company’s foreign subsidiaries are measured using the local currency as the functional currency. However, the functionalcurrency and the reporting currency of the Company are the USD. Assets and liabilities of the Company’s foreign subsidiariesare translated into USD from RMB at period-end exchange rates for assets and liabilities and weighted average exchange ratesfor revenue and expenses. Capital accounts are translated at their historical exchange rates when the capital transactionsoccurred. Translation adjustments are reported separately and accumulated in a separate component of equity (cumulativetranslation adjustment).
Other comprehensive income for the three and nine months ended September 30, 2011 and 2010 represented foreign currencytranslation adjustments and were included in the Condensed Consolidated Statements of Income and Comprehensive Income.
-8-

9/4/18, 1:19 PMskpl10q_sep302011.htm
Page 15 of 53https://www.sec.gov/Archives/edgar/data/1066923/000141588911001281/skpl10q_sep302011.htm
Table of ContentsNOTES TO CONDENSED CONSOLIDATED FINANCIAL STATEMENTS (UNAUDITED), CONTINUED
Income Taxes
Income taxes are provided on an asset and liability approach for financial accounting and reporting of income taxes. Any taxpaid by subsidiaries during the period is recorded. Current tax is based on the profit or loss from ordinary activities adjusted foritems that are non-assessable or disallowable for income tax purpose and is calculated using tax rates that have been enacted atthe balance sheet date. Deferred income tax liabilities or assets are recorded to reflect the tax consequences in future years ofdifferences between the tax basis of assets and liabilities and the financial reporting amounts at each period end. A valuationallowance is recognized if it is more likely than not that some portion, or all, of a deferred tax asset will not be realized.
The Company adopted FASB Interpretation No. 48 Accounting for Uncertainty in Income Taxes- an interpretation of FASBStatement No. 109 (FIN48), which is codified as ASC 740. ASC 740 provides guidance for recognizing and measuring uncertaintax positions, and it prescribes a threshold condition that a tax position must meet for any of the benefits of the uncertain taxposition to be recognized in the financial statements. ASC 740 also provides accounting guidance on derecognizing,classification and disclosure of these uncertain tax positions. The FIN48 did not have a material impact on the Company’scondensed consolidated financial statements for the three and nine months ended September 30, 2011. Restrictions on Transfer of Assets out of the PRC
Dividend payments by PRC subsidiaries are limited by certain statutory regulations in the PRC. No dividends may be paid byPRC subsidiaries without first receiving prior approval from the State Administration of Foreign Exchange. Dividend paymentsare restricted to 90% of profits after tax.
The Company has not provided deferred taxes on undistributed earnings attributable to its PRC subsidiaries, as they are to bepermanently reinvested. On February 22, 2008, the Ministry of Finance (“MOF”) and the State Administration of Taxation(“SAT”) jointly issued Caishui 2008 Circular 1 (“Circular 1”). According to Article 4 of Circular 1, distributions of accumulatedprofits earned by foreign investment enterprises (“FIE”) prior to January 1, 2008 to their foreign investors will be exempt fromwithholding tax (“WHT”) while distribution of the profits earned by a FIE after January 1, 2008 to its foreign investors shall besubject to WHT.
The Company is a holding company incorporated in the State of Florida and does not have any assets or conduct any businessoperations other than its investments in its subsidiaries and affiliates, Pacific and SkyPeople (China). Since SkyPeople (China)intends to reinvest its earnings to further expand its businesses in mainland China, its PRC subsidiaries do not intend to declaredividends to their immediate foreign holding companies in the foreseeable future. Accordingly, the Company has not recordedany deferred taxes in relation to WHT on the cumulative amount of undistributed retained earnings since January 1, 2008.
Should the Company’s PRC subsidiaries distribute all their profits generated after December 31, 2007, the aggregatewithholding tax amount will be approximately $5,965,063 and $4,999,432 as of September 30, 2011 and December 31, 2010,respectively.
Operating Lease
The Company leased certain property, plant and equipment in the ordinary course of business. The leases were classified asoperating leases, in accordance with ASC Topic 840, Accounting for Leases. The Company records monthly rent expense equalto the total amount of the payments due in the reporting period over the lease term in accordance with U.S. GAAP. TheCompany’s management expects that in the normal course of business, operating leases will be renewed or replaced by otherleases.
-9-

9/4/18, 1:19 PMskpl10q_sep302011.htm
Page 16 of 53https://www.sec.gov/Archives/edgar/data/1066923/000141588911001281/skpl10q_sep302011.htm
Table of ContentsNOTES TO CONDENSED CONSOLIDATED FINANCIAL STATEMENTS (UNAUDITED), CONTINUED
Land Usage Rights
The Company paid in advance for land usage rights according to Chinese laws. Prepaid land usage rights are amortized andrecorded as lease expenses using the straight-line method over the tenure of the leases, which are 30 to 50 years.
Reportable Segments
We have six operating segments for financial reporting purposes for all periods presented in our condensed consolidatedfinancial statements in accordance with FASB ASC 280 “Segment Reporting”.
Research and Development
Research and development costs are expensed when incurred and are included in operating expenses. The expenses were$145,413 and $271,453 for the three months ended September 30, 2011 and 2010, respectively, and were $420,121 and$816,786 for the nine months ended September 30, 2011 and 2010, respectively.
Loss Contingency
The Company makes provision related to loss contingencies when a loss is probable and the amount is reasonably estimable.Although management believes, after consultation with the Company’s counsel, that adequate reserves have been provided forall known loss contingencies, the ultimate result will depend on the resolution of the uncertainties. Therefore, actual results maydiffer from such estimates and the difference may be material.
Retirement Costs
Retirement cost contributions relating to defined contribution plans are made based on a percentage of the relevant employees’salaries and are included in the Condensed Consolidated Statements of Income and Comprehensive Income as they becomepayable. The assumptions used in calculating the obligation for retirement cost contributions depend on the local laws andregulations, interpretations and practices in respect thereof. The retirement costs were $22,143 and 9,591 for the three monthsended September 30, 2011 and 2010, respectively, and were $39,542 and $30,785 for the nine months ended September 30, 2011and 2010, respectively.
Short-term notes payable
Short-term notes payable are written promises to pay stated sums of money at future dates, classified as current (if due within 12months) or non-current (if due after 12 months) of the balance sheet date. Short-term notes payable were $1,185,023 and$505,581 as of the September 30, 2011 and 2010, respectively. New Accounting Pronouncements
New Accounting pronouncements issued but not yet effective until after September 30, 2011 are not expected to have significanteffect on the Company’s condensed consolidated financial position or results of operations. 3. INVENTORIES Inventories by major category are summarized as follows:
September 30, December 31, 2011 2010

9/4/18, 1:19 PMskpl10q_sep302011.htm
Page 17 of 53https://www.sec.gov/Archives/edgar/data/1066923/000141588911001281/skpl10q_sep302011.htm
Raw materials and packaging $ 1,272,446 $ 641,629 Finished goods 6,809,743 4,794,488 Total $ 8,082,189 $ 5,436,117
-10-

9/4/18, 1:19 PMskpl10q_sep302011.htm
Page 18 of 53https://www.sec.gov/Archives/edgar/data/1066923/000141588911001281/skpl10q_sep302011.htm
Table of ContentsNOTES TO CONDENSED CONSOLIDATED FINANCIAL STATEMENTS (UNAUDITED), CONTINUED
4. PROPERTY, PLANT AND EQUIPMENT
Property, plant and equipment consist of the following:
September 30
2011 December 31,
2010 Machinery and equipment $ 25,560,910 $ 24,146,615 Furniture and office equipment 297,058 276,436 Motor vehicles 458,512 443,282 Buildings 21,533,107 20,815,727 Construction in progress 51,678 6,903
Subtotal 47,901,265 45,688,963 Less: accumulated depreciation (12,231,003) (9,351,712)Property, plant and equipment, net $ 35,670,262 $ 36,337,251
There were no impairment provisions made as of September 30, 2011 and December 31, 2010. The Company began theconstruction of the beverages line and environmental projects in Huludao Wonder factory on September 28, 2010. As ofSeptember 30, 2011, the Company paid deposits of $1.6 million for the construction project in the Huludao Wonder factory,which was included in the other assets. In addition, the Company capitalized $36,811 as construction in progress of HuludaoWonder as of September 30, 2011, and the construction of environmental projects are expected to be completed in early 2012.The estimated future capital noncontractual expenditure for the beverages line and environmental projects is $8 million. TheCompany capitalized $14,867 as construction in progress as of September 30, 2011. Because of the road construction conductedby the local government around Qiyiwangguo factory, currently this project is halted and is expected to be completed by the endof the fourth quarter of 2011. There will be an estimated further expenditure of $24,000 to be incurred on this project, which isnot a contractual obligation.
The Company currently does not have the title deed for the building of $2.2 million of the Qiyiwangguo factory. The Companyplans to apply for the title deed after the planned construction of Qiyiwangguo is completed in 2012. In addition, the Companycurrently does not have the title deed for the $7.1 million building of the Yingkou factory, which was built in the fourth quarterof fiscal 2010. The Company is in the process of applying for the title deed from the relevant PRC authority.
5. LAND USAGE RIGHTS
According to the laws of the PRC, the government owns all of the land in the PRC. The government of the PRC, its agencies andcollectives hold all land ownership. Companies or individuals are authorized to use the land only through land usage rightsgranted by the PRC government. Land usage rights can be transferred upon approval by the land administrative authorities of thePRC (State Land Administration Bureau) upon payment of the required land transfer fee. Accordingly, the Company paid inadvance for land usage rights. Prepaid land usage rights are being amortized and recorded as lease expenses using the straight-line method over the terms of the leases, which range from 30 to 50 years. The amortization expense was $46,132 and $63,911for the three months ended September 30, 2011 and 2010, respectively, and was $133,283 and $189,551 for the nine monthsended September 30, 2011 and 2010, respectively.
6. INCOME TAX
The Company is incorporated in the United States of America and is subject to United States federal taxation. No provisions forincome taxes have been made, as the Company had no U.S. taxable income for the nine months ended September 30, 2011 and2010. The applicable income tax rate for the Company was 34% for both of the nine months ended September 30, 2011 and2010. The amount of unrecognized deferred tax liabilities for temporary differences related to the dividend from foreignsubsidiaries is not determined, because such determination is not practical.

9/4/18, 1:19 PMskpl10q_sep302011.htm
Page 19 of 53https://www.sec.gov/Archives/edgar/data/1066923/000141588911001281/skpl10q_sep302011.htm
-11-

9/4/18, 1:19 PMskpl10q_sep302011.htm
Page 20 of 53https://www.sec.gov/Archives/edgar/data/1066923/000141588911001281/skpl10q_sep302011.htm
Table of ContentsNOTES TO CONDENSED CONSOLIDATED FINANCIAL STATEMENTS (UNAUDITED), CONTINUED
Effective on January 1, 2008, the PRC Enterprise Income Tax Law, EIT Law, and Implementing Rules imposed a unifiedenterprise income tax rate of 25% on all domestic-invested enterprises and foreign-invested enterprises in the PRC, unless theyqualify under certain limited exceptions. In December 2006, SkyPeople (China) was awarded the status of a nationallyrecognized High and New Technology Enterprise in Shaanxi Province, which entitled SkyPeople (China) to tax-free treatmentfrom January 2007 to December 2008. As such, starting from January 1, 2009, four of the Company’s subsidiaries in the PRC,including SkyPeople (China), Shaanxi Qiyiwangguo, Yingkou and Huludao Wonder, were subject to an enterprise income taxrate of 25%.
The Company had no material adjustments to its liabilities for unrecognized income tax benefits according to the provisions ofASC Topic 740, Income Taxes. The income tax expense was $3,419,625and $4,823,980 for the nine months ended September30, 2011 and 2010, respectively, and it was $726,239 and $1,395,109 for the three months ended September 30, 2011 and 2010,respectively. Since SkyPeople (China) intends to reinvest its earnings to further expand its businesses in mainland China, itsPRC subsidiaries do not intend to declare dividends to their immediate foreign holding companies in the foreseeable future.Accordingly, the Company has not recorded any deferred taxes in relation to WHT on the cumulative amount of undistributedretained earnings since January 1, 2008. Apart from that, the Company did not have other significant temporary differences andhence had not recorded any deferred tax assets or liabilities as of September 30, 2011 and December 31, 2010.
Three Months Ended September
30, Nine Months Ended September
30, 2011 2010 2011 2010 Income Tax Expenses Current $ 726,239 $ 1,395,109 $ 3,419,625 $ 4,823,980 Deferred — — — — Total $ 726,239 $ 1,395,109 $ 3,419,625 $ 4,823,980
The effective income tax expenses differ from the PRC statutory income tax rate of 25% from continuing operations in the PRCas follows:
Three Months Ended September 30, Nine Months Ended September 30, 2011 2010 2011 2010 Statutory income tax rate 25% 25% 25% 25%Permanent adjustment 2% 1% 2% 5%Effective income tax rate 27% 26% 27 % 30%
The Company did not recognize any income tax benefit under the provisions of ASC Topic 740 for the three and nine monthsended September 30, 2011 and 2010, respectively.
-12-

9/4/18, 1:19 PMskpl10q_sep302011.htm
Page 21 of 53https://www.sec.gov/Archives/edgar/data/1066923/000141588911001281/skpl10q_sep302011.htm
Table of ContentsNOTES TO CONDENSED CONSOLIDATED FINANCIAL STATEMENTS (UNAUDITED), CONTINUED
7. SHORT-TERM LOANS
As of September 30, 2011 the balance of the short-term bank loans totaled RMB 84,000,000 (or $13,159,956 based on theexchange rate on September 30, 2011), with interest rates ranging from 4.80% to 10.727% per annum. Of this amount, RMB16.3 million, or $2.5 million, was secured by the office building of SkyPeople (China), the production line of the Jingyangfactory and a personal guarantee provided by the Company’s CEO and chairman of the board of directors, Mr. Xue Yongke, andMr. Xue Hongke, chairman of the board of directors and chief executive officer of SkyPeople (China); RMB 18 million, or $2.8million, was secured by the guarantee provided by Shaanxi Boai Pharmaceutical & Scientific Development Co., Ltd. and apersonal guarantee provided by Mr. Xue Hongke; RMB 16.4 million, or $2.5 million, was secured by land usage right of theJingyang factory in Jinyang County, Shaanxi Province, and a personal guarantee provided by Mr. Xue Yongke and Mr. XueHongke, and the rest of the loans were collateralized by land usage rights, buildings and plant and machinery of HuludaoWonder factory. All loans will be due for repayment from December 2011 to June 2012.
As of December 31, 2010 the balance of the short-term bank loans totaled RMB 67,600,000 (or $10,238,856 based on theexchange rate on December 31, 2010), with interest rates ranging from 4.80% to 7.97% per annum. Of this amount, RMB 16.3million, or $2.5 million, was secured by the office building of SkyPeople (China), the production line of the Jingyang factoryand a personal guarantee provided by the Company’s CEO, Mr. Xue Yongke, and Mr. Xue Hongke, chairman of the board ofdirectors and chief executive officer of SkyPeople (China); RMB 18 million, or $2.7 million, was secured by the guaranteeprovided by Shaanxi Boai Pharmaceutical & Scientific Development Co., Ltd. and a personal guarantee provided by Mr. XueHongke, and the rest of the loans were collateralized by land usage rights, buildings and plant and machinery of HuludaoWonder factory. All loans will be due for repayment from June 2011 to December 2011. The fair value of the financial guaranteegiven by Mr. Xue Yongke and Mr. Xue Hongke is considered by the Company to be minimal.
8. WARRANTS
Between February 22, 2008 and February 25, 2008, the Company entered into a series of transactions whereby we acquired100% of the ownership interest in Pacific from the shareholders of Pacific in a share exchange transaction and raised $3,400,000gross proceeds from certain accredited investors in a private placement transaction. These transactions, collectively hereinafterreferred to as “Reverse Merger Transactions,” were consummated simultaneously on February 26, 2008, and as a result of theconsummation of these transactions Pacific is now a wholly-owned subsidiary of the Company.
The Company issued 4,666,667 warrants pursuant to the Stock Purchase Agreement dated February 26, 2008 with certain resetexercise price provisions. The reset provisions were recorded at their relative fair values at issuance and will continue to berecorded at fair value at each subsequent balance sheet date. Any change in value between reporting periods will be recorded asother income (expense). These warrants will continue to be reported as a liability until such time when they are exercised orexpire. The fair value of these warrants is estimated using the Monte-Carlo simulation methods.
As of January 1, 2009, the grant date fair value of these warrants in the amount of $nil was reallocated from additional paid-in-capital and a warrant liability was recorded in the amount of $7,420,000, being the fair value of the warrants on January 1, 2009offset by an adjustment to retained earnings of $7,420,000.
On June 2, 2009, the Company entered into an Exchange Agreement with the Investors, pursuant to which the Company issuedto the Investors warrants to purchase an aggregate of 4,333,333 shares of Common Stock at a reduced exercise price (the “NewWarrants”) in exchange for warrants to purchase an aggregate of 4,666,667 shares of Common Stock which had been issued tothe Investors in February 2008 with an exercise price of $2.55 per share. The fair value of the New Warrants was determined tobe $15,600,000; accordingly, the Company recorded $8,180,000 in other expense relating to the change in the fair value of thesewarrants.
-13-

9/4/18, 1:19 PMskpl10q_sep302011.htm
Page 22 of 53https://www.sec.gov/Archives/edgar/data/1066923/000141588911001281/skpl10q_sep302011.htm
Table of ContentsNOTES TO CONDENSED CONSOLIDATED FINANCIAL STATEMENTS (UNAUDITED), CONTINUED
On November 3, 2009, 3,105,000 shares of Common Stock were issued in the public offering upon exercise of the warrants, andaccordingly the Company recorded $9,100,000 in other income relating to the change in the fair value of the warrants. The fairvalue of the warrants upon exercise on November 3, 2009 of $4,657,500 were credited against additional paid in capital.
As of December 31, 2009, the fair value of the remaining 1,228,334 warrants was determined to be $3,377,917; accordingly, theCompany recorded $1,535,417 in other expense related to the change in the fair value of these warrants. There is no cash flowimpact for the warrant liability until the warrants are exercised. During the nine months ended September 30, 2010, certainholders of warrants exercised warrants to purchase 1,228,333 shares of Common Stock. As of September 30, 2010, there wereno remaining warrants; and accordingly the Company recorded $2,103,832 in other expense relating to the change in the fairvalue of the warrants. The fair value of the warrants upon exercise on September, 2010 of $5,481,749 was credited againstadditional paid- in capital.
On January 1, 2009, the Company adopted FASB Accounting Standard Codification Topic on Fair Value Measurements andDisclosures (“ASC 820”), which defines fair value, establishes a framework for measuring fair value in GAAP, and expandsdisclosures about fair value measurements. ASC 820 does not require any new fair value measurements, but provides guidanceon how to measure fair value by providing a fair value hierarchy used to classify the source of the information. In February2008, the FASB deferred the effective date of ASC 820 by one year for certain non-financial assets and non-financial liabilities,except those that are recognized or disclosed at fair value in the financial statements on a recurring basis (at least annually). TheCompany adopted the provisions of ASC 820, except as it applies to those non-financial assets and non-financial liabilities forwhich the effective date has been delayed by one year.
ASC 820 establishes a three-level valuation hierarchy of valuation techniques based on observable and unobservable input,which may be used to measure fair value and include the following:
Level 1 - Quoted prices in active markets for identical assets or liabilities. Level 2 - Input other than Level 1 that is observable, either directly or indirectly, such as quoted prices for similar assets orliabilities; quoted prices in markets that are not active; or other input that is observable or can be corroborated by observablemarket data for substantially the full term of the assets or liabilities. Level 3 - Unobservable input that is supported by little or no market activity and that is significant to the fair value of the assetsor liabilities. Classification within the hierarchy is determined based on the lowest level of input that is significant to the fair valuemeasurement.
The following table presents a reconciliation of the warrant liabilities measured at fair value on a recurring basis usingsignificant unobservable input (Level 3) from January 1, 2010 to September 30, 2010:
Warrant
liabilities Balance at January 1, 2010 $ 3,377,917 Change in fair value included in earnings 2,103,832 Exercise of warrants in the nine months ended September 30, 2010 (5,481,749)Balance at September 30, 2010 $ -
For the nine months ended September 30, 2010, the net adjustment to fair value resulted in a loss of $2.1 million and is includedin “Changes in the fair value of warrant liability” on the accompanying Condensed Consolidated Statement of Income andComprehensive Income.

9/4/18, 1:19 PMskpl10q_sep302011.htm
Page 23 of 53https://www.sec.gov/Archives/edgar/data/1066923/000141588911001281/skpl10q_sep302011.htm
-14-

9/4/18, 1:19 PMskpl10q_sep302011.htm
Page 24 of 53https://www.sec.gov/Archives/edgar/data/1066923/000141588911001281/skpl10q_sep302011.htm
Table of ContentsNOTES TO CONDENSED CONSOLIDATED FINANCIAL STATEMENTS (UNAUDITED), CONTINUED
9. COMMON STOCK
As of September 30, 2011, the Company had 25,690,402 shares of Common Stock issued and outstanding and 3,456,647 sharesof Series B Convertible Preferred Stock issued and outstanding, including (i) 2,000,000 shares held in escrow as make goodescrow shares in connection with our 2008 private placement, which shares are in the process of being released to the Companyand will be canceled upon release, and (ii) 1,456,647 shares held by two shareholders of record, which shares can be convertedinto 971,099 shares of Common Stock. As of September 30, 2011, the Company had outstanding warrants to purchase 175,000shares of Common Stock. Assuming all warrants to purchase 175,000 shares of Common Stock with an exercise price of $4.50per share are exercised and all shares of Series B Convertible Preferred Stock are converted, the total number of shares ofCommon Stock to be issued and outstanding will be 26,836,501.
10. COMMITMENTS AND CONTINGENCIES
The following contractual obligations servicing table describes the Company’s overall future cash obligations based on variouscurrent contracts in the next three years:
Payments Due by Period (as of September 30, 2011) Less than 1 - 3 After Total 1 Year Years 3 Years Short-term bank loans $ 13,159,956 $ 13,159,956 $ - $ - Interest on short-term bank loans 666,281 666,281 - - Short-term notes payable 1,185,023 1,185,023 - - Contract for research and development projects 704,974 563,979 140,995 Construction in progress 1,437,230 1,437,230 - - Acquisition of plant and machinery 1,148,205 1,148,205 - - Total $ 18,301,669 $ 18,160,674 $ 140,995 $ -
The Company has not, historically, carried any property or casualty insurance and has never incurred property damage orincurred casualty losses. Management believes the chances of such an obligation arising are remote. Accordingly, no amountshave been accrued for any liability that could arise from a lack of insurance. On April 20, 2011, plaintiff Paul Kubala (on behalf of his minor child N.K.) filed a securities fraud class action lawsuit in theUnited States District Court, Southern District of New York against the Company, certain of its individual officers and/ordirectors, Yongke Xue and Xiaoqin Yan, and Rodman & Renshaw, LLC, the underwriter of the Company’s follow-on publicoffering consummated in August 2010, alleging violations of Sections 10(b) and 20(a) of the Securities Exchange Act of 1934(the “Exchange Act”) and Rule 10b-5 promulgated thereunder. On June 20, 2011, plaintiff Benjamin Padnos filed a securitiesfraud class action lawsuit in the United States District Court, Southern District of New York against the Company, all of itsindividual officers and/or directors, Yongke Xue, Xiaoqin Yan, Norman Ko, John W. Smagula, Spring Liu, Child Van Wagner &Bradshaw, PLLC, BDO Limited and Rodman & Renshaw,LLC, the underwriter of the Company’s follow-on public offeringconsummated in August 2010, alleging violations of Sections10(b) and 20(a) of the Exchange Act and Rule 10b-5 promulgatedthereunder. On August 30, 2011, the court consolidated the foregoing two actions and appointed Zachary Lewy as lead plaintiff. On September 30, 2011, pursuant to the Court’s order, Lead Plaintiff filed a consolidated complaint. The consolidated complaintnames the Company, Rodman & Renshaw,LLC, BDO Limited, Child Van Wagoner & Bradshaw PLLC and certain of theCompany’s current and former directors and majority shareholders as defendants and alleges violations of Section 11 and 12 ofthe Securities Act of 1933 and Section 10(b) and 20(a) of the Exchange Act, and the rules promulgated thereunder. In theconsolidated complaint, the plaintiffs are seeking to be awarded, among other things, compensatory damages, reasonable costsand expenses incurred in the action. The Company has retained a defense counsel to represent it in the matter and intends to filea motion to dismiss the consolidated complaint, which is currently due to be served on December 2, 2011. It is unclear at thistime what plaintiff damages will be, if any. Accordingly, the estimate of loss cannot be made at this stage.

9/4/18, 1:19 PMskpl10q_sep302011.htm
Page 25 of 53https://www.sec.gov/Archives/edgar/data/1066923/000141588911001281/skpl10q_sep302011.htm
-15-

9/4/18, 1:19 PMskpl10q_sep302011.htm
Page 26 of 53https://www.sec.gov/Archives/edgar/data/1066923/000141588911001281/skpl10q_sep302011.htm
Table of ContentsNOTES TO CONDENSED CONSOLIDATED FINANCIAL STATEMENTS (UNAUDITED), CONTINUED
On July 11, 2011, pursuant to the approval of our Board of Directors, the Company entered into an indemnification agreement(each an “Indemnification Agreement” and collectively the “Indemnification Agreements”) with each of our directors and thechief financial officer, including Yongke Xue, Spring Liu, Xiaoqin Yan, Guolin Wang, John W. Smagula and Norman Ko (eachan “Indemnitee”). Under each Indemnification Agreement, the Company agreed to indemnify each Indemnittee against liabilityarising out of the individual’s performance of his duties to the Company. The Indemnification Agreement providesindemnification in addition to the indemnification provided by our By-laws, Articles of Incorporation and applicable law.Among other things, the Indemnification Agreement indemnifies each director and officer for certain expenses (includingattorneys’ fees), judgments, fines and settlement amounts actually and reasonably incurred by him in any action or proceeding,including any action by or in the right of the Company arising out of his service to the Company or to any other entity to whichhe provides services at the Company’s request. In addition, the Company agrees to advance expenses he may spend as a result ofany proceeding against him as to which he could be indemnified. On July 8, 2011, the Company filed a civil action suit against Absaroka Capital and Kevin Barns, who published an articlecontaining false allegations and accusations against the Company on June 1, 2011, for libel and tortuous interference withexisting and prospective economic advantages in the United States District Court for the District of Wyoming, where AbsarokaCapital is based. The Company seeks both general damages and all actual, consequential and/or compensatory damages to beproven at trial and exemplary and punitive damages in an amount to be proven at trial as a result of Defendants’ malicious intentin publishing the article on June 1, 2011. The parties have agreed to enter into settlement discussions relating to the suit filedby SPU against Absaroka. In this regard, on September 26, 2011, the parties filed and the Court entered a stipulation stayingthe matter for 30 days so the parties could continue settlement discussions. The parties thereafter entered into a confidentialityagreement and began exchanging documents. The stay expired October 26, 2011, without settlement, but the parties agreed thatthe Company would file an amended complaint on October 31, 2011, giving Absaroka an additional 14 days – to November 14,2011—to file its answer/counter-claims. In the meantime, the parties continue to exchange documents in hopes of settling thematter. It is unclear at this time what the Company’s damages will be.
The Company has incurred legal expense related to these pending litigations of $0.45 million and $0.75 million for the three andnine months ended of September 30, 2011, respectively. On August 5, 2011, the Company received a shareholder demand letter from counsel for a purported shareholder. The letter isaddressed to the Company’s board of directors and requests the Board of Directors take a number of actions in order to repair thealleged “harm” caused to the Company by certain of its directors and officers, as well as its current and former auditors. Inresponse to the shareholder demand letter, the board of directors approved the appointment of new directors to establish anevaluation committee of the Board of Directors. On November 7, 2011, two directors were appointed to serve as directors of theboard and the independent directors of the board appointed these directors to serve as the members of the evaluation committee.The evaluation committee is expected to evaluate the actions demanded by the shareholder. In addition to the above, from timeto time, we may be subject to legal proceedings and claims in the ordinary course of business. Other than the above, we are notcurrently a party to any litigation the outcome of which, if determined adversely to us, would individually or in the aggregate bereasonably expected to have a material adverse effect on our business, operating results, cash flows or financial condition.
11. NONCONTROLLING INTERESTS
Noncontrolling interests represent the minority stockholders’ share of 8.85% of the equity interest in Qiyiwangguo, and 0.22%equity interest in SkyPeople (China).
The table below reflects a reconciliation of the equity attributable to the noncontrolling interests:
Nine Months Ended
September 30, 2011 2010

9/4/18, 1:19 PMskpl10q_sep302011.htm
Page 27 of 53https://www.sec.gov/Archives/edgar/data/1066923/000141588911001281/skpl10q_sep302011.htm
Beginning balance $ 4,727,272 $ 2,762,146 Comprehensive income attributable to the noncontrolling interests 800,375 1,158,522 Ending balance 5,527,647 3,920,668
-16-

9/4/18, 1:19 PMskpl10q_sep302011.htm
Page 28 of 53https://www.sec.gov/Archives/edgar/data/1066923/000141588911001281/skpl10q_sep302011.htm
Table of ContentsNOTES TO CONDENSED CONSOLIDATED FINANCIAL STATEMENTS (UNAUDITED), CONTINUED
12. CONCENTRATIONS, RISKS AND UNCERTAINTIES
The Company’s major customer is a distributor of concentrated fruit juice, which accounted for the following percentages of thetotal sales during the three and nine months ended September 30, 2011, as indicated below: The Company did not haveconcentrations of customer constituting more than 10% of total sales during the three and nine months ended September 30,2010.
Three Months Ended
September 30, Nine Months Ended
September 30, 2011 2010 2011 2010
Sales Shaanxi Jiedong Commerce Co., Ltd. 10.0% 5.0% 5.0 % 6.4%
Accounts Receivable Shaanxi Jiedong Commerce Co., Ltd. 8.0% 5.0% 8.0 % 5.0%
Sales to our five largest customers accounted for approximately 32.1% and 23.6% of our net sales during the three months endedSeptember 30, 2011 and 2010, respectively, and was 22% and 36% of our net sales during the nine months ended September 30,2011 and 2010, respectively. The Company has not experienced any significant difficulty in collecting its accounts receivable in the past and is not aware ofany financial difficulties being experienced by its major customers. There was no bad debt expense during the three and ninemonths ended September 30, 2011 and 2010, respectively. Our credit term for distributors with good credit history is generallyfrom 30 days to 90 days. The accounts receivable outstanding over our credit term granted to customers accounted for 18% ofour total accounts receivable outstanding as of September 30, 2011. The accounts receivable outstanding over our credit termgranted to customers accounted for 5% of our total accounts receivable outstanding as of December 31, 2010. In the three months ended September 30, 2011, there were three suppliers (excluding suppliers of fresh fruit) which suppliedmore than 10% of our total purchase. The largest supplier was a packing glass bottle supplier for our fruit beverages, whichaccounted for 22% of our total purchases in the three months ended September 30, 2011. The second largest supplier was apacking material supplier for our fruit beverages, which accounted for 18% of our total purchases in the three months endedSeptember 30, 2011. And the third largest supplier was a production materials supplier, which accounted for 12% of our totalpurchase in the three months ended September 30, 2011. In the three months ended September 30, 2010, there was one supplier(excluding supplier of fresh fruits) which supplied more than 10% of our total purchase. The largest supplier was a packingglass bottle supplier for our fruit beverages, which accounted for 11% of our total purchase in the three months ended September30, 2010. In the nine months ended September 30, 2011, there were three suppliers (excluding suppliers of fresh fruits) which suppliedmore than 10% of our total purchase. The largest supplier in the nine months was a packing glass bottle supplier, whichaccounted for 23% of our total purchase in the nine months ended September 30, 2011. The second largest supplier was a paperbox supplier for our fruit beverages, which accounted for 18% of our total purchase in the nine months ended September 30,2011. The third largest supplier was a production materials supplier for our fruit beverages, which accounted for 12% of our totalpurchase in the nine months ended September 30, 2011. In the nine months ended September 30, 2010, there was one supplier(excluding supplier of fresh fruits) which supplied more than 10% of our total purchase. The largest supplier was glass bottlesupplier for our fruit beverages, which accounted for 10% of our total purchase in the nine months ended September 30, 2010.
-17-

9/4/18, 1:19 PMskpl10q_sep302011.htm
Page 29 of 53https://www.sec.gov/Archives/edgar/data/1066923/000141588911001281/skpl10q_sep302011.htm
Table of ContentsNOTES TO CONDENSED CONSOLIDATED FINANCIAL STATEMENTS (UNAUDITED), CONTINUED
13. OTHER ASSETS
Other assets as of September 30, 2011 mainly included deposits of $1.6 million for the construction project in the HuludaoWonder factory, which were mainly for the fruit juice beverage production line, deposits of $1.8 million for the constructionwork and $3.8 million for the purchase of equipment and machinery for the concentrated pear juice line in the Jingyang factory. Other assets as of December 31, 2010 included deposits of $19,675 to purchase machinery and equipment in SkyPeople (China),which were mainly for the pear juice line; deposits of $444,981 mainly for the purchase of a glass bottle blowing system in theQiyiwangguo factory; deposits of $158,571 in the Yingkou factory, which were mainly for the purchase of property, plant andequipment; and deposits of $1,071,259 in the Huludao Wonder factory, which were mainly for the construction project related tothe concentrated apple juice line.
14. SEGMENTS REPORTING
The Company operates in six segments: concentrated apple juice and apple aroma, concentrated kiwifruit juice and kiwifruitpuree, concentrated pear juice, fruit juice beverages, fresh fruits and vegetables, and others. Our concentrated apple juice andapple aroma is primarily produced by the Company’s Huludao Wonder factory and Yingkou factory; concentrated pear juice isprimarily produced by the Company’s Jingyang factory. However, the Company uses similar production lines to manufactureconcentrated apple juice and concentrated pear juice. In addition, both Shaanxi Province, where the Jingyang factory andQiyiwangguo factory are located, and Liaoning Province, where the factory of Huludao Wonder and the Yingkou factory arelocated, are rich in fresh apple and pear supplies, the Jingyang factory also produces concentrated apple juice and the HuludaoWonder factory also produces concentrated pear juice when necessary. Concentrated kiwifruit juice and kiwifruit puree areprimarily produced by the Company’s Qiyiwangguo factory, and Hedetang branded bottled fruit juice beverages are primarilyproduced by the Company’s Qiyiwangguo factory. The Company contracted Sanmenxia Prima Cider juice Co., Ltd. InSanmenxia City, Henan Province, to blend and package the product line for the tetra pack of 250ml of Qian Mei Duo products.The Company’s other products include fructose, concentrated turnjujube juice, and other byproducts, such as kiwifruit seeds. Concentrated fruit juice is used as a basic ingredient for manufacturing juice drinks and as an additive to fruit wine and fruit jam,cosmetics and medicines. The Company sells its concentrated fruit juice to domestic customers and exports directly or viadistributors. The Company believes that its main export markets are the United States, the European Union, South Korea, Russiaand the Middle East to North America, Europe, Russia, South Korea and the Middle East. The Company sells its Hedetangbranded bottled fruit beverages domestically primarily to supermarkets in the PRC. The Company sells its fresh fruit andvegetables to supermarkets and whole-sellers in the PRC. Some of these product segments might never individually meet thequantitative thresholds for determining reportable segments and we determine the reportable segments based on the discretefinancial information provided to the chief operating decision maker. The chief operating decision maker evaluates the results ofeach segment in assessing performance and allocating resources among the segments. Since there is an overlap of servicesprovided and products manufactured among different subsidiaries of the Company, the Company does not allocate operatingexpenses and assets based on the product segments. Therefore, operating expenses and assets information by segment are notpresented. Segment profit represents the gross profit of each reportable segment.
All inter-segment sales were sales from the concentrated kiwifruit juice, kiwifruit puree, concentrated apple juice andconcentrated pear juice to fruit juice beverages. Total inter-segment sales were $669 thousands and $460 thousands for the ninemonths ended September 30, 2011 and 2010, respectively. For the three months ended September 30, 2011 and 2010, total inter-segment sales were $156 thousands and $213 thousands respectively.
-18-

9/4/18, 1:19 PMskpl10q_sep302011.htm
Page 30 of 53https://www.sec.gov/Archives/edgar/data/1066923/000141588911001281/skpl10q_sep302011.htm
Table of ContentsNOTES TO CONDENSED CONSOLIDATED FINANCIAL STATEMENTS (UNAUDITED), CONTINUED
For the Nine Months EndedSeptember 30, 2011 (inthousands)
Concentratedapple juiceand apple
aroma
Concentratedkiwifruitjuice andkiwifruit
puree Concentrated
pear juice Fruit juicebeverages
Freshfruits andvegetables Others Total
Reportable segment revenue $ 15,024 $ 5,595 $ 8,036 $ 17,898 $ 2,354 $ 825 $ 49,732 Inter-segment revenue (182) (400) (87) - - - (669)Revenue from externalcustomers 14,842 5,195 7,949 17,898 2,354 825 49,063 Segment profit $ 3,734 $ 2,795 $ 2,541 $ 7,230 $ 1,160 $ 154 $ 17,614
For the Nine Months EndedSeptember 30, 2010 (inthousands)
Concentratedapple juiceand apple
aroma
Concentratedkiwifruitjuice andkiwifruit
puree Concentrated
pear juice Fruit juicebeverages
Fresh fruitsand
vegetables Others Total Reportable segment revenue $ 7,785 $ 9,351 $ 9,150 $ 15,073 $ 6,573 $ 1,835 $ 49,767 Inter-segment revenue - (460) - - - - (460)Revenue from externalcustomers 7,785 8,891 9,150 15,073 6,573 1,835 49,307 Segment profit $ 1,419 $ 5,403 $ 3,166 $ 6,298 $ 2,977 $ 842 $ 20,105
For the Three Months EndedSeptember 30, 2011 (inthousands)
Concentratedapple juiceand apple
aroma
Concentratedkiwifruitjuice andkiwifruit
puree Concentrated
pear juice Fruit juicebeverages
Freshfruits andvegetables Others Total
Reportable segment revenue $ 8,839 $ 566 $ 2,068 $ 5,188 $ 897 $ 35 $ 17,593 Inter-segment revenue (57) (67) (32) - - - (156)Revenue from external customers 8,782 499 2,036 5,188 897 35 17,437 Segment profit $ 2,045 $ 267 $ 516 $ 1,582 $ 424 $ 7 $ 4,841
For the Three Months EndedSeptember 30, 2010 (inthousands)
Concentratedapple juiceand apple
aroma
Concentratedkiwifruitjuice andkiwifruit
puree Concentrated
pear juice Fruit juicebeverages
Fresh fruitsand
vegetables Others Total Reportable segment revenue $ 2,166 $ 2,515 $ 3,325 $ 7,380 $ 3,005 $ 11 $ 18,402 Inter-segment revenue - (213) - - - - (213)Revenue from external customers 2,166 2,302 3,325 7,380 3,005 11 18,189 Segment profit $ 319 $ 1,002 $ 925 $ 3,240 $ 1,094 $ 5 $ 6,585
-19-

9/4/18, 1:19 PMskpl10q_sep302011.htm
Page 31 of 53https://www.sec.gov/Archives/edgar/data/1066923/000141588911001281/skpl10q_sep302011.htm
Table of ContentsNOTES TO CONDENSED CONSOLIDATED FINANCIAL STATEMENTS (UNAUDITED), CONTINUED
The following table reconciles reportable segment profit to the Company’s condensed consolidated income before income taxexpenses for the three and nine months ended September 30, 2011 and 2010:
(In thousands) Three Months Ended
September 30, Nine Months Ended
September 30, 2011 2010 2011 2010 Segment profit $ 4,841 6,585 $ 17,614 $ 20,105 Unallocated amounts: Operating expenses 2,001 1,132 5,204 3,870 Other (income)/expenses 176 108 (237) 355 Income before income tax expenses $ 2,664 5,345 $ 12,647 $ 15,880
The Company’s export business is primarily comprised of fruit juice concentrates. As most of the export sales are throughdistributors and therefore we are not certain exactly where the Company’s products are ultimately sold, revenue by geographicallocation is not presented. However, the Company estimates that our main export markets are the United States, the EuropeanUnion, South Korea, Russia and the Middle East. The Company’s export rate was 29% and 26% in the nine months endedSeptember 30, 2011 and 2010, respectively. For the three months ended September 30, 2011 and 2010, the export rate was 38%and 23% respectively. Our major customers are disclosed under Note 12 “Concentrations, risks and uncertainties.”
15. RESTRICTED CASH
Restricted cash consists of cash and cash equivalents used as collateral to obtain short-term notes payable and to settle a short-term loan interest payable. As of September 30, 2011, restricted cash used as collateral for the short-term notes payable and theshort-term loan interest payable was $1,185,023 and $22,305, respectively.
16. MAJOR RISKS RELATED WITH DOING BUSINESS IN THE PRC
The majority of the Company’s sales, cost of manufacturing and marketing are transacted in RMB. Consequently, theCompany’s costs, revenue and operating margins may be affected by fluctuations in exchange rates, primarily between the U.S.dollars and RMB.
The Company conducts substantially all of its operations and generates most of its revenue in the PRC. Accordingly, economic,political and legal developments in the PRC will significantly affect our business, financial condition, results of operations andprospects. The PRC economy is in transition from a planned economy to a market oriented economy subject to plans adopted bythe government that set national economic development goals. Policies of the PRC government can have significant effects oneconomic conditions in the PRC. Although the PRC government has been pursuing economic reform policies for more than twodecades, the PRC government continues to exercise significant control over economic growth in the PRC through the allocationof resources, controlling payments of foreign currency, setting monetary policy and imposing policies that impact particularindustries in different ways.
The Company could be adversely affected by diminishing confidence of the PRC consumers in the safety and quality of certainfood products or ingredients. As a result, the Company may elect or be required to incur additional costs aimed at increasingconsumer confidence in the safety of our products.
-20-
9/4/18, 1:19 PMskpl10q_sep302011.htm
Page 32 of 53https://www.sec.gov/Archives/edgar/data/1066923/000141588911001281/skpl10q_sep302011.htm
Table of ContentsNOTES TO CONDENSED CONSOLIDATED FINANCIAL STATEMENTS (UNAUDITED), CONTINUED
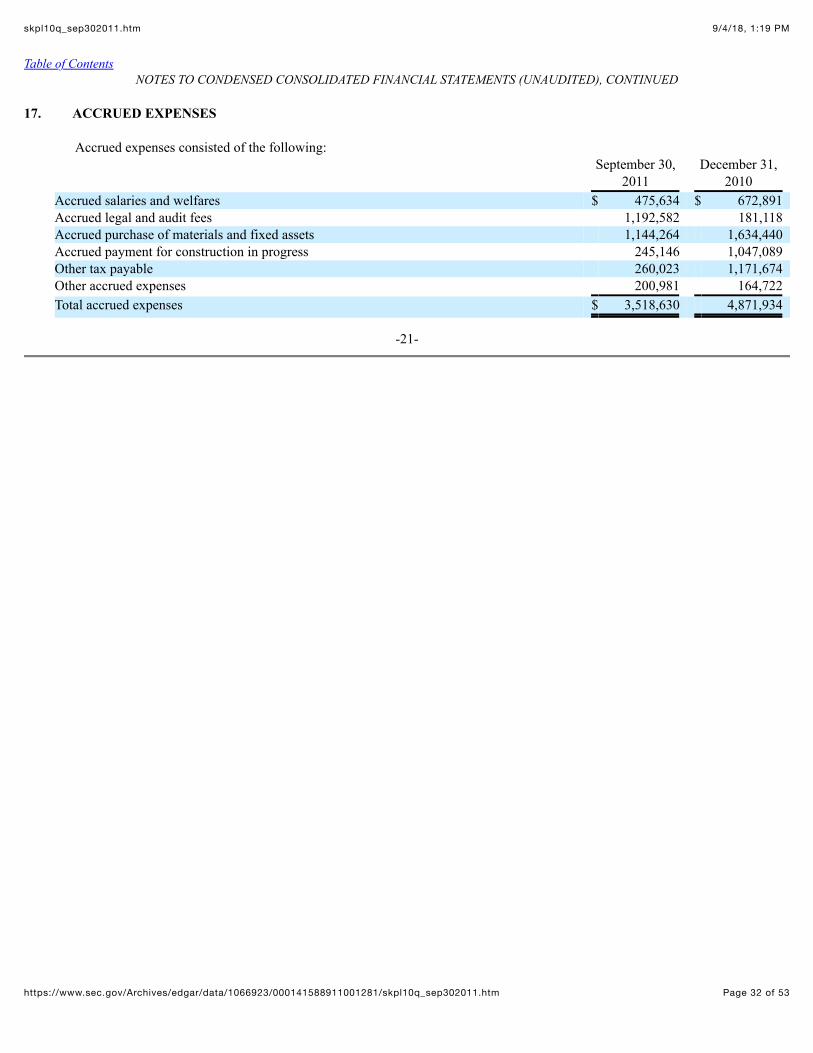
17. ACCRUED EXPENSES
Accrued expenses consisted of the following:
September 30,
2011 December 31,
2010 Accrued salaries and welfares $ 475,634 $ 672,891 Accrued legal and audit fees 1,192,582 181,118 Accrued purchase of materials and fixed assets 1,144,264 1,634,440 Accrued payment for construction in progress 245,146 1,047,089 Other tax payable 260,023 1,171,674 Other accrued expenses 200,981 164,722 Total accrued expenses $ 3,518,630 4,871,934
-21-

9/4/18, 1:19 PMskpl10q_sep302011.htm
Page 33 of 53https://www.sec.gov/Archives/edgar/data/1066923/000141588911001281/skpl10q_sep302011.htm
Table of Contents
ITEM 2. MANAGEMENT’S DISCUSSION AND ANALYSIS OF FINANCIAL CONDITION AND RESULTS OFOPERATIONS
This section and other parts of this Form 10-Q contain forward-looking statements that involve risks and uncertainties. Forward-lookingstatements can be identified by words such as “anticipates,” “expects,” “believes,” “plans,” “predicts,” and similar terms. Forward-looking statements are not guarantees of future performance and the Company’s actual results could differ materially from the resultsdescribed in or implied by these forward-looking statements as a result of various factors, including those discussed in this report andunder the heading “Risk Factors” in our most recent Annual Report on Form 10-K. The following discussion should be read inconjunction with the Company’s Annual Report on Form 10-K for the year ended December 31, 2010 (the “2010 Form 10-K”) filed withthe U.S. Securities and Exchange Commission (“SEC”) and the condensed consolidated financial statements and notes thereto includedelsewhere in this Form 10-Q.The Company assumes no obligation to revise or update any forward-looking statements for any reason,except as required by law.
Overview
We are engaged in the production and sales of fruit juice concentrates (including fruit purees, concentrated fruit purees and concentratedfruit juices), fruit beverages (including fruit juice beverages and fruit cider beverages), and other fruit related products (including organicand non-organic fresh fruits, fruit seeds and fruit aroma) in and from the PRC. We believe that we are currently one of the few companiesable to produce specialty fruit juices on a large scale in the PRC and we believe we are a leading specialty fruit juice producer in the PRC.
Our fruit juice concentrates include apple, pear and kiwifruit concentrates. We sell our fruit juice concentrates to domestic customers andexport directly or via distributors. We estimate 38% and 23% of our sales in the three months ended September 30, 2011 and 2010,respectively, were generated from markets other than the PRC, and 29% and 26% of our sales in the nine months ended September 30,2011 and 2010, respectively, were generated from markets other than the PRC. Since we sell to distributors in the PRC and therefore arenot certain exactly where our exported fruit juice concentrated products are ultimately sold, we estimate that our main export markets arethe United States, the European Union, South Korea, Russia and the Middle East. We sell our Hedetang and Qian Mei Duo branded fruitbeverages domestically primarily to supermarkets in the PRC. We sell our other fruit related products to domestic customers. Sales of ourfruit concentrates, fruit beverages and other fruit related products represented approximately 57%, 36.5%, and 6.5% of our revenue,respectively, for the nine months ended September 30, 2011, compared to approximately 52%, 31% and 17%, respectively, for the sameperiod of 2010. Specialty fruit juices, or small breed fruit juice, are juices squeezed from fruits that are grown in relatively small quantities such askiwifruit juice, mulberry juice, and pomegranate juice, and juices with small output due to various factors including technical challengesin the production process even though the fruits from which the juices are made are grown in large quantities and commonly available,such as pear. Our specialty juice beverage offering includes kiwifruit juice, pear juice and mulberry juice.
We operate four manufacturing factories in the PRC. Two of these factories are located in Shaanxi Province and the other two are locatedin Liaoning Province. All concentrated juice products are manufactured using the same type of production line with slight variations inprocessing methods. To take advantage of economies of scale and to enhance our production efficiency, each of our manufacturingfacilities focuses on producing single fruit-based concentrates and beverages according to the proximity of such manufacturing facility tothe supply center of that fruit. Our kiwifruit processing facility is located in Zhouzhi County, Shaanxi Province, which has the largestplanting area of kiwifruit in China. Our pear processing facility is also located in Shaanxi Province, which is the main pear producingprovince in China. We have two apple processing facilities in Liaoning Province, a region that abounds with high acidity apples. Webelieve that these regions will provide adequate supply of raw materials for our production needs in the foreseeable future.
-22-

9/4/18, 1:19 PMskpl10q_sep302011.htm
Page 34 of 53https://www.sec.gov/Archives/edgar/data/1066923/000141588911001281/skpl10q_sep302011.htm
Table of Contents Our business is highly seasonal and can be greatly affected by weather because of the seasonal nature in the growing and harvesting offruits and vegetables. Our core products are apple, pear and kiwifruit juice concentrates, which are produced from July or August to Aprilof the following year. The squeezing season for (i) apples is from August to January or February; (ii) pears is from July or August untilApril of the next year; and (iii) kiwifruit is from September through December. Typically, a substantial portion of our revenues is earnedduring our first and fourth quarters. To minimize the seasonality of our business, we make continued efforts to identify new products withharvesting seasons complementary to our current product mix, such as pomegranate and persimmon. Our goal is to lengthen oursqueezing season, thus increasing our annual production of fruit juice concentrates and fruit beverages. Unlike fruit juice concentrates,which can only be produced during the squeezing season, fruit beverages are made out of fruit juice concentrates and can be produced andsold in all seasons.
In January 2010, we engaged a beverage distributor in Beijing to focus on the sales and marketing of our fruit juice beverages to food andbeverage wholesalers and retailers in the Beijing area. In the first quarter of 2011, we renewed our contract with this distributor and wealso increased the number of distributors in the Beijing area. We currently sell our fruit beverages through distributors to over 100 retailstores mainly in Shaanxi Province and the Beijing area. Our retail stores include Wal-Mart stores in Xi’an and Beijing, and Renrenlesupermarkets, Lotus supermarkets and Vanguard supermarkets in Xi’an. We plan to expand our domestic geographic coverage for ourbeverage sales in the near future. In the second quarter of 2011, we reduced the retail price of most of our beverages by an average of 56%to increase our competitiveness in this industry.
Fresh fruits are the primary raw materials needed for the production of our products. We purchase raw materials from local markets andfruit growers that deliver directly to our plants. Our raw material supply chain is highly fragmented and raw fruit prices are highly volatilein China. In addition to raw materials, we purchase various ingredients and packaging materials such as sweeteners, glass and plasticbottles, cans and packing barrels. We generally purchase our materials or supplies from multiple suppliers. We are not dependent on anyone supplier or group of suppliers.
We believe that continuous investment in research and development is a key component to being a leader in fruit juice concentrate andfruit beverage quality. As of September 30, 2011, we had an internal research and development team of approximately 43 employees, andwe retain external experts and research institutions for additional consultation when necessary. In the first quarter of 2011, we entered intothree contracts with an outside research institute to research and develop new products. The term of each of these contracts is fromJanuary 2011 to January 2013 with an aggregate monthly payment of RMB 299,990, or $48,471 based on the exchange rate as ofSeptember 30, 2011. Our research and development effort emphasizes the design and development of our processing technology with thegoal of decreasing processing costs, optimizing our production capabilities and maintaining product quality. We intend to continue toinvest in research and development to respond to and anticipate customer needs. In the nine months ended September 30, 2011 and 2010,our research and development expenses were $420,121 and $816,786, respectively.
On August 30, 2010, we closed the public offering of 5,181,285 shares of our Common Stock at a price of $5.00 per share forapproximately $25.9 million. We received an aggregate of approximately $24 million as net proceeds after deducting underwritingdiscounts and commissions and offering expenses. We plan to use the proceeds from this offering primarily in the improvement anddevelopment of our Huludao Wonder factory. Summary of the Operating Results for the Three Months Ended September 30, 2011
· Revenue decreased to $17.4 million for the third quarter of fiscal 2011, a decrease of $0.75 million, or 4.1%, compared to $18.2million for the third quarter of 2010.
· Gross profit margin decreased by 23.2% to 27.8% for the third quarter of fiscal 2011 from 36.2% for the same quarter of fiscal2010.
· Operating expenses as a percentage of revenue increased by 85.5% to 11.5% for the third quarter of 2011 from 6.2% for thesame quarter of 2010, primarily due to the decrease in revenue and increase in general and administrative expenses and sellingexpenses.
· Income from operations decreased by $2.7 million, or 49.1%, to $2.8 million for the third quarter of fiscal 2011 from $5.5million for the same quarter of fiscal 2010 due to the decrease in gross margin and increase operating expenses.
· Net income attributable to the Company decreased $1.8 million, or 50.0%, to $1.8 million for the third quarter of fiscal 2011 as

9/4/18, 1:19 PMskpl10q_sep302011.htm
Page 35 of 53https://www.sec.gov/Archives/edgar/data/1066923/000141588911001281/skpl10q_sep302011.htm
compared with $3.6 million for the same quarter of fiscal 2010.
-23-

9/4/18, 1:19 PMskpl10q_sep302011.htm
Page 36 of 53https://www.sec.gov/Archives/edgar/data/1066923/000141588911001281/skpl10q_sep302011.htm
Table of Contents Summary of the Operating Results for the Nine Months Ended September 30, 2011 · Revenue decreased to $49.1 million for the nine months ended September 30, 2011, a decrease of $0.2 million, or 0.4%, compared
to $49.3 million for the same period of 2010.· Gross profit margin decreased by 12.0% to 35.9% for the nine months ended September 30, 2011 from 40.8% for the same period
2010.· Operating expenses as a percentage of revenue increased by 35.9% to 10.6% for the nine months ended September 30, 2011 from
7.8% for the same period of 2010, primarily due to the decrease in revenue and increase in general and administrative expensesand selling expenses.
· Income from operations decreased by $3.8 million, or 23.5%, to $12.4 million for the nine months ended September 30, 2011 from$16.2 million for the same period 2010 due to the decrease in gross margin and increase operating expenses.·
· Net income attributable to the Company decreased $1.4 million, or 14.0%, to $8.6 million for the nine months ended September30, 2011 as compared with $10.0 million for the same period of 2010.
The summaries above are intended to identify some of our more significant events and transactions during the three and nine monthsended September 30, 2011. These summaries are not intended to be a full discussion of our operating results for the three and nine monthsended September 30, 2011. These summaries should be read in conjunction with the following discussion and with our unauditedconsolidated financial statements and notes thereto accompanying this Quarterly Report. Recent Development Appointment of CFO On September 21, 2011, our Board of Directors appointed Cunxia Xie as its Chief Financial Officer. Ms. Xie has extensive financialaccounting, corporate management and internal control experience in China. Prior to her appointment, Ms. Xie served as the ChiefFinancial Officer of SkyPeople Juice Group Co., Ltd., a 99.78% indirectly-owned subsidiary of the Company, since 2009. From 2003 to2009, Ms. Xie served as Financial Accounting Manager at China Haisheng Juice Holding Corporation, a company listed on the HongKong Stock Exchange. Appointment of New Directors and Establishment of an Evaluation Committee of the Board On November 7, 2011, our Board of Directors elected Messrs. Lu Baosheng and Wang Tao as new members of the Board, effectiveimmediately. On the same date, the existing independent directors of the Board, appointed Messrs. Lu and Wang to serve as members ofan evaluation committee of the Board. The Board previously approved the establishment of an evaluation committee of the Board andcharged the independent directors to appoint members of the evaluation committee in response to certain demand letters that the Companyreceived from a shareholder of the Company. The Company reported the receipt of the shareholder demand letter in the Company'sQuarterly Report on Form 10-Q for the Three Month ended June 30, 2011. For their respective services as a director of the Board and a member of the evaluation committee, each of the newly appointed directorsshall be compensated at RMB50, 000 per year in cash, which cash compensation shall be in addition to any other benefits that a directorof the Board may generally be qualified for and/or entitled to currently or in the future. Mr. Lu is a licensed CPA in China with 20 years of experience. He has assisted approximately 20 companies in going public in China andparticipated in financial and project auditing for large state-owned enterprises. Mr. Wang has been a senior legal counselat Shaanxi Silkroad Law Firm since October 2011. He is a licensed attorney in China and has litigated a large number of cases in China.
-24-

9/4/18, 1:19 PMskpl10q_sep302011.htm
Page 37 of 53https://www.sec.gov/Archives/edgar/data/1066923/000141588911001281/skpl10q_sep302011.htm
Table of Contents
Results of Operations and Business Outlook
Revenues
The following table presents our consolidated revenues for our main products for the three and nine months ended September 30, 2011and 2010, respectively (in thousands): Three Months Ended September 30, Nine Months Ended September 30, 2011 2010 % Change 2011 2010 % Change Concentrated apple juiceand apple aroma $ 8,782 $ 2,166 305.4% $ 14,842 $ 7,785 90.6%Concentrated kiwi juiceand kiwi puree 499 2,302 -78.3% 5,195 8,891 -41.6%Concentrated pear juice 2,036 3,325 -38.8% 7,949 9,150 -13.1%Fruit juice beverages 5,188 7,380 -29.7% 17,898 15,073 18.7%Fresh fruits andvegetables 897 3,005 -70.1% 2,354 6,573 -64.2%Other 35 11 218.2% 825 1,834 -55.0%Consolidated $ 17,437 $ 18,189 -4.1% $ 49,063 $ 49,306 -0.5%
Revenue for the three months ended September 30, 2011 was $17.4 million, a decrease of $0.75 million, or 4.1%, when compared to$18.2 million for the same period of the prior year. This decrease was primarily due to a decrease in sales of concentrated kiwifruit juice,pear juice and kiwifruit puree, fresh fruit and fruit juice beverages, offset by the increase in sales of concentrated apple juice and applearoma.
Sales from apple related products were $8.8 million, for the three months ended September 30, 2011, an increase of $6.6 million, or305.4%, compared to $2.2 million for the same period of 2010, primarily due to an increase in unit price to approximately $2000 per tonin the third quarter of 2011, from the approximately $900 per ton in the same period of the prior year. The increased output for the applerelated products of the Yingkou factory, which commenced operation at the end of September 2010, also contributed to the sales increase.
Sales from concentrated kiwifruit juice and kiwifruit puree were $0.5 million for the third quarter of 2011, a decrease of $1.8 million, or78.3%, compared to $2.3 million in the same quarter of 2010, due to decreased in quantity sold, because of lack of supply of kiwifruit as aresult of weather change. The harvest season of kiwifruit was delayed this year from September to mid- October which in turn delayedour squeezing season for kiwifruits.
-25-

9/4/18, 1:19 PMskpl10q_sep302011.htm
Page 38 of 53https://www.sec.gov/Archives/edgar/data/1066923/000141588911001281/skpl10q_sep302011.htm
Table of Contents
Sales of concentrated pear juice were $2 million in the third quarter of 2011, a decrease of $1.3 million, or 38.8%, compared to $3.3million in the same quarter of 2010, primarily due to a decrease in the quantity sold. Additionally, the construction of our new pear juiceproduction line, which is housed in our existing production area and requires the rearrangement and disassembling of some currentproduction facility for purposes of space sharing, interfered with our production in the third quarter of 2011. The heavy rain this autumnalso prolonged the construction of the new pear juice production line, which further affected current production.
Sales from our fruit juice beverages were $5.2 million for the third quarter of 2011, a decrease of $2.2 million, or 29.7%, compared to$7.4 million for the same period of 2010 due to the downward pricing adjustment to our beverage products in the third quarter of 2011.We adjusted the beverage prices downward as a strategy to expand our market share.
Sales from our fresh fruits and vegetables were $0.9 million for the third quarter of 2011, a decrease of $2.1 million, or 70.1%, comparedto $3 million for the same period of 2010. The decrease was caused by lower quantity sold as a result of the higher market price of freshfruits as compared to the same period of the prior year. Additionally, we reduced the amount of fresh fruits purchased from the market inan effort to maintain the quality of our product during the rainy weather in 2011. The incremental revenue from our price markup toreflect the higher-priced supply did not completely offset the lower sales quantity. We only sold fresh kiwifruit juice in third quarter of2011, while in the same period of the prior year we sold fresh apple juice and fresh pear juice and fresh kiwifruit juice.
Sales from our other products were $35,000 for the third quarter of 2011 an increase of $22,000, or 218.2%, compared to $11,000 for thesame period of 2010 .The increase was mainly driven by the sales of fructose, the production line of which began operating in November2010.
Revenue for the nine months ended September 30, 2011 was $49 million, a decrease of $0.3 million, or 0.5%, compared to $49.3 millionfor the same period of the prior year. This decrease was primarily due to the reasons described above.
Sales from apple related products increased $7 million, or 90.6%, to $14.8 million for the nine months ended September 30, 2011,compared to $7.8 million for the same period of 2010. The increase was attributable to the reasons described above.
Sales of concentrated pear juice were $7.9 million for the nine months ended September 30, 2011, a decrease of $1.2 million, or 13.1%,from $9.1 million in the same period of 2010. The decrease was due to the reasons described above.
Sales of concentrated kiwi juice and kiwi puree were $5.2 million for the nine months ended September 30, 2011, a decrease of $3.7million, or 41.6%, from $8.9 million in the same period of 2010. In addition to the third quarter of this year has described above, aswell as the first and second quarters of 2011, shortage of raw fruit than in previous years, so the first and second quarters of sales waslower than the same period of 2010.
Revenue from our fresh fruits and vegetables were $2.4 million for the nine months ended September 30, 2011, a decrease of $4.2million, or 64.2%, compared to $6.6 million for the same period of 2010. The decrease was primarily driven by the decrease in volume offresh fruits due to a higher market price of fresh fruits than the prior year period. We reduced our purchased amount of fresh fruits fromthe market to minimize the risk of quality issues due to the rainy weather in the nine month ended September 30, 2011.
-26-
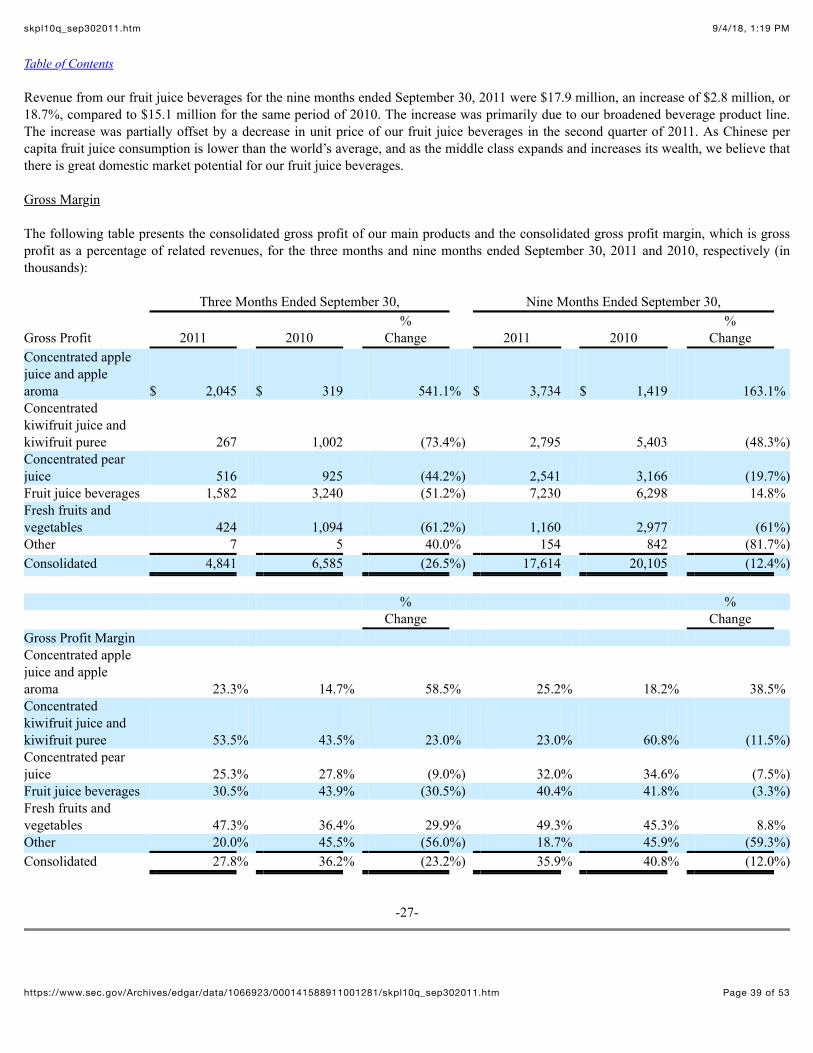
9/4/18, 1:19 PMskpl10q_sep302011.htm
Page 39 of 53https://www.sec.gov/Archives/edgar/data/1066923/000141588911001281/skpl10q_sep302011.htm
Table of Contents
Revenue from our fruit juice beverages for the nine months ended September 30, 2011 were $17.9 million, an increase of $2.8 million, or18.7%, compared to $15.1 million for the same period of 2010. The increase was primarily due to our broadened beverage product line.The increase was partially offset by a decrease in unit price of our fruit juice beverages in the second quarter of 2011. As Chinese percapita fruit juice consumption is lower than the world’s average, and as the middle class expands and increases its wealth, we believe thatthere is great domestic market potential for our fruit juice beverages.
Gross Margin
The following table presents the consolidated gross profit of our main products and the consolidated gross profit margin, which is grossprofit as a percentage of related revenues, for the three months and nine months ended September 30, 2011 and 2010, respectively (inthousands): Three Months Ended September 30, Nine Months Ended September 30, % % Gross Profit 2011 2010 Change 2011 2010 Change Concentrated applejuice and applearoma $ 2,045 $ 319 541.1% $ 3,734 $ 1,419 163.1%Concentratedkiwifruit juice andkiwifruit puree 267 1,002 (73.4%) 2,795 5,403 (48.3%)Concentrated pearjuice 516 925 (44.2%) 2,541 3,166 (19.7%)Fruit juice beverages 1,582 3,240 (51.2%) 7,230 6,298 14.8%Fresh fruits andvegetables 424 1,094 (61.2%) 1,160 2,977 (61%)Other 7 5 40.0% 154 842 (81.7%)Consolidated 4,841 6,585 (26.5%) 17,614 20,105 (12.4%) % % Change Change Gross Profit Margin Concentrated applejuice and applearoma 23.3% 14.7% 58.5% 25.2% 18.2% 38.5%Concentratedkiwifruit juice andkiwifruit puree 53.5% 43.5% 23.0% 23.0% 60.8% (11.5%)Concentrated pearjuice 25.3% 27.8% (9.0%) 32.0% 34.6% (7.5%)Fruit juice beverages 30.5% 43.9% (30.5%) 40.4% 41.8% (3.3%)Fresh fruits andvegetables 47.3% 36.4% 29.9% 49.3% 45.3% 8.8%Other 20.0% 45.5% (56.0%) 18.7% 45.9% (59.3%)Consolidated 27.8% 36.2% (23.2%) 35.9% 40.8% (12.0%)
-27-

9/4/18, 1:19 PMskpl10q_sep302011.htm
Page 40 of 53https://www.sec.gov/Archives/edgar/data/1066923/000141588911001281/skpl10q_sep302011.htm
Table of Contents The consolidated gross profit for the three months ended September 30, 2011 was $4.8 million, a decrease of $1.8 million, or 26.5%,compared to $6.6 million for the same period of 2010, The decrease was primarily attributable to several reasons, including, (i) thegeneral increase of prices for raw fruits in the market, which reduces the demand level of our products, (ii) the effect of our downwardpricing adjustment for our beverage products in May 2011, and (iii) the decreased sales of concentrated kiwifruit juice, kiwifruit pureeand fresh fruits and vegetables, which historically were significant contributors to our gross profit, and the decreased sales of concentratedpear juice. The decrease in consolidated gross profit for the three months ended September 30, 2011 was partially offset by a significantincrease in gross profit generated from concentrated apple juice and apple aroma as compared to the same period of 2010. Gross profit of concentrated apple juice and apple aroma increased by 541.1% for the three months ended September 30, 2011 to $2.1million as compared to $0.3 million for the same period of 2010. The increase was primarily attributable to an increase in a 122.2%increase in the unit price of concentrated apple juice from $900/ton to $2000/ton.
Gross profit of concentrated kiwifruit juice and kiwifruit puree decreased by 73.4% for the three months ended September 30, 2011 to$0.3 million as compared to $1.0 million for the same period of 2010. The decrease was caused by lower sales quantity in the thirdquarter of 2011 as compared to the same period of 2010 because of lack of supply of kiwifruit as a result of weather change. The harvestseason of kiwifruit was delayed this year from September to mid- October which in turn delayed our squeezing season for kiwifruits.
Gross profit of concentrated pear juice decreased by 44.2% for the three months ended September 30, 2011 to $0.5 million as compared to$0.9 million for the same period of 2010. The decrease was caused by the combined effect of lower sales volume and higher raw materialprice in fresh pear. As previously discussed, the construction of the new pear production line negatively affected our current production ofpear juice.
Gross profit of fruit juice beverages decreased by 51.2% for the three months ended September 30, 2011 to $1.6 million as compared to$3.2 million for the same period of 2010. The decrease was primarily caused by the downward adjustment to the pricing of our beverageproducts to improve our competitiveness and to gain market share.
Gross profit of fresh fruits and vegetables decreased by 61.2% for the three months ended September 30, 2011 to $0.4 million ascompared to $1.1 million for the same period of 2010. The decrease was primarily attributable to a general increase of raw fruit price inthe market, which negatively affected the demand level and was only partially offset by our price markup.
Consolidated gross profit margin for the three months ended September 30, 2011 was 27.8%, a decrease of 23.2%, compared to 36.2% forthe same period of 2010. The decrease was primarily due to a decrease in gross profit and gross profit margin of fruit juice beverages andconcentrated pear juice, as well as decreased gross profit margin of our other products, which was not completely offset by an increase ingross profit margin of concentrated apple juice and apple aroma.
Gross profit margin of concentrated apple juice and apple aroma increased by 58.5% to 23.3% for the three months ended September 30,2011, as compared to 14.7% for the same period of 2010, primarily due to an increase in the unit price of concentrated apple juice andapple aroma from $900/ton to $2000 /ton in the market, which was partially offset by an increase in the price of raw fruit in the thirdquarter of 2011 compared with the same quarter of last year.
-28-

9/4/18, 1:19 PMskpl10q_sep302011.htm
Page 41 of 53https://www.sec.gov/Archives/edgar/data/1066923/000141588911001281/skpl10q_sep302011.htm
Table of Contents Gross profit margin of concentrated kiwifruit juice and kiwifruit puree was 53.5% for the three months ended September 30, 2011, anincrease of 23.0%, compared to 43.5% for the same quarter of last year, due to an increase in the selling price of concentrated kiwifruitjuice and kiwifruit puree which market trend led to this result in the third quarter of 2011 compared the same period of 2010.
Gross profit margin of concentrated pear juice was 25.3% for the three months ended September 30, 2011, representing a decrease of9.0% as compared to 27.8% for the same period of 2010. The gross profit margin decrease was primarily attributable to an increase in theprice of raw fruit, and partially offset by an increase in the selling price of concentrated pear juice in the third quarter of 2011.
Gross profit margin of our fruit juice beverages was 30.5% for the three months ended September 30, 2011, a decrease of 30.5% from43.9% for the same period of 2010. The decrease in gross margin of our beverages was mainly due to a decrease in the unit price of ourfruit juice beverages to improve our competitiveness in the market and to increase our market share.
Gross profit margin of fresh fruits and vegetables was 47.3% for the third quarter of 2011, an increase by 29.9%, from 36.4% of the sameperiod of 2010. In the third quarter of 2011, we did not sell fresh apples and pears as we did in the third quarter of 2010. Instead, our salesof fresh fruits in the third quarter of 2011 only consisted of sales of fresh kiwifruit, which generally has a higher gross profit margin thanthose of apples and pears.
Gross profit margin for other products in the third quarter of 2011 was 20.0% a decrease 56.0% from the 45.4% of the same period of2010. The higher gross margin of other products in the third quarter of 2010 was largely attributable to the high gross margin ofturnjujube juice. We did not produce any turnjujube juice in the third quarter of 2011 which caused our gross margin for other products todrop.
Consolidated gross margin was 35.9%, a decreased by 12.0% for the nine months ended September 30, 2011, from 40.8%, for the sameperiod of fiscal 2010. Gross margin in the nine months ended September 30, 2011 was $17.6 million, a decrease of $2.5 million, or12.4%, compared to $20.1 million for the same period of fiscal 2010. The reasons for the decrease are described above.
Gross profit margin of concentrated apple juice and apple aroma was 25.2% for the nine months ended September 30, 2011, an increasedby 38.5% as compared to 18.2% for the same period of 2010, The increase was primarily due to an increase in the unit price ofconcentrated apple juice and apple aroma from $900/ ton to $2000/ ton in the market, and partially offset by an increase in the price ofraw fruit. Gross profit margin of concentrated kiwifruit juice and kiwifruit puree was 53.8% for the nine months ended September 30, 2011, adecrease by 11.5% as compared to 60.8% for the same period of 2010. The decrease was primarily due to a price increase for rawkiwifruit during the first and second quarters of 2011 compared to the same periods of 2010.
-29-
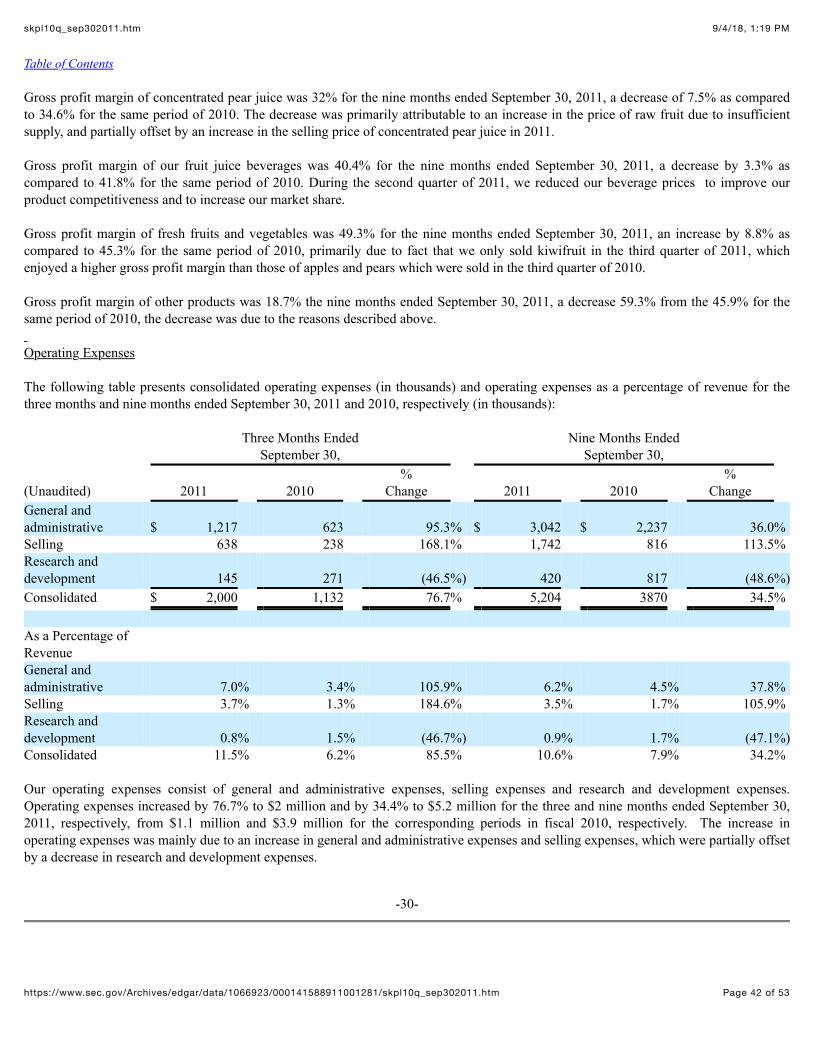
9/4/18, 1:19 PMskpl10q_sep302011.htm
Page 42 of 53https://www.sec.gov/Archives/edgar/data/1066923/000141588911001281/skpl10q_sep302011.htm
Table of Contents
Gross profit margin of concentrated pear juice was 32% for the nine months ended September 30, 2011, a decrease of 7.5% as comparedto 34.6% for the same period of 2010. The decrease was primarily attributable to an increase in the price of raw fruit due to insufficientsupply, and partially offset by an increase in the selling price of concentrated pear juice in 2011.
Gross profit margin of our fruit juice beverages was 40.4% for the nine months ended September 30, 2011, a decrease by 3.3% ascompared to 41.8% for the same period of 2010. During the second quarter of 2011, we reduced our beverage prices to improve ourproduct competitiveness and to increase our market share.
Gross profit margin of fresh fruits and vegetables was 49.3% for the nine months ended September 30, 2011, an increase by 8.8% ascompared to 45.3% for the same period of 2010, primarily due to fact that we only sold kiwifruit in the third quarter of 2011, whichenjoyed a higher gross profit margin than those of apples and pears which were sold in the third quarter of 2010.
Gross profit margin of other products was 18.7% the nine months ended September 30, 2011, a decrease 59.3% from the 45.9% for thesame period of 2010, the decrease was due to the reasons described above. Operating Expenses
The following table presents consolidated operating expenses (in thousands) and operating expenses as a percentage of revenue for thethree months and nine months ended September 30, 2011 and 2010, respectively (in thousands):
Three Months Ended
September 30, Nine Months Ended
September 30, % % (Unaudited) 2011 2010 Change 2011 2010 Change General andadministrative $ 1,217 623 95.3% $ 3,042 $ 2,237 36.0%Selling 638 238 168.1% 1,742 816 113.5%Research anddevelopment 145 271 (46.5%) 420 817 (48.6%)Consolidated $ 2,000 1,132 76.7% 5,204 3870 34.5% As a Percentage ofRevenue General andadministrative 7.0% 3.4% 105.9% 6.2% 4.5% 37.8%Selling 3.7% 1.3% 184.6% 3.5% 1.7% 105.9%Research anddevelopment 0.8% 1.5% (46.7%) 0.9% 1.7% (47.1%)Consolidated 11.5% 6.2% 85.5% 10.6% 7.9% 34.2% Our operating expenses consist of general and administrative expenses, selling expenses and research and development expenses.Operating expenses increased by 76.7% to $2 million and by 34.4% to $5.2 million for the three and nine months ended September 30,2011, respectively, from $1.1 million and $3.9 million for the corresponding periods in fiscal 2010, respectively. The increase inoperating expenses was mainly due to an increase in general and administrative expenses and selling expenses, which were partially offsetby a decrease in research and development expenses.
-30-

9/4/18, 1:19 PMskpl10q_sep302011.htm
Page 43 of 53https://www.sec.gov/Archives/edgar/data/1066923/000141588911001281/skpl10q_sep302011.htm
Table of Contents General and administrative expenses increased by $0.6 million, or 95.3%, to $1.2 million and by $0.8 million, or 36%, to $3 million forthe three and nine months ended September 30, 2011, respectively, from $0.6 million and $2.2 million for the same periods of fiscal 2010,respectively. The increase in general and administrative expenses was mainly due to an increase in legal fees related to our currentpending litigations, payroll and our directors and officers’ insurance premium.
Selling expenses increased by $0.4 million, or 168.1%, to $0.6 million and by $1 million, or 113.5%, to $1.7 million for the three and ninemonths ended September 30, 2011, respectively, from $0.2 million and $0.8 million for the same periods of 2010, respectively. This wasmainly due to an increase in payroll and related expenses as the result of a larger headcount.
Research and development expenses decreased by $0.1 million, or 46.5%, to $0.1 million and by $0.4 million, or 48.6%, to $0.4 millionfor the three months and nine months ended September 30, 2011, respectively, from $0.2 million and $0.8 million for the same periods offiscal 2010. We entered into two contracts with an outside research institute to research and develop new products in fiscal year 2008.These two contracts were from August 2008 to December 2010, with a monthly payment of RMB 600,000, or $92,829 based on theexchange rate as of September 30, 2011. In the first quarter of 2011, we entered into three contracts with outside research institutes toresearch and develop new products. The terms of these contracts were from January 2011 to January 2013 with a monthly payment ofRMB 299,990, or $48,471 based on the exchange rate as of September 30, 2011. The decrease in our research and development expenseswas due to the fact that we are running less research and development projects in the relevant periods of 2011 as compared to the sameperiods of the prior year. Income from Operations
Income from operations decreased to $2.8 million, a decrease of $2.7 million, or 49.0%, for the three month ended September 30, 2011from $5.5 million for the same period of 2010. As a percentage of revenue, income from operations was approximately 16.3% for thethree months ended September 30, 2011 compared to 30% for the same period of 2010. The decrease in income from operations wasmainly due to the decrease in gross margin.
In the nine months ended September 30, 2011, income from operations decreased by $3.8 million, or 23.5%, to $12.4 million from $16.2million for the corresponding period in 2010. As a percentage of revenue, income from operations was approximately 25.3% for the ninemonths ended September 30, 2011, a decrease of 23.1% as compared to 32.9% for the corresponding period in fiscal 2010. The decreasein the percentage of net sales was due to a decrease in gross margin and an increase in operating expenses, as previously discussed.
Other Income (Expense), Net
Other expense, net was $176 thousands for the three months ended September 30, 2011, an increase of $68 thousands as compared toother expense, net of $108 thousands for the same period of 2010, primarily due to a decrease in subsidy income. Other income, net was $0.2 million for the nine months ended September 30, 2011, an increase of $0.6 million as compared to otherexpense, net of $0.4 million in the same period of 2010, primarily due to a decrease of $2.1 million in fair value of warrant liabilities,which was partially offset by a decrease in subsidy income of $1.7 million. In the nine months ended September 30, 2011, we received anaggregate of of $0.6 million in subsidies, which were consisted of VAT rebates on the export to foreign countries in the nine months endedSeptember 30, 2011.
-31-

9/4/18, 1:19 PMskpl10q_sep302011.htm
Page 44 of 53https://www.sec.gov/Archives/edgar/data/1066923/000141588911001281/skpl10q_sep302011.htm
Table of Contents Income Tax
Our provision for income taxes was $0.7 million and $3.4 million for the three and nine months ended September 30, 2011, respectively, adecrease of $0.7 million, or 50.0%, and $1.4 million, or 29.1%, from $1.4 million and $4.8 million for the three and nine months endedSeptember 30, 2010, respectively. The decrease in tax provision was due to a decrease in income before taxes. Our effective tax rate was27% and 27% for the three and nine months ended September 30, 2011, respectively. Our effective tax rate was 26% and 30% (excludingthe change in fair value of warrant liabilities) for the three and nine months ended September 30, 2010, respectively.
Noncontrolling Interests As of September 30, 2011, SkyPeople (China) held a 91.15% interest in Shaanxi Qiyiwangguo and Pacific held a 99.78% interest inSkyPeople (China). Net income attributable to noncontrolling interests, which is deducted from our net income, was $0.1 million and $0.6million for the three and nine months ended September 30, 2011, respectively, compared to $0.4 million and $1 million for the sameperiod of 2010, respectively. The decrease in the net income attributable to noncontrolling interests was mainly due to the decrease in thenet income generated by SkyPeople (China). Net Income Net income attributable to the Company was $1.8 million and $8.6 million for the three and nine months ended September 30, 2011,respectively, a decrease of $1.8 million and a decrease of $1.4 million, respectively, from $3.6 million and $10 million for the same periodof 2010, respectively, due to the factors described above. Liquidity and Capital Resources As of September 30, 2011, we had cash, cash equivalents and restricted cash of $77.6 million, an increase of $27.7 million, or 55.5%,from $49.9 million as of December 31, 2010, primarily due to a cash inflow of $28.6 million from operating cash flow. We believe thatprojected cash flows from operations, anticipated cash receipts, cash on hand, and trade credit will provide the necessary capital to meetour projected operating cash requirements for at least the next 12 months, which does not take into account any potential expendituresrelated to the potential expansion of our current production capacity. Our restricted cash of $1,207,328 was used as collateral to obtain ashort-term note payable and to settle a short-term loan interest payable.
Our working capital has historically been generated from our operating cash flows, advances from our customers and loans from bankfacilities. Our working capital was $87.1 million as of September 30, 2011, an increase of $8.5 million, or 10.8%, to working capital of$28.6 million as of December 31, 2010, The increase was mainly due to increases in cash and accounts receivables and decreases ininventory, accrued expenses and income tax payable. The most significant sources of increase in working capital for the nine monthsended September 30, 2011 was the $28.8 million from operating activities due to a collection of account receivable. The most significantuse of working capital during the nine months ended September 30, 2011 was the prepayment for other assets, mainly for construction inprogress and equipment and machinery, of $6 million and payment of $3.8 million for income tax.
Our capital expenditures in cash were $6,079,686 and $8,961,505 for the nine months ended September 30, 2011 and 2010,respectively. Historically, we financed our capital expenditures and other operating expenses through operating cash flows and bankloans. As of September 30 2011, the balance of short-term bank loans totaled RMB 84.0 million, or $13.2 million (based on the exchangerate as of September 30, 2011), with interest rates ranging from 4.80% to 10.727% per annum. Of this amount, RMB 18.0 million, or $2.8million, was secured by the guarantee provided by Shaanxi Boai Pharmaceutical & Scientific Development Co. Ltd. and the rest of theloans were collateralized by land usage rights and buildings and were due for repayment from September 2010 to December 2011. Thebalance of the short-term notes payable as of September 30, 2011, was RMB 7.6 million, or $1.2 million (based on the exchange rate ofSeptember 30, 2011). These short-term notes payable are secured by the same amount of restricted cash. Our short-term bank loans aremainly used for working capital needs, especially during the squeezing season in the third quarter of 2011.
-32-

9/4/18, 1:19 PMskpl10q_sep302011.htm
Page 45 of 53https://www.sec.gov/Archives/edgar/data/1066923/000141588911001281/skpl10q_sep302011.htm
Table of Contents
On August 30, 2010, we closed the public offering of 5,181,285 shares of our Common Stock at a price of $5.00 per share forapproximately $25.9 million. We received an aggregate of approximately $24 million as net proceeds after deducting underwritingdiscounts and commissions and offering expenses. As of September 30, 2011, there were $17 million remaining from the net proceeds ofthe offering.
The following table presents the capital projects that we planned to use the proceeds from this offering first and primarily, and the currentestimate of the capital expenditure on each such project. We review these projects and capital expenditures on a quarterly basis based onthe market conditions and associated costs of these projects.
Facility Priority Projects
EstimatedCapital
Expenditure(in millions)
Huludao Wonder A refrigeration storage unit for the storage of concentrated fruit juices and fresh fruitsand vegetables and a concentrated fruit juice mixing center $ 4.6
Huludao Wonder A 30 ton/hour comprehensive fruits and vegetables processing line 3.0 Huludao Wonder A fruit juice beverage production line of 6000 bottles/hour 3.0 Huludao Wonder Environmental project (waste water treatment facility for concentrated
apple juice production line) 8.0 Total Capital Expenditure $ 18.6 Huludao Wonder Projects
We plan to start the construction of the refrigeration storage unit for the storage of concentrated fruit juices and fresh fruits and vegetablesand a concentrated fruit juice-mixing center in the fourth quarter of 2011. We have completed the design of the project and expect tocomplete the project in the third quarter of 2012. The estimated expenditure based on the current material and labor cost is $4.6 million. We started the construction of infrastructure for the fruit juice beverage production line on September 28, 2010. As of September 30,2011, we had spent approximately $1.6 million in purchasing machinery and equipment and the construction for a fruit juice beverageproduction line. We have completed the infrastructure construction and equipment installation and are in the process of testing theequipment. The delay in obtaining government approval for the construction resulted in a slight delay our projected timetable and wenow expect that the new beverage production line to commence operation in the forth quarter of 2011. The estimated expenditure for thisproject based on the current material and labor costs is $3.0 million.The environmental project mainly consists of a wastewater processing facility that is required in our production of fruit and vegetablejuice concentrates. The start of this project has been delayed due to the construction of the beverage production line. We now expect tostart this project in the fourth quarter of 2011 and complete the project in the second or third quarter of 2012. The estimated expenditurebased on the current material and labor costs is $8.0 million. On March 27, 2011, the National Development and Reform Commission and the relevant departments of the State Council of the PRCamended the Catalogue of Industry Structure Adjustment issued in 2005 and released the Catalogue of Industry Structure Adjustment for2011 (the “New Catalogue”), which was effective on June 1, 2011. In the New Catalogue, concentrated apple juice business is classifiedin the category of Restricted Industry, which means that the government may restrict the expansion of this industry by, among otherthings, putting limitations on the increase in production capacity, increasing the product quality standard, reducing government financialsupport. We expect the restrictions under the New Catalogue will reduce government financial support of concentrated apple juicebusinesses and have a negative impact on the future expansion and development of our concentrated apple juice segment. Considering thegovernment potential restriction on the approval of increase in the production capacity of concentrated apple juice, we decided to cancelour original plan for the construction of a 50 ton/hour concentrated apple juice line, which we previously estimated to use up to $10.7million of the proceeds generated from our public financing consummated in August 2010. We are currently considering other differentpotential projects for our Huludao Wonder factory. In addition, to minimize the potential negative impact of the new regulation, weplanned to change our existing 30 ton/hour concentrated apple juice line into a 30 ton/hour comprehensive fruits and vegetablesprocessing line by adding additional equipment and machinery. The 30 ton/hour comprehensive fruits and vegetables processing line is

9/4/18, 1:19 PMskpl10q_sep302011.htm
Page 46 of 53https://www.sec.gov/Archives/edgar/data/1066923/000141588911001281/skpl10q_sep302011.htm
expected to process a variety of fruits and vegetables (including apple, pear, and other fruits and vegetables) into juices. The estimatedinvestment for this project is $3.0 million. We believe that this project could provide us more flexibility. This project is expected to startin the first quarter of 2012 and be completed in the third quarter of 2012.
-33-

9/4/18, 1:19 PMskpl10q_sep302011.htm
Page 47 of 53https://www.sec.gov/Archives/edgar/data/1066923/000141588911001281/skpl10q_sep302011.htm
Table of Contents As of September 30, 2011 we had spent $1.6 million of the net proceeds from the offering on the construction work of HuludaoWonder. The payment was mainly for the deposits for the purchase of machinery and equipment and construction in progress. We havenot yet signed any contracts for the purchase of the machinery or the equipment for the refrigeration storage unit and the 30 ton/hourcomprehensive fruits and vegetables processing line. We have finished the design for the refrigeration storage unit and we expect to orderthis machinery and equipment in the fourth quarter of 2011.
Oiyiwangguo Projects
We previously identified several projects for our Qiyiwangguo factory, which we expect to finance using our operating cash flow. Theseprojects including a 24,000 PET bottle/hour fruit juice beverage aseptic cold-filling line, and a PET bottle blowing machine system.Based on the current market conditions and other potential opportunities, management has decided to delay these projects to a future datewhen appropriate.
Other Projects
We plan to add another 20 tons per hour concentrated pear juice line as part of our 2011 capital expenditure plan using the cash generatedfrom operating cash flows. We already ordered the machinery for this production line with a total contract value of $4.1 million and, as ofSeptember 30, 2011, we spent $5.37 million in making payments under these contracts. We expect to operate this line in the fourth quarterof 2011.
We do not have any off-balance sheet arrangements.
Seasonality
Our business is highly seasonal, reflecting the harvest season of our primary source fruits from July or August to April. Typically, asubstantial portion of our revenue is earned during our first and fourth quarters. We generally experience lower revenue during our secondand third quarters. Sales in the first and fourth quarters accounted for approximately 66% and 72% of our revenue in 2010 and 2009,respectively. Because of the seasonality of our business, results for any quarter are not necessarily indicative of the results that may beachieved for the full fiscal year. We believe that our seasonality will be smoother with the increase in revenue percentage from ourbeverages, which can be produced all year long.
Critical Accounting Policies
Our critical accounting policies are set out in Item 7, Management’s Discussion and Analysis of Financial Condition and Results ofOperations in the Company’s Annual Report on Form 10-K for the fiscal year ended December 31, 2010 that we filed with the Securitiesand Exchange Commission on April 1, 2011. During the three months ended September 30, 2011 there was no change to our criticalaccounting policies.
-34-

9/4/18, 1:19 PMskpl10q_sep302011.htm
Page 48 of 53https://www.sec.gov/Archives/edgar/data/1066923/000141588911001281/skpl10q_sep302011.htm
Table of Contents ITEM 3. QUANTITATIVE AND QUALITATIVE DISCLOSURES ABOUT MARKET RISK
Foreign Currency Exchange Rate Risk
The majority of our sales, cost of manufacturing and marketing are transacted in Chinese yuan. Consequently, our costs, revenue andoperating margins may be affected by fluctuations in exchange rates, primarily between the U.S. dollars and Chinese currencies. Proceedsfrom equity financings are one of our major sources of working capital, which is denominated in U.S. dollars. Our financial position andresults of operations are also affected by fluctuations in exchange rates between the functional currency (which is in U.S. dollars) andcurrencies used in our foreign operations. Foreign currency translation adjustments resulted in an increase of $4.1 million in the ninemonths ended September 30, 2011 and an increase of $3.3 million in fiscal 2010 to shareholders’ equity.
As currency exchange rates change, translation of the statements of Income of our businesses outside the U.S. into U.S. dollars affectsyear-over-year comparability. We generally have not hedged against these types of currency risks because cash flows from the PRCoperations have been reinvested locally.
Interest Rate Risk
At September 30, 2011, approximately $13.0 million of our outstanding borrowings were subject to changes in interest rates; however, wedo not use derivatives to manage this risk. The interest rate on our loans ranges from 4.80% to 10.727% per annum. Of this amount, RMB16.3 million, or $2.5 million, was secured for the office building of SkyPeople (China), the production line of the Jiangyang factory and apersonal guarantee provided by the Company’s CEO and chairman of the board of directors, Mr. Xue Yongke, and Mr. Xue Hongke,chairman of the board of directors and chief executive officer of SkyPeople (China); RMB 18 million, or $2.8 million, was secured by theguarantee provided by Shaanxi Boai Pharmaceutical & Scientific Development Co., Ltd. and a personal guarantee provided by Mr. XueHongke; RMB 16.4 million, or $2.5 million, was secured by land usage right of the Jiangyang factory and a personal guarantee providedby Mr. Xue Yongke and Mr. Xue Hongke, and the rest of the loans were collateralized by land usage rights, buildings and plant andmachinery of the Huludao Wonder factory. All loans will be due for repayment from December 2011 to June 2012. The balance of theshort-term notes payable as of September 30, 2011 were RMB 7.6 million, or $1,185,023 based on the exchange rate as of September 30,2011. This short-term notes payable are secured by the same amount of restricted cash.
Management believes that moderate changes in the prime rate would not materially affect our operating results or financial condition.
-35-
9/4/18, 1:19 PMskpl10q_sep302011.htm
Page 49 of 53https://www.sec.gov/Archives/edgar/data/1066923/000141588911001281/skpl10q_sep302011.htm
Table of Contents ITEM 4. CONTROLS AND PROCEDURES
Disclosure Controls and Procedures
An evaluation was carried out by the Company’s Chief Executive Officer and Chief Financial Officer of the effectiveness of theCompany’s disclosure controls and procedures (as defined in Rule 13a-15(e) or 15d-15(e) under the Securities Exchange Act of 1934, asamended) as of September 30, 2011, the end of the period covered by this Quarterly Report on Form 10-Q. Management recognizes thatany controls and procedures, no matter how well designed and operated, can provide only reasonable assurance of achieving theirobjectives and management necessarily applies its judgment in evaluating the cost-benefit relationship of possible controls andprocedures. Based upon that evaluation, the Chief Executive Officer and Chief Financial Officer concluded that as of September 30, 2011,and as of the date that the evaluation of the effectiveness of our disclosure controls and procedures were completed, our disclosurecontrols and procedures were effective in providing reasonable assurance of achieving their objectives for the nine months endedSeptember 30, 2011.
Changes in Internal Controls and Procedures
Our internal control system is designed to provide reasonable assurance regarding the reliability of financial reporting and the preparationof financial statements for external purposes in accordance with U.S. GAAP. There is no assurance that our disclosure controls or ourinternal controls over financial reporting can prevent all errors. An internal control system, no matter how well designed and operated, hasinherent limitations, including the possibility of human error. Because of the inherent limitations in a cost-effective control system,misstatements due to error may occur and not be detected. We monitor our disclosure controls and internal controls and makemodifications as necessary. Our intent in this regard is that our disclosure controls and our internal controls will improve as systemschange and conditions warrant. There has been no change to the Company’s internal control and procedures during the three monthsended September 30, 2011.
Our former Chief Financial Officer resigned on September 21, 2011, and was replaced by the Chief Financial Officer of our operatingsubsidiary, SkyPeople Juice Group Co., Ltd. In addition, we have engaged a US GAAP financial reporting consultant to assist our staff.The Company continues to adhere to our internal controls and procedures.
-36-

9/4/18, 1:19 PMskpl10q_sep302011.htm
Page 50 of 53https://www.sec.gov/Archives/edgar/data/1066923/000141588911001281/skpl10q_sep302011.htm
Table of Contents
PART II – OTHER INFORMATION
ITEM 1. LEGAL PROCEEDINGS On April 20, 2011, plaintiff Paul Kubala (on behalf of his minor child N.K.) filed a securities fraud class action lawsuit in the UnitedStates District Court, Southern District of New York against the Company, certain of its individual officers and/or directors, Yongke Xueand Xiaoqin Yan, and Rodman & Renshaw, LLC, the underwriter of the Company’s follow-on public offering consummated in August2010, alleging violations of Sections 10(b) and 20(a) of the Securities Exchange Act of 1934 (the “Exchange Act”) and Rule 10b-5promulgated thereunder. On June 20, 2011, plaintiff Benjamin Padnos filed a securities fraud class action lawsuit in the United StatesDistrict Court, Southern District of New York against the Company, all of its individual officers and/or directors, Yongke Xue, XiaoqinYan, Norman Ko, John W. Smagula, Spring Liu, Child Van Wagner & Bradshaw, PLLC, BDO Limited and Rodman & Renshaw,LLC, theunderwriter of the Company’s follow-on public offering consummated in August 2010, alleging violations of Sections10(b) and 20(a) ofthe Exchange Act and Rule 10b-5 promulgated thereunder. On August 30, 2011, the court consolidated the foregoing two actions andappointed Zachary Lewy as lead plaintiff. On September 30, 2011, pursuant to the Court’s order, Lead Plaintiff filed a consolidatedcomplaint. The consolidated complaint names the Company, Rodman & Renshaw,LLC, BDO Limited, Child Van Wagoner & BradshawPLLC and certain of the Company’s current and former directors and majority shareholders as defendants and alleges violations ofSection 11 and 12 of the Securities Act of 1933 and Section 10(b) and 20(a) of the Exchange Act, and the rules promulgated thereunder. In the consolidated complaint, the plaintiffs are seeking to be awarded, among other things, compensatory damages, reasonable costs andexpenses incurred in the action. The Company has retained a defense counsel to represent it in the matter and intends to file a motion todismiss the consolidated complaint, which is currently due to be served on December 2, 2011. On August 5, 2011, the Company received a shareholder demand letter from counsel for a purported shareholder. The letter is addressedto the Company’s Board of Directors and requests the Board of Directors take a number of actions in order to repair the alleged “harm”caused to the Company by certain of its directors and officers, as well as its current and former auditors. The Board of Directors iscurrently reviewing this shareholder demand letter and considering appropriate action that the Company should undertake. On November7, 2011, two directors were appointed to serve as directors of the board and the independent directors of the board appointed thesedirectors to serve as the members of the evaluation committee .The evaluation committee is expected to evaluate the actions demanded bythe shareholder.
On July 8, 2011, the Company filed a civil action suit against Absaroka Capital and Kevin Barns, who published an article containingfalse allegations and accusations against the Company on June 1, 2011, for libel and tortuous interference with existing and prospectiveeconomic advantages in the United States District Court for the District of Wyoming, where Absaroka Capital is based. The Companyseeks both general damages and all actual, consequential and/or compensatory damages to be proven at trial and exemplary and punitivedamages in an amount to be proven at trial as a result of Defendants’ malicious intent in publishing the article on June 1, 2011. It isunclear at this time what the Company’s damages will be. The parties have agreed to enter into settlement discussions relating to the suitfiled by SPU against Absaroka. In this regard, on September 26, 2011, the parties filed and the court entered a stipulation staying thematter for 30 days so the parties could continue settlement discussions. The parties thereafter entered into a confidentiality agreement andbegan exchanging documents. The stay expired October 26, 2011, without settlement, but the parties agreed that the Company would filean amended complaint on October 31, 2011, giving Absaroka an additional 14 days – to November 14, 2011—to file its answer/counter-claims. In the meantime, the parties continue to exchange documents in hopes of settling the matter.
In addition to the above, from time to time, we may be subject to legal proceedings and claims in the ordinary course of business.
Other than the above, we are not currently a party to any litigation the outcome of which, if determined adversely to us, wouldindividually or in the aggregate be reasonably expected to have a material adverse effect on our business, operating results, cash flows orfinancial condition. ITEM 1A. RISK FACTORS Not applicable.

9/4/18, 1:19 PMskpl10q_sep302011.htm
Page 51 of 53https://www.sec.gov/Archives/edgar/data/1066923/000141588911001281/skpl10q_sep302011.htm
-37-

9/4/18, 1:19 PMskpl10q_sep302011.htm
Page 52 of 53https://www.sec.gov/Archives/edgar/data/1066923/000141588911001281/skpl10q_sep302011.htm
Table of Contents ITEM 2. UNREGISTERED SALES OF EQUITY SECURITIES AND USE OF PROCEEDS On July 25, 2011, the Company issued MZ HCI, the Company’s former investors’ relationship firm, a warrant to purchase an aggregate of75,000 shares of the Company’s Common Stock at an exercise price of $4.50 per share as compensation for the service that MZ HCIprovided.
On August 30, 2010, we closed the public offering of 5,181,285 shares of our Common Stock at a price of $5.00 per share forapproximately $25.9 million. We received an aggregate of approximately $24 million as net proceeds after deducting underwritingdiscounts and commissions and offering expenses. We plan to use the proceeds from this offering primarily in the improvement anddevelopment of our Huludao Wonder factory. Please refer to the related discussion under Liquidity and Capital Resources in Item 2.Management’s Discussion and Analysis of Financial Condition and Results of Operations of Part I. Financial Information of this Form10-Q Report.
ITEM 3. DEFAULTS UPON SENIOR SECURITIES
None
ITEM 4. REMOVED AND RESERVED
None
ITEM 5. OTHER INFORMATION
Not applicable
ITEM 6. EXHIBITS
ExhibitNumber
Description
31.1 Certification pursuant to Exchange Act Rules 13a-15(e) and 15d-15(e), as adopted pursuant to Section
302 of the Sarbanes-Oxley Act of 2002;31.2 Certification pursuant to Exchange Act Rules 13a-15(e) and 15d-15(e), as adopted pursuant to Section
302 of the Sarbanes-Oxley Act of 2002;32 Certification pursuant to 18 U.S.C. 1350
101.INS XBRL Instance Document*101.SCH XBRL Schema Document*101.CAL XBRL Calculation Linkbase Document*101.DEF XBRL Definition Linkbase Document*101.LAB XBRL Label Linkbase Document*101.PRE XBRL Presentation Linkbase Document*
* As provided in Rule 406T of Regulation S-T, this information shall not be deemed “filed” for purposes of Section 11 and 12 of theSecurities Act of 1933 and Section 18 of the Securities Exchange Act of 1934 or otherwise subject to liability under those sections, andshall not be incorporated by reference into any registration statement or other document filed under the Securities Act of 1933, asamended, except as expressly set forth by specific reference in such filing.
-38-

9/4/18, 1:19 PMskpl10q_sep302011.htm
Page 53 of 53https://www.sec.gov/Archives/edgar/data/1066923/000141588911001281/skpl10q_sep302011.htm
Table of Contents
SIGNATURES
Pursuant to the requirements of the Securities Exchange Act of 1934, the Registrant has duly caused this report to be signed on its behalfby the undersigned thereunto duly authorized.
SKYPEOPLE FRUIT JUICE, INC. By: /s/ Xue Yongke Xue Yongke Chief Executive Officer (Principal Executive Officer) Dated: November 14, 2011 By: /s/ Xie Cunxia Xie Cunxia Chief Financial Officer (Principal Financial Officer) Dated: November 14, 2011