skirting the abyss: from economic downturn to financial crisis to long-term malaise
TRANSCRIPT

From Economic Weakness to Financial Crisis to Long-term Malaise: Skirting the Edges of the Abyss
Llinlithgow [email protected]
March, 2010.
Business Cycles, the Financial Crisis and the Outlook:Anticipating the Contours of the Next Decade “New Normal”
Economy +
Geo-Politics
Industry
Business•Strategy
•Operations
Strategy without execution is fantasy. Execution without Strategy is thrashing. And without a Management System
both are improbable
We’ve cycled thru a sequence of reactions, judgments and fears …and there’s still a lot of confusion, uncertainty and doubts
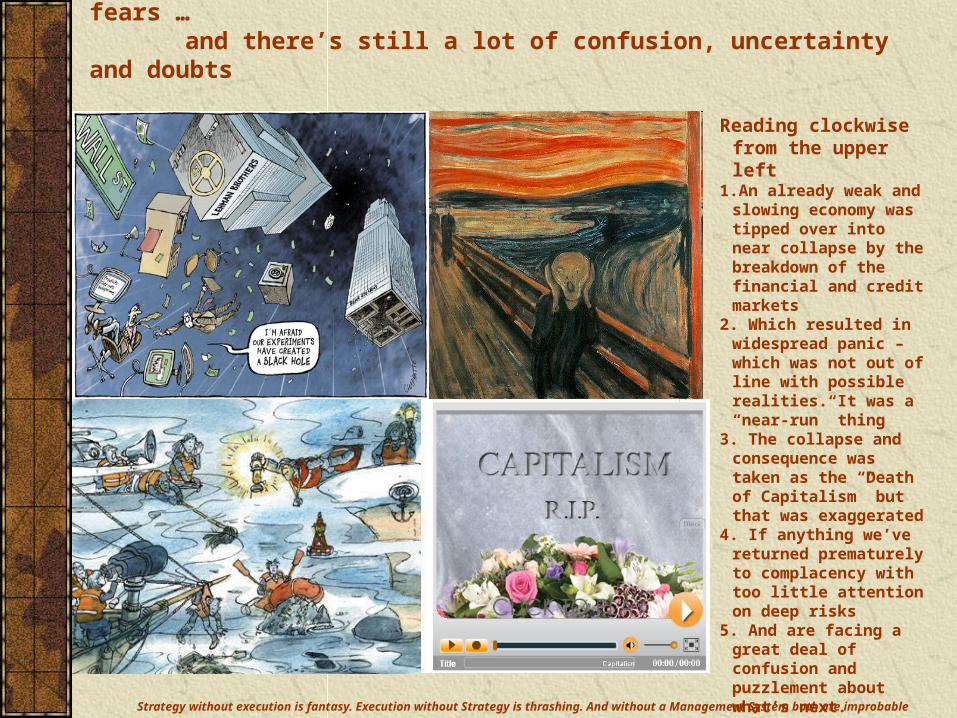
Reading clockwise from the upper left
1.An already weak and slowing economy was tipped over into near collapse by the breakdown of the financial and credit markets
2. Which resulted in widespread panic – which was not out of line with possible realities. It was a “near-run” thing
3. The collapse and consequence was taken as the “Death of Capitalism” but that was exaggerated
4. If anything we’ve returned prematurely to complacency with too little attention on deep risks
5. And are facing a great deal of confusion and puzzlement about what’s next.

Strategy without execution is fantasy. Execution without Strategy is thrashing. And without a Management System
both are improbable
1. Understanding the Business Cycle
2. Key Indicators (Employment, Retail Sales, Housing and Investment)
3. Public Policy: the Stimulus and the Strategic Challenges
4. Savings, Debt and Growth
5. Genesis of the Crisis
6. Trade, Exchange and the Dollar
7. Deficits, Public Debt, Financing and Inflation
8. Strategic Outlook for the US Economy
9. China and Geo-politics
10. Oil and Energy
11. Business Performance
12. Markets and Investment Strategy
Understanding the Financial Crisis in the Economic Context: Lots of Moving Parts, Pieces and Complications
The key is developing the right mental models to filter chaotic data into useful information ….
… and use those filters to create a “dashboard” to monitor the state of the world

Strategy without execution is fantasy. Execution without Strategy is thrashing. And without a Management System
both are improbable
Two major sources of confusion – assuming a calm economy is the normal state and being surprised by storms.
- and not appreciating the underlying patterns!
The Economy follows the same recurrent patterns, driven by the same forces and governed by the same relationships but the actual behavior varies considerably. The challenge is to understand the structure and relationships and monitor the changes in the forces to anticipate what’s coming.

Strategy without execution is fantasy. Execution without Strategy is thrashing. And without a Management System
both are improbable
ConsumerConfidence
ConsumerConfidence
ConsumerSpending
EconomyBusinessInvestment
Hiring
BusinessBusinessExpectations
CREDIT
CREDIT
The Great
Economic
Circle of Life
Consumer-led
Investment-driven
Policy-managed
Business Cycles:
Consumer-led Normal vs. Investment-driven Speculative
Economic Cycle1. Any developed economy follows a
linked cycle where the core engine is the Consumer driving the rest of the Economy (65-70% in the US – historically high).
2. Businesses respond by producing what they can sell now and, IF demand is growing hiring more workers and investing in equipment and structures.
3. Part of their decision-making process is a multi-part “Credit” evaluation of outlooks, risks, financing and expectations.
4. Going round consumers perform a similar evaluation based on jobs, wages, expectations, uncertainties and asset/wealth & financing value
• The last two bubbles were NOT based on wage or job growth but were artificially stimulated by leveraged asset-appreciation
5. As the Economy moves around the cycle the result over time is a wave pattern with repeating structures, relationships, timings, etc. that depend on how hard the “wind” is blowing
• A Normal cycle is led by Consumer spending
• A Boom is driven by speculative Investment (Tech, Real Estate)
• When excesses correct the impact can be years on the bottom without public spending
Strategy without execution is fantasy. Execution without Strategy is thrashing. And without a Management System
both are improbable
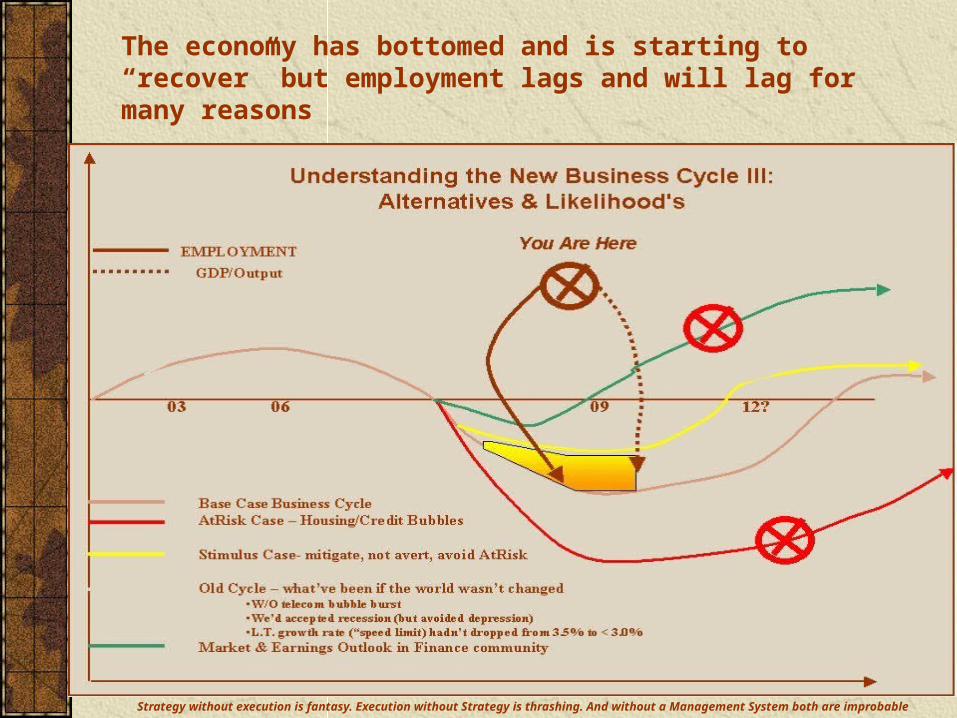
The economy has bottomed and is starting to “recover” but employment lags and will lag for many reasons

Strategy without execution is fantasy. Execution without Strategy is thrashing. And without a Management System
both are improbable
Real economic data looks startlingly like the patterns we showed …. Telling us a lot about the future
1. GDP & Consumption have followed the cycle since 1950
2. Both have turned up but are still very weak – a post WW2 record
3. Growth this decade was WEAK
4. The long-term trend slowed and cliff-dove in the Great Recession
1.GDP follows PCE but Employment follows GDP
2. Employment has just turned up
3. It also shows a steady downtrend since 1980.
4. Employment growth was weaker each decade
-6.0%
-4.0%
-2.0%
0.0%
2.0%
4.0%
6.0%
8.0%
10.0%
12.0%
1980-I 1985-I 1990-I 1995-I 2000-I 2005-I
GDPx
PCE
Employ
GDP vs. Consumption vs Employment (yoy%)
-6.0%
-4.0%
-2.0%
0.0%
2.0%
4.0%
6.0%
8.0%
10.0%
12.0%
14.0%
16.0%
1950-I 1955-I 1960-I 1965-I 1970-I 1975-I 1980-I 1985-I 1990-I 1995-I 2000-I 2005-I
GDP
PCE
GDPTrend
GDP and Consumption (yoy%)

Strategy without execution is fantasy. Execution without Strategy is thrashing. And without a Management System
both are improbable
In the short-run Retail Sales is a good high-frequency indicator for the Consumer side of the economy
1. Both real and nominal sales abruptly fell off a cliff in late 08, been marching long the bottom but now show significant improvement.
2. Real and nominal sales, and x-Auto, have all turned slightly positive YoY!
1. Consumption tracks real Sales thruout the entire business cycle.
2. The drop in this downturn was the worst since 1960.
3. Despite the upturn the level remains very poor.
4. Growth in Sales (& Consumption) will demand on Consumer demand – which depends on jobs and wages.-12.0%
-10.0%
-8.0%
-6.0%
-4.0%
-2.0%
0.0%
2.0%
4.0%
6.0%
8.0%
10.0%
1980Q1 1985Q1 1990Q1 1995Q1 2000Q1 2005Q1
-6.0%
-4.0%
-2.0%
0.0%
2.0%
4.0%
6.0%
8.0%
10.0%
12.0%Real SalesGDPConsump
LT Economic Outlook: GDP, Consumption, Real
R2 = 85.6%
-15.0%
-10.0%
-5.0%
0.0%
5.0%
10.0%
15.0%
Jan-00 Jan-01 Jan-02 Jan-03 Jan-04 Jan-05 Jan-06 Jan-07 Jan-08 Jan-09 Jan-10
Real NominalxAuto Trend
Retail Sales:(YoY%)

Strategy without execution is fantasy. Execution without Strategy is thrashing. And without a Management System
both are improbable
Capital goods orders are encouraging and a directional change has now reached positive territory YoY…
1.Durable goods orders and orders x-Aircraft sharply improved and have turned strongly positive.
2. DG Orders and xAC are near 10% YoY.
3. Much of the GDP surge was in Inventory re-stocking which will fad beyond Q2.
1.Economic activity (GDP) drives Industrial Production drives orders drives capital spending in a typical cycle.
2. The order pickup is a sign of improving capex potential.
3. BUT …. Capex lags as much or more as Employment so equipment and tech demands are limited.
-30%
-25%
-20%
-15%
-10%
-5%
0%
5%
10%
15%
20%
1993Q1 1995Q1 1997Q1 1999Q1 2001Q1 2003Q1 2005Q1 2007Q1 2009Q1
-5%
-3%
-1%
1%
3%
5%
7%
9%
DGOrd
exAC
GDP
Capital Goods Orders vs Economy
Orders(xAC),Capex, IndProd
-30.0%
-25.0%
-20.0%
-15.0%
-10.0%
-5.0%
0.0%
5.0%
10.0%
15.0%
20.0%
1993Q1 1995Q1 1997Q1 1999Q1 2001Q1 2003Q1 2005Q1 2007Q1 2009Q1
-15.0%
-10.0%
-5.0%
0.0%
5.0%
10.0%
xACOrds
Capex
IndProd

Strategy without execution is fantasy. Execution without Strategy is thrashing. And without a Management System
both are improbable
Residential Investment (new homes) are a critical driver of growth …. And remains in bad, though no longer abysmal, condition
1.YoY Changes in RI mirror and drive GDP growth – on a long enough timeseries we find that RI is a leading indicator.
2. RI is also turning up slightly on a YoY basis, after reaching a terrible depth.
3. At –12% it remains abysmal however, and is likely to be weak in the future
1. RI has a steady-state relationship around 5% of total GDP for years but was turned into a serious bubble by financial engineering.
2. Relative to total Investment it is turning up – more a measure of reduced Investment than health.
3. But is essentially bumping sideways
2.0%
2.5%
3.0%
3.5%
4.0%
4.5%
5.0%
5.5%
6.0%
6.5%
1995-I 2000-I 2005-I
20.0%
22.0%
24.0%
26.0%
28.0%
30.0%
32.0%
34.0%
36.0%
38.0%
40.0%
RIGDP%RIInvest%
Residential Investment (RI) vs. GDP, Gross Investment
-6.0%
-4.0%
-2.0%
0.0%
2.0%
4.0%
6.0%
8.0%
1995-I 2000-I 2005-I
-30.0%
-25.0%
-20.0%
-15.0%
-10.0%
-5.0%
0.0%
5.0%
10.0%
15.0%
GDPx
RI
GDP vs. Residential Investment (yoy%)

Strategy without execution is fantasy. Execution without Strategy is thrashing. And without a Management System
both are improbable
Housing has arrested its freefall but is a long way from healthy … or even beginning to repair the sustained damage.
1. New Home Sales appear to be flattening at a level at or below the worst historical one.
2. There is a worrisome gap between New & Existing Sales (existing sales don’t contribute to growth)
3. New Home Sales dropped after the tax-credit induced surge
1. The Inventory of New Homes has improved significantly but remains at very high levels (comparable to previous peaks).
2. Housing prices are at more reasonable (affordable) levels but DO NOT appear to have reset to prior lows – leaving exposure.
3. THE goto source of Housing is CalculatedRisk.
Strategy without execution is fantasy. Execution without Strategy is thrashing. And without a Management System
both are improbable
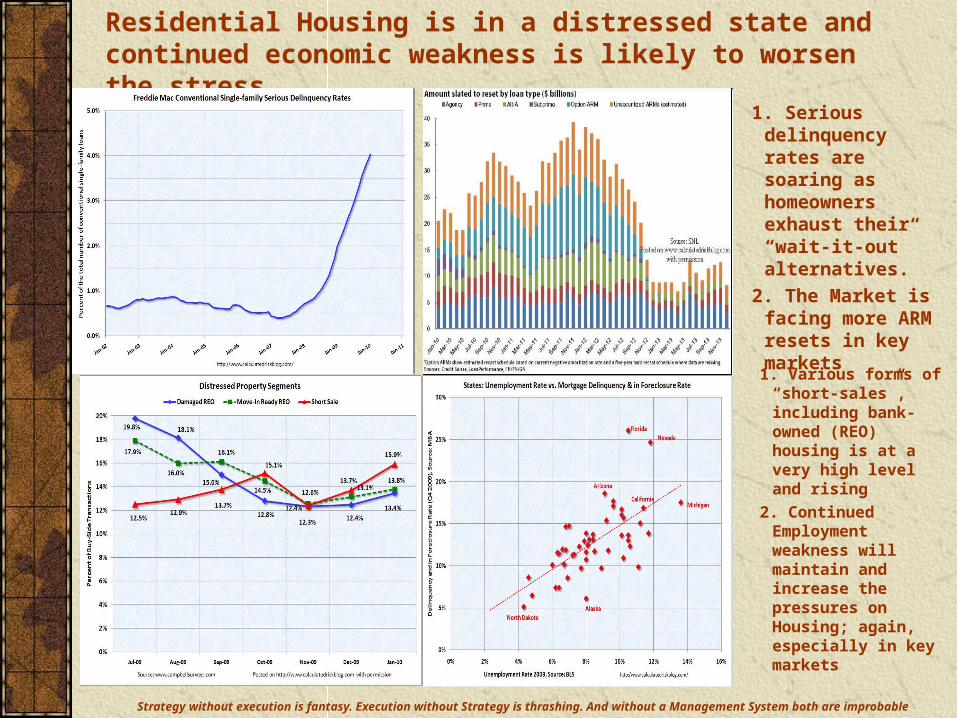
Residential Housing is in a distressed state and continued economic weakness is likely to worsen the stress …
1. Serious delinquency rates are soaring as homeowners exhaust their “wait-it-out” alternatives.
2. The Market is facing more ARM resets in key markets
1. Various forms of “short-sales”, including bank-owned (REO) housing is at a very high level and rising
2. Continued Employment weakness will maintain and increase the pressures on Housing; again, especially in key markets

Strategy without execution is fantasy. Execution without Strategy is thrashing. And without a Management System
both are improbable
1.The US economy has created ZERO private jobs in over a decade, since 1999, over a decade!
2. It is the worst post-war jobs performance on record
The key to real growth, a healthy economy and future prosperity is JOBS, period.
1. Labor force growth means we need about 150K/month +/- to stay even.
2. Net New jobs is the difference between new jobs and 150K.
3. A rolling total since 1980 shows extremely poor performance
4. We entered the Recession in the hole.
5. We are now –14.1 million in the hole.
6. We estimate 46 million jobs would be prosperity but anticipate getting 20 (BLS says 15!)
60000
70000
80000
90000
100000
110000
120000
130000
140000
150000
1980Q1 1984Q1 1988Q1 1992Q1 1996Q1 2000Q1 2004Q1 2008Q1
Public
Private
Private Job Creation:1980-Now
Net Private Job creation is ZERO since 1999!
LT Employment Trends
-20000
-15000
-10000
-5000
0
5000
10000
1980Q1 1984Q1 1988Q1 1992Q1 1996Q1 2000Q1 2004Q1 2008Q1
-3000
-2500
-2000
-1500
-1000
-500
0
500
1000
1500
AggNwJobs
NetNewJobs
NewJobs

Strategy without execution is fantasy. Execution without Strategy is thrashing. And without a Management System
both are improbable
y = 0.63x - 0.00R2 = 0.62
-6.0%
-4.0%
-2.0%
0.0%
2.0%
4.0%
6.0%
-6.0% -4.0% -2.0% 0.0% 2.0% 4.0% 6.0% 8.0% 10.0%
Employment vs GDP: 1960-2009
y = 3.63x - 0.05R2 = 0.79
-25.0%
-20.0%
-15.0%
-10.0%
-5.0%
0.0%
5.0%
10.0%
15.0%
20.0%
-6.0% -4.0% -2.0% 0.0% 2.0% 4.0% 6.0%
GDP (yoy)C
ap
ex (
yo
y)
Output vs Capex:1995-2009
y = 1.04x - 0.00R2 = 0.74
-6.0%
-4.0%
-2.0%
0.0%
2.0%
4.0%
6.0%
8.0%
10.0%
-4.0% -2.0% 0.0% 2.0% 4.0% 6.0% 8.0% 10.0%
Consumption (yoy)
Ou
tpu
t (y
oy)
Consumption vs GDP:1960-2009
y = 3.67x - 0.07
R2 = 0.91
-25.0%
-20.0%
-15.0%
-10.0%
-5.0%
0.0%
5.0%
10.0%
15.0%
-6.0% -4.0% -2.0% 0.0% 2.0% 4.0% 6.0%
GDP (yoy)
Investm
en
t (y
oy)
Output vs Investment:1995-2009
To understand the performance outlook follow clockwise around the economic life cycle and read off the line…
Consumption growth of 2.5-3.0% implies GDP growth of 2.0-2.5%, the outlook for next year. 2.5% GDP growth means Employment growth of <2.0%; really need 4% GDP growth. This is a weak and atypical recovery (typical post-war recovers are 6% real growth) but means that Employment growth will be poor and Unemployment stubbornly high. Especially given that long-term forecasts (OMB/CBO) call for growth in the 2.2-2.5% for the decade. Investment (real estate and business) won’t pick up without strong growth, though residential tends to lead a recovery it’s weakened and in repair mode for a long time. To see a surge in Investment spending would require GDP growth north of 4%, or better. So not only Employment will be weak so will Investment and Capex spending (implying weakness in the Tech and Equipment industries).
Strategy without execution is fantasy. Execution without Strategy is thrashing. And without a Management System
both are improbable
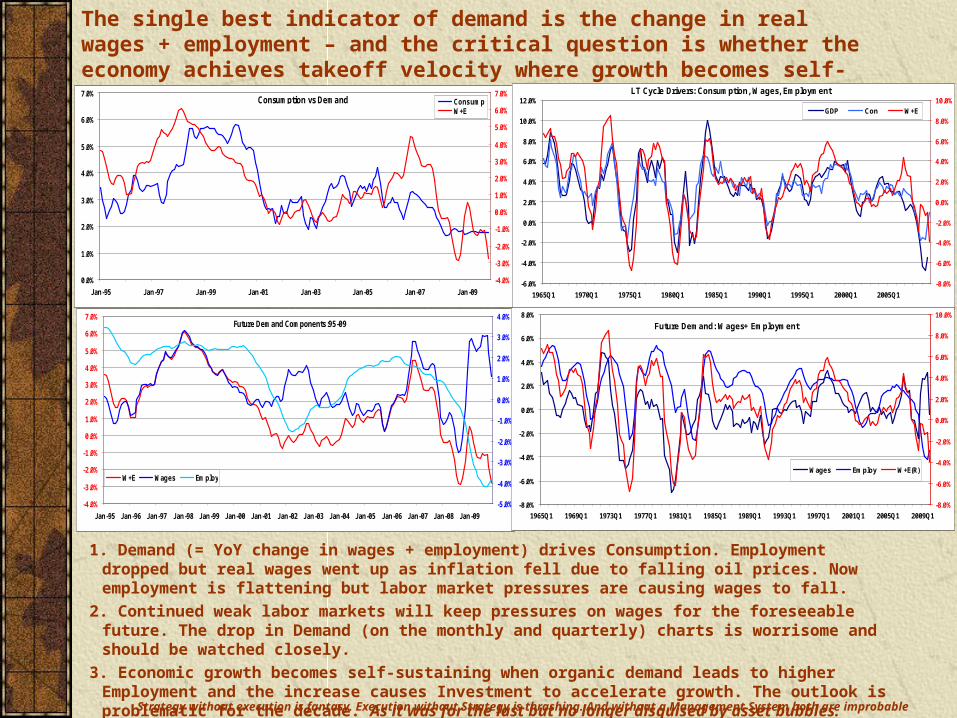
1. Demand (= YoY change in wages + employment) drives Consumption. Employment dropped but real wages went up as inflation fell due to falling oil prices. Now employment is flattening but labor market pressures are causing wages to fall.
2. Continued weak labor markets will keep pressures on wages for the foreseeable future. The drop in Demand (on the monthly and quarterly) charts is worrisome and should be watched closely.
3. Economic growth becomes self-sustaining when organic demand leads to higher Employment and the increase causes Investment to accelerate growth. The outlook is problematic for the decade. As it was for the last but no longer disguised by asset bubbles.
The single best indicator of demand is the change in real wages + employment – and the critical question is whether the economy achieves takeoff velocity where growth becomes self-sustaining…
0.0%
1.0%
2.0%
3.0%
4.0%
5.0%
6.0%
7.0%
Jan-95 Jan-97 Jan-99 Jan-01 Jan-03 Jan-05 Jan-07 Jan-09
-4.0%
-3.0%
-2.0%
-1.0%
0.0%
1.0%
2.0%
3.0%
4.0%
5.0%
6.0%
7.0%ConsumpW+E
Consumption vs Demand
-4.0%
-3.0%
-2.0%
-1.0%
0.0%
1.0%
2.0%
3.0%
4.0%
5.0%
6.0%
7.0%
Jan-95 Jan-96 Jan-97 Jan-98 Jan-99 Jan-00 Jan-01 Jan-02 Jan-03 Jan-04 Jan-05 Jan-06 Jan-07 Jan-08 Jan-09
-5.0%
-4.0%
-3.0%
-2.0%
-1.0%
0.0%
1.0%
2.0%
3.0%
4.0%
W+E Wages Employ
Future Demand Components:95-09
-6.0%
-4.0%
-2.0%
0.0%
2.0%
4.0%
6.0%
8.0%
10.0%
12.0%
1965Q1 1970Q1 1975Q1 1980Q1 1985Q1 1990Q1 1995Q1 2000Q1 2005Q1
-8.0%
-6.0%
-4.0%
-2.0%
0.0%
2.0%
4.0%
6.0%
8.0%
10.0%GDP Con W+E
LT Cycle Drivers: Consumption, Wages, Employment
-8.0%
-6.0%
-4.0%
-2.0%
0.0%
2.0%
4.0%
6.0%
8.0%
1965Q1 1969Q1 1973Q1 1977Q1 1981Q1 1985Q1 1989Q1 1993Q1 1997Q1 2001Q1 2005Q1 2009Q1
-8.0%
-6.0%
-4.0%
-2.0%
0.0%
2.0%
4.0%
6.0%
8.0%
10.0%
Wages Employ W+E(R)
Future Demand: Wages+ Employment

Strategy without execution is fantasy. Execution without Strategy is thrashing. And without a Management System
both are improbable
HANDY POCKET ECONOMIST
Sales PCE GDP EMP Unemp CPX Tech
0.0% 2.0% 1.7% 1.0% 9.1% 1.1% 1.1%
0.2% 2.1% 1.8% 1.0% 8.5% 1.5% 1.5%
0.4% 2.2% 1.9% 1.1% 8.0% 1.8% 1.9%
0.6% 2.3% 2.0% 1.1% 7.4% 2.2% 2.3%
0.8% 2.4% 2.1% 1.2% 6.8% 2.5% 2.7%
1.0% 2.5% 2.2% 1.3% 6.2% 2.9% 3.1%
1.2% 2.6% 2.3% 1.3% 5.6% 3.2% 3.5%
1.4% 2.7% 2.4% 1.4% 5.1% 3.6% 4.0%
1.6% 2.8% 2.5% 1.5% 4.5% 3.9% 4.4%
1.8% 2.8% 2.6% 1.5% 3.9% 4.3% 4.8%
2.0% 2.9% 2.7% 1.6% 3.3% 4.6% 5.2%
2.2% 3.0% 2.8% 1.6% 2.8% 5.0% 5.6%
2.4% 3.1% 2.9% 1.7% 2.2% 5.4% 6.0%
2.6% 3.2% 3.0% 1.8% 1.6% 5.7% 6.4%
2.8% 3.3% 3.0% 1.8% 1.0% 6.1% 6.8%
3.0% 3.4% 3.1% 1.9% 0.5% 6.4% 7.2%
3.2% 3.5% 3.2% 1.9% -0.1% 6.8% 7.7%
3.4% 3.6% 3.3% 2.0% -0.7% 7.1% 8.1%
3.6% 3.7% 3.4% 2.1% -1.3% 7.5% 8.5%
3.8% 3.8% 3.5% 2.1% -1.8% 7.8% 8.9%
4.0% 3.9% 3.6% 2.2% -2.4% 8.2% 9.3%
Key Indicator Growth Rates
0.0%
1.0%
2.0%
3.0%
4.0%
5.0%
6.0%
7.0%
8.0%
9.0%
10.0%
0.0%0.2%0.4%0.6%0.8%1.0%1.2%1.4%1.6%1.8%2.0%2.2%2.4%2.6%2.8%3.0%3.2%3.4%3.6%3.8%4.0%
Ind
icat
ors
(yo
y%)
-4.0%
-2.0%
0.0%
2.0%
4.0%
6.0%
8.0%
10.0%
0.0%
1.0%
2.0%
3.0%
4.0%
5.0%
6.0%
7.0%
8.0%
9.0%
10.0%
0.0%
0.2%
0.4%
0.6%
0.8%
1.0%
1.2%
1.4%
1.6%
1.8%
2.0%
2.2%
2.4%
2.6%
2.8%
3.0%
3.2%
3.4%
3.6%
3.8%
4.0%
Retail Sales (yoy%)
Ind
ica
tors
(y
oy
%)
-4.0%
-2.0%
0.0%
2.0%
4.0%
6.0%
8.0%
10.0%
Inv
ers
e S
ca
le
PCE GDPEMP CPXTech Unemp
Economic Indicator Cheatsheet
NOTE: yoy% tells you what the average annual growth rate relationship is; e.g. 2% Sales => 3% PCE.
NOTE: Unemployment is inverted, so it doesn't drop until sales growth is > 3+%.
PCE=.47*Sales+.02
GDP=1.04*PCE-.004
EMP=.63*GDP-.001
UnEmp=.19-5.89*GDP
CPX=3.63*GDP-.05
Tech=4.21*GDP-.06
All the Business Cycle Models and Data were used to create a printable pocket guide to the Economy and Forecasting• the Cycle is Consumption GDP Employment Investment Consumption• We started with Retail Sales as a high-frequency monthly indicator to judge the state of the economy and guestimate futures with …• So some key relationships to pay attention to …
• 2.0% YoY Sales growth 2.7% GDP but 3.3% Unemployment!• Unemployment doesn’t come down until you get 3.3%+ GDP growth… and not seriously until it approaches 4.0%• The L.T. outlook is for 2.5% GDP growth!!!• Capex and Tech spending is asymmetric, I.e. the line is very steep so slight positive growth gets a good bump … but nothing like expectations!!

Strategy without execution is fantasy. Execution without Strategy is thrashing. And without a Management System
both are improbable
Even though the structures and patterns are the same sometimes the FORCES are beyond expectations … in 2008 a rising storm turned into a Tsunami when the credit markets broke
Even so there were plenty of warnings both about the structural risks on structured, synthetic debt AND the metastasizing weaknesses in the Credit Markets …. But nobody believed the warnings or prepared to meet them. Call it complacent “business-as-usual” syndrome.

Strategy without execution is fantasy. Execution without Strategy is thrashing. And without a Management System
both are improbable
We got within 24 hrs. of a credit market collapse that would have made the Great Depression like a cakewalk

Strategy without execution is fantasy. Execution without Strategy is thrashing. And without a Management System
both are improbable
The current state results from the links between the US and World economies, credit and equity markets and Housing
The LUV Outlook & Risks1.The US Economy will have weak
growth (U) and poor job creation
2. while Europe is facing a slower and weaker outlook (L) and
3. the developing countries are likely to be more V-shaped with
4. some major structural challenges – China in particular
• China needs 6% growth for labor breakeven and is
• facing the structural change in an export-led economy
5. US Housing remains weak
6. Credit markets are self-repairing but credit isn’t flowing because of bank balance sheet damage, lower demand and economic risks
• Small businesses are vulnerable
• Consumer demand is constrained
7. We think equity markets are over-valued on a $ carry trade and are exposed
• PE Ratios are abnormally high
• Economic growth will NOT be as good as priced
• Earnings outlooks optimistic
• Likely priced beyond perfection

Strategy without execution is fantasy. Execution without Strategy is thrashing. And without a Management System
both are improbable
We need to look at some dry but real numbers to understand the contagion and consequences: [10Yr Treasuries (TNX), 3Mo (IRX), LIBOR (London Inter-bank Rate), TED (LIBOR-IRX)]
From 01-04 rates declined with economic weakness but s.t. rates climbed rapidly from 04-07. L.T. DID NOT!
Beginning in mid-07 both slowed as the economy did, s.t. more rapidly driving up the Yield Curve (TNX:INX). LIBOR followed a similar pattern
During the Crisis rates dropped to near zero.
The Yield Curve spike was a measure of how broken the credit markets were.
Zooming into 07-10 TED was very elevated – meaning banks weren’t willing to lend to each other
At the height of the crisis there was a tremendous spike meaning banks were betting on each other to default and go BK!!
The spread has come down enormously so credit markets are trusted and working again
Rates are still low – because of policy s.t. and weakness + policy l.t.

Strategy without execution is fantasy. Execution without Strategy is thrashing. And without a Management System
both are improbable
Credit and financing is the economy’s circulatory and respiratory system – without things STOP

Strategy without execution is fantasy. Execution without Strategy is thrashing. And without a Management System
both are improbable
THE fundamental structural change between 1980 and now was the creation, growth, exponentiation and metastasis of structured, synthetic financial products …. … A General Purpose Technology mal-adapted, unlike say steam engines or fractional h.p. electrical motors.
THE fundamental structural change between 1980 and now was the creation, growth, exponentiation and metastasis of structured, synthetic financial products …. … A General Purpose Technology mal-adapted, unlike say steam engines or fractional h.p. electrical motors.
SSD’s changed the business model from loan to invest to originate to sell …changing literally millenia of incentives from borrower quality to ability to pump volume to the next sucker in line. A GPT turned into a financial contagion

Strategy without execution is fantasy. Execution without Strategy is thrashing. And without a Management System
both are improbable
Rocks, Ponds, Ripples: Welcome to FinEngr World
Initial Asset
Originator
(Loan)
Bank(s) MBS/CDO
Ibank CDO1…N
Hedge
CDO/CLO
Investors
Sub-prime
Alt-As
“Normal”
Commercial Paper
CDO
CDO(N)
Bonds
Equities
Currencies
Big RocksBoulders LINKSAsset Classes

Strategy without execution is fantasy. Execution without Strategy is thrashing. And without a Management System
both are improbable
Our “Self-Arrest” was due to Fed policy where massive liquidity was injected directly (thru “Quantitative Easing”) by expansion of the Fed’s Balance Sheet … yet it HAS NOT resulted in a surge in Money
Normally the Fed injects money by buying Treasuries
This time it purchase Financial Debt Directly• Direct purchase of credit securities
• Huge direct loans to Financial institutions• All of which is winding down
And Agency (FNM/FRE) securities• Agency mortgage funding is 80% of Housing Finance – the only thing keeping the wheels on!
The huge surge in the Monetary Base was offset by a surge in Excess Reserves … and the speed of circulation has dropped enormously.• Thereby constraining credit significantly
• But Banks have not re-built their balance sheets• Written down toxic assets still on the books• Or reduced under-water mortgages
Strategy without execution is fantasy. Execution without Strategy is thrashing. And without a Management System
both are improbable
Asset QualityStructured
Instruments
Asset
Writedowns
Leveraged
Losses
Balance Sheet
Losses
P and L
Losses
Credit
Tightening
Cyclic Cyclic
Downturn Downturn
Downsizing &
Cost Reduction
HELOCPrime
Sub-prime 2Sub-primeM
ortg
age D
ebt CDS
…..CLO
CDO
Buyout D
ebt
…….Consumer
Auto LoansCredit CardsCon
sumer
Deb
t
…….BizzLoans
Credit LinesFinancingBusin
ess D
ebt
Other
Assets
1 2
345
6
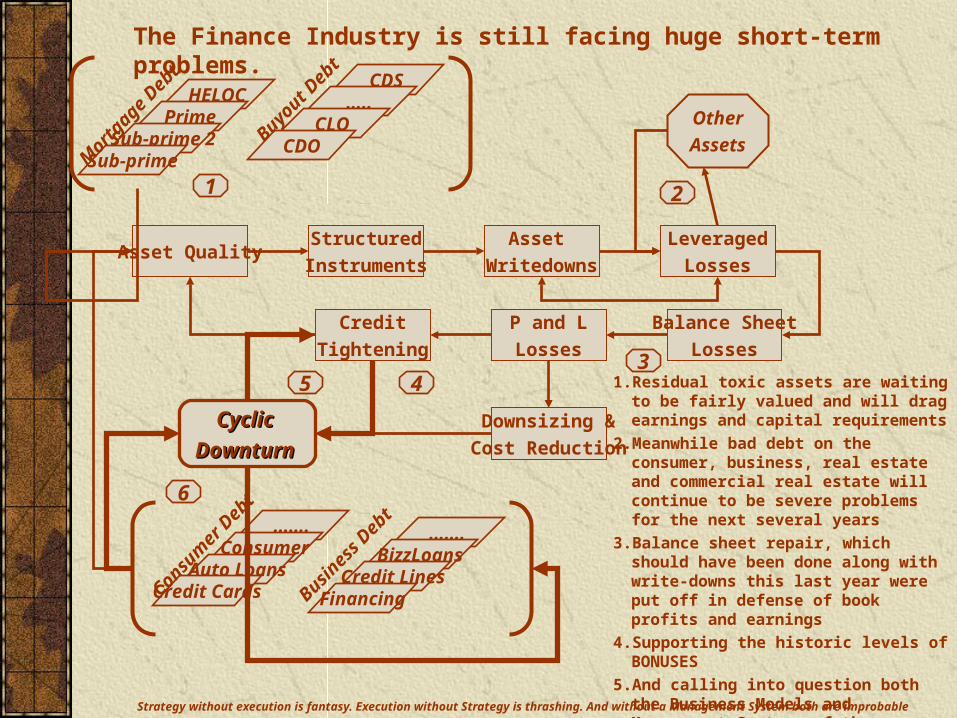
The Finance Industry is still facing huge short-term problems.
1. Residual toxic assets are waiting to be fairly valued and will drag earnings and capital requirements
2. Meanwhile bad debt on the consumer, business, real estate and commercial real estate will continue to be severe problems for the next several years
3. Balance sheet repair, which should have been done along with write-downs this last year were put off in defense of book profits and earnings
4. Supporting the historic levels of BONUSES
5. And calling into question both the Business Models and Management Systems of the Financials

Strategy without execution is fantasy. Execution without Strategy is thrashing. And without a Management System
both are improbable
Between the crisis, lingering impacts on Banks and continued economic weakness (lowering demand) credit has contracted more severely than in any post-WW2 period
1. Consumer loans have had a very sharp YoY decline, more severe in % and absolute terms than anytime since 1980
2. Business loans have been even more badly hit and, almost literally, have fallen off a cliff. Given their role in job creation credit availability for SMB’s is a major strategic problem.
3. Taking all bank credit together from loans to credit cards, et.al. the decline has, again, been literally abysmal.
4. Given a weak economy these pressures will continue
5. Given fragile bank balance sheets and future bad credit problems repair does NOT seem likely over the next few years.
6. In the long-run the real key question is how will Consumers and Businesses react to the lessons of the crisis. If there is a permanent shift in credit demand, as there should be, we are facing major structural changes in the credit and financial markets.

Strategy without execution is fantasy. Execution without Strategy is thrashing. And without a Management System
both are improbable
Finance is essential to L.T. growth by providing efficient and effective sourcing and allocation of capital – has it served that purpose in the last 20-30 years?
-500.0%
0.0%
500.0%
1000.0%
1500.0%
2000.0%
2500.0%
3000.0%
1950Q1 1955Q1 1960Q1 1965Q1 1970Q1 1975Q1 1980Q1 1985Q1 1990Q1 1995Q1 2000Q1 2005Q1
GDP NonFin Finance
Aggregate Growth: GDP vs Profits
40.0%
45.0%
50.0%
55.0%
60.0%
65.0%
1950Q1 1955Q1 1960Q1 1965Q1 1970Q1 1975Q1 1980Q1 1985Q1 1990Q1 1995Q1 2000Q1 2005Q1
Fin ProfitsNon-F ProfitsWages
Finance Profits vs the Rest (% GDP)1. Over the last 60 years Wages, the
ultimately measure of prosperity and driver of sustainable economic growth have declined as a share of GDP.
2. Corporate profits for traditional industries have maintained a significant share but, beginning in the mid-80’s with de-regulation, Financial profits have taken a larger share of GDP and Profits
3. If you look at aggregate Profit growth mainstream businesses experienced profit growth that lagged overall economic growth
4. Finance on the other hand grew slightly faster until the mid-80s when it suddenly jumped non-linearly. But beginning with the Tech Bubble there was an exponential increase in Finance Profits.
5. It would appear that much of the “capital” raised was actually used to support trading and speculation and DID NOT directly contribute to the growth of the Economy.
6. Capital allocation was, therefore, Inefficient and Ineffective.

Strategy without execution is fantasy. Execution without Strategy is thrashing. And without a Management System
both are improbable
Value Proposition•Business Model•Strategy•Plans
Execution•Marketing & Sales•Service•Operations•Infrastructure
•IT•HR
Management System•Budgets•Controls•Compensation
Glo
bal W
ealt
h M
anag
emen
t
Glo
bal C
ards
Sec
uri
ties
an
d B
anki
ng
Tra
nsa
ctio
n S
ervi
ces
Bu
sin
ess
Ban
kin
g
Key Elements Finance Industry Sectors
Con
sum
er B
anki
ng
Financial Business Models – time to re-examine, re-think and re-design business models- leveraged trading, proprietary trading w/o subsidies?- lower demand for IB services? Same umbrella?- Credit Cards & Consumer finance ~ de-leveraging?- Business Finance – lower growth = lower demandWhat are the risks and what are the opportunities?Why aren’t they being seized?
Drucker’s
Principles
Finance Industry Sectors
1.Deliver Performance and Value
2. Make Work Effective
1. Make the Worker Efficient
2. Make the Working effective
3. Meet Social Responsibilities
1. Do NO Harm
2. Proactively manage externals
3. Recognize social impacts & lead re-dress
Global
Wealth
Management
Consumer
Banking
Credit
Cards
Business
Banking
Securities
Management
& Services
Five Major Causes for the Crisis1. A worldwide savings excess created by
trade imbalances and a frantic search for return in a world of excess liquidities
2. Over-development and exploitation of SSD’s coupled with a severe failure of quality control & risk management.
3. A failure of Regulatory oversight caused by ideological misunderstandings and a failure to understand how markets work.
4. Breakdowns in controls, management systems, performance measurement and compensation practices – terminally bad business practice
5. HUBRIS – a failure to understand the risks, a focus on the short-term and pursuit of individual gain at enterprise AND public cost.

Strategy without execution is fantasy. Execution without Strategy is thrashing. And without a Management System
both are improbable
Things to Think About – and Take Away!Some Major Take-Aways
1. You can understand how the economy and markets work. There are simple patterns that are based on deep theory and results
2. There are overall patterns and models (think Cycles and YoY) for the economy as a whole, and there are sub-models that help with key component issues
3. Much of the headline news, commentary and suggestions distort more than they help because they don’t use the recurring patterns.
4. In truth much of the commentary is distorted by narrowness by the commenter, often due to discipline stovepipe or ideological biases
5. We all have such and our thinking will be driven by our Hindbrains (the “Lizardbrain) to get what it wants unless we train it, discipline it and learn the patterns.
6. Learning the Patterns is like learning any discipline it takes time, work and practice.
7. But it’s also like martial arts training – how you react in an emergency will depend on whether or not you know how to react or have to make it up in the crisis.

Strategy without execution is fantasy. Execution without Strategy is thrashing. And without a Management System
both are improbable
The Recovery is underway but will be weak and slow … we haven’t reached takeoff velocity to self-sustaining growth
Depression
L-Shaped Recovery
U-Shaped Recovery
ModerateRecovery
(Likely Outcome)
Output
Time
Economic Alternatives: Re-structure vs. Stagnation
Prosperous Recovery(Requires Re-basing Economy)
1. We’ve avoided a Depression and, likely, an L-shaped Japanese malaise
2. But are facing a broad and shallow U-shaped recovery that will play out thru the rest of the decade
3. The two primary causes are credit constraints and the severity of job losses; plus the time it will take get them back, if ever.
4. This follows the pattern of recent cycles because of lower long-term growth potential and under-investment
5. What averted GD2.0 was the combination of lower interest rates, massive capital injections and fiscal stimulus.
6. The Economy is still weak and the chances of a double-dip W are rising.
Strategy without execution is fantasy. Execution without Strategy is thrashing. And without a Management System
both are improbable
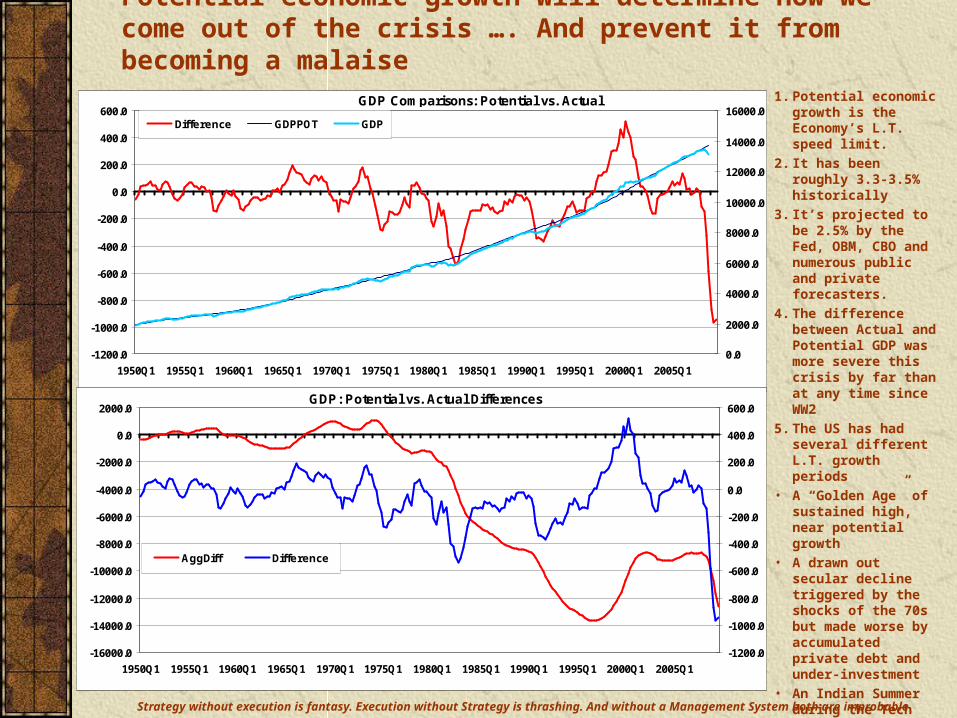
Potential economic growth will determine how we come out of the crisis …. And prevent it from becoming a malaise
-1200.0
-1000.0
-800.0
-600.0
-400.0
-200.0
0.0
200.0
400.0
600.0
1950Q1 1955Q1 1960Q1 1965Q1 1970Q1 1975Q1 1980Q1 1985Q1 1990Q1 1995Q1 2000Q1 2005Q1
0.0
2000.0
4000.0
6000.0
8000.0
10000.0
12000.0
14000.0
16000.0Difference GDPPOT GDP
GDP Comparisons: Potential vs. Actual
-16000.0
-14000.0
-12000.0
-10000.0
-8000.0
-6000.0
-4000.0
-2000.0
0.0
2000.0
1950Q1 1955Q1 1960Q1 1965Q1 1970Q1 1975Q1 1980Q1 1985Q1 1990Q1 1995Q1 2000Q1 2005Q1
-1200.0
-1000.0
-800.0
-600.0
-400.0
-200.0
0.0
200.0
400.0
600.0
AggDiff Difference
GDP: Potential vs. Actual Differences
1. Potential economic growth is the Economy’s L.T. speed limit.
2. It has been roughly 3.3-3.5% historically
3. It’s projected to be 2.5% by the Fed, OBM, CBO and numerous public and private forecasters.
4. The difference between Actual and Potential GDP was more severe this crisis by far than at any time since WW2
5. The US has had several different L.T. growth periods
• A “Golden Age” of sustained high, near potential growth
• A drawn out secular decline triggered by the shocks of the 70s but made worse by accumulated private debt and under-investment
• An Indian Summer during the Tech Bubble
• And a return to “Naked Swimmers” where there’s no hiding places left.

Strategy without execution is fantasy. Execution without Strategy is thrashing. And without a Management System
both are improbable
That LT assessment is supported by the trends in YoY GDP growth … yet to address our second major problem after credit we need to restore higher LT growth
GDP vs Employment (YoY%)
y = 0.538x + 0.001
R2 = 0.573
-6.0%
-4.0%
-2.0%
0.0%
2.0%
4.0%
6.0%
-6.0% -4.0% -2.0% 0.0% 2.0% 4.0% 6.0% 8.0% 10.0% 12.0%
Output
Em
plo
ym
en
tEconomic Growth:1960-2009
-6.0%
-4.0%
-2.0%
0.0%
2.0%
4.0%
6.0%
8.0%
10.0%
12.0%
1960Q1 1964Q1 1968Q1 1972Q1 1976Q1 1980Q1 1984Q1 1988Q1 1992Q1 1996Q1 2000Q1 2004Q1 2008Q1
GDP Trend1 Trend2
1.One way to assess LT economic growth is to examine the trends in YoY growth rates
• LT trend has been downward since the 50s
• The non-linear trend followed it until this decade when it “fell off a cliff”
2.There is a circular relationship between Growth and Employment. Higher growth increases Employment which then raises demand and increases growth
• We need ~ 2.5% Employment growth for breakeven
• We need 3.0%+ to return to prosperity
• At 4.0% GDP growth we’ll get only 2.5% Employment growth
• To get higher growth means more Savings, more Investment and creating new Industries and Jobs.
Strategy without execution is fantasy. Execution without Strategy is thrashing. And without a Management System
both are improbable
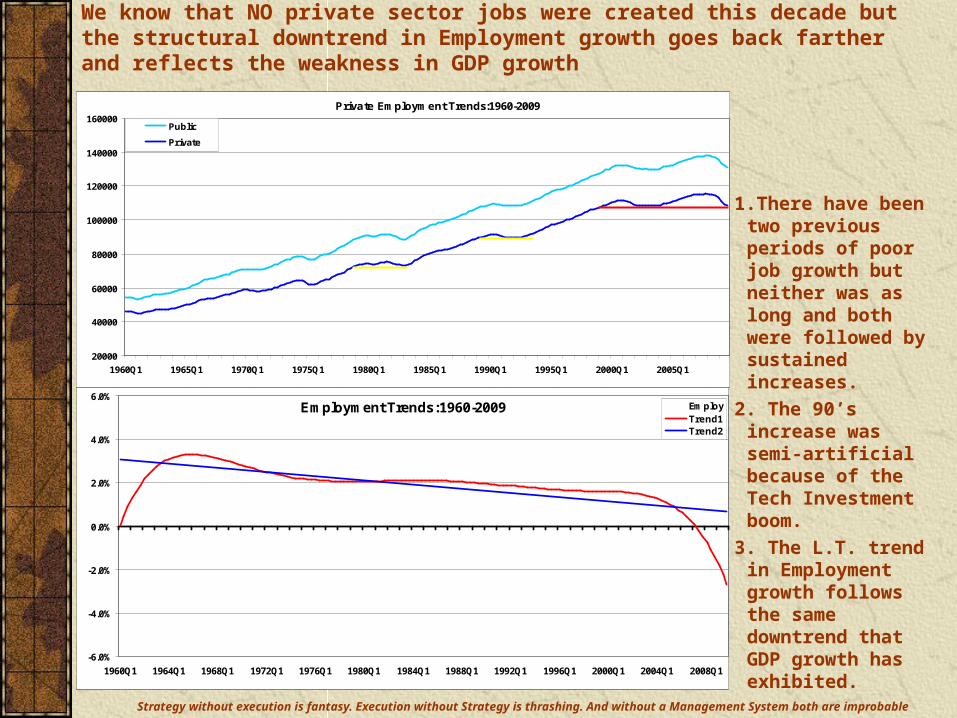
We know that NO private sector jobs were created this decade but the structural downtrend in Employment growth goes back farther and reflects the weakness in GDP growth
20000
40000
60000
80000
100000
120000
140000
160000
1960Q1 1965Q1 1970Q1 1975Q1 1980Q1 1985Q1 1990Q1 1995Q1 2000Q1 2005Q1
Public
Private
Private Employment Trends:1960-2009
Employment Trends:1960-2009
-6.0%
-4.0%
-2.0%
0.0%
2.0%
4.0%
6.0%
1960Q1 1964Q1 1968Q1 1972Q1 1976Q1 1980Q1 1984Q1 1988Q1 1992Q1 1996Q1 2000Q1 2004Q1 2008Q1
EmployTrend1Trend2
1.There have been two previous periods of poor job growth but neither was as long and both were followed by sustained increases.
2. The 90’s increase was semi-artificial because of the Tech Investment boom.
3. The L.T. trend in Employment growth follows the same downtrend that GDP growth has exhibited.

Strategy without execution is fantasy. Execution without Strategy is thrashing. And without a Management System
both are improbable
Recovery from this downturn and getting traction back to sustained growth will be especially challenging because of the depth of the downturn and structural weaknesses in Employment.
1.Both the average and median duration of Unemployment have trended upward over the last several decades
2. But sky-rocketed in this downturn to historically unprecedented levels.
3. Part, a large part of that, is due to the diversion of Employment to Housing, Construction and Finance because of the last two decades distortions.
4. What is beyond worrisome though is that the levels of Unemployment lasting longer than 26 weeks are extremely high AND break all previous historical patterns. Another sign of structural weakness and long-term problems.
5.As the result of structural shifts and legislative changes more of the population entered the workforce in the 70s and 80s.
6.The Participation Rate fell off a cliff; I. E. a lot of people have been driven from the labor force by the downturn’s severities.
Strategy without execution is fantasy. Execution without Strategy is thrashing. And without a Management System
both are improbable
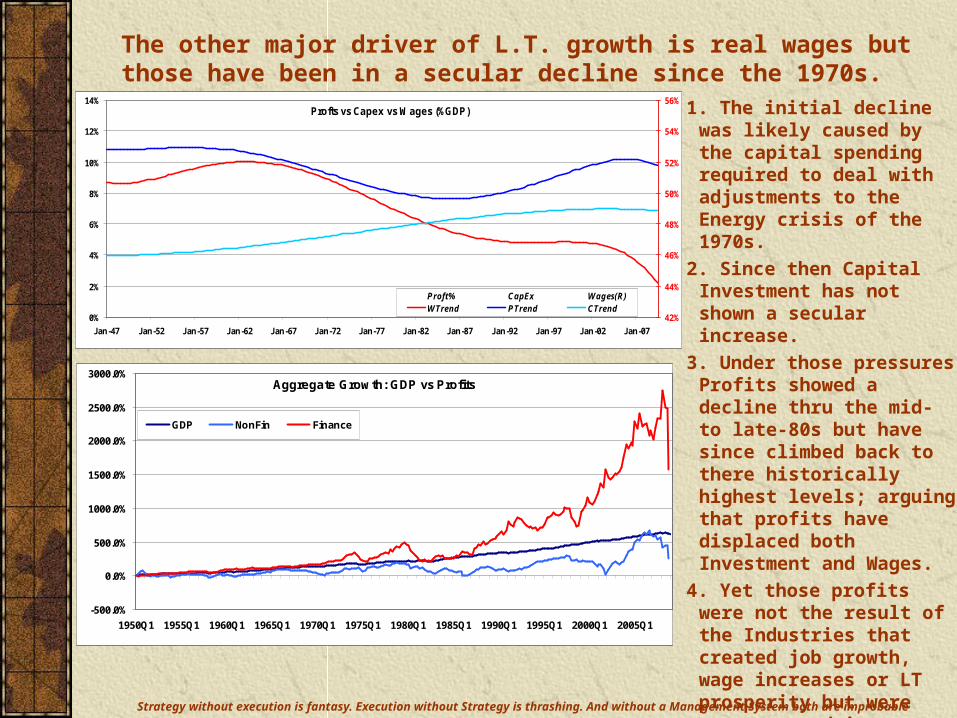
The other major driver of L.T. growth is real wages but those have been in a secular decline since the 1970s.
0%
2%
4%
6%
8%
10%
12%
14%
Jan-47 Jan-52 Jan-57 Jan-62 Jan-67 Jan-72 Jan-77 Jan-82 Jan-87 Jan-92 Jan-97 Jan-02 Jan-07
42%
44%
46%
48%
50%
52%
54%
56%
Proft% CapEx Wages(R)WTrend PTrend CTrend
Profts vs Capex vs Wages (%GDP)
-500.0%
0.0%
500.0%
1000.0%
1500.0%
2000.0%
2500.0%
3000.0%
1950Q1 1955Q1 1960Q1 1965Q1 1970Q1 1975Q1 1980Q1 1985Q1 1990Q1 1995Q1 2000Q1 2005Q1
GDP NonFin Finance
Aggregate Growth: GDP vs Profits
1. The initial decline was likely caused by the capital spending required to deal with adjustments to the Energy crisis of the 1970s.
2. Since then Capital Investment has not shown a secular increase.
3. Under those pressures Profits showed a decline thru the mid- to late-80s but have since climbed back to there historically highest levels; arguing that profits have displaced both Investment and Wages.
4. Yet those profits were not the result of the Industries that created job growth, wage increases or LT prosperity but were concentrated in Finance.

Strategy without execution is fantasy. Execution without Strategy is thrashing. And without a Management System
both are improbable
What has grown at far above LT economic growth rates is total private debt – Consumer, Business but especially Finance
0
10000000
20000000
30000000
40000000
50000000
60000000
1945 1950 1955 1960 1965 1970 1975 1980 1985 1990 1995 2000 2005
Household BusinessS&L Gov Fed GovFinance RoW
Total Real Debt Oustanding ($M)
0.00
0.50
1.00
1.50
2.00
2.50
3.00
3.50
4.00
1945 1950 1955 1960 1965 1970 1975 1980 1985 1990 1995 2000 2005
Household Business
S&L Gov Fed Gov
Finance RoW
Total Real Debt Oustanding (GDP Multiple)
0.0
20.0
40.0
60.0
80.0
100.0
120.0
140.0
1945 1950 1955 1960 1965 1970 1975 1980 1985 1990 1995 2000 2005
RoW
Fed Gov
S&L Gov
Business
Household
Real Debt Relative Growth (Normalized)
0.0
200.0
400.0
600.0
800.0
1000.0
1200.0
1400.0
1945 1950 1955 1960 1965 1970 1975 1980 1985 1990 1995 2000 2005
Finance
Real Debt Relative Growth (Normalized)
Overall total debt, private and public, grew at a relatively low rate until the mid-80s, though Public debt decreased relative share. Beginning with de-regulation Consumer and Business debt accelerated while Finance debt – largely used for internal industry speculation? – metastasized!
The relative growth behaviors are even clearer when looked at as GDP multiples. Until 1985 Consumer:GDP was about 0.6 and then exploded this decade to ~ 1.0. Business debt grew from .3 in 50 to .6 in 85 and then. Meanwhile Finance debt went form 0.1 to 0.3 and then exploded to ~ .9 by 2000 and then soared to 1.2 by 2008! In other words the biggest growth in debt occurred this last 2+ decades for entirely non-productive uses.
Total Non-finance Debt grew over 120% from 1945 to 2008 with Household debt growing about 63% and Business debt 24%. Yet by 1997 Household debt had “only” grown ~30% and Business debt by 13%. In other words the real acceleration occurred in the last 15 or so years. The Grasshoppers definitely decided to partay!
Financial debt is entirely a different story. Since 1945 it has grown about 1200%. From 1945 to 1983 it grew less than 10%. But beginning, coincidently of course with De-Regulation, it grew to 266% by 1990, to 678% by 2000 and to 1200%, almost a doubling in eight years, by 2008. The beginning coincided with De-regulation but the the explosion coincided with the growth of Structured Synthetic Debt and Financial Engineering. None of which seems to have contributed to the long-term health of the overall Economy.

Strategy without execution is fantasy. Execution without Strategy is thrashing. And without a Management System
both are improbable
TANSTAFFAL – what did playing Grasshopper cost us? Our future growth possibly!?
-400%
-200%
0%
200%
400%
600%
800%
1000%
1200%
1948Q1 1953Q1 1958Q1 1963Q1 1968Q1 1973Q1 1978Q1 1983Q1 1988Q1 1993Q1 1998Q1 2003Q1 2008Q1
GDP PCEInvest PerSave
Savings Drives Growth:Cumulative Change
0.0%
2.0%
4.0%
6.0%
8.0%
10.0%
12.0%
Jan-48 Jan-53 Jan-58 Jan-63 Jan-68 Jan-73 Jan-78 Jan-83 Jan-88 Jan-93 Jan-98 Jan-03 Jan-08
-15.0%
-10.0%
-5.0%
0.0%
5.0%
10.0%
15.0%
GDP SavRateInvest(R) InvestRateGrwth Savings
Economic Growth vs Savings Rates Trends
-500%
0%
500%
1000%
1500%
2000%
2500%
1954Q1 1958Q1 1962Q1 1966Q1 1970Q1 1974Q1 1978Q1 1982Q1 1986Q1 1990Q1 1994Q1 1998Q1 2002Q1 2006Q1
PerSave ConDebt
DebtTrnd SavTrnd
Consumer Debt vs Saving(Cumulative Growth)
-30.0%
-25.0%
-20.0%
-15.0%
-10.0%
-5.0%
0.0%
5.0%
10.0%
1954Q1 1959Q1 1964Q1 1969Q1 1974Q1 1979Q1 1984Q1 1989Q1 1994Q1 1999Q1 2004Q1
0.0%
1.0%
2.0%
3.0%
4.0%
5.0%
6.0%
7.0%
8.0%
9.0%
10.0%
PerSave ConDebtDebtTrnd SavTrnd
Debt Savings Growth Trends
Until approximately 1993 GDP, Consumption, Savings and Investment all grew roughly in line with each other, with Savings running ahead. Then we began a secular decline in Savings as Grasshopper Syndrome triumphed though Investment was artificially stimulated by two major bubbles (Tech and Housing – both funded by Financing, not Savings).
Not surprisingly there is a strong inverse relationship between Savings and Consumer Debt. As the latter exploded the former began its secular decline.
Looking at the L.T. trends in YoY growth rates shows us Savings averaging 5.0%/Yr until ~ 1984 when it began its decline followed by a trip off the cliff beginning around 1998. Nothing’s so expensive as keeping up with the Jones except borrowing to do it!
In the short-run reduced Consumption reduces Demand but in the long-run Aesop was right. Long-term sustainable growth results from Savings turned into Investment. Basically when we quite saving and then started borrowing to consume we ate our seed corn, damaged the farm and made it really hard to keep growing new jobs.
Strategy without execution is fantasy. Execution without Strategy is thrashing. And without a Management System
both are improbable
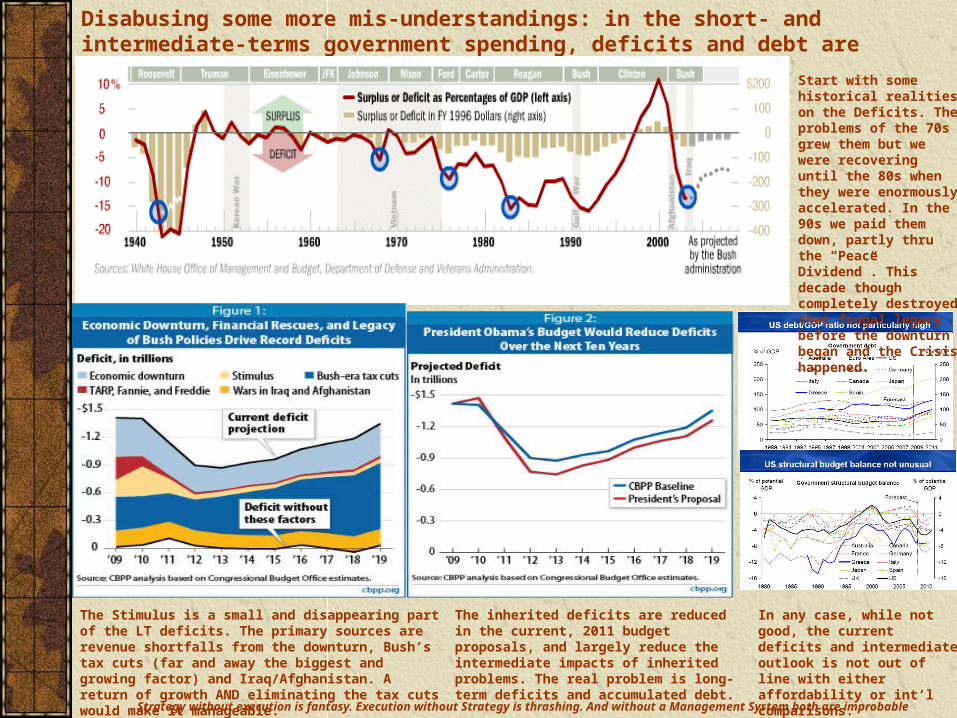
Disabusing some more mis-understandings: in the short- and intermediate-terms government spending, deficits and debt are NOT the problem you think
Start with some historical realities on the Deficits. The problems of the 70s grew them but we were recovering until the 80s when they were enormously accelerated. In the 90s we paid them down, partly thru the “Peace Dividend”. This decade though completely destroyed that frugal legacy before the downturn began and the Crisis happened.
The Stimulus is a small and disappearing part of the LT deficits. The primary sources are revenue shortfalls from the downturn, Bush’s tax cuts (far and away the biggest and growing factor) and Iraq/Afghanistan. A return of growth AND eliminating the tax cuts would make it manageable.
The inherited deficits are reduced in the current, 2011 budget proposals, and largely reduce the intermediate impacts of inherited problems. The real problem is long-term deficits and accumulated debt.
In any case, while not good, the current deficits and intermediate outlook is not out of line with either affordability or int’l comparisons.

Strategy without execution is fantasy. Execution without Strategy is thrashing. And without a Management System
both are improbable
The real L.T. problem is not with immediate challenges or discretionary spending – it is with mandatory entitlement programs and hidden costs.
Most people haven’t a clue as to the real structure of Federal spending or the sources of the deficits. Surveys show that a majority of the voting public thinks Foreign Aid takes 50% of the budget – it’s actually more on the order of 0.3%, or so.
1. The long-term deficit outlook does threaten to explode but the primary sources are metastatic growth in Entitlement programs, which are non-discretionary. Discretionary spending, other than Defense, is a small part of the Budget and can never make up the shortfall.
2. Fixing Social Security and related programs is relatively straight-forward, largely by adjusting age eligibility limits to roughly match what they were at creation. The real problem is exponentiating Healthcare costs – either we bend the cost curve or nobody will have insurance of any form AND no coverage plus the Country will be bankrupt in the great bye-n-bye.
3. A third major source of deficits is simply to return tax rates to what they were under Clinton.
4. A fourth is to reduce or eliminate tax expenditures – otherwise known as exemptions or loopholes. That’s a pool of $1T, larger than Social Security and almost twice Medicare. It’s also growing at 3-4X the inflation rate, which is even faster than HC costs!
5. The bottomline here is that the L.T. Deficit and Debt problems are eminently addressable if we choose to address them.

Strategy without execution is fantasy. Execution without Strategy is thrashing. And without a Management System
both are improbable
The other, real L.T. problem is restoring prosperous growth
Arrest &Stimulate
Stimulate &Grow
Self-sustainingOrganic Growth
Re-baseEconomy
Output
Time
From Crisis to Recovery: Four Phases
Emergency
Direct Spending
Strategic Investment
GovernmentSpending
Time
Economic Recovery: Multi-phase Stimulus & Investment
Efficiency InvestmentsInfrastructure …
Follow-on Spending
•Energy•Healthcare•Education•INNOVATION
To fix out long-term problems will not happen overnight but it is feasible and workable. It will take time, awareness and commitment – the political will to act.
1. The Economy is not out of the woods short-term, not having reached sustainable take-off and in some risk of a double-dip.
2. If and when we reach organic growth that L.T. potential is still going to be below a rate which returns us to general and widespread prosperity.
3. A key requirement is to shift from a nation of debt-fueled Consumption to a nation of productive investors, fueled by Savings.
4. But to really return to higher than 2.5% growth will require the creation of new Innovations,Industries and Jobs.
5. A key intermediate-term requirement is to repair the accumulated damage of three decades of neglect to things like our Infrastructure.
6. in the long-run to regain higher rates of growth requires fixing Healthcare, Education and Energy.
7. And a concerted national effort at Innovation.
8. All of which is affordable by doing four things:
a.Re-structure existing entitlement programs.
b.Bend the cost curves on Healthcare
c.Modestly increase taxes
d.Reduce tax expenditures (which carried far enough might actually allow taxes to be lowered!!)