sketch based interface for architectural design · sketch based interface for architectural design...
TRANSCRIPT

SKETCH BASED INTERFACE FORARCHITECTURAL DESIGN
By
Eric Zhang
A Thesis Submitted to the Graduate
Faculty of Rensselaer Polytechnic Institute
in Partial Fulfillment of the
Requirements for the Degree of
MASTER OF SCIENCE
Major Subject: COMPUTER SCIENCE
Approved by theExamining Committee:
Dr. Barbara Cutler, Thesis Adviser
Dr. Charles Stewart, Member
Dr. Randolph Franklin, Member
Rensselaer Polytechnic InstituteTroy, New York
July 2016(For Graduation August 2016)

c© Copyright 2016
by
Eric Zhang
All Rights Reserved
ii

CONTENTS
LIST OF TABLES . . . . . . . . . . . . . . . . . . . . . . . . . . . . . . . . . . vi
LIST OF FIGURES . . . . . . . . . . . . . . . . . . . . . . . . . . . . . . . . . . vii
ACKNOWLEDGMENTS . . . . . . . . . . . . . . . . . . . . . . . . . . . . . . ix
ABSTRACT . . . . . . . . . . . . . . . . . . . . . . . . . . . . . . . . . . . . . x
1. INTRODUCTION . . . . . . . . . . . . . . . . . . . . . . . . . . . . . . . . 1
1.1 Architectural Drawings and Sketches . . . . . . . . . . . . . . . . . 1
1.1.1 Sketches . . . . . . . . . . . . . . . . . . . . . . . . . . . . . . 2
1.1.2 Drafting . . . . . . . . . . . . . . . . . . . . . . . . . . . . . . 4
1.2 The Architectural Design Process . . . . . . . . . . . . . . . . . . . . 7
1.3 Benefits of Sketching in Design . . . . . . . . . . . . . . . . . . . . . 8
1.4 Thesis Outline and Contributions . . . . . . . . . . . . . . . . . . . . 10
2. RELATED WORKS . . . . . . . . . . . . . . . . . . . . . . . . . . . . . . . 11
2.1 OASIS . . . . . . . . . . . . . . . . . . . . . . . . . . . . . . . . . . . 11
2.2 Previous Work on OASIS . . . . . . . . . . . . . . . . . . . . . . . . . 12
2.3 Stroke Recognition . . . . . . . . . . . . . . . . . . . . . . . . . . . . 15
2.3.1 Human Input Recognition . . . . . . . . . . . . . . . . . . . . 16
2.3.2 Other Recognizers . . . . . . . . . . . . . . . . . . . . . . . . 17
2.3.3 $N Recognizer . . . . . . . . . . . . . . . . . . . . . . . . . . 18
2.4 Related Software . . . . . . . . . . . . . . . . . . . . . . . . . . . . . 20
2.5 Summary . . . . . . . . . . . . . . . . . . . . . . . . . . . . . . . . . . 22
3. System Overview . . . . . . . . . . . . . . . . . . . . . . . . . . . . . . . . 23
3.1 OASIS Pipeline . . . . . . . . . . . . . . . . . . . . . . . . . . . . . . 23
3.2 System Pipeline . . . . . . . . . . . . . . . . . . . . . . . . . . . . . . 24
3.3 Stroke Processing . . . . . . . . . . . . . . . . . . . . . . . . . . . . . 26
3.3.1 Stroke Resampling . . . . . . . . . . . . . . . . . . . . . . . . 26
3.3.2 Line of Best Fit . . . . . . . . . . . . . . . . . . . . . . . . . . 28
3.3.3 LengthRatio . . . . . . . . . . . . . . . . . . . . . . . . . . . . 28
3.4 Sketching Interface Actions . . . . . . . . . . . . . . . . . . . . . . . 29
iii
3.4.1 Walls and Windows . . . . . . . . . . . . . . . . . . . . . . . 303.4.2 Deleting Strokes . . . . . . . . . . . . . . . . . . . . . . . . . 313.4.3 Cardinal Direction . . . . . . . . . . . . . . . . . . . . . . . . 33
3.5 System Design and Implementation Details . . . . . . . . . . . . . . 343.5.1 Intermediate Primitives File . . . . . . . . . . . . . . . . . . . 343.5.2 Technologies . . . . . . . . . . . . . . . . . . . . . . . . . . . . 35
3.6 Chapter Summary . . . . . . . . . . . . . . . . . . . . . . . . . . . . . 35
4. Recognition . . . . . . . . . . . . . . . . . . . . . . . . . . . . . . . . . . . . 37
4.1 Recognition Pipeline . . . . . . . . . . . . . . . . . . . . . . . . . . . 38
4.2 Combinations of Strokes . . . . . . . . . . . . . . . . . . . . . . . . . 39
4.3 Rectangle Recognizer . . . . . . . . . . . . . . . . . . . . . . . . . . . 414.3.1 Rectangle Metrics . . . . . . . . . . . . . . . . . . . . . . . . . 41
4.3.1.1 Line Ending Comparison . . . . . . . . . . . . . . . 414.3.1.2 Line Straightness . . . . . . . . . . . . . . . . . . . . 424.3.1.3 Perpendicular Angles . . . . . . . . . . . . . . . . . 424.3.1.4 Alternate Solution . . . . . . . . . . . . . . . . . . . 44
4.4 Classification . . . . . . . . . . . . . . . . . . . . . . . . . . . . . . . . 44
4.5 Rectangle Fitting . . . . . . . . . . . . . . . . . . . . . . . . . . . . . 45
4.6 Stroke Removal . . . . . . . . . . . . . . . . . . . . . . . . . . . . . . 48
4.7 Reclassification . . . . . . . . . . . . . . . . . . . . . . . . . . . . . . 49
4.8 Chapter Summary . . . . . . . . . . . . . . . . . . . . . . . . . . . . . 51
5. Pilot User Study . . . . . . . . . . . . . . . . . . . . . . . . . . . . . . . . . 53
5.1 Study Conditions and Methods . . . . . . . . . . . . . . . . . . . . . 53
5.2 Questions and Goals . . . . . . . . . . . . . . . . . . . . . . . . . . . 535.2.1 Questions . . . . . . . . . . . . . . . . . . . . . . . . . . . . . 54
5.3 Responses and Analysis . . . . . . . . . . . . . . . . . . . . . . . . . 55
5.4 Chapter Summary . . . . . . . . . . . . . . . . . . . . . . . . . . . . . 58
6. CONCLUSION AND FUTURE WORK . . . . . . . . . . . . . . . . . . . . 59
6.1 Conclusion . . . . . . . . . . . . . . . . . . . . . . . . . . . . . . . . . 59
6.2 Future Work . . . . . . . . . . . . . . . . . . . . . . . . . . . . . . . . 596.2.1 Dynamic Recognition . . . . . . . . . . . . . . . . . . . . . . 596.2.2 Group Sketching . . . . . . . . . . . . . . . . . . . . . . . . . 606.2.3 Multiple View Sketching . . . . . . . . . . . . . . . . . . . . . 616.2.4 Pilot Study Improvements . . . . . . . . . . . . . . . . . . . . 61
iv

REFERENCES . . . . . . . . . . . . . . . . . . . . . . . . . . . . . . . . . . . . 63
v

LIST OF TABLES
4.1 Furniture height to width comparisons. . . . . . . . . . . . . . . . . . . 45
vi

LIST OF FIGURES
1.1 Example of a quick architectural sketch . . . . . . . . . . . . . . . . . . 2
1.2 Example of an architectural sketch - elevation view . . . . . . . . . . . 3
1.3 Example of a hand drawn architectural sketch - floorplan . . . . . . . 5
1.4 Example of a room designed using CAD software . . . . . . . . . . . . 6
1.5 Design sketch examples drawn when tasked with designing a website. 9
2.1 Image of the sketching interface used in OASIS . . . . . . . . . . . . . 12
2.2 OASIS bug report and help menu additions . . . . . . . . . . . . . . . 14
2.3 Examples of handwriting variations . . . . . . . . . . . . . . . . . . . . 16
2.4 Examples of stroke permutations . . . . . . . . . . . . . . . . . . . . . 20
3.1 OASIS pipeline diagram . . . . . . . . . . . . . . . . . . . . . . . . . . 24
3.2 Sketching interface system pipeline diagram . . . . . . . . . . . . . . . 25
3.3 System pipeline diagram . . . . . . . . . . . . . . . . . . . . . . . . . . 26
3.4 How to create a wall using the sketching interface . . . . . . . . . . . 30
3.5 How to create a window using the sketching interface . . . . . . . . . 31
3.6 How to delete a stroke by scribbling . . . . . . . . . . . . . . . . . . . . 32
3.7 How to overdraw a previous stroke . . . . . . . . . . . . . . . . . . . . 33
3.8 Comparison of cardinal direction changes between interfaces . . . . . 34
4.1 Comparisons between methods of drawing a rectangle using differ-ent amounts of lines. . . . . . . . . . . . . . . . . . . . . . . . . . . . . . 37
4.2 Recognition pipeline diagram . . . . . . . . . . . . . . . . . . . . . . . 39
4.3 Iterative step images taken during the rectangle fitting process . . . . 48
4.4 Removal of objects when a stroke is removed . . . . . . . . . . . . . . 49
4.5 Examples of recognized objects . . . . . . . . . . . . . . . . . . . . . . 50
4.6 Image of the reclassification menu . . . . . . . . . . . . . . . . . . . . . 50
vii

4.7 Example of reclassification with recognition . . . . . . . . . . . . . . . 51
5.1 Comparison of user designed models . . . . . . . . . . . . . . . . . . . 56
5.2 Additional user created drawings for the pilot study . . . . . . . . . . 56
5.3 Examples of windows not snapping correctly . . . . . . . . . . . . . . 57
viii

ACKNOWLEDGMENTS
I would like to thank my thesis adviser, Dr. Barbara Cutler, for her thoughtful
advice, experience, and feedback throughout the creation of this thesis. I would
like to thank my lab mates Max Espinoza, Sensen Chen, Jim Olyha, and Jeramey
Tyler for their helpful suggestions and criticism of my work. I would also like to
thank all of my friends I’ve met at RPI, for they’ve made my experience here all
the more worthwhile. Finally, I’d like to thank my parents, Weixian Zhang and
Popo Chan, for their unwavering support throughout my education, for without
them none of this would be possible.
ix

ABSTRACT
The use of sketching amongst architects contributes significant benefits in the cre-
ation of creative and professional projects. Sketching offers a simple method of
conveying ideas to an audience, without a large time commitment. As a result, ar-
chitects can prototype designs rapidly, exploring many patterns while receiving
feedback on their work. Sketching influences the design process by allowing the
designer to work more creatively and effectively through quick, numerous itera-
tions. The use of sketching in architectural design interfaces has only increased
the flexibility and possible designs for users. However, variation in human input
increases the difficulty to accurately recognize the intent of the user. Traditional
methods of interacting with architectural design interfaces rely on creation of
fixed sized primitives. When interacting with such systems, design options feel
more limited.
I present an alternative sketch-based interface for the Online Architectural
Sketching Interface for Simulations. This interface emulates drawing using paper
and pencil, allowing the user to create lines on a canvas. Using the user input, the
interface recognizes certain series of strokes as objects, creating furniture items as
feedback to the user. The strokes are also processed by the system as different
gestures, allowing the user a multitude of options to edit designs.
Contributions of this thesis include the development of an architectural
sketching interface, algorithms to perform recognition and fitting of interface
primitives, and conduction of a pilot study.
x

CHAPTER 1INTRODUCTION
A sketch is a rough or unfinished drawing that represents the essential features
without all the details. However, the absence of detail in a sketch does not make it
less significant than a finished drawing. Sketches allow designers to express their
ideas to others in a quick manner, without committing themselves fully. The ag-
ile nature of sketches also allow designers to rapidly prototype many ideas while
receiving feedback on their work. With this combination of traits, sketching be-
comes the ideal method of exploring and refining new ideas.
The purpose of sketching is twofold: to convey ideas to others and to ex-
plore new designs. It is simple to imagine a concept in your head for yourself, it is
a completely different challenge to communicate that concept to another person.
The ability to effectively communicate your ideas to a client or peers is invalu-
able in saving time and stimulates productive conversation on the design itself.
Sketching is helpful in getting across basic elements about an idea without spend-
ing too much time on smaller details. Due to the speed at which sketches can be
produced, a designer can afford to explore new, untested ideas. The designer
can then aggregate the best qualities, or learn what to avoid in future designs.
The two purposes of sketching are closely related and can used to build off one
another.
1.1 Architectural Drawings and Sketches
Architects create many sketches and drawings when designing a structure,
each with varying degrees of detail. Each image serves its own purpose and has
its place within the architectural design process. Sketches are appropriate earlier
in the design process when an image’s main purpose is to express the architect’s
design and meet the owner’s goals and expectations, while drafts are more ap-
propriate later in the process when contractors need to approximate cost and
1

2
physically construct the building. Typically, as the process progresses, the level
of detail increases. As more details are finalized, and less pieces of the design are
left to interpretation.
1.1.1 Sketches
Figure 1.1: A quick sketch depicting the front view of the Lombard Building onQueen Street, Melbourne. Sketched by Aushist, used under GNU Free Documen-tation License [1].
Sketches are among the most basic drawings created by architects. Their
simplicity in creation and design allow for quick modification of ideas and ease
of understanding of general concepts. No initial sketch needs to have correct
scale or the dimension numbers, as long as the ideas of the designer reach his or
her intended audience. Without too much detail, audience can focus on the key
3
details the designer has purposefully chosen to include in the sketch. A sketch is
the perfect vehicle for rapid prototyping and design analysis, without the accu-
racy and time commitment required for producing a draft.
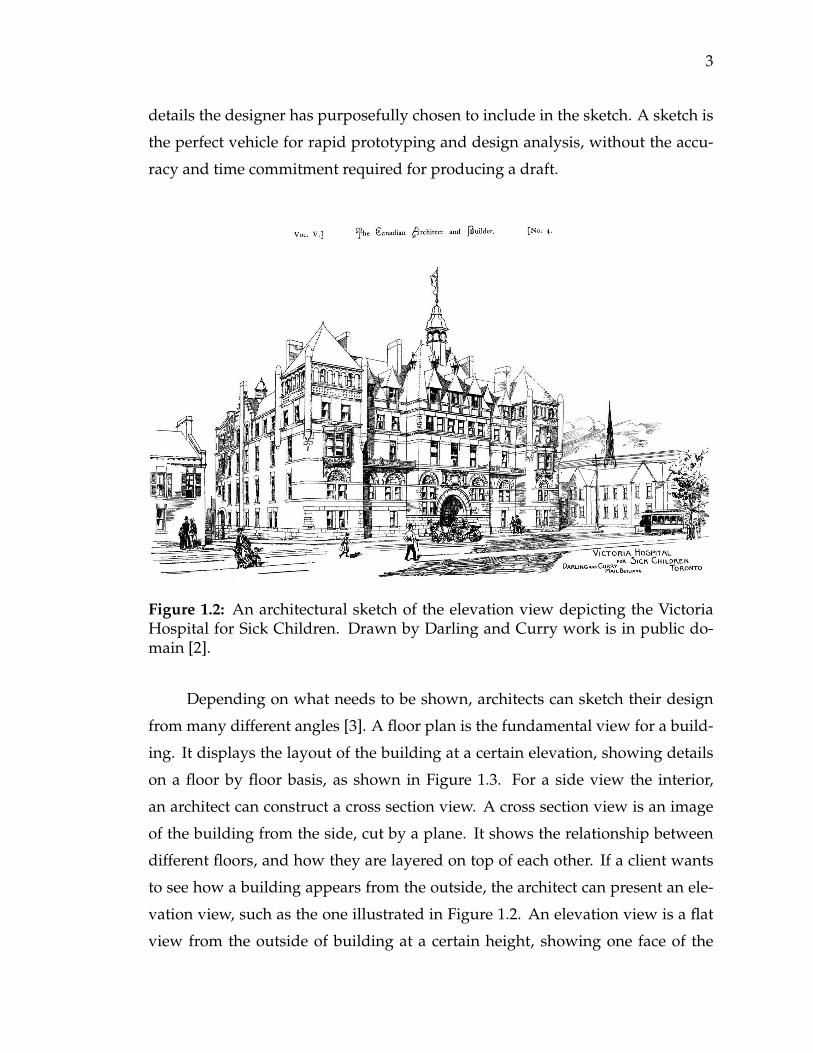
Figure 1.2: An architectural sketch of the elevation view depicting the VictoriaHospital for Sick Children. Drawn by Darling and Curry work is in public do-main [2].
Depending on what needs to be shown, architects can sketch their design
from many different angles [3]. A floor plan is the fundamental view for a build-
ing. It displays the layout of the building at a certain elevation, showing details
on a floor by floor basis, as shown in Figure 1.3. For a side view the interior,
an architect can construct a cross section view. A cross section view is an image
of the building from the side, cut by a plane. It shows the relationship between
different floors, and how they are layered on top of each other. If a client wants
to see how a building appears from the outside, the architect can present an ele-
vation view, such as the one illustrated in Figure 1.2. An elevation view is a flat
view from the outside of building at a certain height, showing one face of the

4
structure. Since most buildings are not the same at all angles, elevation views
from multiple angles may be constructed. One particular angle is an isometric
angle, which is a view where the angles between the projections of all axes are
equivalent. As shown in the left image in Figure 1.1, an isometric view displays
the outside only, and shows the connections between outside elements. To show
the context around where a building is located, a site plan is created. It is an over-
head view, similar to a floor plan, but it displays the whole property instead of
one building. When designing a building, an architect will create most, if not all,
of these views to present to the owner so he/she can accurately understand the
architect’s ideas.
1.1.2 Drafting
Before an architect’s design can become a building, architectural drafts of
the design need to be created. Drafts are extremely high detail drawings depict-
ing dimensions, structure, and layout of a building [3]. There exists drafts of
many aspects of the building, such as electrical, plumbing, and structural. These
drafts help guide the contractors to construct the building according to the de-
sign and specifications set by the architect and owner. Before the existence of
computer-aided drafting (CAD) software, drafts were created meticulously by
hand. Drafts were checked by many people; small mistakes could have massive
consequences on the structure of a building.
With the rise of computing power through the 1970’s and 1980’s, so too did
the benefits of switching over to computer-aided drafting (CAD). CAD software
drastically increased the quality of designs produced, improved communication
between architects and engineers, and boosted productivity [5]. CAD software
creates more accurate drafts, without object scales needing to be manually veri-
fied. Control over information about structure, electricity, plumbing and much
more are all organized and displayable on a whim. Editing the project is no
longer as tedious; objects can be deleted, copied, rotated, and scaled, with few
button clicks. The benefits of using CAD software are immense, and its preva-
lence in fields such as architecture and engineering reflects that.

5
Figure 1.3: A hand drawn architectural floorplan of Memorial Hall (Harvard Uni-versity). Author unknown, work is in public domain [4].
The sheer strength of the tools available with CAD software dwarfs the
power of a person with pencil and paper, and the drawings produced by both
mirrors that imbalance. To produce a draft with the same quality, a hand drawn
6
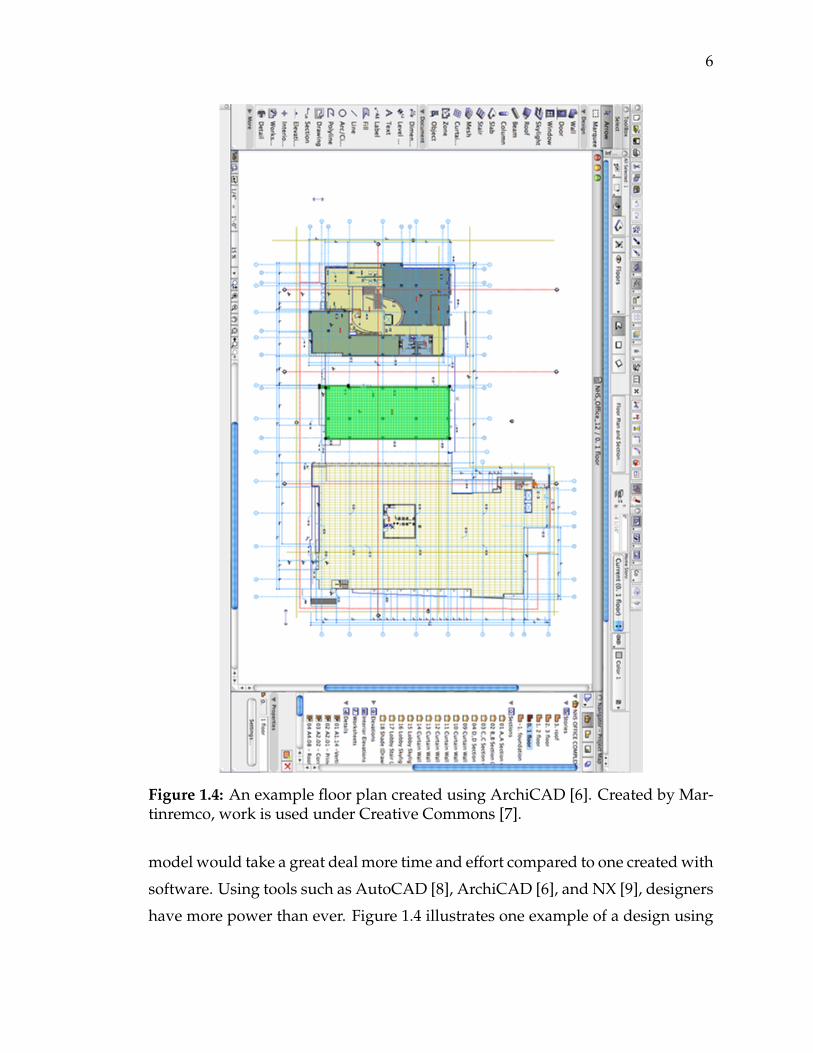
Figure 1.4: An example floor plan created using ArchiCAD [6]. Created by Mar-tinremco, work is used under Creative Commons [7].
model would take a great deal more time and effort compared to one created with
software. Using tools such as AutoCAD [8], ArchiCAD [6], and NX [9], designers
have more power than ever. Figure 1.4 illustrates one example of a design using

7
ArchiCAD. However, using CAD software is not without its downsides. Com-
pared to drawing on paper, a large amount of training or familiarity with the
program is required to proficiently create drafts. Improper use of software can be
a hindrance when designing, making other tasks more difficult. Since software
is constantly changing, there continues to be more learning required, especially
with large updates or feature changes. Despite all the drawbacks, CAD software
continues to be a leading choice for many architects and engineers.
1.2 The Architectural Design Process
Architects often follow a five step process from design to completion of a
building. The five phases are: schematic design, design development, construc-
tion documents, bid or negotiation, and construction administration [10]. During
the schematic design phase, the architect and client work together to determine
the goals and needs of the project. The architect creates drawings and documents
to accurately show their concept to the owner. He or she also researches zoning
and jurisdictional restrictions to present to the client. At the end of this phase, the
architect will produce a final schematic design that will be the basis for cost, de-
sign, and development. Next, during the design development phase, details for
multiple elements of the building are finalized, including windows, walls, and
doors. Structural details such as plumbing and electrical are also settled upon.
After, the construction documents are created with the information from the de-
sign development phase. A schematic design is created with even greater detail
for contractors to pricing and bidding. Afterwards, bids and negotiation begin
for the construction of the building. The owner and architect will review bids
and select a contractor to construct the building. Finally, the construction begins
on the project. Though out construction of the building, The architect will con-
tinue to help the contractor build the project as specified in the documents created
during the construction documents phase.
Design plays a crucial role in the architectural design process. Each phase
builds off the work done in previous stages, so the design done during the schematic

8
design phase is the foundation for the rest of the project. Our focus in this thesis
work is to improve the schematic design phase of the architectural design pro-
cess. We hope to facilitate more efficient exploration of new ideas, as well as a
smoother transition into the next phase.
1.3 Benefits of Sketching in Design
The term ”design” can be used to describe many different actions or cre-
ations across many fields. References can be drawn to graphic design in art, en-
gineering design, the design of computer code, design of production processes,
even the process of design itself [11]. In some cases, design can be construction of
the object itself, such as a piece of artwork. In essence, design is the manifestation
of an idea into a plan or drawing to accomplish some task or goal. For example,
when tasked with designing a website, I sketched out some designs before con-
structing anything. The results are show in Figure 1.5. Being able to design well
means merging individual components together cohesively to accomplish some
objective. Achieving the goal in the most efficient and elegant way possible is the
ambition of all designers.
There are many benefits to sketching ideas when designing. Throughout
the design process, sketching is invaluable for communicating ideas [12]. Sketch-
ing is a self reflective process, and allows for the designer to efficiently map out
their thoughts in a manner that makes more sense [11]. Seeing, moving, im-
proving their designs helps users increase their design proficiency [13]. Song
and Agogino [14] observed that there was a positive correlation between usage
of sketches and the user’s design outcome. The process of making sketches to
solve problems also induces a ’design reasoning’ that increases visual thinking
and puzzle solving [15]. Studies have shown that not only did sketching allow
the designer to think more creatively, it also stimulated the clients those designers
were working for [16]. When sketching, designers more often than not changed
their original ideas and formed new ones, while those who used a drawing pro-
gram were more limited in what they created. There have been positive correla-

9
Figure 1.5: Sketches drawn when tasked with designing a website.
tions found between number of designs and the outcome, as observed by Yang
[17]. In the early design process, self made sketches increased the quality of solu-
tions proposed, as well as having an overall positive impact on the final product.
Users who had the opportunity to sketch their ideas in the design phase found
the problems to be significantly easier and this solution quality increased [16].
These user thought the solution was much more intuitive and were able to logi-
cally progress through a solution more quickly for the problem at hand.
A similar process can be used in architectural sketching implementations.
The ability to sketch out ideas can have a positive impact on the overall end prod-
uct. The importance of sketching to an architect cannot be understated. Sketching
as a tool has been observed to be valuable when used for creative tasks [16]. Uti-
lizing the creative power of sketching, we aim to create an interface that improves

10
the design potential of all its users.
1.4 Thesis Outline and Contributions
This thesis is motivated by the creation of the Online Architectural Sketch-
ing Interface for Simulations (OASIS) [18]. There was a desire to create a more
novel, cohesive, and intuitive way to design models. The previous iteration of
OASIS utilized a drag-and-drop user interface for creating designs. To improve
the system, imitating how architects design buildings seemed like the most logi-
cal option. Architects design buildings first on pencil and paper, then transition
to a CAD program to add further detail. By accepting inputs as strokes, we hope
to give the user freedom and flexibility that was not available in the previous it-
eration.
The first step in creating a solution that met our goals was to create a pro-
cess that accepted user input in the form of strokes. Chapter 2 outlines some of
the work leading up to the creation of this sketching interface. Next, chapter 3
explains the pipeline of OASIS, how this work modifies and improves previous
features, and basic elements of the interface. Chapters 4 details how the sys-
tem uses the simple strokes input by the user to create a design that matches the
user’s intentions. Chapter 5 includes a small informal pilot study on the usage of
the current interface against the previous one. Finally, chapter 6 concludes with
closing remarks and potential directions for further improvements and research.

CHAPTER 2RELATED WORKS
Sketch interpretation on a computer interface is not trivial to implement. While
recording user input is not difficult, it is challenging to interpret the user’s in-
tent correctly. Drawings and sketches created by users are often ambiguous and
difficult to understand for an application. The minute differences between user
actions can result in the system returning vastly different outcomes. Higher de-
grees of accuracy often require large amounts of data, demanding higher com-
puter specifications to execute properly. With greater resources demanded, it
becomes increasingly difficult for sketch interpretation to become available for
widespread use.
In this chapter, I will outline some work done on OASIS prior to the de-
velopment of this sketching interface. We will also discuss some related works
regarding sketch recognition, and its applicability to this application. Finally, we
discuss some related software and their approaches to reaching similar goals.
2.1 OASIS
OASIS is an online architectural sketching application developed by fel-
low colleague, Max Espinoza [18]. Its primary purpose is to generate closed 3D
meshes with optimal properties for simulations. OASIS is an alternative form
of the Virtual Heliodon, a tangible user interface for daylighting simulation [19].
Currently, OASIS only supports simulating daylight visualizations [18]. To begin,
users create 2D floor plans using the design interface. Next, OASIS interprets and
constructs 3D models based on the designs. Finally, the tasks may be generated
with various parameters and executed on one of our servers.
There are many design choices available when creating a sketch on OASIS.
Users can create walls, windows, beds, desks, and wardrobes. All furniture items
are editable and easily configurable. Along with basic primitives, a cardinal ori-
11

12
Figure 2.1: Image of the sketching interface used in OASIS [18].
entation for the room may be chosen, as well as any location in the world. When
creating daylighting tasks, users have options when simulating the environment
surrounding their rooms. Tasks are editable with dates, times, timezones, and
weather condition. Users also have the option to share their models with others
via URL [18]. A unique link can be shared with family and friends to show off
designs and gather feedback. Overall, OASIS provides a wide array of choices
for users to personalize their designs.
2.2 Previous Work on OASIS
My contributions to OASIS are not limited to the creation of the new sketch-
ing interface. Before the inception of this work, I developed features and fixed

13
bugs to improve user experience on OASIS. The time spent improving the appli-
cation was invaluable for gaining familiarity with the system and learning about
the development process. Using OASIS also helped me realize some of its flaws,
which helped inspire the creation of this thesis. Without this prior experience,
developing a new sketching interface would have been far more difficult.
One contribution was the implementation of a Cron job to regularly select
tasks. Cron is a time based scheduler in Unix-based systems that runs commands
at preset intervals [20]. The implemented Cron job is set to check user submis-
sions at short intervals for newly submitted tasks, and execute them using the
daylight simulation rendering engine. Before the implementation of the Cron
job, there was no method to select one task over another task, and tasks were run
when they were submitted. This could cause problems overloading the server if
too many tasks were queued at the same time. The importance of the Cron job
is to give the system control over which task will be processed next. Currently,
the script selects based on first-come-first-serve. However, the selection process
could be improved in the future to increase fairness between users. For example,
if a User A enters the queue while User B has 100 tasks already in queue, it would
be unfair for User A’s task to be the 101st task processed, even if it was the 101st
task created.
The task tab is where the user can create daylighting simulation tasks for
our server to process. I made a number of improvements to the task tab to im-
prove user experience, including dynamic sizing of the table, additional informa-
tion about the tasks themselves, improved readability, and automatic timezone
estimation. Timezone estimation is based on the user’s choice of location when
designing using the sketching interface. Based on the x and y coordinates of the
location selection, I estimate which timezone it is closest to, and automatically
select that timezone when a user creates a new task.
In daylighting simulations, the importance of windows cannot be under-

14
stated, since the illumination of the room is entirely based on windows. Conse-
quently, there is a high priority for windows to be designed correctly. One en-
hancement to the old sketching interface composed primarily of improved win-
dow snapping. In OASIS, windows are created by switching into window mode
and drawing a stroke near a wall, snapping the window directly onto the wall.
There existed minor issues involving the creation of walls with zero or infinite
slope. If a user created a window and attached it to a wall with a zero or infinite
slope, the window would snap to the maximum length of the wall, regardless of
its intended length. The behavior for wall snapping was improved to attach only
to the nearest wall with a relatively similar slope to the window drawn, with a
maximum length of 90 percent of the wall (5 percent extra room on both ends),
and to snap a window of the user’s intended length regardless of the slope of the
wall. This wall creation procedure heavily influenced the creation of windows in
the new sketching interface.
Figure 2.2: Left: Bug report submission menu. Right: Help menu with directionsbased on page.

15
During some initial user tests, users found it difficult to find help on what
to do, or how to do something. At the same time, we realized it was difficult
to replicate and fix problems described by users in the user feedback section.
Our attempt at solving these problems was the implementation of the help and
bug report menus. These menus, when selected, would replace the space previ-
ous occupied by user feedback. The bug report menu allowed users to submit
bug reports to the developers to improve the website. As shown in Figure 2.2,
information submitted included the intent of the user and methods of reproduc-
tion. Using the information acquired, the goal would be improving the quality
of the site and reducing the number of bugs users encountered. The help menu
included information based on what page the user was browsing, and included
animated gifs to display what actions needed to be done.
OASIS is in a state of constant development and improvement, with help
from a team of dedicated developers and users. From the enhancements listed in
this section, the number of bugs has decreased while the quality of user experi-
ence increased. Using the knowledge gained from prior improvements, I applied
the same concepts in creating this thesis work.
2.3 Stroke Recognition
Since the user’s only input into the sketching interface is a series of recorded
gestures, some method of interpreting those actions is necessary. Recognizing
gestures is difficult because the system needs to recognize that different inputs
can often have the same or similar meaning. The amount of variability in a ges-
ture or stroke is sometimes difficult to account for and sometimes the smallest
inconsistency can create a wildly different classification. At the same time, the
opposite may also be true; an extra action at the end of a gesture may be the
defining difference between two classifications.
16
2.3.1 Human Input Recognition
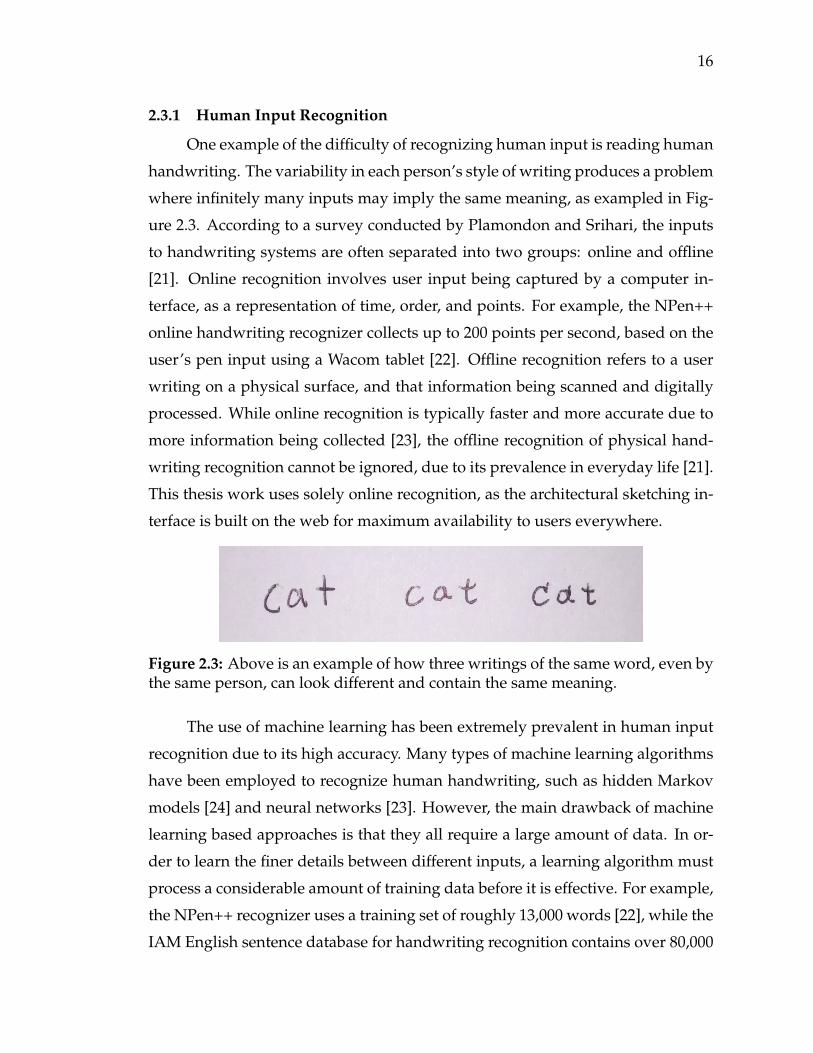
One example of the difficulty of recognizing human input is reading human
handwriting. The variability in each person’s style of writing produces a problem
where infinitely many inputs may imply the same meaning, as exampled in Fig-
ure 2.3. According to a survey conducted by Plamondon and Srihari, the inputs
to handwriting systems are often separated into two groups: online and offline
[21]. Online recognition involves user input being captured by a computer in-
terface, as a representation of time, order, and points. For example, the NPen++
online handwriting recognizer collects up to 200 points per second, based on the
user’s pen input using a Wacom tablet [22]. Offline recognition refers to a user
writing on a physical surface, and that information being scanned and digitally
processed. While online recognition is typically faster and more accurate due to
more information being collected [23], the offline recognition of physical hand-
writing recognition cannot be ignored, due to its prevalence in everyday life [21].
This thesis work uses solely online recognition, as the architectural sketching in-
terface is built on the web for maximum availability to users everywhere.
Figure 2.3: Above is an example of how three writings of the same word, even bythe same person, can look different and contain the same meaning.
The use of machine learning has been extremely prevalent in human input
recognition due to its high accuracy. Many types of machine learning algorithms
have been employed to recognize human handwriting, such as hidden Markov
models [24] and neural networks [23]. However, the main drawback of machine
learning based approaches is that they all require a large amount of data. In or-
der to learn the finer details between different inputs, a learning algorithm must
process a considerable amount of training data before it is effective. For example,
the NPen++ recognizer uses a training set of roughly 13,000 words [22], while the
IAM English sentence database for handwriting recognition contains over 80,000

17
samples [25]. In this work, we choose to take a geometric approach to recognizing
user input. While it may be less accurate and less flexible, a geometric approach
allows for a faster implementation and tighter control on acceptable input.
2.3.2 Other Recognizers
While one recognizer was used most prominently, two other recognizers
were also researched. One was a fuzzy recognizer developed by Fonseca and
Jorge [26]. This fuzzy logic based recognizer first created strokes (a series of
points) and shapes (a recognized stroke), and computed a number of geomet-
ric features based on each strokes. Using the features extracted, Fonseca and
Jorge created rules, along with allowable percentiles to determine the identity of
a stroke. For example, to assist in identifying a circle, they used a thinness ratio,
which is defined as the perimeter square divided by the area of the convex hull.
For different shapes, the allowed values for each of the ratios differed. When
a user entered a stroke, the features would be extracted, and ratios calculated.
Based on the ratios, a likely candidate could be chosen. Possible classifications
included arrows, squares, rectangles, triangles, and circles.
While the accuracy of the implementation was high (over 90 percent suc-
cessfully recognized [26]), and the design was simple to understand and imple-
ment, a few factors led me to not pursue this any further. The implementation
seemed to require heavy micromanagement of ratios. The implementation did
not offer any methods of calculating the cutoffs using training data, leaving me
to infer the adjustments were made by hand. While it appeared to work very well
on geometric shapes, I had a difficult time recreating the process well on symbols
such as letters of the alphabet. The metrics work well on simply defined user
input such as as square or triangle, and it worked well on simple letters such as
‘C‘ or ‘T‘, but I found it difficult to mathematically define more complex letters
such as ‘B‘ or ‘Q‘. When creating this application, the initial idea was to classify
objects using letters as identifiers. Without a confident method of identifying let-

18
ters, I felt I could not proceed at the time. Overall the fuzzy logic recognizer was
intriguing and promising but did not fit my goals and purposes.
Another recognizer researched was a HMM machine learning based rec-
ognizer created by Hu et. al [24]. This recognizer used a ‘left-to-right‘ hidden
Markov model to score features such as stroke tangents, translation, rotation, and
scaling. A hidden Markov model is a model in which the system being modeled
is assumed to be a Markov process with hidden states. A Markov process is one
that satisfies the Markov property, which states that all states of the process are
based solely on the current state. In this recognizer, each letter is broken down
into segments, and recognized afterwards. This implementation describes an ap-
proach using nebulous stroke models, which they do not define the letters or any
features of letters, or how they are segmented. The program itself defines the
most natural way of defining a letter. The models are trained using a 3 step pro-
cess: letter training, linear word training, and lattice word training. Letter train-
ing involves training the system on single letters, linear word training uses whole
words, and lattice word training transforms all words into finite state networks,
and the system is trained on those.
Overall the hidden Markov model based approach was well defined, but it
was overly complicated for my needs. If I had used this approach, a vast majority
of my time would have been spent implementing and refining the recognizer
into my system instead of developing an interface for OASIS. My primary goal,
first and foremost, was to develop a sketch-based interface for OASIS, and not
necessarily develop a unique recognizer.
2.3.3 $N Recognizer
One recognizer that I tested and used extensively was the $N recognizer.
There existed a few reasons for initially relying heavily on this recognizer for
recognizing nearly everything in the system. One, the recognizer was simple to
implement and modify. Second, the system was flexible in its ability to recognize

19
both shapes and letters. Lastly, it did not require any training data, so the addi-
tion of new recognizable symbols was effortless.
The $N is a lightweight, concise multistroke recognizer that generalizes one
multistroke to all possible multistrokes [27]. To understand the $N recognizer,
we must first review its predecessor, the $1 recognizer for single strokes. The $1
recognizer is a lightweight, unistroke recognizer that classifies unistrokes based
on templates [28]. The $1 recognizer works in 4 steps: resampling the path, rotate
based on indicative angle, scale and translate, and find optimal angle. First, the
user drawn stroke is resampled such that the distance between points is equidis-
tant. This necessary to ensure equal comparisons between quickly and slowly
drawn strokes. Next, the indicative angle is found, which is defined as the angle
between the first point drawn and the centroid of the stroke. This is rotated to
zero degrees and helps normalize all strokes to a common angle. After rotating,
the stroke is non-uniformly scaled to a reference square. This allows the recog-
nizer to directly compare the user drawn stroke to the templates, and assume that
changes in distance are due to rotation and not aspect ratios. After the scaling of
the stroke, it is translated to a reference point, usually the centroid at (0,0). The
above steps are also applied to all the template to ensure each point in the stroke
matches to one point in each of the templates. Finally, to find the optimal angle,
the stroke is scored against all templates, and the stroke with minimal differences
is determined to be the classification for the stroke.
The $N uses the same processes as the $1, except on multiple strokes. The
main challenge of multistrokes is that any of the strokes can be drawn in any or-
der and from any direction. As shown in Figure 2.4, even a simple two stroke
gesture has multiple combinations. The $N recognizer orders the points in each
possible permutation - essentially treating each multistroke permutation as a
unistroke. A Heap Permute is used to generate all possible permutations of
strokes [27]. The $N also operates with bounded rotational invariance, meaning
an object flipped completely upside down (rotated 180 degrees) will be recog-
20
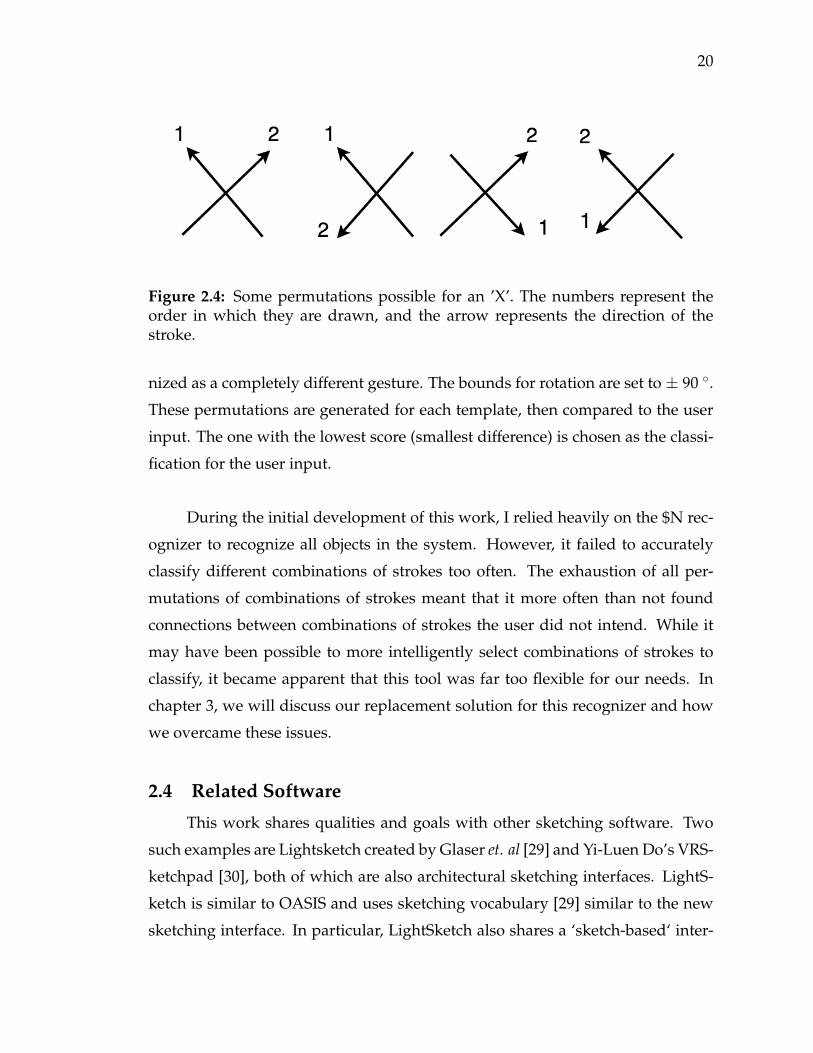
Figure 2.4: Some permutations possible for an ’X’. The numbers represent theorder in which they are drawn, and the arrow represents the direction of thestroke.
nized as a completely different gesture. The bounds for rotation are set to ± 90 ◦.
These permutations are generated for each template, then compared to the user
input. The one with the lowest score (smallest difference) is chosen as the classi-
fication for the user input.
During the initial development of this work, I relied heavily on the $N rec-
ognizer to recognize all objects in the system. However, it failed to accurately
classify different combinations of strokes too often. The exhaustion of all per-
mutations of combinations of strokes meant that it more often than not found
connections between combinations of strokes the user did not intend. While it
may have been possible to more intelligently select combinations of strokes to
classify, it became apparent that this tool was far too flexible for our needs. In
chapter 3, we will discuss our replacement solution for this recognizer and how
we overcame these issues.
2.4 Related Software
This work shares qualities and goals with other sketching software. Two
such examples are Lightsketch created by Glaser et. al [29] and Yi-Luen Do’s VRS-
ketchpad [30], both of which are also architectural sketching interfaces. LightS-
ketch is similar to OASIS and uses sketching vocabulary [29] similar to the new
sketching interface. In particular, LightSketch also shares a ‘sketch-based‘ inter-
21
face with a minimal user interface. Similar to this sketching interface, LightSketch
can also recognize shapes shapes and symbols. However, Lightsketch does not
have any shape indications or overlaid shapes to indicate to the user the inter-
face’s intent. Also, LightSketch does not appear to have any methods of edit-
ing previously drawn primitives, while this sketching interface allows users to
change, edit and reclassify previously created lines.
VRSketchpad also employs a freehand sketch approach to their interface.
Similar to our implementation, VRSketchpad processes the user design and trans-
lates the drawings into 3D objects. VRSketchpad also has multiple levels to pro-
cessing to create shapes, irregular shapes, and pieces of furniture. However, VRS-
ketchpad contains a much busier interface than our own, which is devoid of but-
tons and modes. Unlike our implementation, VRSketchpad has no recognition
before processing the drawing into a 3D model. Therefore, we can give the user
a better idea of our interpretation of his/her design before creating the 3D model.
One example of a non-architectural sketching interface is the Gesture Rec-
ognizers Automated in a Novel Direct Manipulation Architecture (GRANDMA)
created by Rubine. Rubine describes a series of features that are incrementally
computable in constant time per input [31]. These features include cosine and
sin of the initial angle of the stroke, duration of the strokes, bound box diagonal
of the stroke, and distance of the stroke in total. These features are also used in
other applications, such as SATIN, a toolkit for informal ink-based applications
[32]. In order to classify strokes, weights were attached to features depending
on their importance to that classification. Rubine’s system also had the ability to
reject classification if the gesture was deemed ambiguous or if it was not confi-
dent in its recognition. When a user created stroke was run against a template,
the highest scoring classification would be applied. These features were applied
to create his gesture-based drawing program (GDP). GDP was a simple drawing
program with robust features by drawing unistroke commands to specify cer-
tain actions. For example, a user could use the ‘delete‘ command, and the next

22
unistroke would be executed as a delete command. Our implementation uses a
similar system when attempting to classify rectangles. Also, both interfaces use
a minimal interface, relying solely on user drawn strokes. However, Rubine’s
implementation uses a training set to learn the unistrokes recognized by the pro-
gram, while my implementation does not require the use of any training data. In
chapter 4, we will discuss further in depth the features chosen to represent our
objects.
2.5 Summary
This chapter provides an overview of the works that influenced the design
and development of this project. The previous feature development on the OA-
SIS system helped to develop an interface suitable for OASIS itself. As we will
discuss in chapter 3, many of the technologies used in OASIS will also be used to
develop this work. Different works in human input recognition led me to choose
a geometric based approach to classifying user strokes. This work will provide
an enhanced user experience when designing models on OASIS.

CHAPTER 3System Overview
As stated in chapter 2, this thesis is an extension and modification of OASIS. The
previous iteration of the user interface employed a ’drag-and-drop’ method of
introducing new elements. This chapter will explain in detail the processing en-
tailed before recognizing the user’s input. First, I will discuss where and how this
work modifies the OASIS pipeline. The next section contains a detailed overview
of strokes, the processing of those strokes, and extraction of useful metrics from
them. Next, we cover actions available to the user in the sketching interface, such
as creating walls, windows, and deleting previous objects. The final section con-
sists of implementation elements, and its similarities and differences compared
to OASIS.
3.1 OASIS Pipeline
In order to understand where this work improves OASIS, first I must dis-
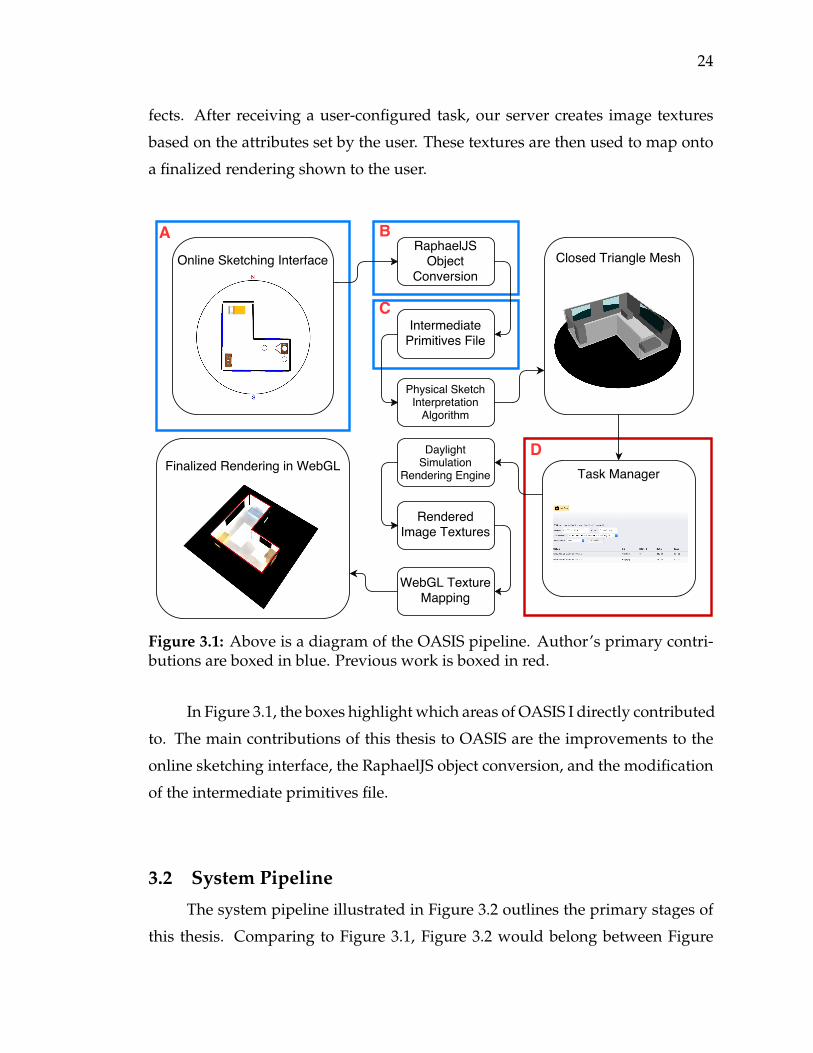
cuss the pipeline OASIS follows to create new models. Figure 3.1 illustrates the
steps to completion from a user design to a finalized rendering. First, a user
sketches a top-down 2D design of a room using the sketching interface. Users
can then drag and drop walls, windows, and furniture onto a canvas. The place-
ments and angles of furniture, the cardinal direction of the room, as well as its
location in the world may be edited. Afterwards, the objects are converted into
a primitives file which is interpreted by the physical sketch interpretation algo-
rithm. This primitives file contains data about the attributes of walls and furni-
ture, as well as room configurations. The physical sketch interpretation algorithm
automatically interprets the sketch and exports it as a watertight triangle mesh
[33]. This mesh is rendered without lighting effects and simply confirms that the
user’s intentions were adequately interpreted into 3D from their 2D sketch. From
any of their created meshes, users may create a simulation on the task manager
page. Tasks may be edited with dates, times of day, timezones, and weather ef-
23
24
fects. After receiving a user-configured task, our server creates image textures
based on the attributes set by the user. These textures are then used to map onto
a finalized rendering shown to the user.
Figure 3.1: Above is a diagram of the OASIS pipeline. Author’s primary contri-butions are boxed in blue. Previous work is boxed in red.
In Figure 3.1, the boxes highlight which areas of OASIS I directly contributed
to. The main contributions of this thesis to OASIS are the improvements to the
online sketching interface, the RaphaelJS object conversion, and the modification
of the intermediate primitives file.
3.2 System Pipeline
The system pipeline illustrated in Figure 3.2 outlines the primary stages of
this thesis. Comparing to Figure 3.1, Figure 3.2 would belong between Figure
25
3.2A and B, as shown in Figure 3.3. Improvements are also made to both the
sketching interface and object conversion pipeline steps, which will both be dis-
cussed later in this chapter.
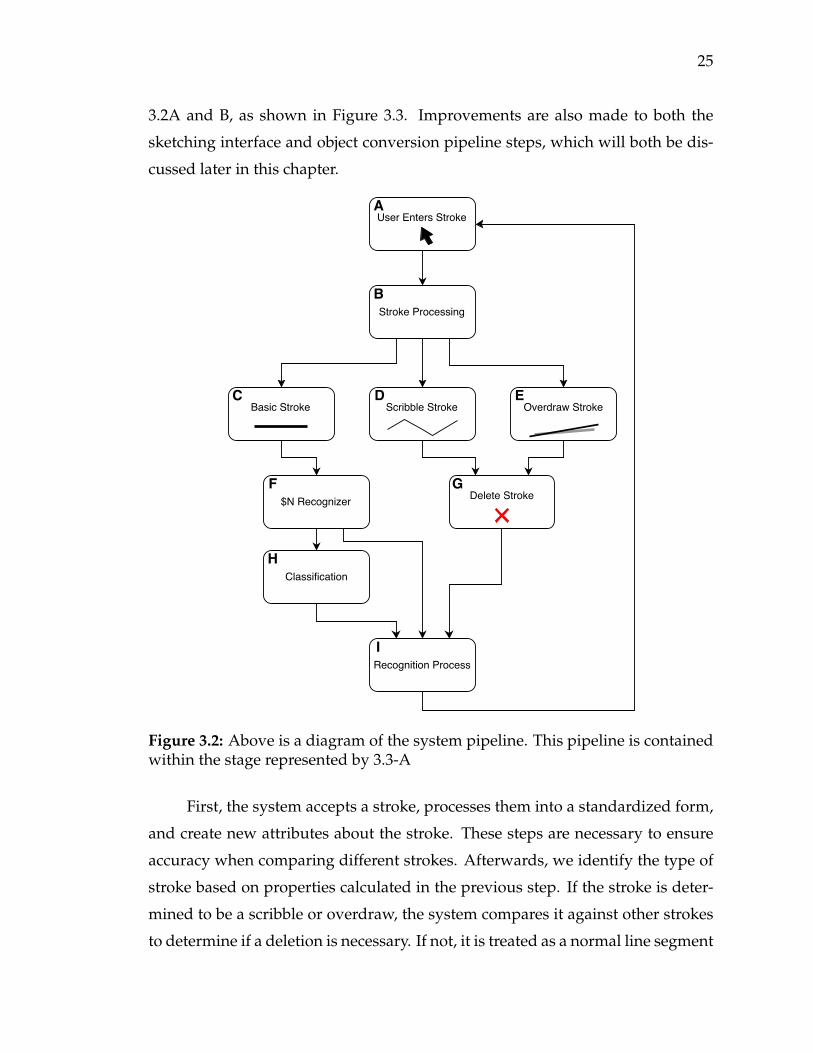
Figure 3.2: Above is a diagram of the system pipeline. This pipeline is containedwithin the stage represented by 3.3-A
First, the system accepts a stroke, processes them into a standardized form,
and create new attributes about the stroke. These steps are necessary to ensure
accuracy when comparing different strokes. Afterwards, we identify the type of
stroke based on properties calculated in the previous step. If the stroke is deter-
mined to be a scribble or overdraw, the system compares it against other strokes
to determine if a deletion is necessary. If not, it is treated as a normal line segment

26
or wall, and the system proceeds onto the recognition phase.
Figure 3.3: Above is the placement within the OASIS pipeline of the recognitionsystem in which a majority of this work is contained.
If the stroke is determined to be a basic stroke after processing, it is fed into
a the $N recognizer to check if it similar to one of the template letters. If so, it will
be used to reclassify an object according to the letter drawn. If not, it is treated
as a normal line segment or wall and continues to the recognition phase. In the
recognition phase, the system reevaluates the context of the set of strokes it has
been given. The system will recognize any objects, fit an appropriate shape to
them, display it to the user, and classify it under an object template.
3.3 Stroke Processing
A point is defined as single pair of x and y coordinates. A stroke is a series of
points on a canvas, and is the one of the most basic foundation data types in this
system. To create a stroke, the user simply clicks anywhere on the interface, and
moves their mouse to any other point on the interface without moving outside the
boundaries. The system automatically records coordinates every time the mouse
moves, creating a sequence of points. When the user releases his/her click, the
points are converted into a stroke. In this section, I will review the processing
done to these to simple points to interpret the user’s intent.
3.3.1 Stroke Resampling
After recording the raw coordinates of a stroke from the user, the first pro-
cess required is resampling the stroke. Since a stroke is list of x and y coordinates,

27
Algorithm 3.1 Psuedocode detailing resampling of a stroke
1: function RESAMPLE(points, numPoints, numDivisions)2: i← PathLength(points)/(numDivisions− 1)3: d← 04: resampled← [ ]5: for i = 0→ numPoints do6: m← distance(pointi−1, pointi)7: if d + m < i then8: px ← pointi−1.x + ((i− d)/m ∗ (pointsi.x− pointsi−1.x))9: py← pointi−1.y + ((i− d)/m ∗ (pointsi.y− pointsi−1.y))
10: resampled← (px, py)11: insert (px, py) in points at i12: else13: d = d + m14: return resampled
it is actually a series of short line segmenets. Unfortunately, due to differences in
computer processing and human drawing speeds, these line segments may vary
in length. The main purposes of resampling are to eliminate the inequality cre-
ated by differences in speed when drawing strokes, and to remove clumping of
points commonly created around corners. The inequality of the spacing between
points of the line affects the scoring algorithms that rely on weighting metrics
between all points equally. Algorithm 3.1 outlines the process to resample any
number of points to numDivision number of points. The algorithm finds the ap-
propriate number of points, and the distance between each one such that they are
all equidistant to their neighbors. There must a point every distance length away,
so we follow the stroke’s path , point by point, creating a new point every time
that threshold is crossed. At the end, there will exist exactly the number of points
specified with equal distances between them. There is one flaw to this algorithm:
it creates points that were not drawn by the user, and therefore the new set of
points may not truly represent the user’s original line. However, if the number
of divisions is sufficiently high enough, the newly created set of points is a good
approximation of the initial stroke. The average number of points per 150 pixels
is approximately 30, and after resampling is the numDivision number of points. I
currently use 24 points per 150 pixels, through usage of the program I have found

28
that using this number both generally lowers the number of points, and keeps a
high degree of similarity to the user’s original sketch.
Another possible method of resampling the line is to fit curvature of the line
better. To accomplish this, extraneous points are removed from straight edges,
and points are added to better define edges and curves. While this creates a better
fitting line to the user’s original input, the main purpose of fitting a line to the
curvature is to lower the total number of points while retaining the shape of the
line. However, my primary purpose of resampling the lines is to retain accuracy
of our scoring algorithms by ensuring each point will have equal influence over
the scoring of strokes or shapes.
3.3.2 Line of Best Fit
Since strokes contain many data points, it becomes very costly and diffi-
cult to draw comparisons between them. In cases where the strokes are perfectly
straight lines, stroke comparison is simple. Properties such as angles and inter-
sections between two or more lines are straightforward to calculate. Since not
all strokes created are straight lines, it can be difficult to measure such attributes.
In order to compare strokes, I have chosen to compute a linear line of best fit
to generalize properties about a stroke. This reduces all strokes to straight lines,
simplifying the process of comparing them. Treating the points of a stroke as scat-
ter plot, a line of best fit will describe a set of properties that best fit the stroke.
These properties include the slope, y-intercept, and the r2 value. The slope deter-
mines the steepness of the line of best fit, the y-intercept controls the translation
of that line, and the r2 value represents how well the line fits the stroke’s points.
I used a least squares method to find my line for best fit, identifying the line with
the least squared difference between it and each of the points in the stroke.
3.3.3 LengthRatio
An important metric of a stroke is the line length to path length, or the
LengthRatio. The line length is the Euclidean distance from the first point to the

29
last point. The path length is the summation of every line segment contained
within the stroke. One useage of this metric is to determine if a user has drawn
a line sufficiently close enough to a straight line. Since it is incredibly difficult to
draw a perfectly straight line, I recognize when a user’s stroke is close enough to
a straight line, and fix it accordingly, as shown in Figure 3.4B-C. The equations
for the calculation of the LengthRatio are described below.
LineLength = distance(point0, pointn) (3.1)
PathLength =n−1
∑i=0
distance(pointi, pointi+1) (3.2)
LengthRatio =LineLengthPathLength
(3.3)
Essentially, as the LengthRatio approaches 1, the closer a stroke is to a per-
fectly straight line. Through some basic testing, I’ve determined .95 to be a rea-
sonable cutoff for fixing crooked paths.
The same ratio is also used to determine strokes that are not definitely not
straight lines, or ‘scribbles‘. Scribbles are lines that are haphazard and random.
To detect a scribble, the LengthRatio is used, but with a different cutoff. The min-
imum LengthRatio to be a line is .7, and any strokes under that are determined to
be scribbles.
3.4 Sketching Interface Actions
In this section, we will discuss the features and actions available to the user
to create and edit their designs. Since one goal was to preserve the simplicity
of drawing, not many extraneous buttons or menu options were added. I did
not want the user to feel pressured to remember hotkey combinations or highly
specialized methods to perform certain actions. At minimum, the proposed new
sketching interface has all the features of the previous system, plus added flexi-

30
bility and ease of use.
3.4.1 Walls and Windows
As described earlier in Section 3.3, a stroke is created on the new interface
by clicking on the interface and dragging to another location. An example of how
a user would create a wall is outlined in Figure 3.4A-C. At a base level, all strokes
are considered walls until recognized or classified as otherwise. The next chapter
will cover the classification and recognition of objects in further detail.
Figure 3.4: How to create a wall using the sketching interface.
The new sketching interface mimics how one would draw with pencil and
paper, without the need to click on buttons or referring to toolbar. As demon-
strated in Figure 3.4, the strokes will snap to a straight line if the LengthRatio has
crossed a threshold of .95. This is achieved by replacing the previously recorded
points with a segement of the line of best fit. This is determined by finding the
points on the line of best closest to the first and last point created by the user.
Given that most physical walls are straight, and that it would be difficult to
straighten lines without any tools on the interface, it made sense to automati-
cally fix slightly crooked walls. Overall, it was a change that resulted in much
cleaner looking designs.
Windows can be created just as seamlessly as walls in the new interface.
Windows must be attached to a wall, and cannot be longer than the wall it be-
longs to. As shown in Figure 3.5-A, a user mouses over a wall, changing the
wall’s color to red. Next, the user clicks on the wall and drags the wall to the de-

31
sired length, as illustrated in Figure 3.5-B. Finally, to create the window, the user
releases his or her mouse click, snapping the window to the wall, as depicted by
Figure 3.5-C.
Figure 3.5: How to create a window using the sketching interface.
The window snapping algorithm uses the best fit line of the wall it is at-
tached to. The user chooses the length of the window by designating a start and
end point, and the the slope of the window is determined by the slope of the line
it is attached to. In order to allow for flexibility, walls do not need to be dragged
in the exact direction or orientation to snap to the wall. The proposed window
can be dragged into any angle, and even beyond the length of the wall. However,
should a user mistakenly enter the window creation process, he/she can drag the
cursor such that it creates a perpendicular angle with the wall, ensuring that the
window does not get created at all. Regardless of how long the wall is dragged, it
will always snap up to a maximum of 5 percent away from the end, towards the
center of the wall. This is to allow some space for the window, and to avoid some
bugs that have been discovered with windows attached walls that are equally as
long.
3.4.2 Deleting Strokes
Should the user make the inevitable mistake, the ability to delete strokes
would be a welcomed feature. Keeping in the spirit of design without using a
toolbar, users can ’scribble’ or draw over their previous strokes to delete or mod-
ify them. The act of modifying a stroke is very similar to the previously described
actions.

32
It is simple to scribble out a previously drawn stroke. As shown in Figure
3.6, a user find the stroke he/she wants to remove, then sketches a random stroke
resembling a scribble over the chosen stroke, and both strokes disappear.
Figure 3.6: How to delete a stroke by scribbling.
As mentioned before in Section 3.3.3, if the LengthRatio is under .7, a stroke
is classified as a scribble. If a stroke is detected as a scribble, we search for strokes
whose points are near those of the scribble. If another stroke is in the immediate
area, then both strokes are removed from the sketch. However, the strokes do
continue to remain in the system, allowing for the possibility of an undo feature
in the future.
To draw over a stroke, a similar process to scribbling is employed. First, the
user finds a stroke he/she would like removed, as exhibited in Figure 3.6. The
stroke is currently only greyed out in the image and not the application itself.
However, it could be a feature for development in the future, since the viewing
of previous strokes may visually assist the user when designing. Next, the user
draws a line with similar angle, length, and positioning to the undesired stroke.
Finally, the previous stroke is removed and the new stroke remains.
The process behind overdrawing a stroke is also similar to that of scribbling.
However, instead of checking for the presence of a scribble, I check for the dis-
tance between the overdraw stroke and every other stroke. The distance between
strokes is calculated between the centers of the strokes. We compare the stroke’s
properties taken from its line of best fit to its closest neighbors, which are only

33
Figure 3.7: How to draw over a previous stroke. The removed stroke is greyedout only for this figure, to help visualize the removal.
strokes whose centers are within half its pathLength away from its own center. If
any other strokes are similar enough in length and angle, we delete the previous
stroke and allow the newly drawn stroke to remain. If no strokes fit the criteria,
then the stroke is treated as a normal wall.
Previously, a two dimensional grid was used to store stroke information and
compare location data. While it is more computationally efficient with extremely
high numbers of strokes, the overhead and complexity to maintain such a data
structure with low numbers of strokes far outweighed the benefits. After testing
with moderately complex models with 20-40 strokes, it was determined that the
use of a spatial data structure was either the same or slower speed than checking
against all other strokes. Should models become more complex in the future, this
data structure could be revisited. However, in its current iteration, there is not
enough data in an average model to warrant the use of a spatial structure.
3.4.3 Cardinal Direction
With the production of a new sketching interface, it was necessary to con-
sider a new method of indicating the cardinal direction, such as north or south.
The previous implementation was a movable ring surrounding the design area.
However, ring would be an inefficient use of space with a rectangular sketching
area. The proposed idea is a small north arrow on the canvas indicating the direc-
tion of north. The arrow will rotate away from the center every time it is adjusted.
34
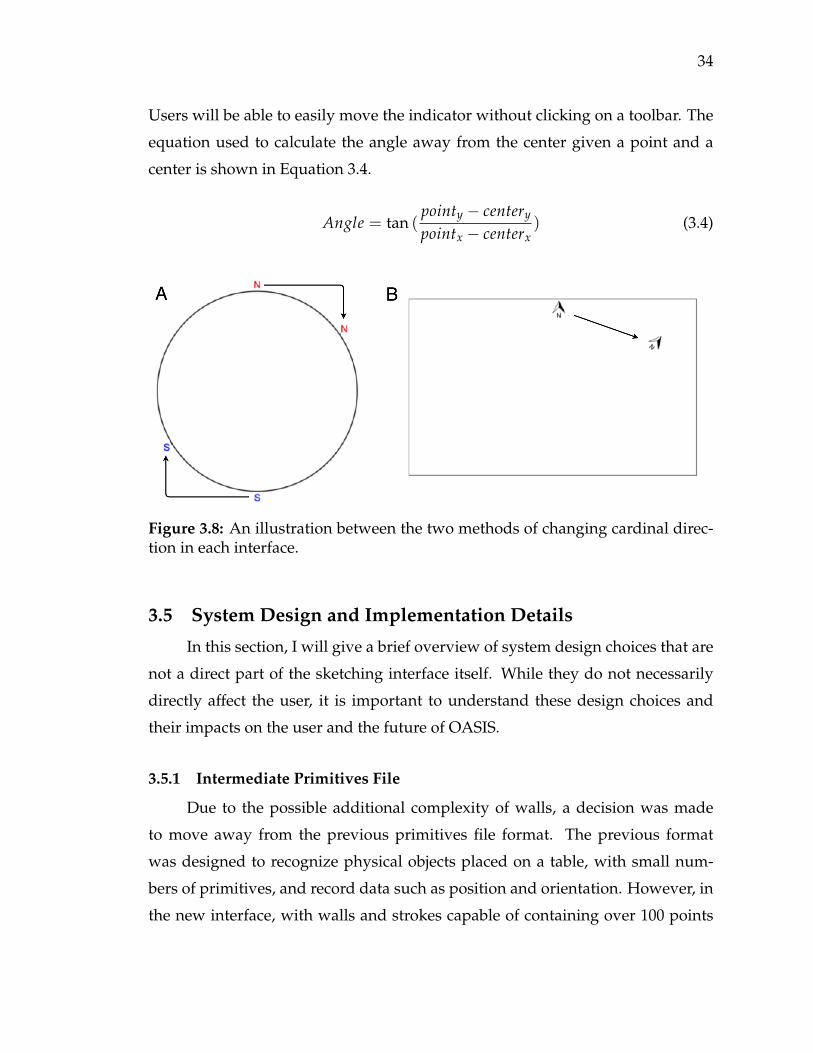
Users will be able to easily move the indicator without clicking on a toolbar. The
equation used to calculate the angle away from the center given a point and a
center is shown in Equation 3.4.
Angle = tan (pointy − centery
pointx − centerx) (3.4)
Figure 3.8: An illustration between the two methods of changing cardinal direc-tion in each interface.
3.5 System Design and Implementation Details
In this section, I will give a brief overview of system design choices that are
not a direct part of the sketching interface itself. While they do not necessarily
directly affect the user, it is important to understand these design choices and
their impacts on the user and the future of OASIS.
3.5.1 Intermediate Primitives File
Due to the possible additional complexity of walls, a decision was made
to move away from the previous primitives file format. The previous format
was designed to recognize physical objects placed on a table, with small num-
bers of primitives, and record data such as position and orientation. However, in
the new interface, with walls and strokes capable of containing over 100 points

35
(and thus over 100 wall segments), the amount of data stored needed to be sim-
pler to store and access. The new proposed intermediate primitives file format
will be in Javascript Object Notation (JSON). JSON is a language independent,
lightweight, data-interchange format that is easy for humans to read and widely
generated and parsed by many operating systems and applications [34]. JSON
is often used to transmit data from servers to applications and consists of at-
tribute/value pairs. Given its widespread use, it would allow the data collected
in this application more accessible to other programs and make integration with
future features simpler. Also, being a standardized format will require less spe-
cialized knowledge to understand. Moving forward, the switch to the JSON file
format will make the application more accessible for feature development and
more manageable to maintain.
3.5.2 Technologies
Being an extension and modification of OASIS, it is logical that the two
have technologies and frameworks in common. Both applications are built pri-
marily on Javascript, and both rely heavily on the RapahelJS [35] framework.
RaphaelJS is a vector graphics Javascript framework that supports most major
web browsers. RaphaelJS is used to create all the sketching elements, including
walls, windows, and furniture. It allowed for the easy creation and manipulation
of lines and shapes created by the user. FreeTransform [36], which is an extension
of RaphaelJS, is used for the rearrangement of objects in the sketching interface.
Due to the method of storing positional values by RaphaelJS, moving an object
multiple times is complex. Both RaphaelJS and its extension, FreeTransform were
instrumental in the development of this work.
3.6 Chapter Summary
This chapter reviewed the pipeline of OASIS and where this work con-
tributed within that process. An overview of strokes, processing of those strokes,
and stroke metrics were provided. Next, I presented the elements and actions
available within the sketching interface itself. Afterwards, I discussed some of

36
the design choices behind the development of this thesis and its impact on the
application. The next chapter examines in further detail the logic behind recog-
nition and classification of objects in the sketching interface.

CHAPTER 4Recognition
This chapter reviews in detail the primary contributions of this thesis: the recog-
nition, fitting, and classification of objects in the new sketching interface. The
recognition of objects refers to the system’s awareness to the presence of a series
of strokes representing an object. Object fitting results in a generated shape that
accurately represents an object recognized by the system. Lastly, the classifica-
tion of an object results in the designation of certain attributes determined by
its physical properties. These application features use and build from the met-
rics described in chapter 3. These components elevate the sketching interface
beyond a simple painting program. The system is intended to recognize the in-
put, understand the user’s intentions and reiterate that to the user an image that
is meaningful and easy to understand.
Figure 4.1: Illustrated are methods of drawing a rectangle using differentamounts of lines. This application currently only recognizes rectangles drawnwith four strokes.
Due to the shapes of objects we currently allow in OASIS, all objects may be
accurately represented in 2D as a rectangle. Therefore, the algorithms presented
are specialized to solve for the subset of shapes similar to rectangles. The prob-
lem set is further simplified to recognize only sets of straight lines that are of size
4. However, proposed methods to overcome this limitation will be presented.
37

38
I present a geometric based approach to recognizing rectangles from user
drawn lines. The basic features of a rectangle were analyzed to create metrics
useful in determining the existence of a user drawn rectangle. Since multiple
rectangles may be created from a common set of strokes, scoring functions are
necessary in determining the optimal outcome. Algorithms and analysis for pri-
mary scoring functions are displayed and evaluated. Afterwards, in section 4.4, I
present a method to classify rectangles based on their attributes. Finally, we will
discuss my approach to fit a rectangle to a set of user drawn strokes in section 4.5.
4.1 Recognition Pipeline
As discussed briefly in the previous chapter, the last step of the overall sys-
tem pipeline is the recognition process. The pipeline of the recognition process
is illustrated in Figure 4.2. The recognition process contains the steps needed to
recognize, fit, and classify objects based on user created strokes. To begin, the sys-
tem creates certain combinations of strokes, using all of the user generated data
points to determine which strokes match best with others. Using the generated
combinations, the interface scores those groupings of strokes based on a number
of metrics. If any combinations exceed a certain confidence level, then that set of
strokes is deemed to be a possible object.
Once the system has obtained a list of the combinations of strokes that have
been accepted as rectangles, it selects the series of objects yielding the highest
score to be drawn onto the interface. Afterwards, the chosen sets of strokes are
assessed using two algorithms: one for fitting the best possible rectangle, and one
for an initial classification type. We attempt to fit rectangles to the user’s drawn
strokes in order to display our interpretation of the design. The fitting uses a 2D
heuristic created from the sum of the overall distance from the proposed rectangle
to each one of the points from the user created strokes. Next, a classification
algorithm from the system presents the user with an initial type for the newly

39
Figure 4.2: Simplified diagram outlining the steps to recognize rectangles from aset of strokes.
created object. Finally, the shape is placed on the screen for the user to evaluate
and edit. After the conclusion of this pipeline, the user may continue to engage
with the interface, repeating the pipeline for each stroke added. Or, the user may
conclude editing, which continues onto the rest of the OASIS processes.
4.2 Combinations of Strokes
While it is possible to generate the score of all subsets given all user strokes,
scoring 2n combinations of strokes is inefficient. Also, choosing random sets of
strokes does not ensure a sufficient level of accuracy. I propose a scoring algo-

40
rithm to select particular groupings that maximize the probability of the strokes
forming a coherent rectangle.
To begin, each stroke is compared with every other stroke. As shown in
Equation 4.3, the score between two strokes is determined by their interior angle
between the two lines and their distance apart. Each score is recorded and new
scores are calculated only when a new stroke is produced by the user or an exist-
ing stroke is edited.
As shown in Equation 4.1, the perpendicular equation penalizes strokes that
are not perpendicular with one another. The angles are calculated using the the
line of best fit algorithm described in the section 3.3.2. An angle that is a multiple
of 45 (but not 90) produces the highest score. A low score indicates a better fit
(more similar) to the original stroke.
perpendicular(x, y) =45− |((xangle − yangle)%90)− 45|
45(4.1)
The distance equation, as shown in Equation 4.2, rewards pairs of strokes
with small amounts of distance between them. Distance between two strokes
is measured by the smallest Euclidean distance between all combinations of the
strokes’ endpoints. Nearby and perpendicular strokes represent the types most
likely to form a rectangle with one another.
distance(x, y) =endPointDistance(x, y)max(canvasw, canvash)
(4.2)
The two metrics are summed to create a score representing the probability
that two strokes are likely to form a rectangle with one another. A low score
represents a high probability of rectangle cohesion, while a high score implies a
low probability. Using each stroke’s list of scores against all other strokes, we
pick from the top scoring strokes to create sets of four for the next process in the
recognizer.

41
Score(x, y) = perpendicular(x, y) + distance(x, y) (4.3)
I acknowledge that not all rectangles created by users are created with 4
strokes. However, the metrics needed to define a rectangle drawn with 1, 2, or n
strokes adds a new level of complexity to the problem. With any numbers other
than 4, the strokes would need to be normalized to 4 with some method. For
numbers less than 4, I propose breaking strokes at their corners. For numbers
greater than 4, a method to combine similar lines would be needed.
4.3 Rectangle Recognizer
To recognize a set of strokes as a rectangle, the recognizer works in three
basic steps: rejecting groupings that do not pass the threshold for the rectangle
metrics, scoring the groups of strokes that do exceed the threshold, and selecting
the top scoring groupings as an object. The rectangle metrics are three heuristics
that, when passed in conjunction, almost always produce a recognizable rectan-
gle. Even if a stroke belongs to more than one possible set, it may only form an
object with the highest scoring set of strokes where all other members do not be-
long to any higher scoring group. Given a large set of possible combinations, the
recognizer selects the best to be created into rectangles.
4.3.1 Rectangle Metrics
This subsection lists and describes the metrics used to identify if a set of
strokes is mathematically similar to a rectangle.
4.3.1.1 Line Ending Comparison
The first rectangle metric specifies that all stroke endpoints in the set must
be near another unique endpoint within the same set. This metric ensures that
the strokes are spatially adjacent and create a closed polygon.
Algorithm 4.1 outlines the greedy method used to pair the line endings.
Endpoints are compared by distance and paired with the first choice within the
maximum distance allowed.

42
Algorithm 4.1 Function detailing the pairings of line endings
1: function LINEENDINGS(endPoints, maxDist)2: pairs← []3: for i = 0→sizeofendPoints− 1 do4: for j = i + 1→ sizeof(endPoints) do5: d← distance(endPointsi, endPointsj)6: if d < maxDist then7: pairs← [endPointsi, endPointsj]8: remove i, j9: break
10: if sizeof(pairs) < sizeof(endPoints)/2 then11: return []12: else13: return pairs
maxDist =pn·
n−1
∑i=0
length(strokei) (4.4)
Equation 4.4 describes a formula to determine the maximum distance al-
lowed between endpoint pairings given n strokes and percentage of stroke length
p. I used a percentage of .1, the desired maximum distance between endpoints
was 10 percent of the average length of strokes involved.
4.3.1.2 Line Straightness
The second rectangle metric states that all strokes in a rectangle object must
be similar in straightness to a line. To determine this, I use the LengthRatio de-
scribed in Equation 3.3. The purpose of this metric is to ensure there exists no
odd edges or irregularities; a wavy line will receive a poor score when compar-
ing similarity against the straight edge of a rectangle. While I did use .95 as a
threshold for a line when sketching walls, I used a .9 threshold for this metric to
allow for a little more flexibility.
4.3.1.3 Perpendicular Angles
A property of all rectangles is that all interior angles equal 90 degrees. There-
fore, the last rectangle metric is the average interior angle of the set of strokes.
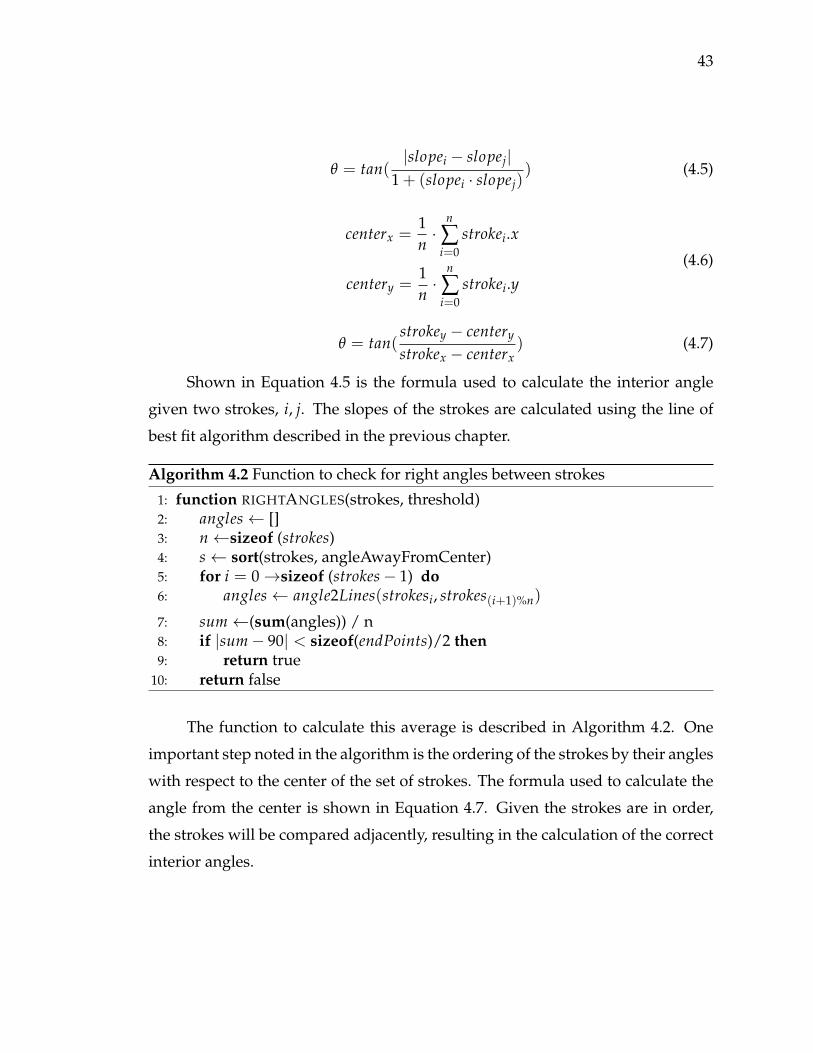
43
θ = tan(|slopei − slopej|
1 + (slopei · slopej)) (4.5)
centerx =1n·
n
∑i=0
strokei.x
centery =1n·
n
∑i=0
strokei.y(4.6)
θ = tan(strokey − centery
strokex − centerx) (4.7)
Shown in Equation 4.5 is the formula used to calculate the interior angle
given two strokes, i, j. The slopes of the strokes are calculated using the line of
best fit algorithm described in the previous chapter.
Algorithm 4.2 Function to check for right angles between strokes
1: function RIGHTANGLES(strokes, threshold)2: angles← []3: n←sizeof (strokes)4: s← sort(strokes, angleAwayFromCenter)5: for i = 0→sizeof (strokes− 1) do6: angles← angle2Lines(strokesi, strokes(i+1)%n)
7: sum←(sum(angles)) / n8: if |sum− 90| < sizeof(endPoints)/2 then9: return true
10: return false
The function to calculate this average is described in Algorithm 4.2. One
important step noted in the algorithm is the ordering of the strokes by their angles
with respect to the center of the set of strokes. The formula used to calculate the
angle from the center is shown in Equation 4.7. Given the strokes are in order,
the strokes will be compared adjacently, resulting in the calculation of the correct
interior angles.
44
4.3.1.4 Alternate Solution
An alternative method of recognition that was implemented but not used
was a design based heavily on using the $N recognizer by Anthony and Wob-
brock [27]. Using the same combination creation algorithm, the strokes would be
processed by the $N recognizer instead of my recognizer. The strokes would be
compared to a template dataset of rectangles and letters. However, since the $N
recognizer accounted for direction of drawn strokes as well as the ordering, the
number of combinations checked was orders of magnitude higher than my imple-
mentation. Due to the sheer number of combinations checked, the $N recognizer
often found combinations of strokes that scored well on different templates than
intended. Although it was possible to better choose combinations for the rec-
ognizer to analyze, the recognizer was being modified for a purpose it was not
designed to handle, and that the recognizer was not being used for its strengths
anymore. The $N recognizer’s strengths were its flexibility in recognizing any
number of symbols in its data set, and ease of incorporation into any Javascript-
based program. With the small amount of objects in the data set, its flexibility
was no long valued. Since the shapes recognized in this system can be of any size
and rotation, the $N also has a difficult time matching them to its fixed sized and
proportioned templates. In addition, all the modifications the recognizer needed
to rework it for our purposes removed any ease of importing it once had.
4.4 Classification
The classification of an object entails assigning it a set of attributes to define
itself, such as a name, type, and color. I classify objects based on their ratio com-
pared to the ratios created by dimensions of real world objects.
In Table 4.1, I list the actual height and width of furniture items, as well
as their pixel equivalents. I chose 200 pixels to represent 80 inches, however
the number is fairly irrelevant since the primary comparisons are between ratios,
which are unit independent. Skylights are not included due to their arbitrary size
and shape. Users must manually classify a skylight in order to create one.

45
Table 4.1: Furniture height to width comparisons.
Pixel Height Pixel Width Height (in) Width (in) Ratio (hw
)
Bed (twin) 97.5 187.5 39 75 0.5200Bed (full) 135 187.5 54 75 0.7200Bed (queen) 150 200 60 80 0.7500Bed (king) 190 200 76 80 0.9500Desk 75 150 30 60 0.5000Wardrobe 150 200 60 74 0.8108
When a user creates a series of strokes and it is properly identified as a rect-
angle by the recognizer, it is sent to the rectangle classifier to receive a classifica-
tion. The user’s height to width ratio of his/her drawn furniture items compared
to those of real objects [37]. The ratio of height to width (in pixel values) of the
the rectangle is compared to each of the ratios of the furniture items. The clos-
est percentage is chosen as the classification shown to the user. As stated in the
previous chapter, users may reclassify any furniture item by either right clicking
and selecting a menu item, or sketching the appropriate letter on top of the object.
4.5 Rectangle Fitting
Finally, after the rectangle is recognized and chosen, a rectangle is fitted to
the set of strokes. First, a small rectangle is placed at the center of the strokes as
the first iteration of the rectangle. The growth of the rectangle will iterate though
using the following algorithm:
First, the rectangle is ’wiggled’ using the Wiggle function. This creates up
to 10 rectangles based on changed attributes. Using those proposed rectangles,
the function scores each one of them using the Rect-Distance function outlined in
Algorithm 4.5. Next, the rectangle with the lowest score is chosen and compared
with the current score. If the score is lower, then a next iteration is performed. If
the score is higher, then the function ends and the current rectangle is chosen.
Algorithm 4.4 describes how the Wiggle function changes the rectangle.

46
Algorithm 4.3 Rectangle-Scoring(points, rectangle, pScore, Inc)
1: s←[ ]2: r ←Wiggle(rectangle, inc)3: for each rect in r do4: for each p in points do5: s← s + Rect-Distance(center(points), rect, p)6: s← sort(s) . Sort by pScore, lowest to highest7: if s[0].pScore < pScore then8: return Rectangle-Scoring(points, s[0], s[0].pScore, Inc + 1)9: else
10: return s[0]
Each property of the rectangle is increased or decreased: height, width, x po-
sition, y position, and angle. From each attribute changed, a new rectangle is
created. Only one attribute is changed per iteration to accurately determine each
characteristic’s effect on the score. The system starts with a coefficient that deter-
mines the increments per iteration. In the beginning, the coefficient is high, re-
sulting in a high increment. Early iterations of the rectangle are unlikely to score
well, so less precision is necessary in initial steps. As the number of iterations
increases, the coefficient decreases as the rectangle approaches the optimal size.
The increments between angle and length/width/position are the same. When
the increments become their smallest smallest, all increments are of size one.
Algorithm 4.4 Wiggle(rectangle, count)
1: o ← [ ]2: i←roundUp(StartInc/count) . StartInc = 503: for variable in rectangle do4: a← rectanglevariable + i5: b← rectanglevariable − i6: o ← a, b7: return o
The distance is calculated between each point contained within the lines and
the rectangle is outlined in Algorithm 4.5. The points compared are the points ob-
tained from resampling described in section 3.3.1. A lower score indicates a better
match, since the score is the sum of distance away from the rectangle. There are

47
3 cases where the point exists in relation to the rectangle: outside the rectangle,
inside the rectangle, or perfectly on the line. Given the point is outside the rect-
angle, the score is the distance from the edge of the rectangle to the point. If the
point is on the rectangle’s edge, the score is 0. If the rectangle is on the inside of
the rectangle, the system uses the distance to the closest edge of the rectangle.
Algorithm 4.5 Rect-Distance(centroid, rectangle, point)
1: dx ← max(|pointx − centroidx| − (rectanglew/2), 0)2: dy← max(|pointy − centroidy| − (rectangleh/2), 0)3: if dx=0,dy=0 then4: return min(|pointx − centroidx| − (rectanglew/2), |pointx − centroidx| +
(rectanglew/2), |pointy − centroidy| − (rectangleh/2), |pointy − centroidy| +(rectangleh/2))
5: else6: return
√dx2 + dy2
Since it is comparatively difficult to calculate the distance between a point
and a rotated rectangle, the points are rotated instead. The rectangle is kept or-
thogonal, but other attributes are applied normally. All points are rotated with
respect to the center of the set of strokes. The method to rotate all points is given
in Algorithm 4.6.
Algorithm 4.6 Rotate-Points(points, rectangle)
1: q← []2: for p in points do3: ca← cos(rectanglea), sa← sin(rectanglea)4: dx ← px − rectanglecx, dy← py − rectanglecy5: px ← ca ∗ dx− sa ∗ dx + rectanglecx6: py ← sa ∗ dx + ca ∗ dy + rectanglecy7: q← p8: return q
After each rectangle created by Algorithm 4.4 is scored using the before
mentioned algorithms, the best scoring iteration is compared to the current iter-
ation. If the new iteration scored better, it becomes the new iteration, and the

48
Figure 4.3: Images taken a different timestamps in the process of iterative fitting.
process repeats. If the current iteration is better, the system has determined that
it cannot edit the rectangle any further to create a better scoring result. Therefore,
it stops iterating and proceeds to produce a rectangle on the canvas for the user
to see.
After the rectangle stops iterating, the object has settled in a local minima for
score. There is a possibility that it is not the global minima, and that it has settled
for a lesser scoring rectangle. Nonetheless, it is acceptable for the rectangle to
settle in a local minima since the accuracy is not application breaking.
4.6 Stroke Removal
The removal of strokes presents an interesting problem in this system. As
stated in the previous chapter, removal of elements may be done in one of two
ways: scribbling and overdrawing. When a stroke is removed by the user, the
classifications involving that stroke are no longer valid, as shown in Figure 4.4.

49
Figure 4.4: A diagram depicting the the removal of the object when one of itsstrokes has been deleted.
As shown in Figure 4.2-G, deleting a stroke alters the pipeline slightly. First,
the stroke itself must be removed from the interface. Next, all classifications and
recognized shapes associated with the removed stroke must also be discarded. If
the stroke was not associated with any recognitions, there is no further need to
reprocess. However, the removal of those classifications implies that the strokes
who used to belong to that recognized object are available. Therefore, we must
reprocess the sketch to search for other possible shape recognitions that may be
possible.
To start reprocessing the image, stroke combinations are created once again
minus the stroke that was removed. The system attempts to readd all strokes
that were effected by the removal of one of the strokes. This allows the system to
attempt to find new recognized rectangles, if the removed stroke had not existed.
Afterwards, the process remains the same as if the process had begun with a new
stroke, except using different combinations.
4.7 Reclassification
Furniture items are created via recognition of a viable rectangle present.
whose method of creation I will discuss in further detail in the next chapter. How-
ever, what will be presented now is the usage of furniture items during sketching,
and its available actions and properties.
After being recognized, a rectangle is fitted to the strokes. That rectangle
may be moved by double clicking and dragging it, also translating its base strokes
along to its new location. Objects may not be moved outside the sketching inter-

50
Figure 4.5: Examples of recognized objects. Each piece of furniture or skylight iscolored differently, as well as labeled.
face boundaries.
The rectangle will be assigned an initial classification. Classifications in-
clude types of furniture, such as a bed or wardrobe. If the user disagrees with the
system’s initial classification, the user has two methods of overriding it. First, the
user may right-click any object, as shown in Figure 4.6, and a menu will appear.
The user can reclassify the object as a different object by selecting any of menu
items. The only attributes that are modified are the name, type, and color of the
object.
Figure 4.6: Upon right clicking on an object, a menu is shown to the user.
A second method the user has to reclassify an object is to sketch the corre-

51
sponding letter on top of the object. The corresponding letter is the first letter of
the desired classification, such as the letter ’W’ if the user would like to reclassify
an object to a wardrobe.
Figure 4.7: Upon drawing the correct corresponding letter, the user can reclassifyan object to another classification.
This recognition works by using the $N recognizer, as described in chapter
2. Using a set of templates corresponding to the first first letters of each of the
types of objects, the newly added stroke is processed by the recognizer to check
if it matches with any letters. If it is a confident enough match, and the stroke is
within the boundaries of an object, then that object is now reclassified to the new
type of object. Afterwards, the classification stroke drawn to classify the object is
removed and no longer shown.
Each method of reclassification has its merits. The right-click menu is more
accurate and less reliant on interpretation, since there is no guesswork needed.
The letter recognition is arguably faster and intuitive, but has a much larger mar-
gin for error. There exists the possibility of the letter not being recognized, or
even recognized as the incorrect letter. With the availability of two methods, the
user has even more flexibility and choice with his/her designs.
4.8 Chapter Summary
In this chapter, we reviewed how the system selects combinations of strokes
to use in the recognizer, and used scoring functions used to determine the exis-
tence of a user drawn rectangle. Afterwards, a method of classification based

52
only on stroke dimensions was presented. Finally, I outlined the procedure used
to accurately fit a rectangle to a set of user drawn lines. The following chapter
discusses the outline and analysis of a brief pilot study based on this system.

CHAPTER 5Pilot User Study
In the previous chapters, I described in detail the modifications to OASIS and the
rationale behind those changes. In order to confirm the validity of this work, I
performed a small pilot user study on 6 students aimed at determining the us-
ability and accuracy of this sketching interface compared to the classic interface
on OASIS. This chapter will outline and briefly analyze the feedback received
from those participating in the study.
5.1 Study Conditions and Methods
Participants participated in one of two scenarios: in person questioning or
over the phone. I attempted to keep the experience the same for both types of par-
ticipants. Those that partook in person had access to a Wacom Intuos CTL490DW
digital drawing tablet, and those who participated over the phone did not. Aside
from a brief overview of the project itself, all users were guided minimally once
logged onto OASIS. However, I was available for guidance throughout the study
and answered all questions to the best of my ability. All participants were asked
to draw a room of their choice on each of the user interfaces. The first interface,
the drag-and-drop interface is the ‘classic‘ version of the interface. The second
interface is the sketching interface, and emulates sketching with a pencil. Par-
ticipants were allowed design on the interfaces in any order. Neither interface
design proceeded past the design phase, and did not proceed to the 3D model
generation. Afterwards, all participants were asked the same series of questions
about their experience.
5.2 Questions and Goals
The following questions were asked to each of 6 participants after each de-
sign, and their responses were recorded. The primary goals of this user study
are to isolate the positives and negatives from both systems, learn from them,
53

54
and apply them accordingly to improve OASIS. Since most of the development
of this thesis has been done in isolation, it is enlightening to gather feedback on
my work. Another goal is to learn more about other users’ perceptions of the
interface’s usability, and if anything is unclear or confusing. Finally, one last goal
is find areas of improvement and new features that users desire in such a system.
5.2.1 Questions
1. Questions per user:
• If any, do you have any experience or formal education in architecture
or visual arts? If so, which one and how many years?
• Do you have experience with modeling software? If so, which ones?
2. Questions per user interface, per design:
• On a scale of 1 to 5 (5 being the most confident), how confident are you
in your accuracy of design? (dimensions, scale, layout) Why is this
your score?
• If anything, what did you find fun or interesting about this sketching
environment?
• Describe designs you were unable to create due to system limitations.
• Was there anything you did not like about working in this sketching
environment?
• Were there any parts of the interface that were hard to use or confus-
ing?
3. Questions only for the new sketching interface:
• Describe your impressions of the systems effectiveness in interpreting
your design.
• Rate on scale of 1 to 5 (5 being the highest), the accuracy to which the
system displayed your design, based on your intentions. Why is this
your score?

55
5.3 Responses and Analysis
The before mentioned process was conducted with group of fellow students
of mixed backgrounds. No students that participated had any familiarity with
either system, or any formal experience with architecture. Overall, feedback on
the sketching interface was mixed. Users appreciated the flexibility and freedom
the new interface offered, but still felt it was lacking in possible features. There
was a general concensus that a lack of directions or list of available actions made
it difficult to use at first. However, most users agreed it was relatively enjoyable
to use and showed potential. Below are some direct quotes about the new system
offered by the participants:
• Positives:
– ”I thought it was pretty cool, I could draw whatever shapes I wanted”.
– ”It’s pretty awesome to scribble stuff out.”
– ”After using the new system, I felt more constrained [in the old system]
in terms of what I could make. I couldnt make the furniture whatever
size I wanted.”
– ”Overall its pretty fun [...] I thought it would be like Microsoft paint
but its like a step beyond that.”
– ”It’s pretty fun to just draw stuff and scribble it out.”
• Negatives:
– ”The shapes it can recognize are too limited, what about other shapes
like circles and triangles?”
– ”Sometimes it wouldnt recognize a rectangle that Im pretty sure is a
rectangle.”
– ”The classifications on furniture and stuff seemed pretty random.”
– ”It feels flexible but limited at the same time, I felt like I could draw
anything but the system couldn’t handle everything.”
– ”I was confused at first what it could do and what I could do.”
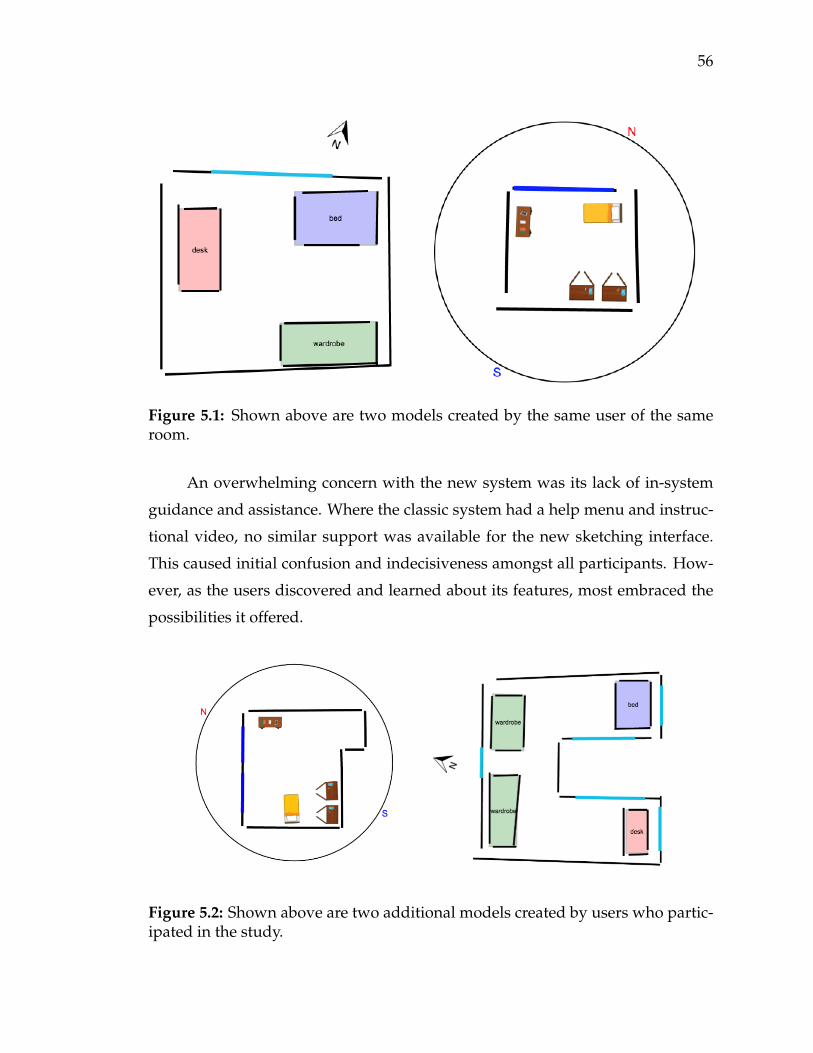
56
Figure 5.1: Shown above are two models created by the same user of the sameroom.
An overwhelming concern with the new system was its lack of in-system
guidance and assistance. Where the classic system had a help menu and instruc-
tional video, no similar support was available for the new sketching interface.
This caused initial confusion and indecisiveness amongst all participants. How-
ever, as the users discovered and learned about its features, most embraced the
possibilities it offered.
Figure 5.2: Shown above are two additional models created by users who partic-ipated in the study.

57
Visually, comments were made concerning the lack of images in the new in-
terface. The classic interface overlaid an image of the furniture, clearly indicating
what type of furniture it was. The sketching interface had a labels and colors,
but the participants found it more visually pleasing to look at images instead of
monochromatic blocks.
Figure 5.3: Shown above are two models where the windows did not snap cor-rectly to the walls they were attached to.
The order in which the participants chose to use the interface seemed to
have a surprising impact on their feedback. Those that chose the new sketching
interface first felt more constrained in their available design choices once they
started using the classic interface. The users that chose to use the classic interface
first seemed more conservative in their design choices. Typically, the interface
that was chosen second received more criticism. Since no users had any prior
experience with systems such as this, it made logical sense that the first interface
they used became the baseline for their sense of comparison.
There were some types of models I was not prepared for, and most problems
stemmed from the lack of flexible windows. Two examples are shown in Figure
5.3, the left is a single, curved stoke as the surrounding wall, while the right drew
a jagged edge as a whole wall. As explained in chapter 3, the window snapping
algorithm uses the line of best fit of the wall it is attempting to attach to. This
approach works well for straight lines. However, for strokes similar to an ellipse
and highly jagged lines, the result is clearly faulty. I was the primary user of
this system during development, and it never occurred to me to even attempt to

58
create a wall for a building that was not straight, let alone attach a window to
it. This result only reiterates the importance of user studies. We as developers
cannot anticipate the actions of the user, and through studies such as this we can
make our systems more robust.
Overall, this pilot study gave a sense of other users’ opinions of the system,
as well as some welcomed initial feedback. However, in the event of a more
detailed user study, there must be a greater attention to detail. If a proper user
study is to be conducted, more details about each participant must be recorded.
A greater variety of participants is also necessary to gain a broader variety of
opinions. Recording details about the usage of the system and each user’s actions
would allow a more in-depth analysis of the system. This pilot study made some
good first steps, but further adjustments must be made for a more comprehensive
user study.
5.4 Chapter Summary
This chapter summarizes a brief pilot study performed to determine the
effectiveness of this work against the previous user interface of OASIS. Results
and feedback were diverse, clearly showing where this work has succeeded and
failed. Through the lessons learned in this study, I have identified areas of im-
provement and possible features for the future.

CHAPTER 6CONCLUSION AND FUTURE WORK
6.1 Conclusion
My contributions include the creation of a sketch-based interface for archi-
tectural design, modifications and enhancements to OASIS, and the conduction
of a pilot study and analysis. The development of the sketching interface in-
cluded creation of a recognizer, metrics to score various aspects of user drawn
strokes, and a novel user interface. Also created were two different methods of
reclassifying objects and a process to fit a rectangle to a set of strokes. Improve-
ments to OASIS include bug fixes, small feature development, and improvements
to user experience. The pilot study indicates that the interface does lack some fea-
tures and depth of available primitives for designers to use. However, the new
sketching interface does show promise, and is unique in concept and execution.
6.2 Future Work
6.2.1 Dynamic Recognition
A limitation of this system is its lack of flexibility in recognizable primi-
tives. As shown in the pilot study, users showed desire for the system to recog-
nize additional shapes. While the recognition of rectangles was relatively well
received, the shortage of alternative choices for design was received as disap-
pointing. Without extensive further development, the procedure to add more
primitives would be time intensive. Currently, the system is limited to recogniz-
ing one shape (rectangles), and prior experience has shown that over-reliance on
the $N recognizer in an attempt to recognize too many primitives is ineffective in
accomplishing our goals. There is future work to be done to expand the number
of recognizable primitives and ease the process of adding those primitives.
Not only was the absence of additional shapes noted, but the low flexibility
59

60
in choice of room items was observed by the participants of the study. All fur-
niture items created were the same shape, with limited customizable attributes.
While some users were satisfied with the options, more support should be given
to increased number of primitive choices.
Research into machine learning based methods may prove to be worth-
while. While machine learning requires significantly more time and data to train,
the increased accuracy and reliability reflect that time investment. Using train-
ing data that includes new primitives may be a relatively simple solution to the
otherwise difficult problem of adding new shapes to the system. The amount of
knowledge required to adjust a machine learning algorithm effectively is unde-
niably high, but it could be a worthwhile investment in the long term.
6.2.2 Group Sketching
Architectural designs are often not created by one person alone, but the
culmination of multiple designers’ efforts combined. The ability to share and
collaborate with other people would be an invaluable tool. With multiple col-
laborators, models could be more complex and intricate. There exists interesting
design choices involving the ownership and versions of models.
Currently OASIS and this sketching interface only allow for the ownership
of a model to belong to one person. It may be beneficial to adopt version con-
trol to assist in organizing models. Version control would allow users to work on
models at their own pace, and merge models together to create significantly more
complex designs. Additionally, outside of the model viewer, there is no ability to
share models with other users. OASIS does contain unique link sharing for mod-
els, but it is view-only and does not allow editing. A possible solution would be
to allow users to manage the accessibility of their models, allowing each individ-
ual user to choose to keep models private or allow other certain other users to
edit their models.

61
One possible feature for group sketching would be the adoption of real-
time collaborative sketching. The current iteration of this sketching interface does
not allow for multiple users to sketch on one interface. Multiple users being
able to draw on the same canvas in real time would be a novel feature to add to
the sketching interface. However, such a system has its own challenges, such as
updating multiple canvases across multiple systems and communicating intent
across many users.
6.2.3 Multiple View Sketching
The current sketching interface only allows the user to edit their design in
one view: top-down. The locked view from top-down restricts the amount of con-
trol and freedom designers have over models. As discussed in chapter 1, there
exists many more types of architectural sketches. Views such as isometric, cross
section, and elevation can empower users to develop their ideas further. Viewing
models from different angles allows the user to better understand the look and
feel of what they are designing. Should more viewing angles be available, users
could tackle a design problem from multiple angles, sparking more ideas and
lead to increased creativity in solutions.
For example, by extending to a cross section view, the user can modify the
heights of objects. By editing an elevation sketch, a user can adjust how the facade
of their room looks. Future work is recommended to explore the area of sketching
from multiple views and editing more properties of the model.
6.2.4 Pilot Study Improvements
A more thorough and carefully planned user study could be done to study
any number of habits related to sketching. One limitation of the pilot study per-
formed was its low number of participants. I performed the study on a small,
select group of users, and it is possible the group I chose suffered from bias due
to my involvement in the applicant. Opening the study to all willing applicants
would reduce the bias in feedback. Due to a low number of participants, there

62
was a small amount of feedback. Collecting more feedback would allow us to
more accurately rate our tool. Another modification to the procedure would be
to perform the pilot study for longer. The study lasted only one session, consist-
ing of roughly 15 minutes of application usage and questioning per user. This
was far shorter than the time spent conducting the OASIS pilot study [18].
The amount of information gathered from the participants was limited to
the questions asked and models drawn. More information could be gathered and
analyzed, such as number of incorrect recognitions or number of edits. Further
analysis could be done on user behaviors, including what part of a room users
typically draw first, or even the extent to which the designs are to scale. The
possibilities to discover interesting patterns within design are endless.

REFERENCES
[1] Aushist. Front view of the Lombard Building on Queen Street, Melbourne.[Online]. Available: https://upload .wikimedia .org/wikipedia/commons/c/c0/Lombard Building Sketch1.jpg (Last Accessed: Jul 3 2016).
[2] Darling and Curry. Architectural sketch of the Victoria Hospital for Sick Children.[Online]. Available: https://upload.wikimedia.org/wikipedia/commons/c/c2/Architectural Sketch of Victoria Hospital for Sick Children.JPG(Last Accessed: Jul 3 2016).
[3] D. P. M. Alan Jefferis, David A. Madsen, “Computer-aided design and draft-ing in architecture,” in Architectural Drafting and Design, 6th ed. Boston,MA: Cengage Learning, 2010, pp. 104–135.
[4] Unknown. Architectural Plan of Memorial Hall (Harvard University). [Online].Available: https://upload.wikimedia.org/wikipedia/commons/f/f1/HarvardUniversity MemorialHall ArchitecturalSketch Plan 2874.jpeg(Last Accessed: Jul 3 2016).
[5] K. L. N. M. Sarcar, K. Mallikarjuna Rao, “Computer systems,” in ComputerAided Design and Manufacturing, 1st ed. Boston, MA: PHI Learning, 2008,pp. 20–40.
[6] ArchiCAD. [Online]. Available: http://www.graphisoft.com/archicad/(Last Accessed: Jul 3 2016).
[7] Martinremco. NHS Floor Plan. [Online]. Available: https://upload.wikimedia.org/wikipedia/commons/d/dd/800px-ArchiCAD-12-NHS-Floor -Plan.png (Last Accessed: Jul 3 2016).
[8] AutoCAD for Mac and windows — CAD software. [Online]. Available:http://www.autodesk.com/products/autocad/overview (Last Accessed:Jul 3 2016).
[9] NX: Siemens PLM software. [Online]. Available: https://www.plm.auto-mation.siemens.com/ en us/products/nx/ (Last Accessed: Jul 3 2016).
[10] Defining the Architects Basic Services, Amer. Inst. of Architects Std. 15.01.01,(Last Accessed: Jun 13 2016). [Online]. Available: http://www.aia.org/
[11] B. Lawson, “The changing role of the designer,” in How Designers Think,4th ed. Abingdon, England: PHI Learning, 2005, pp. 17–30.
[12] D. C. David G. Ullman, Stephen Wood, “The importance of drawing in themechanical design process,” Comput. and Graph., vol. 14, no. 2, pp. 263–274,1990.
63

64
[13] D. Schon and G. Wiggins, “Kinds of seeing and their functions in designing,”Design studies, vol. 13, no. 2, pp. 135–156, 1992.
[14] A. M. A. Shuang Song, “Insights on designers sketching activities in newproduct design teams,” in ASME 2004 Int. Design Eng. Tech. Conf. and Comput.and Info. in Eng. Conf., Salt Lake City, UT, 2004, pp. 351–360.
[15] G. Goldschmidt, “The dialects of sketching,” Creativity Res. J., vol. 4, no. 2,pp. 123–143, Nov. 2009.
[16] A. R. Martina Schutze, Pierre Sachse, “Support value of sketching in thedesign process,” Res. in Eng. Design, vol. 14, no. 2, pp. 89–97, May 2003.
[17] M. C. Yang, “Observations on concept generation and sketching in engineer-ing design,” Res. in Eng. Design, vol. 20, no. 1, pp. 1–11, Dec. 2009.
[18] M. Espinoza, “Online architectural sketching interface for simulations,” M.Thesis Dept. Comp. Sci., Rensselaer Polytechnic Institute, Troy, NY, 2016.
[19] Y. Sheng, T. C. Yapo, C. Young, and B. Cutler, “A spatially augmented real-ity sketching interface for architectural daylighting design,” IEEE Trans. Vis.Comput. Graph., vol. 17, no. 1, pp. 38–50, Jan. 2011.
[20] cogNiTioN. Newbie: Intro to cron. [Online]. Available: http://www.unixgeeks.org/security/newbie/unix/cron-1.html (Last Accessed: Jun 282016).
[21] S. N. S. Rejean Plamondon, “On-line and off-line handwriting recognition: Acomprehensive survey,” IEEE Trans. on Pattern Anal. and Mach. Intell., vol. 22,no. 1, pp. 63–84, Jan. 2000.
[22] J. R. A. W. S. Jaeger, S. Manke, “Online handwriting recognition: the npen++recognizer,” Int. J. on Document Anal. and Recognition, vol. 3, no. 3, pp. 169–180, Mar. 2001.
[23] S. H. J. Pradeep, E. Srinivasan, “Diagonal based feature extraction for hand-written character recognition system using neural network,” in Int. Conf. onElectron. Comput. Tech., Kanyakumari, India, Apr. 2011, pp. 364–368.
[24] W. T. Jianying Hu, Michael K. Brown, “Hmm based on-line handwritingrecognition,” IEEE Trans. on Pattern Anal. and Mach. Intell., vol. 18, no. 10, pp.1039–1045, Oct. 1996.
[25] H. B. U.-V. Marti, “The iam-database: an english sentence database for of-fline handwriting recognition,” Int. J. on Document Anal. and Recog., vol. 5,no. 1, pp. 39–46, Nov. 2002.

65
[26] J. A. J. M. J. Fonseca, “Using fuzzy logic to recognize geometric shapes in-teractively,” in Proc. of the 9th Int. Conf. on Fuzzy Syst. (FUZZ-IEEE 2000), SanAntonio, TX, 2000, pp. 291–296.
[27] J. O. W. Lisa Anthony, “A lightweight multistroke recognizer for user in-terface prototypes,” in Proc. GI ’10 Proc. of Graph. Interface 2010, Toronto,Canada, 2010, pp. 245–252.
[28] Y. L. Jacob O. Wobbrock, Andrew D. Wilson, “Gestures without libraries,toolkits or training: A $1 recognizer for user interface prototypes,” in Pro-ceeding UIST ’07 Proc. of the 20th Annu. ACM Symp. on User Interface Softwareand Tech., New York, NY, 2007, pp. 159–168.
[29] D. Glaser et al., “A sketch-modelling program for lighting analysis,” in Proc.10th Comput. Aided Arch. Des. Futures Int. Conf., Tainan, Taiwan, 2003, pp.371–382.
[30] E. Y.-L. Do, “VR sketchpad,” in Proc. 9th Comput. Aided Arch. Des. Futures Int.Conf., Eindhoven, Netherlands, 2001, pp. 161–172.
[31] D. Rubine, “Specifying gestures by example,” in SIGGRAPH ’91 Proc. of the18th Annu. Conf. on Comput. Graph. and Interactive Techniques, New York, NY,1991, pp. 329–337.
[32] J. I. Hong and J. A. Landay, “Satin: A toolkit for informal ink-based applica-tions,” in UIST ’00 Proceedings of the 13th Annu. ACM Symp. on User InterfaceSoftware and Tech., New York, NY, 2000, pp. 63–72.
[33] B. Cutler and J. Nasman, “Interpreting physical sketches as architecturalmodels,” in Adv. in Arch. Geometry 2010, C. Ceccato, Ed. Vienna, Austria:Springer Vienna Architecture, 2010, ch. 1, pp. 15–35.
[34] Introducing JSON. [Online]. Available: http://www.json.org (Last Accessed:Jul 3 2016).
[35] D. Baranovskiy. Raphael: Cross-browser vector graphics the easy way.[Online]. Available: https://github.com/DmitryBaranovskiy/raphael (LastAccessed: Jul 3 2016).
[36] E. Alias. Raphael.FreeTransform. [Online]. Available: https://github.com/AliasIO/Raphael.FreeTransform (Last Accessed: Jul 3 2016).
[37] Standard Dimensions for Furniture Design, Capital Area Woodworkers Std.,(Last Accessed: Jun 28 2016).