size distributions of elemental carbon and its ... · pdf file4institute of tropical and...
TRANSCRIPT

Atmos. Chem. Phys., 10, 5107–5119, 2010www.atmos-chem-phys.net/10/5107/2010/doi:10.5194/acp-10-5107-2010© Author(s) 2010. CC Attribution 3.0 License.
AtmosphericChemistry
and Physics
Size distributions of elemental carbon and its contribution to lightextinction in urban and rural locations in the pearl river deltaregion, China
H. Yu1,2, C. Wu1,3, D. Wu4, and J. Z. Yu1,2
1Division of Environment, Hong Kong University of Science and Technology, Clear Water Bay, Kowloon, Hong Kong, China2Department of Chemistry, Hong Kong University of Science and Technology, Clear Water Bay, Kowloon, Hong Kong, China3Atmospheric Research Center, HKUST Fok Ying Tung Graduate School, Nansha, Guangzhou 511458, China4Institute of Tropical and Marine Meteorology, China Meteorological Administration, Guangzhou 510080, China
Received: 21 August 2009 – Published in Atmos. Chem. Phys. Discuss.: 30 October 2009Revised: 17 May 2010 – Accepted: 28 May 2010 – Published: 8 June 2010
Abstract. Elemental carbon (EC) in size-segregated aerosolsamples were determined at five urban, one suburban, andone rural locations in the Pearl River Delta region in SouthChina during 2006–2008 period. The size modal character-istics of EC were different at the urban and suburban/rurallocations. The urban EC had a dominant condensation modewith a mass median aerodynamic diameter (MMAD) in the0.36–0.43 µm range and a slightly less abundant mode inthe droplet mode size (MMAD: 0.8–1.1 µm), while the sub-urban/rural EC had a prominent mode in the droplet modesize (MMAD: 0.7–1.1 µm) and a minor condensation mode(MMAD: 0.22–0.33 µm). Calculations using Mie theory andthe measured size distributions of EC, organic carbon, andmajor inorganic ions indicate that EC-containing particlescontributed 76±20% of the observed light extinction at theurban sites. Among the EC-containing particles, EC massalone contributed 21±11% of the observed light extinctionwhile non-EC materials on the EC particles (i.e., organicmatter, ammonium sulfate, and water) contributed 55±15%.At the suburban/rural locations, EC-containing particles con-tributed 37–48% of the measured light extinction, with ECmass contributing 4–10% and non-EC coating materials con-tributing the remaining light extinction. Our results sug-gest that EC-containing particles were important to the over-all light extinction in the urban atmospheres due to theirmore abundant presence from vehicular emissions. The EC-containing particles in the suburban/rural locations had a re-duced but still significant contribution to light extinction bud-get.
Correspondence to:J. Z. Yu([email protected])
1 Introduction
Element carbon (EC) and organic carbon (OC) make up asignificant fraction of ambient aerosol mass. The Pearl RiverDelta (PRD) region is a fast-developing economic zone lo-cated on the southeast coast of China. Abundance of EC andOC in bulk PM2.5 or PM10 aerosol samples in the PRD regionhave been reported in a number of studies (Ho et al., 2002,2006; Cao et al., 2003, 2004; Yu et al., 2004; Chow et al.,2005; Duan et al., 2007; Hagler et al., 2006; Andreae et al.,2008). The concentrations of EC in PM10 were 4.7–10.4 µgm−3 in urban locations and 2.5–6.2 µg m−3 in suburban lo-cations. The cumulative evidence presented in these studiesindicates that EC in the PRD region came mainly from vehi-cle emissions.
The worsening visibility degradation is of increasing pub-lic concern in the PRD region (e.g., Wu et al., 2007). Theattenuation of light has contributions from EC, OC, andother aerosol constituents such as sulfate, sea salt, nitrate,and crustal materials as well as gas molecules (Lai and Se-queira, 2001; Malm et al., 1994; Bergin et al., 2001; Hasanand Dzubay, 1983). EC is the primary light absorptionconstituent in ambient aerosols (Horvath, 1993; Jacobson,2001). Andreae et al. (2008) obtained a mass absorption ef-ficiency (MAE) of EC of 7.7 m2 g−1 in urban Guangzhou byregressing the measured absorption coefficient against ECand OC. Wang (2003) used a modified IMPROVE formulaand estimated that EC and OC contributed 12% and 17% oflight extinction in a rural location and 26% and 21% in an ur-ban area in Hong Kong. Using Mie theory and assuming thatall components were externally mixed, Cheng et al. (2008)calculated the fractional contributions of EC and OC to light
Published by Copernicus Publications on behalf of the European Geosciences Union.

5108 H. Yu et al.: Size distributions of elemental carbon and its contribution to light extinction
extinction to be at the same value of 17% in Xinken, a rurallocation in the PRD region.
Knowledge of EC size distribution is essential in study-ing aerosol light extinction (Horvath, 1995; Vanderlei Mar-tins et al., 1998; Sloane et al., 1991). EC size distribu-tion measurements in the PRD region are limited. Gnauket al. (2008) measured EC, OC, and a few selected organiccompound classes in size-segregated aerosols in Xinken,a rural/coastal background site 60 km to the southeast ofGuangzhou. Our group reported EC size distributions inShenzhen and Guangzhou, two metropolitan cities in thePRD region (Huang and Yu, 2008; Yu and Yu, 2009). In thisstudy, we report the measurements of EC size distributions atfive urban locations in Guangzhou throughout a one-year pe-riod from December 2006 to December 2007 and one subur-ban and one rural location in the PRD region in selected sum-mer and winter months. Light extinction due to aerosols canbe calculated theoretically for spherical particles of knownsize and composition (van de Hulst, 1981; Bohren and Huff-man, 1983). The objective of this study was to evaluate thecontribution of EC-containing particles to light extinction atselected urban and suburban/rural locations in the PRD re-gion.
2 Experimental section
2.1 Aerosol sample collection and chemical analysis
Size-segregated aerosol samples were collected at five ur-ban, one suburban, and one rural site in the PRD regionand their locations are shown in Fig. 1a. The five ur-ban sites are meteorological monitoring stations set up bythe Guangzhou (GZ) local meteorology administration andthey are within a radius of 7.5 km in the GZ urban area(23◦18′03′′ N, 113◦15′50′′ E). GZ has 27 million inhabi-tants and 1.83 million vehicles (Guangzhou Transport Plan-ning Research Institute, 2006). The rural site is Backgar-den (BG) (23◦29′14′′ N, 113◦02′18′′ E), located 50 km tothe northwest of GZ. The suburban site is on the cam-pus of Hong Kong University of Science and Technology(HKUST, 23◦19′12′′N, 114◦16′12′′ E), a suburban locationon the southeast coast of Hong Kong. There are no localindustries or intensive vehicular traffic at the rural and thesuburban locations.
In summer, the prevailing southeast monsoon places theBG site downwind of the GZ urban area while the HKUSTsite is upwind of the PRD region. In winter, the northwestmonsoon affects the region and places HKUST in downwindof the PRD region. The upwind and downwind relationshipsamong the three sites are demonstrated in two wind vectormaps of the PRD region generated by MM5 model based onlocal surface wind observations (Fig. 1b and c) (Fung et al.,2005).
Table 1 lists the sampling details at each location. A to-tal of 29 sets of size-segregated aerosol samples were col-lected at the five urban sites using eight-stage cascade im-pactor samplers (Thermo Andersen, Waltham, MA, USA) inthe months of January, April, May, July, October, Novemberand December in 2006–2007. The sampling season coveredwinter, spring, summer and fall in GZ. Sample collectionat the BG and HKUST sites was carried out using a ten-stage Micro-Orifice Uniform Deposit Impactor (MOUDI,MSP Corp, Shoreview, MN USA). Seven sets of sampleswere collected at BG in July 2006. At HKUST, eight setsof samples were collected in August 2007 and ten sets werecollected in January and February 2008. The sample dura-tion ranged from one to three days. Quartz fiber filters wereused as collection substrate in all the samples. Field blanksamples were collected in each sampling period.
Filters were stored at 4◦C until EC and OC were ana-lyzed using a thermal/optical transmittance aerosol carbonanalyzer (Sunset Laboratory, OR) (Birch and Cary, 1996).The first stage of analysis, during which helium is the car-rier gas, consisted of four temperature steps at 310◦C(OC1),475◦C(OC2), 615◦C(OC3), and 870◦C(OC4). The secondstage of the analysis is conducted in a 2% O2/98% He atmo-sphere and consists of five temperature steps at 550◦C(EC1),625◦C(EC2), 700◦C(EC3), 850◦C(EC4) and 870◦C(EC5).The terms OC1-OC4 and EC1-EC5 inside the parentheses re-fer to the amount of C released from the filter substrate corre-sponding to each temperature step. Due to the non-uniformdeposition nature of the cascade impactor and the MOUDIsamples, laser correction does not work properly to set theOC and EC split point (Huang and Yu, 2008). Instead, pos-itive matrix factorization (PMF2, version 4.2) has been usedto apportion the evolved C peaks (OC1-OC4 and EC1-EC5)
in the thermograms to OC and EC. The method details arepresented in our previous paper (Yu and Yu, 2009). Com-pared with apparent EC (AEC, the sum of EC1-EC5, i.e., theamount of carbon that is released from the filter substrate dur-ing the second stage of analysis in O2/He atmosphere), thePMF-resolved EC accounts for 77% of AEC and the PMF-resolved OC is 112% of apparent OC (AOC, the sum of OC1-OC4) in the GZ urban samples. In the HKUST samples, thePMF-resolved EC is 79% of AEC and PMF-resolved OC is115% of AOC. In the BG samples, the PMF-resolved EC is81% of AEC and PMF-resolved OC is 107% of AOC. It isexpected that AEC would overestimate actual EC while AOCwould underestimate actual OC since pyrolytically generatedEC from charring of OC appears as part of AEC.
Ionic species including sulfate, nitrate, chloride, oxalate,Na+, K+, NH+
4 , Ca2+, and Mg2+ were determined by ionchromatography (Yang et al., 2005).
2.2 Light extinction data
Light extinction data (σext,obs) at the urban sites in GZ wereretrieved from visibility records in the SYNOP report of
Atmos. Chem. Phys., 10, 5107–5119, 2010 www.atmos-chem-phys.net/10/5107/2010/

H. Yu et al.: Size distributions of elemental carbon and its contribution to light extinction 5109
(a)
(a)
(b) (c)
(b)
(a)
(b) (c)
(c)
(a)
(b) (c)
Fig. 1. (a)Locations of five urban sites, one suburban site, and one rural site in the Pearl River Delta region. 1, Rural site at Backgarden; 2,Guangdong Province Meteorological Bureau (GDMB), Yuexiu District; 3, Liwan station; 4, Huangpu station; 5, Haizhu station; 6, Panyu;and 7, HKUST, suburban site in Hong Kong. Sites 2–6 are in the urban area of Guangzhou.(b) Horizontal wind vector map during aHKUST winter sampling day (10 January 2008).(c) Horizontal wind vector map during a BG sampling day (3 July 2006). The wind vectormaps were generated by MM5 model based on local surface wind observations in the PRD region (Credit: Environmental Central Facility,HKUST, http://envf.ust.hk/). The color contour indicates the surface temperatures in the region. The surface temperatures ranged from 18 to22◦C on the winter sampling days and 30 to 36◦C on the summer sampling days.
Guangzhou Baiyun airport, located 30 km to the north ofdowntown GZ. Theσext,obs values at HKUST were derivedfrom human visibility observations made at the Hong KongObservatory (HKO), located 10 km to the east of HKUST inthe same air shed. Comparisons of HKO visibility data andthe measurement data by a forward scattering sensor installedat HKUST during the period of 1 January 2008 to 31 March2009 indicate that the two sets of data were closely correlated(zero-intercept regression results:r2
= 0.55, slope= 1.1,n = 1307) when the HKO visibility was lower than 16 km(σext,obs< 244 Mm−1), Only on very clean days when thevisibility at HKO was higher than 16 km, the HKO valueswere higher than HKUST values. For measurement reportedin this work, 17 out of 18 sets of samples were collected ondays when the HKO visibility was lower than 16 km. There-fore we believe that the HKO data could be used to approxi-mate the visibility at HKUST. We here choose to use the hu-
man visibility observations at HKO on the consideration thatthe visibility sensor measurements do not reflect light extinc-tion contributions due to absorption of light by aerosols. Vis-ibility data were not available at BG. Instead, aerosol extinc-tion measured by a nephelometer and a photoacoustic spec-trometer operated by Max Planck Institute was used (Garlandet al., 2008).
3 Results and discussion
In the discussion below, the aerosol samples were catego-rized into five groups, i.e., GZ non-haze day samples, GZhaze day samples, BG summer samples, HKUST summerand winter samples. The determination of a haze day wasbased on the definition of haze by China Meteorology Ad-ministration (CMA). CMA defines haze as visibility degrada-tion with a visual range less than 10 km caused by aerosols in
www.atmos-chem-phys.net/10/5107/2010/ Atmos. Chem. Phys., 10, 5107–5119, 2010
5110 H. Yu et al.: Size distributions of elemental carbon and its contribution to light extinction
Table 1. Size-segregated aerosol samples collected in selected urban, suburban and rural locations in the pearl river delta region.
Location* period # of sets sampler Cut points Visibility data
Urban Guangzhou site 2 Dec 2006 3 Andersen Cascadeimpactor
8 stages, 0.43–10 µmafter filter,<0.43 µm
SYNOP visibility report atGuangzhou Baiyun Airport
site 2 Jan 2007 2site 2 Apr 2007 1site 2, 3, 4, 5 May 2007 4site 2, 3, 4, 5 Jul 2007 4site 6 Oct 2007 3site 2, 6 Nov 2007 7site 2, 6 Dec 2007 4
Rural Backgarden site 1 Jul 2006 7 MOUDI 10 stages, 0.056–18 µm nephelometer and photoa-coustic spectrometer oper-ated by Max Planck Insti-tute
Suburban HKUST site 7 Aug 2007 8 MOUDI 10stages, 0.056–18 µm Human observations atHong Kong Observatory
Jan–Feb 2008 10
* Locations of sites 1–7 are shown in Fig. 1.
the atmosphere under relatively low relative humidity (RH)conditions (CMA, 2003). All the 29 sets of GZ sampleswere collected on non-raining days. Eighteen of these sam-ples were collected on non-haze days and eleven collected onhaze days according to the CMA definition of haze.
Ambient aerosols are known to consist of multiple sizemodes. Each size mode is associated with unique growth orformation mechanisms. The size distribution of each mode isdescribed by three parameters, i.e., the mass median aerody-namic diameter (MMAD), the geometric standard deviation(σg), and the mass concentration (Cm) (Seinfeld and Pan-dis, 2006). Continuous distributions of the size modes wereinverted from the measured mass concentrations in the sizebins of the MOUDI or Andersen Impactor samplers using theinversion technique described by Dong et al. (2004). Table 2lists the average modal characteristics of EC, OC and sulfatein the five sample groups. The average EC size distributionplots are shown in Fig. 2.
3.1 Modal characteristics of EC, OC and sulfate inGuangzhou urban locations
The total EC concentration was 9.4±5.1 µg m−3 on the hazedays and 6.8±4.1 µg m−3 on the non-haze days. The sizesegregated EC data in GZ were fit with three modes, a con-densation mode with an MMAD of 0.36–0.46 µm, a dropletmode with an MMAD of 0.8–1.1 µm, and a coarse mode withan MMAD of 4–7 µm. Here, the MMAD ranges refer to themodal peak size ranges in individual samples. Despite thedifferent locations of the five monitoring stations, our resultsshow that the EC size distributions were very similar amongthe five sites. This similarity may be explained by the factthat GZ is highly urbanized and all the five sites are close to
roadside and consequently heavily influenced by vehicularemissions.
The condensation mode was the most prominent mode, ac-counting for 49% (non-haze days) and 44% (haze days) ofthe total EC mass. A dominant presence of the condensationmode at∼0.40 µm was consistent with the EC size distribu-tions measured in a roadway tunnel in this region (Huang etal., 2006) and our earlier measurements using nano-MOUDI(Yu and Yu, 2009). This characteristic of EC size distribu-tions could be explained as a result of high engine loads andlow combustion efficiencies in Chinese vehicles. The dropletmode was slightly less abundant, accounting for 30% (non-haze days) and 38% (haze-days). Theoretical analysis byHuang and Yu (2008) suggests that in-cloud processing canexplain the presence of EC in the droplet mode size.
OC and sulfate had the same three modes in the GZ sam-ples. As shown in Table 2, MMADs of OC and sulfate modeswere close to those of EC in both sub-groups of the GZ sam-ples. The relative abundances of OC versus EC and sulfateversus EC were dependent on the particle size. The OC/ECratio in the condensation mode is 0.8 on the non-haze daysand 0.9 on the haze days, significantly smaller than those inthe droplet mode (1.6 on non-haze days and 2.1 on haze days)(Table 3). These results indicate that∼0.4 µm mode EC isfresh soot particles while EC in the∼0.9 µm mode is agedwith extra OC coating. The sulfate/EC ratio is also muchhigher in the droplet mode, about 2.5 times that in the con-densation mode (Table 3), supporting that addition of sulfatethrough in-cloud processing could cause growth of the ECparticles from the condensation mode to the droplet mode.
We also noted a minor difference between haze day sam-ples and non-haze day samples. The condensation mode inthe haze day samples peaked at a larger size (0.41±0.03 µm)
Atmos. Chem. Phys., 10, 5107–5119, 2010 www.atmos-chem-phys.net/10/5107/2010/

H. Yu et al.: Size distributions of elemental carbon and its contribution to light extinction 5111
Fig. 2. Mean elemental carbon size distributions in five groups of samples. From top left to bottom right: Guangzhou urban sampleson non-haze days, Guangzhou urban samples on haze days, Backgarden summer samples, HKUST winter samples, and HKUST summersamples.
Table 2. MMAD values and modal concentrations of EC, OC, and sulfate in the urban, suburban and rural samples collected in the pearlriver delta region.
Guangzhou non-haze days Guangzhou haze days
size mode MMAD modal conc. MMAD modal conc.(µm) (µg m−3) (µm) (µg m−3)
ECCondensation 0.38±0.04 3.32±1.30 (49%) 0.41±0.03 4.17±2.1 (44%)Droplet 0.95±0.12 2.01±1.60 (30%) 0.90±0.10 3.58±2.59 (38%)Coarse 5.1±1.6 1.43±0.87 (21%) 5.20±1.23 1.63±1.18 (17%)
OCCondensation 0.38±0.02 2.68±1.55 (20%) 0.40±0.02 3.75±3.1(17%)Droplet 0.98±0.06 3.16±0.89 (24%) 0.92±0.06 7.35±2.34 (33%)Coarse 5.1±0.7 7.6±3.0 (57%) 4.8±0.7 11.5±4.7 (51%)
sulfateCondensation 0.38±0.06 4.56±2.40 (29%) 0.42±0.06 8.90±3.06 (24%)Droplet 0.94±0.12 6.95±5.10 (45%) 0.89±0.12 19.02±6.67 (51%)Coarse 4.7±0.8 4.1±3.0 (26%) 5.0±1.2 9.6±1.5 (26%)
Backgarden summer samples HKUST winter samples HKUST summer samples
size mode MMAD modal conc. MMAD modal conc. MMAD modal conc.(µm) (µg m−3) (µm) (µg m−3) (µm) (µg m−3)
ECCondensation 0.26±0.03 0.47±0.35 (33%) 0.26±0.04 0.61±0.60 (15%) 0.25±0.02 0.35±0.21 (30%)Droplet 0.99±0.09 0.89±0.51 (63%) 0.90±0.07 3.29±1.00 (81%) 0.77±0.07 0.68±0.48 (58%)Coarse 5.0±0.6 0.05±0.03 (4%) 3.7±0.8 0.18±0.14 (4%) 4.1±1.1 0.15±0.12 (12%)
OCCondensation 0.25±0.03 1.0±0.7 (28%) 0.27±0.06 1.11±0.32 (14%) 0.25±0.06 0.82±0.41 (23%)Droplet 1.0±0.06 1.9±0.4 (53%) 0.91±0.08 6.0±1.0 (74%) 0.73±0.08 1.62±0.53 (45%)Coarse 5.2±0.5 0.70±0.23 (19%) 3.8±1.6 1.04±0.35 (13%) 4.3±1.5 1.18±0.43 (33%)
sulfateCondensation 0.23±0.05 0.95±0.28 (18%) 0.27±0.06 1.25±0.58 (8%) 0.23±0.02 0.70±0.56 (14%)Droplet 0.95±0.07 4.1±1.0 (78%) 0.93±0.14 12.97±4.21 (81%) 0.75±0.10 3.5±1.3 (71%)Coarse 5.7±0.5 0.2±0.1 (4%) 3.7±1.4 1.83±0.48 (911%) 4.5±0.9 0.74±0.36 (15%)
www.atmos-chem-phys.net/10/5107/2010/ Atmos. Chem. Phys., 10, 5107–5119, 2010

5112 H. Yu et al.: Size distributions of elemental carbon and its contribution to light extinction
Table 3. The OC/EC and sulfate/EC ratios in three size modes.
Size mode Guangzhou Guangzhou Backgarden HKUST HKUSTnon-haze days haze days summer samples winter samples summer samples
OC/EC Condensation 0.80 0.90 2.10 1.80 2.34Droplet 1.60 2.10 2.13 1.82 2.38Coarse 5.30 7.00 14.00 5.80 7.80
sulfate/EC Condensation 1.37 2.13 2.00 2.00 2.00Droplet 3.45 5.30 4.60 3.90 5.10Coarse 2.80 5.80 4.00 10.10 4.90
than that in the non-haze day samples (0.38±0.04 µm). Thedroplet mode peaked at a smaller size in the haze daysamples (0.90±0.1 µm) than in the non-haze day samples(0.95±0.12 µm). The small shift in the modal peak positioncould be attributed to more semivolatile organics/inorganicsavailable for partitioning onto condensation-mode particleson the haze days, leading to a larger condensation mode. Inthe meantime, the competition for sulfate by a larger numberof cloud-activated aerosol particles led to a smaller dropletmode on the haze days.
3.2 Modal characteristics of EC, OC, and sulfate at thesuburban and rural locations
The EC concentrations at the rural and suburban locationswere significantly lower than those measured at the urbanlocations, consistent with their respective site characteris-tics. The total EC concentration was 1.4±0.8 µg m−3 atBG. At HKUST, the average total EC concentration was4.1±1.5 µg m−3 in the winter samples and 1.2±0.8 µg m−3
in the summer samples.EC, OC, and sulfate shared similar size distribution char-
acteristics at the two suburban/rural locations, but their sizedistributions were distinct from those at the urban locationsin that the most significant mode was the droplet mode(MMAD: 0.7–1.1 µm). The droplet-mode EC accounted for63% of the total EC mass in the BG samples, 81% in theHKUST winter samples, and 58% in the HKUST summersamples. 70–80% of sulfate and 45–74% of OC were in thedroplet mode at the suburban and rural sites.
The more prominent presence of the droplet mode at thesuburban and rural sites was a result of atmospheric aging.BG is downwind of GZ urban areas during the summer timeand HKUST is downwind of the PRD region during the win-ter time. It took about 2–3 h for the air mass to move from GZto the downwind locations (Zhang and Zhang, 2001). Duringthe transport, condensation of semivolatile organics/sulfuricacid/NH3 results in an organics/sulfate coating on the ECparticles (Xiao et al., 2009; Miyazaki et al., 2009). Theaged EC particles have a hydrophilic surface and therebyreadily act as cloud condensation nuclei (CCN). Upon cloud-activation, oxidation of SO2 in cloud droplets and subsequent
water vaporization leads to the growth of the condensation-mode EC particles to the droplet mode through addition ofsulfate materials. The droplet-mode sulfate/EC ratios are 4.6,3.9, and 5.1 in the three sample groups, higher than the ra-tio (∼2) in the condensation mode. The enrichment of sul-fate in the droplet mode supports the possibility that cloud-processing of the condensation-mode EC particles occurred.
Under the influence of the prevailing southeast monsoon,HKUST in the summer is often upwind of the PRD region.Consequently, it is influenced less by air pollution producedin the region and less growth in particle size during atmo-spheric aging is expected due to less abundant condensablematerials (e.g., secondary sulfate). This is reflected in thesmaller MMAD of the droplet-mode EC (0.77 µm) in theHKUST summer samples than those in the BG summer sam-ples and HKUST winter samples (MMAD: 0.9–1.0 µm).
The condensation mode (0.22–0.33 µm) was the secondlargest mode, accounting for 15–33% of the total EC mass. Itis also noted that the size of the condensation-mode MMAD(0.22–0.33 µm) was smaller in the suburban/rural samplesthan that in the urban samples (∼0.4 µm). While the OC/ECratios in the condensation mode (1.8–2.3) are almost equalto those in the droplet mode, they are much higher than theOC/EC ratios (0.8–0.9) in the freshly emitted 0.4 µm EC inthe urban samples (Table 3). Our earlier measurements atGZ using nano-MOUDI identified two condensation modes,with MMAD values of∼0.15 µm and∼0.4 µm. Atmosphericaging of the 0.15 µm EC particles (e.g., vapor condensation)could explain the EC particles in the 0.22-0.33 µm conden-sation mode in the suburban/rural samples. In comparisonwith the ∼0.4 µm EC particles, particles in the size rangeof 0.2–0.3 µm are less effectively removed by dry depositionand less likely cloud-activated (Huang et al., 2006; Seinfeldand Pandis, 2006). The combined result of condensationgrowth and in-cloud processing explains the observation ofa condensation-mode EC at an MMAD of 0.22–0.33 µm, thedepletion of the condensation-mode EC at 0.4 µm, and thepresence of a droplet mode EC at the suburban/rural loca-tions.
Atmos. Chem. Phys., 10, 5107–5119, 2010 www.atmos-chem-phys.net/10/5107/2010/

H. Yu et al.: Size distributions of elemental carbon and its contribution to light extinction 5113
Fig. 3. EC-normalized mass scattering efficiency (MSE), mass absorption efficiency (MAE) and mass extinction efficiency (MEE) of fourtypes of EC-containing particles, taking chemical composition of the HKUST sample collected on 5–6 February 2008 as example.
3.3 Light extinction due to EC-containing particles
In this section, we evaluate the contribution of EC-containingparticles to aerosol light extinction using Mie theory and themeasured size distribution data on EC, OC and inorganicspecies. We here only consider EC particles in the condensa-tion and the droplet modes, considering that the contributionof coarse-mode EC particles to light extinction is negligibledue to their size much larger than the wavelengths of visiblelight.
Information on chemical composition and number sizedistribution of EC-containing particles is required in Mie the-ory calculation (Zhang et al., 1994; Eldering et al., 1994;Lowenthal et al., 1995). The assumptions made in our calcu-lation are described below.
1. In the droplet mode (MMAD: 0.7–1.1 µm), our analysisin Sects. 3.1 and 3.2 support that EC is internally mixedwith ammonium, sulfate, and organic matter (OM). Am-monium and sulfate are the major substances that addto CCN and cause condensation-mode EC particles togrow to the droplet-mode size. The concentrations ofammonium ion and sulfate ion input to AIM2 (Clegget al., 1998) are from the measurement data. In ourmeasurements, the molar ratios of [NH+
4 ]/[SO2−
4 ] rangefrom 1.4 to 2.0, indicating the coexistence of ammo-nium sulfate and ammonium bisulfate. The amount ofwater absorbed due to the two forms of sulfate under therespective ambient RH is calculated using AIM2. Theobserved ambient RH varied from 35% to 83% duringour sampling periods. The average RH and one stan-dard variation values in the individual sample groupsare: 52±10% in the GZ non-haze day samples, 64±5%in the GZ haze day samples, 77±4% in the BG sum-mer samples, 78± 4% in the HKUST summer samples,and 67±9% in the HKUST winter samples. The cal-culated water content contributes from 10±4.1% (GZ
samples) to 46±4.7% (HKUST summer samples) of thedroplet-mode particle mass during the sampling peri-ods. Less is understood about the hygroscopic prop-erties of organic aerosols or inorganic/organic aerosolmixtures. Depending on whether the hydrophobic orthe hydrophilic fraction dominates, organics could ei-ther enhance or diminish water absorption by inorganics(Saxena et al., 1995). In the original IMPROVE formula(Malm et al., 1994) and the revised IMPROVE formula(Pitchford et al., 2007), water uptake by OM is not con-sidered by setting water growth factor as 1. We hereadopt the same treatment for OM and do not considerinfluence of organic materials on water uptake in ourcalculations.
2. The condensation-mode EC particles are assumed to beinternally mixed with OM. Sulfate is assumed to beexternally mixed with EC in the condensation mode.We compared the calculated light extinction values forEC-containing particles in the condensation mode un-der internal versus external mixing scenario with sul-fate. In the scenario of internally-mixed EC and sulfate,the calculated light extinction of EC-containing parti-cles in the condensation mode increases 6–9% at thesuburban/rural sites and increases∼30% at the urbansites. Therefore, the source of the uncertainty for allEC-containing particles (including both the condensa-tion mode and the droplet mode), arising from the mix-ing state of EC and sulfate in the condensation mode, isless than 9% at the suburban/rural sites and 30% at theurban sites.
3. OM or sulfate that is internally mixed with EC hasthe same lognormal size distributions (i.e., the sameMMAD and σg) as EC. The volume fractions ofinternally-mixed components are assumed to be uni-form for all particles in a given mode.
www.atmos-chem-phys.net/10/5107/2010/ Atmos. Chem. Phys., 10, 5107–5119, 2010

5114 H. Yu et al.: Size distributions of elemental carbon and its contribution to light extinction
4. The refractive index (n) and the density of particlesin each mode are determined to be a volume-weightedaverage of their constituents. Literature values of therefractive index and density adopted are: 1.96–0.66i
and 1.5 g cm−3 for EC (Hitzenberger et al., 1999; Bondand Bergstorm, 2009), 1.55–0.005i and 1.0 g cm−3 forOM (Mallet et al., 2003), and 1.33–0i and 1.0 g cm−3
for water (Hale and Querry, 1973), and 1.53–0i and1.78 g cm−3 for ammonium sulfate (Tang, 1996; Chenget al., 2006). The refractive index of ammonium bisul-fate (1.473–0i) is slightly lower than that of ammoniumsulfate (1.53–0i). We found that the calculated light ex-tinction coefficient is not sensitive to such a small dif-ference in refractive index of the two species. There-fore, the refractive indices of sulfate and bisulfate mix-tures are set to be that of ammonium sulfate in all thesubsequent calculations. The density of the mixtureis also set to be that of ammonium sulfate (Cheng etal., 2006). The number size distribution is calculatedfrom the measured lognormal mass size distribution as-suming that all particles are spherical. OM is calcu-lated from OC multiplying by a factor of 1.8 (Hand andMalm, 2006). Finally, with the light wavelength (λ) setto 550 nm (green), Mie scattering efficiency (Qsca(n,Dp, λ)) and Mie absorption efficiency (Qabs(n, Dp,
λ)) are integrated over the accumulation particle sizerange to obtain the light scattering coefficient (σsca,calc)
and the light absorption coefficient (σabs,calc), respec-tively, in a given mode. The light extinction coefficient,σext,calc, is the sum ofσsca,calc andσabs,calc.
3.3.1 Light extinction of EC-containing particles indifferent size modes
Three EC-normalized light extinction efficiency parame-ters, mass absorption efficiency (MAE), mass scattering effi-ciency (MSE), and mass extinction efficiency (MEE) of theseparticles are discussed. MAE and MSE of EC-containingparticles are defined to be light extinction (σext) by EC par-ticles due to light absorption and scattering, respectively, di-vided by the EC mass. MEE is the sum of MAE and MSE.The three parameters depend on the particle size and chem-ical composition of the EC-containing particles. The latterin turn depends on the degree of atmospheric aging and thetype of atmospheric aging processes (e.g., vapor condensa-tion versus in-cloud processing).
For the purpose of demonstrating how optical characteris-tics of EC-containing particles change as the size and chem-ical composition change over the course of atmospheric ag-ing, the HKUST sample collected on 5–6 February 2008 wasused as an example for the calculation of the three light ex-tinction efficiency parameters. Figure 3 shows MAE, MSE,and MEE values of EC-containing particles of different sizesrelevant to this example. In this sample, the size distribu-tion was dominated by the droplet mode (MMAD: 0.82 µm)
and the modal concentrations for EC, OC, and ammoniumsulfate in the droplet mode were 2.1, 3.7, and 15.6 µg m−3,respectively. The absorbed water was estimated using AIM2to be 9.0 µg m−3 (Clegg et al., 1998). The droplet mode par-ticles are grown from freshly-emitted EC particles throughvapor condensation and cloud processing. It is reasonable toassume that the 0.82 µm particle (particle (d) in Fig. 3) is ofa spherical core-shell structure with EC being the core andsulfate and OM making up the outside spherical shell. Whenthis particle is stripped of OM, sulfate, and water, the diame-ter of the EC core left behind is estimated to be 0.35 µm. Wedenote this “naked” hypothetical EC particle as particle (b)(Fig. 3). Particle (c) is a 0.43 µm condensation-mode parti-cle consisting of the EC core and OM coating, but withoutsulfate coating, approximating an EC particle in the conden-sation mode that has been aged in the atmosphere to acquiredorganic coating but has not participated in cloud-processing.
As shown in Fig. 3, both MAE and MSE increase with theparticle diameter in particles containing the same amount ofEC mass, but the increase of MSE is much steeper than thatof MAE. The MAE and MSE values of the condensation-mode EC particles at 0.43 µm are calculated to be 8.8 and10.2 m2 g−1, respectively. The calculated MAE is in goodagreement with the MAE value of 7.7 m2 g−1 derived for ECin PM2.5 in an urban GZ location from light absorption mea-surements of dry aerosol using a photoacoustic spectrome-ter and EC measurements by a thermal/optical method (An-dreae et al., 2008). When EC particles of this size grow tothe droplet-mode size (e.g., 0.82 µm, particle (d) in Fig. 3)through sulfate addition during cloud processing, the MAEand MSE values increase to 20.9 and 66.2 m2 g−1, respec-tively. In another words, MAE is doubled while MSE in-creases by more than five-fold when the EC particles growfrom the condensation-mode size to the droplet-mode size.
The MAE and MSE of the “naked” EC particle (i.e.,particle (b) in Fig. 3) are 6.4 and 5.4 m2 g−1. Our calcu-lated results are consistent with the estimation by Chenget al. (2008). They reported that the MAE increases fromaround 6.0 to 10.0 m2 g−1 when the EC mixing state changesfrom an external to an internal mixture.
A smaller condensation-mode EC with an MMAD of∼0.15 µm was observed in GZ using nano-MOUDI (Yu andYu, 2009). EC size distribution measurements made in de-veloped countries typically describe a dominant condensa-tion mode at this size (Miguel et al., 2004; Venkataraman etal., 1994; Maenhaut et al., 2002). We calculated the MAEand MSE of such EC particles at 0.15 µm (particle (a) inFig. 3). The MAE is 11.6 m2 g−1, higher than the MAE of the0.43 µm particles due to the higher total cross section area as-sociated with the smaller EC particles for the same EC mass.The MSE is 5.9 m2 g−1, smaller than that of the 0.43 µm par-ticles (10.2 m2 g−1).
The above calculation is based on one HKUST sample.Calculations on other samples from GZ, BG and HKUSTshow that the “naked” EC particles have a size range of
Atmos. Chem. Phys., 10, 5107–5119, 2010 www.atmos-chem-phys.net/10/5107/2010/

H. Yu et al.: Size distributions of elemental carbon and its contribution to light extinction 5115
Fig. 4. Calculated and observed light extinction coefficients at the selected urban, suburban and rural locations in the Pearl River Deltaregion. An episodic biomass burning event occurred nearby the rural sampling site on the sampling day marked with *.
0.3–0.35 µm and MEE of 10.3–14.2 m2 g−1. The MAE andMSE of the droplet mode particles (particle d) range from45 to 88 m2 g−1, apparently dependent on particle size andchemical composition.
The above analysis shows that the light extinction abilityof EC particles is greatly enhanced when they grow to thedroplet mode as a result of sulfate addition. This in turn sug-gests that controlling EC and SO2 emissions is important inimproving visibility. We here consider two simplified con-trol scenarios to probe the relative effectiveness of control-ling SO2 and EC emissions on reducing the light extinctionof droplet-mode EC particles. In the base scenario, the modalconcentrations for EC, OC and ammonium sulfate are set tobe 2.1, 3.7, and 15.6 µg m−3, respectively. In the first con-trol scenario, the EC concentration is maintained as in thebase case while sulfate is reduced by half;σext decreases by26% with 23% due to scattering reduction and 3% due to ab-sorption reduction. In the second control scenario, sulfateis maintained as in the base case while EC is reduced byhalf; σext decreases by 32% with 24% from scattering and8% from absorption. These simple calculations demonstratethat control of both EC and SO2 could have significant bene-fits in reducing light attenuation caused by droplet-mode ECparticles.
3.3.2 Contribution of EC-containing particles toobserved light extinction
The observed total light extinction (σext,obs in Mm−1) is
calculated using the Koschmieder relationship,σext,obs =
3.912/R(V ), whereR(V ) is the average visual range dur-ing the sampling period of each sample. Light extinction dueto EC-containing particles is calculated to be the sum of theσext values of the droplet-mode and the condensation-modeEC particles. The calculated values (σext,calc) are compared
with the observed total light extinction in Fig. 4. The ECconcentrations are also shown in Fig. 4.
At the GZ urban locations,σext,cal by EC-containing parti-cles closely trackedσext,obs (Fig. 4) and accounted for a ma-jor fraction of the observed light extinction. EC-containingparticles explained 211±77.1 Mm−1 (80±23% of σext,obs)
on the non-haze days and 392±107 Mm−1 (72±15% ofσext,obs) on the haze days.
EC-containing particles at the suburban and rural locationsaccounted for a much reduced fraction ofσext,obs. The lightextinction by EC particles at HKUST was modeled to be126±42 Mm−1 in the summer samples and 201±35 Mm−1
in the winter samples, accounting for 37±13% and 48±7%of the observed light extinction. In the BG summer sam-ples, the EC particles attributed 90±49 Mm−1, accountingfor 38±9% of theσext,obs.
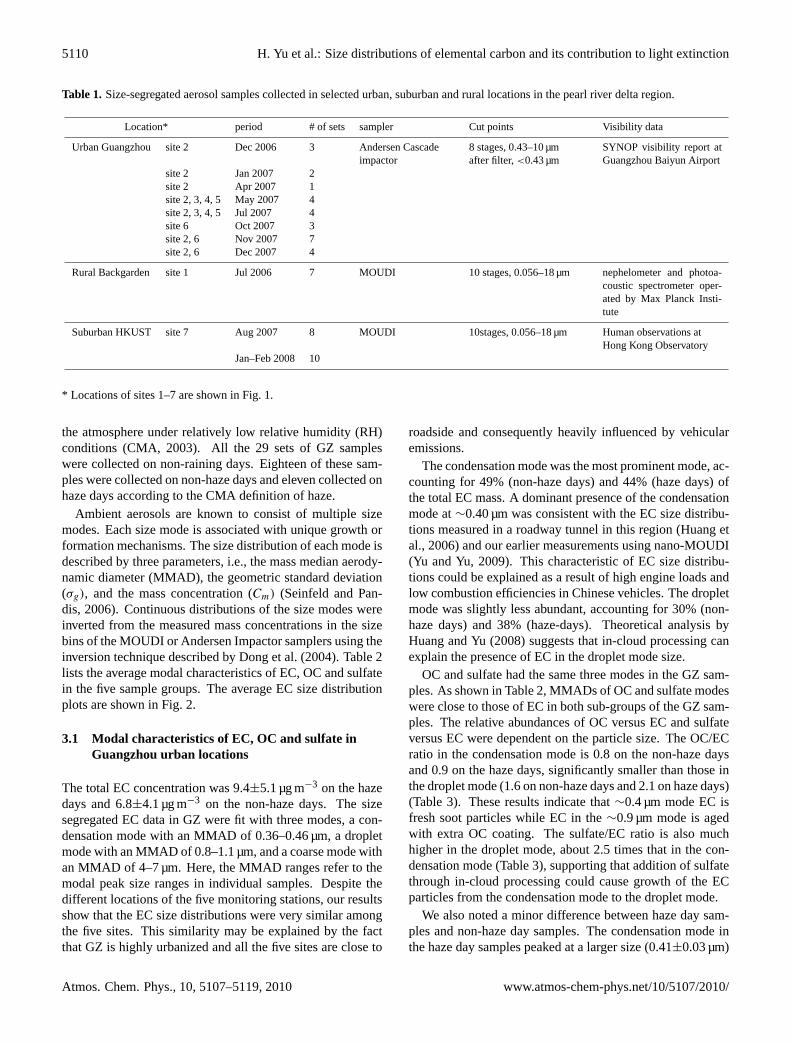
There was a large difference in the relative contribu-tions of condensation-mode and droplet-mode EC particlesto light extinction between the urban locations and the sub-urban/rural locations. Figure 5 compares the relative con-tributions to light extinction by EC in the two size modes.At the suburban and rural sites, the droplet-mode EC par-ticles dominated the contribution to light extinction by EC,with the droplet mode accounting for 87±7% of light ex-tinction attributable to EC-containing particles at HKUSTand 77±8% at BG. In comparison, the droplet mode con-tributed only 40±12% toσext,calc by EC in GZ. This differ-ence between urban and suburban/rural locations was linkedto the relative abundance of EC particles in the two modes.The condensation-mode EC was more abundant in the ur-ban atmosphere due to fresh vehicle emissions. When theair mass moved from the urban source regions to the subur-ban and rural locations, the condensation-mode EC particleswere diluted and some of them grew to the droplet mode.Sulfate and water coating formed in the atmospheric aging
www.atmos-chem-phys.net/10/5107/2010/ Atmos. Chem. Phys., 10, 5107–5119, 2010
5116 H. Yu et al.: Size distributions of elemental carbon and its contribution to light extinction
Fig. 5. Contributions of droplet-mode and condensation-mode EC-containing particles to the observed light extinction at a few selectedurban, suburban and rural locations in the Pearl River Delta region.
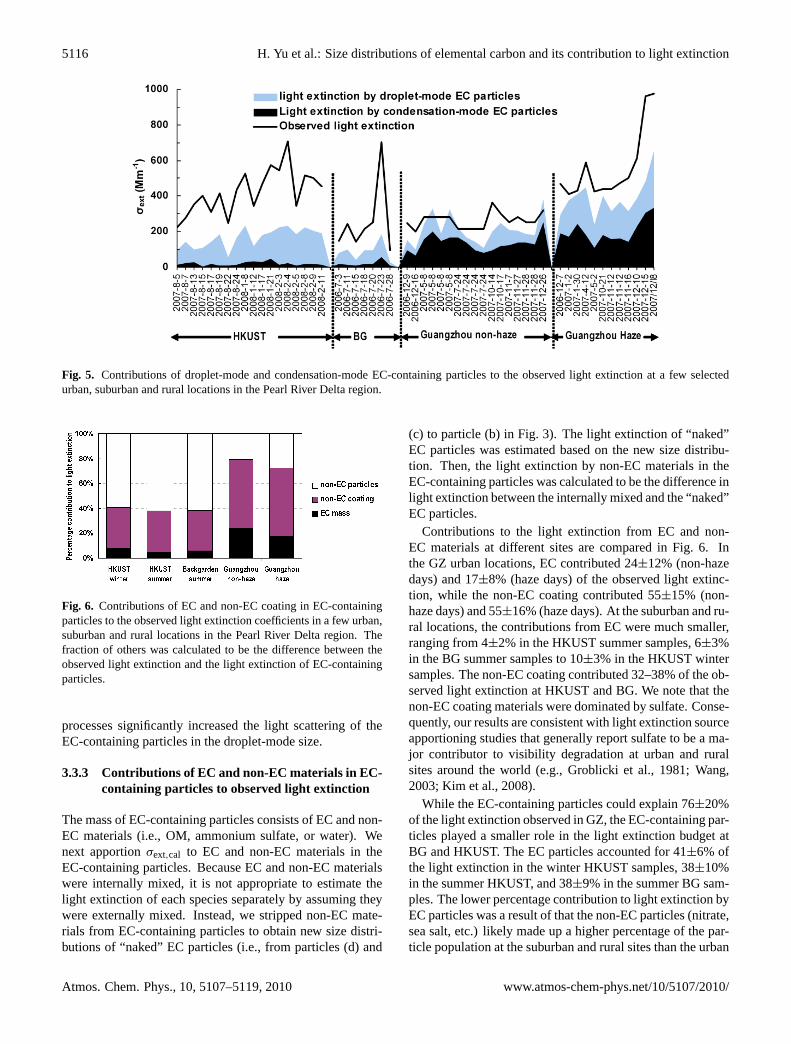
Fig. 6. Contributions of EC and non-EC coating in EC-containingparticles to the observed light extinction coefficients in a few urban,suburban and rural locations in the Pearl River Delta region. Thefraction of others was calculated to be the difference between theobserved light extinction and the light extinction of EC-containingparticles.
processes significantly increased the light scattering of theEC-containing particles in the droplet-mode size.
3.3.3 Contributions of EC and non-EC materials in EC-containing particles to observed light extinction
The mass of EC-containing particles consists of EC and non-EC materials (i.e., OM, ammonium sulfate, or water). Wenext apportionσext,cal to EC and non-EC materials in theEC-containing particles. Because EC and non-EC materialswere internally mixed, it is not appropriate to estimate thelight extinction of each species separately by assuming theywere externally mixed. Instead, we stripped non-EC mate-rials from EC-containing particles to obtain new size distri-butions of “naked” EC particles (i.e., from particles (d) and
(c) to particle (b) in Fig. 3). The light extinction of “naked”EC particles was estimated based on the new size distribu-tion. Then, the light extinction by non-EC materials in theEC-containing particles was calculated to be the difference inlight extinction between the internally mixed and the “naked”EC particles.
Contributions to the light extinction from EC and non-EC materials at different sites are compared in Fig. 6. Inthe GZ urban locations, EC contributed 24±12% (non-hazedays) and 17±8% (haze days) of the observed light extinc-tion, while the non-EC coating contributed 55±15% (non-haze days) and 55±16% (haze days). At the suburban and ru-ral locations, the contributions from EC were much smaller,ranging from 4±2% in the HKUST summer samples, 6±3%in the BG summer samples to 10±3% in the HKUST wintersamples. The non-EC coating contributed 32–38% of the ob-served light extinction at HKUST and BG. We note that thenon-EC coating materials were dominated by sulfate. Conse-quently, our results are consistent with light extinction sourceapportioning studies that generally report sulfate to be a ma-jor contributor to visibility degradation at urban and ruralsites around the world (e.g., Groblicki et al., 1981; Wang,2003; Kim et al., 2008).
While the EC-containing particles could explain 76±20%of the light extinction observed in GZ, the EC-containing par-ticles played a smaller role in the light extinction budget atBG and HKUST. The EC particles accounted for 41±6% ofthe light extinction in the winter HKUST samples, 38±10%in the summer HKUST, and 38±9% in the summer BG sam-ples. The lower percentage contribution to light extinction byEC particles was a result of that the non-EC particles (nitrate,sea salt, etc.) likely made up a higher percentage of the par-ticle population at the suburban and rural sites than the urban
Atmos. Chem. Phys., 10, 5107–5119, 2010 www.atmos-chem-phys.net/10/5107/2010/

H. Yu et al.: Size distributions of elemental carbon and its contribution to light extinction 5117
site. More of the sulfate mass existed either as externallymixed sulfate particles or internally mixed with other non-ECparticles, for example, sea salt particles and biomass burningparticles. At the HKUST site, sea salt aerosols are abundantin the summer under the prevailing southerly wind. Marineaerosols could play a role in light extinction at HKUST. Atthe BG site, local biomass burning emissions were a signif-icant aerosol source in addition to transported urban emis-sions from upwind urban areas. During the measurement pe-riods, the average K+ concentration was 0.25 µg m−3 at BGversus 0.08 µg m−3 in GZ, indicating that BG was more influ-enced by biomass burning emissions. One episodic biomassburning event nearby occurred during 23–25 July, leading toa spike (703 Mm−1) in the averageσext,obsat BG (Garland etal., 2008). In the sample we collected during this period, EC-containing particles contributed only 26% toσext,obs. Cer-tain known soluble inorganics (e.g., KCl) in biomass burningaerosols and their associated water could account for a sig-nificant fraction of light extinction.
4 Summary
Measurements made in this study indicate that EC size dis-tributions were different at urban and suburban/rural loca-tions in the Pearl River Delta region in South China. At GZurban locations, the condensation mode with an MMAD in0.36–0.43 µm was the most abundant mode, accounting for44–49% of the total EC mass. The droplet mode with anMMAD of 0.8–1.1 µm was the next abundant mode, account-ing for 30–38% of the total EC mass. At the suburban andrural sites, the droplet mode was the dominant mode, con-tributing 58–81% to the total EC mass, followed by the con-densation mode that contributed 15–33%. Mie theory and thesize-segregated chemical composition data were used to cal-culate the contribution to light extinction by EC-containingparticles. Our calculations show that EC-containing parti-cles could explain 76±20% of the observed light extinctionin GZ and non-EC materials on the EC particles provide asignificant fraction of the scattering aerosol mass. Control ofboth EC and SO2 (precursor to sulfate, the dominant coat-ing material on EC-particles) could have significant benefitsin improving visibility. At the suburban and rural locations,the contribution to light extinction by EC-containing parti-cles was reduced to about 40%. Further measurements andmodeling work are required to reconstruct the contributionbudget of light extinction in the PRD region, especially insuburban and rural sites.
Acknowledgements.This work was partially supported by theResearch Grants Council of Hong Kong, China (621405), HKUSTFok Ying Tung Graduate School, Natural Science Foundationof China (Grant U0733004 and 40775011). We thank PekingUniversity for organizing the PRIDE-PRD 2006 campaign, whichwas mainly sponsored by China National Basic Research andDevelopment Program-2002CB410801 and 2002CB211605.
Edited by: A. Hofzumahaus
References
Andreae, M. O., Schmid, O., Yang, H., Chand, D., Yu, J. Z., Zeng,L. M., and Zhang, Y. H.: Optical properties and chemical com-position of the atmospheric aerosol in urban Guangzhou, China,Atmos. Environ., 42, 6335–6350, 2008.
Bergin, M. H., Cass, G. R., Xu, J., Fang, C., Zeng, L. M., Yu, T.,Salmon, L. G., Kiang, C. S., Tang, X. Y., Zhang, Y. H., andChameides, W. L.: Aerosol radiative, physical, and chemicalproperties in Beijing during June 1999, J. Geophys. Res.-Atmos.,106(D16), 17969–17980, 2001.
Birch, M. E. and Cary, R. A.: Elemental carbon-based method formonitoring occupational exposures to particulate diesel exhaust,Aerosol Sci. Technol., 25, 221–241, 1996.
Bohren, C. F. and Huffman D. R.: Absorption and scattering of lightby small particles, John Wiley, Hoboken, N. J., 1983.
Bond, T. C. and Bergstrom, R. W.: Light absorption by carbona-ceous particles: An investigative review, Aerosol Sci. Technol.,40, 27–67, 2006.
Cao, J. J., Lee, S. C., Ho, K. F., Zhang, X. Y., Zou, S. C., Fung, K.,Chow, J. C., and Watson, J. G.: Characteristics of carbonaceousaerosol in Pearl River Delta Region, China during 2001 winterperiod, Atmos. Environ., 37, 1451–1460, 2003.
Cao, J. J., Lee, S. C., Ho, K. F., Zou, S. C., Fung, K., Li, Y., Wat-son, J. G., and Chow, J. C.: Spatial and seasonal variations ofatmospheric organic carbon and elemental carbon in Pearl RiverDelta Region, China, Atmos. Environ., 38, 4447–4456, 2004.
Chang, W. L. and Koo, E.: A study of visibility trends in HongKong (1968–1982), Atmos. Environ., 20, 1847–1858, 1986.
Cheng, Y. F., Eichler, H., Wiedensohler, A., Heintzenberg, J.,Zhang, Y. H., Hu, M., Herrmann, H., Zeng, L. M., Liu, S.,Gnauk, T., Bruggemann, E., and He, L. Y.: Mixing state ofelemental carbon and non-light-absorbing aerosol componentsderived from in situ particle optical properties at Xinken inPearl River Delta of China, J. Geophys. Res., 111, D20204,doi:10.1029/2005JD006929, 2006.
Cheng, Y. F., Wiedensohler, A., Eichler, H., Su, H., Gnauk, T.,Bruggemann, E., Herrmann, H., Heintzenberg, J., Slanina, J.,Tuch, T., Hu, M., and Zhang, Y.H.: Aerosol optical propertiesand related chemical apportionment at Xinken in Pearl RiverDelta of China, Atmos. Environ., 42, 6351–6372, 2008.
China Meteorology Administration: Specifications for Surface Me-teorological Observation, China Meteorological Press, 2003.
Chow, J. C., Watson, J. G., Louie, P. K. K., Chen, L.-W. A., andSin, D.: Comparison of PM2.5 carbon measurement methods inHong Kong, China, Environ. Pollut., 137, 334–344, 2005.
Clegg, S. L., Brimblecombe, P., and Wexler, A. S.: A thermody-namic model of the system H+-NH+
4 -SO2−
4 -NO−
3 -H2O at tropo-spheric temperatures, J. Phys. Chem. A, 102, 2137–2154, 1998.
Duan, J., Tan, J., Cheng, D., Bi, X., Deng, W., Sheng, G., Fu, J.,and Wong, M.H.: Sources and characteristics of carbonaceousaerosol in two largest cities in Pearl River Delta Region, China,Atmos. Environ., 41, 2895–2903, 2007.
Dong, Y., Hays, M. D., Smith, N. D., and Kinsey, J. S.: Invertingcascade impactor data for size-resolved characterization of fine
www.atmos-chem-phys.net/10/5107/2010/ Atmos. Chem. Phys., 10, 5107–5119, 2010

5118 H. Yu et al.: Size distributions of elemental carbon and its contribution to light extinction
particulate source emissions, J. Aerosol. Sci., 35, 1497–1512,2004.
Eldering, A., Cass, G. R., and Moon, K. C.: Monitoring networkusing continuous particle size distribution monitors: Connectingpollutant properties to visibility via Mie scattering calculations,Atmos. Environ., 28(16), 2733–2749, 1994.
Fung, J. C. H., Lau, A. K. H., Lam, J. S. L., and Yuan, Z.:Observational and modeling analysis of a severe air pollutionepisode in western Hong Kong, J. Geophys. Res., 110, D09105,doi:10.1029/2004JD005105, 2005.
Garland, R. M., Yang, H., Schmid, O., Rose, D., Nowak, A.,Achtert, P., Wiedensohler, A., Takegawa, N., Kita, K., Miyazaki,Y., Kondo, Y., Hu, M., Shao, M., Zeng, L. M., Zhang, Y. H.,Andreae, M. O., and P̈oschl, U.: Aerosol optical properties ina rural environment near the mega-city Guangzhou, China: im-plications for regional air pollution, radiative forcing and remotesensing, Atmos. Chem. Phys., 8, 5161–5186, doi:10.5194/acp-8-5161-2008, 2008.
Gnauk, T., M̈uller, K., van Pinxteren, D., He, L. Y., Niu, Y., Hu, M.,and Herrmann, H.: Size-segregated particulate chemical compo-sition in Xinken, Pearl River Delta, China: OC/EC and organiccompounds, Atmos. Environ., 42, 6296–6309, 2008.
Groblicki, P. J., Wolff, G. T., and Countess, R. J.: Visibility-reducing species in the Denver “brown cloud” – I. Relationshipbetween extinction and chemical composition, Atmos. Environ.,15, 2473–2484, 1981.
Guangzhou Transport Planning Research Institute: Annual re-port on transport development of Guangzhou, 2006.http://www.gztpri.com/journal-viewer.asp?id=3, last accessed on August 21,2009.
Hagler, G. S. W., Bergin, M. H., Salmon, L. G., Yu, J. Z., Wan, E. C.H., Zheng, M., Zeng, L. M., Kiang, C. S., Zhang, Y. H., Lau, A.K. H., and Schauer, J. J.: Source areas and chemical compositionof fine particulate matter in the Pearl River Delta region of China,Atmos. Environ., 40, 3802–3815, 2006.
Hale, G. M. and Querry, M. R.: Optical Constants of Water inthe 200-nm to 200-µm Wavelength Region, Appl. Optics, 12(3),555–563, doi:10.1364/AO.12.000555, 1973.
Hasan, H. and Dzubay, T. G.: Apportioning light extinction coeffi-cients to chemical species in atmospheric aerosol, Atmos. Envi-ron., 17(8), 1573–1581, 1983.
Hitzenberger, R., Jennings, S. G., Larson, S. M., Dillner, A.,Cachier, H., Galambos, Z., Rouc, A., and Spain, T. G.: Inter-comparison of measurement methods for black carbon aerosols,Atmos. Environ., 33, 2823–2833, 1999.
Ho, K. F., Lee, S. C., Cao, J. J., Li, Y. S., Chow, J. C., Watson, J.G., and Fung, K.: Variability of organic and elemental carbon,water soluble organic carbon, and isotopes in Hong Kong, At-mos. Chem. Phys., 6, 4569–4576, doi:10.5194/acp-6-4569-2006,2006.
Ho, K. F., Lee, S. C., Yu, J. C., Zou, S. C., and Fung, K.: Carbona-ceous characteristics of atmospheric particulate matter in HongKong, Sci. Total Environ., 300, 59–67, 2002.
Horvath, H.: Atmospheric light absorption – a review, Atmos. Env-iron., 27A, 293–317, 1993.
Horvath H.: Size segregated light absorption coefficient of the at-mospheric aerosol, Atmos. Environ., 29(8), 875–883, 1995.
Huang, X.-F. and Yu, J. Z.: Size distributions of elemental carbonin the atmosphere of a coastal urban area in South China: char-
acteristics, evolution processes, and implications for the mixingstate, Atmos. Chem. Phys., 8, 5843–5853, doi:10.5194/acp-8-5843-2008, 2008.
Huang, X. F., Yu, J. Z., He, L.Y., and Hu, M.: Size distribution char-acteristics of elemental carbon emitted from Chinese vehicles:Results of a tunnel study and atmospheric implications, Environ.Sci. Technol., 40, 5355–5360, 2006.
Jacobson, M. Z.: Strong radiative heating due to the mixing stateof black carbon in atmospheric aerosols, Nature, 409, 695–697,2001.
Kim, K. W., Kim, Y. J., and Bang, S. Y.: Summer time haze char-acteristics of the urban atmosphere of Gwangju and the rural at-mosphere of Anmyon, Korea, Environ. Monit. Assess., 141, 89–199, 2008.
Lai, L. Y. and Sequeira, R.: Visibility degradation across HongKong: its components and their relative contributions, Atmos.Environ., 35(34), 5861–5872, 2001.
Lowenthal, D. H., Rogers, C. F., Saxena, P., Watson, J. G., andChow, J. C.: Sensitivity of estimated light extinction coefficientsto model assumptions and measurement errors, Atmos. Environ.,29(7), 751–766, 1995.
Maenhaut, W., Cafmeyer, J., Dubtsov, S., and Chi, X. G.: Detailedmass size distributions of elements and species, and aerosolchemical mass closure during fall 1999 at Gent, Belgium, Nucl.Instrum. Methods Phys. Res. Sect. B-Beam Interact. Mater.Atoms., 189, 238–242, 2002.
Mallet, M., Roger, J. C., Despiaua, S., Dubovik, C., and Putaud, J.P.: Microphysical and optical properties of aerosol particles inurban zone during ESCOMPTE, Atmos. Res., 69, 73–97, 2003.
Malm, W. C., Gebhart, K. A., Molenar, J., Cahill, T., Eldred, R., andHuffman, D.: Examining the Relationship between AtmosphericAerosols and Light Extinction at Mount Rainier and North Cas-cades National Parks, Atmos. Environ., 28(2), 347–360, 1994.
Miguel, A. H., Eiguren-Fernandez, A., Jaques, P. A., Froines, J. R.,Grant, B. L., Mayo, P. R., and Sioutas, C.: Seasonal variation ofthe particle size distribution of polycyclic aromatic hydrocarbonsand of major aerosol species in Claremont, California, Atmos.Environ., 38, 3241–3251, 2004.
Miyazaki, Y., Kondo, Y., Shiraiwa, M., Takegawa, N., Miyakawa,T., Han, S., Kita, K., Hu, M., Deng, Z. Q., Zhao, Y., Sugimoto,N., Blake, D. R., and Weber, R. J.: Chemical characterization ofwater-soluble organic carbon aerosols at a rural site in the PearlRiver Delta, China, in the summer of 2006, J. Geophys. Res.,114, D14208, doi:10.1029/2009JD011736, 2009.
Pitchford, M., Malm, W. C., Schichtel, B., Kumar, N., Lowen-thal, D., and Hand, J.: Revised algorithm for estimatinglight extinction from IMPROVE particle speciation data, J.Airand Waste Manage. Assoc., 57, 1326–1336, doi:10.3155/1047-3289.57.11.1326, 2007.
Saxena, P., Hildemann, L. M., McMurry, P. H., and Seinfeld, J. H.:Organics alter hygroscopic behavior of atmospheric particles, J.Geophys. Res., 100D, 18755–18770, 1995.
Seinfeld, J. H. and Pandis, S. N.: Atmospheric Chemistry andPhysics – From Air Pollution to Climate Change (2nd Edi-tion), John Wiley and Sons, p. 362, p. 905, 2006.
Sloane, C. S., Watson, J., Chow, J., Pritchett, L., and Richards,L.W.: Size-segregated fine particle measurements by chemicalspecies and their impact on visibility impairment in Denver, At-mos. Environ. – Part A General Topics, 25(5–6), 1013–1024,
Atmos. Chem. Phys., 10, 5107–5119, 2010 www.atmos-chem-phys.net/10/5107/2010/

H. Yu et al.: Size distributions of elemental carbon and its contribution to light extinction 5119
1991.Tang, A. N.: Chemical and size effects of hygroscopic aerosols
on light scattering coefficients, J. Geophys. Res., 101, 19245–19250, 1996.
Van de Hulst, H. C.: Light Scattering by Small Particles, New York,Dover, 470pp., 1981.
Vanderlei, M. J., Artaxo, P., Liousse, C., Reid, J. S., Hobbs, P. V.,and Kaufman, Y. J.: Effects of black carbon content, particle size,and mixing on light absorption by aerosols from biomass burningin Brazil, J. Geophys. Res., 103(D4), 32041–32050, 1998.
Venkataraman, C. and Friedlander, S. K.: Size distributions of poly-cyclic aromatic hydrocarbons and elemental carbon: 2. Ambi-ent measurements and effects of atmospheric processes, Environ.Sci. Technol., 28, 563–572, 1994.
Wang, T.: Study of Visibility Reduction and its Causes in HongKong, final report to Air Services Group of The EnvironmentalProtection Department of HKSAR, March 2003.
Wu, D., Bi, X. Y., Deng, X. J., Li, F., Tan, H.B., Liao, G. L., andHuang, J.: Effect of atmospheric haze on the deterioration ofvisibility over the Pearl River Delta, Acta Meteor. Sinica, 21,215–223, 2007.
Xiao, R., Takegawa, N., Kondo, Y., Miyazaki, Y., Miyakawa, T.,Hua, M., Shao, M., Zeng, L. M., Hofzumahaus, A., Holland, F.,Lu, K., Sugimoto, N., Zhao, Y., and Zhang, Y. H.: Formation ofsubmicron sulfate and organic aerosols in the outflow from theurban region of the Pearl River Delta in China, Atmos. Environ.,43, 3754–3763, doi:10.1016/j.atmosenv.2009.04.028, 2009.
Yang, H., Yu, J. Z., Ho, S. S. H., Xu, J. H., Wu, W. S., Wan, C.H., Wang, X. D., Wang, X. R., and Wang, L. S.: The chemicalcomposition of inorganic and carbonaceous materials in PM2.5in Nanjing, China, Atmos. Environ., 39(20), 3735–3749, 2005.
Yu, J. Z., Tung, J. W. T., Wu, A. W. M., Lau, A. K. H., Louie, P. K.K., and Fung, J. C. H.: Abundance and seasonal characteristicsof elemental and organic carbon in Hong Kong PM10, Atmos.Environ., 38, 1511–1521, 2004.
Yu, H. and Yu, J. Z.: Modal Characteristics of Elemental andOrganic Carbon in an Urban Location in Guangzhou, China,Aerosol Sci. Technol., 43, 1108–1118, 2009.
Zhang, X., Turpin, B. J., McMurry, P. H., Hering, S. V., and Stolzen-burg, M. R.: Mie theory evaluation of species contributions to1990 wintertime visibility reduction in the Grand Canyon, J. Airand Waste Manage. Assoc., 44(2), 153–162, 1994.
Zhang, Q. Y. and Zhang, Y. H.: Research on atmospheric bound-ary layer and pollution in Chinese cities, Research Progress onUrban Environmental Meteorology in China and Overseas, is-sue 2, 2001. Available athttp://library.cma.gov.cn/publications/973environment/cshj0102.htm.
www.atmos-chem-phys.net/10/5107/2010/ Atmos. Chem. Phys., 10, 5107–5119, 2010