six sigma management - diva-portal.org664043/fulltext01.pdf · six sigma to fit their own...
TRANSCRIPT
THESIS FOR THE DEGREE OF DOCTOR OF PHILOSOPHY
Six Sigma Management Action research with some contributions to
theories and methods
PETER CRONEMYR
Division of Quality Sciences
Department of Technology Management and Economics
CHALMERS UNIVERSITY OF TECHNOLOGY
Göteborg, Sweden (2007)

They wanted me to be respected as A doctor or a lawyer man No matter what But I had other plans Quality will keep on rockin’ Gonna be a rock ‘n’ roll singer Gonna be a rock ‘n’ roll star The Rock Stars of Quality Debbie Phillips-Donaldson, editor AC/DC - Rock ‘n’ Roll Singer Quality Progress, July 2005 Young/Young/Scott 1975
Six Sigma Management
Action research with some contributions to theories and methods
Peter Cronemyr
Copyright © Peter Cronemyr (2007)
ISBN 978-91-7385-021-6
Doktorsavhandlingar vid Chalmers tekniska högskola
Ny serie nr 2702
ISSN: 0346-718X
Published and distributed by:
Division of Quality Sciences
CHALMERS UNIVERSITY OF TECHNOLOGY
S-412 96 Göteborg, Sweden
Telephone: +46 (0)31 772 10 00
Printed at:
Chalmers Reproservice
Göteborg, Sweden
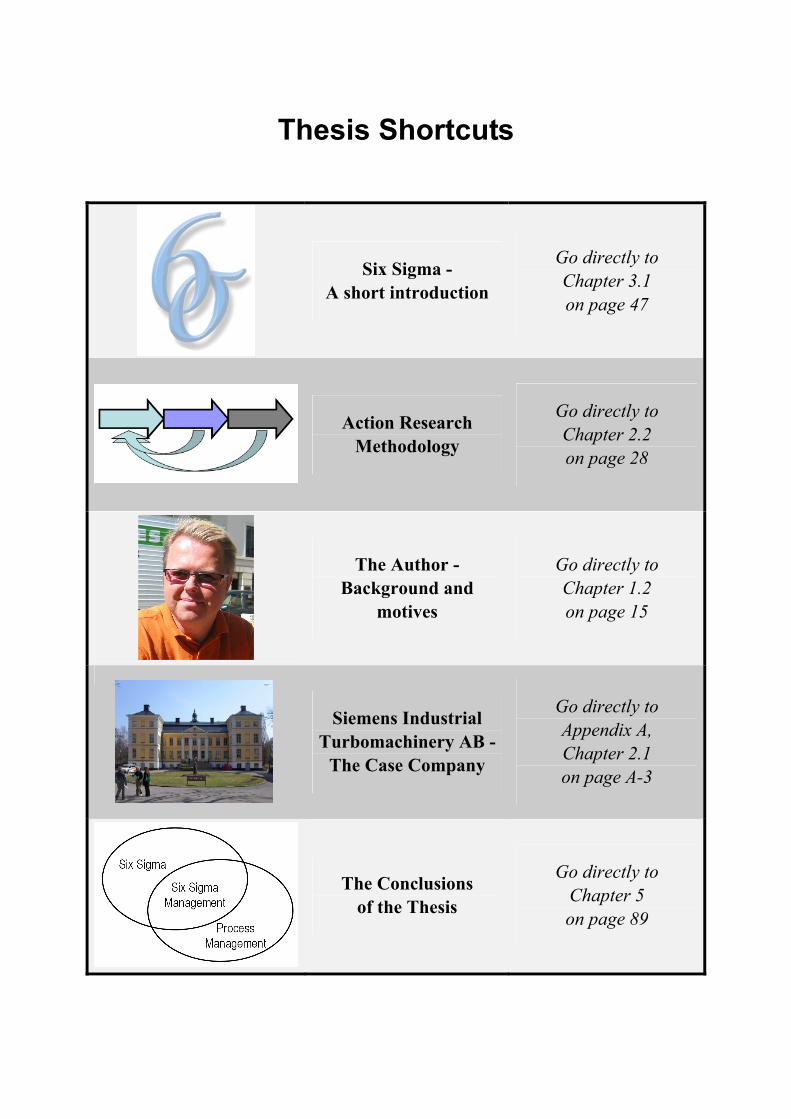
Thesis Shortcuts
Six Sigma - A short introduction
Go directly to Chapter 3.1 on page 47
Action Research Methodology
Go directly to Chapter 2.2 on page 28
The Author - Background and
motives
Go directly to Chapter 1.2 on page 15
Siemens Industrial Turbomachinery AB -
The Case Company
Go directly to Appendix A, Chapter 2.1 on page A-3
The Conclusions of the Thesis
Go directly to Chapter 5 on page 89
Six Sigma Management Action Research With Some Contributions to Theories and Methods PETER CRONEMYR Division of Quality Sciences Department of Technology Management and Economics Chalmers University of Technology
ABSTRACT
Many companies around the world have implemented Six Sigma as a problem solving methodology especially useful for dealing with recurring problems in business processes. Since the 1980s when it was developed at Motorola, many companies have tried to implement Six Sigma to fit their own company’s culture and goals. This thesis presents a longitudinal case study describing the evolution of ‘Six Sigma Management’ at Siemens in Sweden. The success of the programme was to a large degree built on previous failures, confirming Juran’s old saying ‘Failure is a gold mine’. From the case study, success factors for implementing Six Sigma at Siemens are identified and compared to those given in the literature. Some of the most critical success factors identified at Siemens had not been mentioned as such in the literature before. The main conclusion of the study is that, in order to succeed and get sustainable results from a Six Sigma programme, Six Sigma should be integrated with Process Management, instead of just running Six Sigma as a separate initiative in an organisation. Furthermore, the thesis includes papers presenting methods and tools to be used in a Six Sigma programme or in Six Sigma projects. They deal with: how to identify suitable Six Sigma projects, how to select which Six Sigma methodology to use, how to find hidden misunderstandings between people from different knowledge domains, and how to simulate the impact of improvements to iterative processes. All these methods and tools have been developed and tested at Siemens. This has been an action research project, where the author has been employed by the company under investigation for eleven years and has actively influenced the changes in the company based on knowledge gained at the company as well as on research studies conducted at universities. In action research the change initiative under investigation is conducted and analysed in a single context. The readers are invited to draw their own conclusions on the applicability of the results to their own specific cases. In addition to this, some conclusions derived using analytical generalisation, applicable to a more general case, are presented in the thesis.
Keywords: Six Sigma, Process Management, Action Research, Customer Feedback, Process Door, Knowledge Overlapping, DMADC, Process Simulations.
Acknowledgements
At the age of sixteen I quit my ‘career’ as a rock ‘n’ roll singer to focus on school instead. Now, at age forty-four, I may soon become a Doctor of Quality. Not really a rock star, but it will do. The latest ten (or maybe twenty) years of my life have been divided between my three worlds: the university, Siemens and my family. I would like to thank the people of these three worlds without whose support this thesis would not have seen the light of day.
University
The person that has followed me since I first started as a research student in 1997 on the path via Licentiate to full Ph.D. is Professor Bo Bergman. In addition to being one of the nicest persons I have ever met, Professor Bergman is so wise and has probably influenced me more than anybody else. Ten years ago I was a ‘deterministic aeroelasticity engineer’; what am I today may be a ‘probabilistic change practitioner’. Professor Bergman guided me in this metamorphosis, always giving small ‘insignificant’ pieces of advice. Viewed in hindsight I realise how important they were. The readers who know Professor Bergman will see his influence in this thesis. All I can say is Bosse, thank you. I hope this rewarding co-operation will continue for many more years.
I would also like to thank my co-advisors, Dr. Lars Witell and Dr. Dag Kroslid. Both possess such great knowledge and experience in the quality domain and have given me very valuable advice along the way. Lars was also the co-author of one of the papers. Thank you both.
Another person that was my co-advisor during my first research period was Professor Emirita Gunnela Westlander. She taught me about action research. I can-not imagine how this thesis would have looked – probably I would not have reached this point – without that knowledge. It was fantastic to be ‘saved’. Thank you Gunnela.
During the latest years I have had many very good friends at the Department of Quality Sciences at Chalmers University. Christina Mauléon and I co-wrote one of the papers. We started from two quite different backgrounds and ended up in a terrific paper with very strong findings. Thank you Tina. I also had many cups of coffee and discussions with Dr. Martin Arvidsson, Dr. Ida Gremyr, Dr. Andreas Hellström, and Torben Hasenkamp. You will hear from me again.
Furthermore, in addition to the co-authors already mentioned above, I would like to thank the other co-authors: Dr. Anders Fundin, Dr. Anna Öhrwall-Rönnbäck and Professor Steven Eppinger. To me it is clear; cooperation leads to synergy which makes the whole greater than the sum of the parts. Thanks for your contributions.
This thesis has been greatly improved by the advice of Dr. Mattias Elg at Linköping University, without which the chapter on research methodology would have been much shorter. And Mattias you know for sure that, no matter what, Quality will keep on rockin’.
Many thanks go to Janet Vesterlund, Ross Gilham and Colleen Murphy for proofreading different parts of the thesis.
Siemens
My ‘ordinary’ work is at Siemens in Finspong. This thesis tells the story of what we did together. There are so many people I want to thank but there is one person that was absolutely essential to the success of Six Sigma at Siemens. That is the head the of the Service Division in Finspong, Håkan Sidenvall. You took Six Sigma into the management team and showed with your own behaviour what management commitment means. In addition to letting me loose in the organisation and in the management team, you also provided the necessary resources, the patience and endurance when we learned from failures, and finally you let me spend a year writing this thesis – on part time. I do not know anybody else at the same level in the company that would have had the courage and integrity to do this. And to think that I got the opportunity to work for you. I cannot thank you enough.
Of all my colleagues at Siemens I can only mention a few here. My current manager, Per Söderberg, and I are like salt and pepper. We complement each other perfectly. Thank you for your support. Erik Pegado, our process mapping expert, and I go way back. Look what we have done! Isn’t it great? Black Belts Marie Andersson, Mikael Arnegger, Sören Johansson, Ingvil Haugse, and Hedley Cunliffe have all been drivers in this change race. And you were the winning team. Furthermore, I would like to express my gratitude to the process owners: Kenneth Axelsson, Lars Alkelin, and Henrik Andersson. Since you were the ones that benefited most from the Six Sigma projects it is not surprising that you were the strongest supporters, but this type of support is rarely seen elsewhere. Keep up the good work. I will.
I have not forgotten the colleagues at my old departments. You are all still in my memory but I would like to mention one, i.e. my former manager Hans-Lennart Olausson. You supported me when I started my first research project in 1997. Who knew then that it would result in this? I did not. Thank you for your support during the years.
My family
The most important people for me in my everyday life, and therefore also important as inspiration and support when I do my research, are my personal friends and family.
My old friends I always come back to are ‘the gang of eight’: Göran, Maria, Peter, Helena, Lennart and Anna (Eva and I are number seven and eight). For so many years you have been my very best friends. Having such reliable and true friends makes me feel confident, safe and secure. Even though you may not know it, you have supported me during this research project just by being there. I regard you as my relatives.
My mother Lille-Mour and my sister Annelie have always been my support. When you ask me what this thesis is about I always find it difficult to explain it in an interesting and easy-to-understand way. If you read it – I hope you will – maybe it will become clearer. I think you

will recognise me in it and things I have spoken about many times. Thank you for being my family.
To my teenage sons, Emil and Axel, I would like to say the following. It is not true what they say: ‘Madness runs in the family. You inherit it from your children’. It is not madness, it is wisdom. Every morning at the breakfast table you give me the vital force, joy and wisdom I need to manage my day. Follow your consciences and I will support you in the choices you make in your lives.
Finally, Eva: my best friend, mother of our children, my wife, the love of my life. This is the third time I produce a thesis. It happens every ten years or so. And every time you have supported me when I disappear away into some other world for a year. How could I have done it without you being there for me? When this is all over we will go back to our normal life of travelling, watching movies, going to rock festivals, camping, discussing philosophy and politics and, of course, going out in the Swedish countryside on our motorcycle. I love you so much. Thank you. I think this will be the last thesis for me, but I am not sure.
Finspong, September 2007
Peter Cronemyr

Contents of the thesis frame
1. Introduction...................................................................................................................... 13 1.1. Six Sigma, a potential or a problem? .................................................................................... 13 1.2. Background and motives of the researcher ........................................................................... 15 1.3. Selection of research project ................................................................................................. 17 1.4. Research questions of the thesis............................................................................................ 17 1.5. Purpose.................................................................................................................................. 18
1.5.1. Theoretical contribution..............................................................................................................18 1.5.2. Industrial relevance.....................................................................................................................18
1.6. Outline of thesis .................................................................................................................... 19
2. Research Methodology .................................................................................................... 20 2.1. A short overview of research methodology .......................................................................... 20
2.1.1. The Big Questions: Truth, Science, Research, Values................................................................20 2.1.2. Data collection and theory founding...........................................................................................23 2.1.3. Quantitative vs. qualitative approach..........................................................................................24 2.1.4. Traditional academic research vs. action research ......................................................................26 2.1.5. Pragmatic research......................................................................................................................27
2.2. Action Research .................................................................................................................... 28 2.2.1. To help the practitioner in an action of planned change .............................................................28 2.2.2. Managing the many roles of an action researcher.......................................................................30 2.2.3. Validity and reliability of action research...................................................................................33
2.3. Research techniques of the specific papers........................................................................... 37 2.3.1. Appendix A: “Six Sigma Management at Siemens”...................................................................37 2.3.2. Appendix B: “Selection of Six Sigma projects based on customer feedback – The idea”........39 2.3.3. Appendix C: “Selection of Six Sigma projects based on customer feedback – Application”....40 2.3.4. Appendix D: “Selection of Six Sigma roadmap based on process state”....................................41 2.3.5. Appendix E: “Knowledge Overlapping Seminars – KOS”.........................................................42 2.3.6. Appendix F: “Process improvement simulations” ......................................................................45
3. Theoretical framework of implementing Six Sigma........................................................ 47 3.1. Six Sigma.............................................................................................................................. 47 3.2. Success factors in implementing Six Sigma ......................................................................... 50 3.3. Process Management ............................................................................................................ 52 3.4. Integration of Six Sigma and Process Management ............................................................. 54 3.5. Cultural and contextual aspects of implementing Six Sigma................................................ 57 3.6. Psychological change aspects of implementing Six Sigma .................................................. 59
4. Summary of appended papers.......................................................................................... 61 4.1. Six Sigma Management at Siemens (appendix A)................................................................ 61
4.1.1. History of the paper ....................................................................................................................61 4.1.2. Purpose of the paper....................................................................................................................61 4.1.3. Findings of the paper ..................................................................................................................61

4.2. Selection of Six Sigma projects based on customer feedback – The idea (appendix B) .... 64 4.2.1. History of the paper ....................................................................................................................64 4.2.2. Purpose of the paper....................................................................................................................65 4.2.3. Findings of the paper ..................................................................................................................65 4.2.4. Postscript.....................................................................................................................................67
4.3. Selection of Six Sigma projects based on customer feedback – Application (appendix C) 67 4.3.1. History of the paper ....................................................................................................................68 4.3.2. Purpose of the paper....................................................................................................................68 4.3.3. Findings of the paper ..................................................................................................................68
4.4. Selection of Six Sigma roadmap based on process state (appendix D) ................................ 73 4.4.1. History of the paper ....................................................................................................................73 4.4.2. Purpose of the paper....................................................................................................................73 4.4.3. Findings of the paper ..................................................................................................................74
4.5. Knowledge Overlapping Seminars – KOS (appendix E)...................................................... 77 4.5.1. History of the paper ....................................................................................................................77 4.5.2. Purpose of the paper....................................................................................................................78 4.5.3. Findings of the paper ..................................................................................................................79
4.6. Process improvement simulations (appendix F) ................................................................... 82 4.6.1. History of the paper ....................................................................................................................83 4.6.2. Purpose of the paper....................................................................................................................83 4.6.3. Findings of the paper ..................................................................................................................84 4.6.4. Postscript.....................................................................................................................................86
5. Conclusions and reflections of the thesis......................................................................... 89 5.1. The main conclusions ........................................................................................................... 89
5.1.1. Success factors for implementing Six Sigma..............................................................................89 5.1.2. Selection of Six Sigma projects ..................................................................................................90 5.1.3. Selection of Six Sigma roadmaps ...............................................................................................90 5.1.4. Tools for the ‘process door’ in Six Sigma projects.....................................................................90 5.1.5. Action research ...........................................................................................................................91
5.2. Reflections ............................................................................................................................ 92 5.2.1. Where are we going with Six Sigma? .........................................................................................92 5.2.2. Quantitative vs. qualitative methods...........................................................................................92
5.3. Recommendations for future research .................................................................................. 93 5.3.1. Six Sigma Management ..............................................................................................................94 5.3.2. Process Improvement System .....................................................................................................94 5.3.3. DMADC .....................................................................................................................................94 5.3.4. KOS ............................................................................................................................................94 5.3.5. Process Simulations ....................................................................................................................95 5.3.6. Action Research and Analytical Generalisation..........................................................................95
5.4. Final words ........................................................................................................................... 95
6. References........................................................................................................................ 96
Number of pages in the thesis frame: 101. Total number of pages in the thesis: 256.

Appendices
Each appendix has a title describing the general content. The appended papers have other titles, as given below, which have been chosen to fit the journals where they have been (or will be) published.
A: “Six Sigma Management at Siemens” Paper: Cronemyr, P. (2007): Six Sigma Management at Siemens. A personal case story.
B: “Selection of Six Sigma projects based on customer feedback – The idea” Paper: Fundin, A. and P. Cronemyr (2003): Use Customer Feedback To Choose Six Sigma Projects. Six Sigma Forum Magazine. November: pp. 17-21
C: “Selection of Six Sigma projects based on customer feedback – Application” Paper: Cronemyr, P. and Witell, L. (2007): Changing from a product to a process perspective for Service Improvements in Manufacturing Companies. Submitted for publication.
D: “Selection of Six Sigma roadmap based on process state” Paper: Cronemyr, P. (2007): DMAIC and DMADV – Differences, similarities, and synergies. International Journal Of Six Sigma and Competitive Advantage, October.
E: “Knowledge Overlapping Seminars – KOS” Paper: Cronemyr, P. and Mauléon, C. (2007): Knowledge Overlapping Seminars – KOS. Design and Applications. Submitted for publication.
F: “Process improvement simulations” Paper: Cronemyr, P., Öhrwall-Rönnbäck, A., and Eppinger, S. (2001): A Decision Support Tool for Predicting the Impact of Development Process Improvements. Journal of Engineering Design, Vol. 12, No. 3, pp. 177-199

Additional publications (not included in thesis)
Cronemyr, P. (1990) Utredning av inverkande faktorer för ett pilmåls läge vid bogsering med flygplan J32 Lansen (in Swedish; English translation: Investigation on factors that affect the position of a target towed by aircraft J32 Lansen). LITH-IKP-Ex-837. Master Thesis. Department of Mechanical Engineering. Linköping University, Institute of Technology.
Bråmå, T., Cronemyr, P., and Hansson, E. (1995) Multidisciplinary Optimization of a Composite Wing Using an Alternative Approach for Static Aeroelasticity. In the proceedings from International Forum on Aeroelasticity and Structural Dynamics, Manchester, 26-28 June 1995.
Andersson, J., Backlund, G., Cronemyr, P., Pohl, J., Sveder, P., and Öhrwall-Rönnbäck, A. (1998) Product Development at Saab AB. A study of Engineering Management, Design Theory Methodology, and Simulation and Digital Prototyping. Technical Report: LiTH-IKP-R-1130, Department of Mechanical Engineering, Linköping University.
Cronemyr, P. (1999) Knowledge overlapping – A generic model for opening up closed knowledge domains. In the proceedings from QERGO99 - International Conference on TQM and Human Factors, Linköping, Sweden, June 15-17
Cronemyr, P., A. Öhrwall-Rönnbäck and S. D. Eppinger (1999) Process Improvement Simulations Using the Work Transformation Model. In the proceedings from ICED99, 12th International Conference on Engineering Design, Munich, Germany, August 24-26.
Cronemyr, P. (1999) Hållfare (in Swedish; English translation: Stress engineers). In the proceedings from Hållfasthetsläras 30-års jubileumskonferens, Linköping.
Cronemyr, P. (2000) Towards a Learning Organisation for Product Development. Licentiate Thesis, Division of Quality Technology and Management, Department of Mechanical Engineering, Linköping University, Linköping, Sweden.
Cronemyr, P. (2000) Knowledge Overlapping Seminars. In the proceedings from SIGPM conference, Linköping.
Cronemyr, P. (2002) Product Faults Feedback as Means for Selecting Six Sigma Projects. In the proceedings from European Six Sigma conference, Malmö.
Cronemyr, P. (2006) DMAIC and DMADV – Differences, similarities, and synergies. In the proceedings from Quality Management and Organisational Development International Conference 9 -11 August 2006 Liverpool .
Cronemyr, P. and Mauléon, C. (2006) Improving understanding between people from different knowledge domains in Knowledge Overlapping Seminars. A theory of quality perspective. In the proceedings from Quality Management and Organisational Development International Conference 9 -11 August 2006 Liverpool .

Cronemyr, P (2006) The Phantom Turbine - A case study on how to organize for technology development. In the proceedings from Excellence in the Product Development Process – Robust Design Methodology, Chalmers Industrihögskola, September 13-14.
Cronemyr, P. (2007) Six Sigma Management på Servicedivisionen, SIT AB. In the proceedings from Kvalitetsdagen, Division of Quality Technology and Management, Linköping University, February 6.

Six Sigma Management - Action research with some contributions to theories and methods - Peter Cronemyr
13
1. Introduction This research project has to a great extent been based on my own experiences. In this introductory chapter I present my background and motives for doing this research. First I discuss different views on implementing Six Sigma; is it a potential or a problem? From this the research question is derived and lastly I present a rough outline of the thesis.
1.1. Six Sigma, a potential or a problem?
As individuals, we all have different perspectives on life. Some perceive a half glass of water as half full, others may see it as half empty, and due to influences and experiences, we sometimes switch perspective. To see a half full glass is to focus on a potential for improvement, while a half empty glass indicates a problem to be solved. Same glass of water; two different mindsets; a potential or a problem? Some may see neither. ‘It is just a half glass of water, why should we do something about it? If it ain’t broke, don’t fix it.’ Yet another mind-set.
In organisations individuals come together to realise potentials and to solve problems. Even though some may think there is no need to do either, the competitive environment in today’s market place forces companies to improve their performance in terms of customer satisfaction, turnover, profit and share price. Depending on whether you are trying to catch up with or drive ahead of your competitors, you may focus on solving problems or realising potentials. Since it is more common to be in a position where you are trying to catch up than to drive ahead, most companies have focused on solving problems in a reactive manner, while proactive work on realising potentials has not been given the same precedence.
When solving problems one needs some problem solving procedure, either to do it ad hoc, i.e. ‘no particular procedure’, or to use some established procedure, for example Six Sigma. The well known Six Sigma methodology, developed by Motorola in the 1980s and based on ideas from Japanese problem solving methodologies, is a structured way of solving recurring problems in the business processes of today’s companies. It commonly goes by the name of DMAIC, deduced from the five phases of a Six Sigma project: Define, Measure, Analyse, Improve and Control. There is also a complementary procedure called Design for Six Sigma (DfSS) to realise potentials rather than to solve problems. During the last two decades there has been a tremendous spread around the world of the ideas of Six Sigma and, during the last decade, DfSS.
Even though Six Sigma may be a problem solving methodology, the introduction of Six Sigma in a company prompts the question ‘Are we introducing Six Sigma to solve a problem or to realise a potential,’ i.e. is the introduction of Six Sigma a half full or a half empty glass of water? If you are the manager of a big company and you have decided to introduce Six Sigma as a company wide business process improvement programme, are you doing it to solve a problem or to realise a potential? If the decision was yours, it is most likely you who perceives it as realising the full potential of the company, i.e. a half full glass. If the decision was someone else’s or you felt forced to do it because ‘everybody else is doing it’, you are probably perceiving it as solving a problem, i.e. a half empty glass. As the programme is
Six Sigma Management - Action research with some contributions to theories and methods - Peter Cronemyr
14
rolled out in the organisation, more and more people are engaged and committed. Are they seeing half full or half empty glasses? The perceptions depend on how the Six Sigma programme is communicated and rolled out. If you want people in the organisation to see half full glasses, you need to communicate and create a common view – and a common mental model – of the potential of Six Sigma in the company. Of course Six Sigma could also be implemented as a cure for a problem, i.e. a half empty glass, but that is a rather reactive view and it may be difficult in that case to raise the same level of commitment in the company.
During the decades of successful and less successful Six Sigma implementations in companies around the world, researchers and management consultants have investigated and presented so-called success factors for implementing Six Sigma. These are often given as ‘silver bullets’ that are universally valid, and are offered for the purpose of presenting the final list of requisites of a successful Six Sigma programme. The most commonly stated success factor is ‘management commitment’, as opposed to ‘management enthusiasm’. In the first case managers are showing their commitment by changing their behaviour, and in the second they are saying ‘this is important’ but go on with business as usual. This corresponds to different perceptions; half full vs. half empty glasses. If management sees the potential they will get committed. So, if management commitment is very important, how do you achieve it? This thesis presents the topic of Six Sigma Management. It is a method for organising Six Sigma to get the full potential of management commitment.
The thesis deals with questions about how to implement Six Sigma Management in an industrial context. Furthermore, in addition to Six Sigma Management, i.e. how to organise management activities around Six Sigma, questions concerning certain methods and tools of the Six Sigma methodology itself are highlighted. The intention of the thesis is to share knowledge concerning Six Sigma – in detail and in the broad sense – gained when working with Six Sigma in an industrial context for approximately five years.
The first appendix (A) presents a longitudinal case study. It describes the evolution of Six Sigma Management at Siemens Industrial Turbomachinery AB in Sweden. As shown, the success of the programme was built to a large degree on previous failures, confirming the saying that ‘failure is a gold mine’. From the case study, success factors are identified and compared to those given in the literature (from previous research). The main conclusion of the study is that, in order to succeed and get sustainable results from a Six Sigma programme, Six Sigma should be integrated with Process Management, instead of just running Six Sigma as a separate initiative in an organisation. Using the analogy once again, the first is a half full glass while the second corresponds more to a half empty glass.
The following appendices (B-F) are papers either published in refereed journals or in the process of being published. They present methods and tools to be used in a Six Sigma programme or in Six Sigma projects. They deal with such different topics as: how to identify suitable Six Sigma projects, how to select which Six Sigma methodology to use depending on the state of the process to be improved, how to find hidden misunderstandings between people (especially useful in ‘process door’ Six Sigma projects) and how to simulate the impact of improvements to iterative processes (suitable as a tool in the Improve Phase of Six Sigma projects). All these methods and tools have been developed and tested at Siemens.

Six Sigma Management - Action research with some contributions to theories and methods - Peter Cronemyr
15
This has been an action research project, where the author has been employed by the company under investigation – since 2003 a part of Siemens – for eleven years and has actively influenced the changes in the company on the basis both of knowledge gained at the company and also of research studies conducted at universities. In action research the change initiative under investigation is conducted and analysed in a single context. The readers are invited to draw their own conclusions on the applicability of the results to their own specific cases. In addition to this, some conclusions derived using ‘analytical generalisation’, applicable to a more general case, are presented in the thesis.
The ambition of the research has always been to get the full potential out of Six Sigma. The author has a tendency to see half full glasses, even when others may see half empty ones.
1.2. Background and motives of the researcher
Because the research described in this thesis has been conducted as action research, it is important to describe the background and the motives of the researcher. I will do that in this section. Since this is not my memoirs, I will try to be as brief and concise as possible without leaving out important details.
I am a Swedish male engineer, forty-four years old, working and living with my family in Finspong, Sweden. I have been employed at Siemens for eleven years and before that worked at Saab Aerospace in Linköping for eleven years. For some years now, I have also been an industrial Ph.D. student at the Department of Quality Sciences at Chalmers University in Gothenburg. During my first researcher period, 1997-2000, I was associated with the Department of Quality Technology and Management at Linköping University and the ENDREA graduate school. It resulted in a Licentiate thesis (Cronemyr, 2000:a).
I often consider myself ‘strange’, i.e. in many situations I have often taken on a slightly different role than considered ‘normal’. I have no problem with that. In fact I like it, that is who I am. For example, when I was young I was the only hard rocker with short hair. My hard rock friends – all with long hair – accepted me even though I broke the rule. Later, when I was working as an engineer at Saab, I studied for my Master of Science at the same time that I was working. Colleagues at the University and at Saab thought it was strange. I continued this habit when going first for the Licentiate and then the full Ph.D. I worked at the same time that I was doing research. Once again, not the ‘normal’ way of doing research and not the ‘normal’ way of working. In my departments I have often been ‘not normal’. For example, in the Mechanics Department, I was not a normal stress engineer, nor a normal aerodynamicist, but something in between. Now I am working in a service department, but I am really ‘a strange R&D guy’. When doing research within Quality Management – at least in the beginning – I was considered ‘strange’ because I was a mechanical engineer with no academic background within quality. I had lots of practical experience in process management and improvements, however, and I also talked about misunderstandings between engineers. That was strange.
Some may think I am just obstinate, but I like being strange and I consider it my personal strength. On a personal level I also sometimes take a position considered not normal. For example, in questions concerning gender equality, I have been active in a gender equality
Six Sigma Management - Action research with some contributions to theories and methods - Peter Cronemyr
16
committee. To my male colleagues it was not considered ‘normal’. I have three basic rules, according to which I try to live my life:
• Treat each individual with respect
• Do not lie
• Be nice
First rule: For many years now, my personal motto has been: ‘Om man inte är lite vriden, är man inte helt normal’. When I speak English I say: ‘If you ain’t skew, you ain’t normal’. What it means is that all people are ‘strange’ and nobody is ‘normal’. Every person should be respected for who he/she is. So maybe everybody is as strange as I am. Does that mean I am normal?
Second rule: To me, ‘do not lie’ means ‘be honest’. In a psychology test in a management training course I was asked several questions, among them ‘Are you honest?’ On a scale from 0% to 100% I answered ‘100%’. At the same time my manager, my colleagues, and my employees were asked the same questions about me. On the question ‘Is Peter honest?’, all of them answered ‘100%’. I do not consider myself a saint, so maybe 95% is truer. But, even though they all thought I was honest, it does not mean they all liked it. In many situations, I have been honest and said what I thought, and it was not always appreciated. Especially if we were told what to do by somebody higher up in the company hierarchy and I said ‘I do not think this is right’. Sometimes you are supposed to do as you are told without saying what you think. It is not my style. As a manager you are not always supposed to tell your employees what is going on behind the curtains. I had big problems with that as a manager and that was partly the reason why I quit as a manager.
Third rule: I try to be nice, but sometimes I turn red with rage like most people do when treated without respect. Most of the time I am a pragmatic person. I try to seek solutions instead of conflicts. In another test I was ‘diagnosed’ as finding solutions in the following order: I first rely on relations, if it does not work I am analytical, and, as a last resort, I use anger. I do recognise myself in that description. Normally I do not reach the third stage.
I am also a man of principles. Some may think I am a doctrinaire while others consider me a man of integrity. I try to behave in way so that people will select the second view. My main principles are: Do not break a promise; Do not be late; Follow the law. Nothing strange.
My motives for doing research are not easy to put into words. I feel like an ‘inventor of new ways of co-operating’. I have taken on that role in every job I have had, as long as I can remember: In school, in the military service, at Saab, at Siemens, and at the University. Now, for some years, I have been trying to share the knowledge I have gained over the years and I also want others to review and improve my ideas. That is in essence what this thesis is about. To be very honest, I have no plans about what to do after this thesis has been completed, except for continue working at Siemens. My career path has changed direction many times before, and it was always a surprise to me, i.e. I did not plan for it to happen. Therefore I leave it to the future to surprise me once again. I am just happy that I got the opportunity, the funding, and the ‘partners in crime’ to do this most rewarding work. It has expanded my mind
Six Sigma Management - Action research with some contributions to theories and methods - Peter Cronemyr
17
in unpredictable ways. I have no idea if I will do something similar again. And, talking about motives, maybe this will raise my standing among my colleagues. Except for that, I have no ‘hidden’ motives.
1.3. Selection of research project
This research ‘project’ has actually been many different projects, and the ‘research’ part started later than the projects. The main topic of the thesis, ‘Six Sigma Management’, evolved over several years at Siemens, where I have been one of the most committed drivers.
When I restarted my Ph.D. studies at Chalmers in 2005 I said to Professor Bergman that I wanted to write about Six Sigma instead of the Product Development Process, which was the topic of my Licentiate thesis (Cronemyr, 2000:a). The reason was that I had worked with implementing Six Sigma for several years and I thought I had ‘a lot to say’. Even so, some of the tools that were presented in my first thesis could also be used in this context. That was how the ‘selection’ of research project was done. My managers agreed without steering.
One could argue that there may be better or more successful methods, tools and techniques than Six Sigma. I do not argue against that. It is possible and probable. This thesis just tells the story of how Six Sigma was implemented at Siemens in Finspong, Sweden. If we had implemented some other process improvement method, the thesis would have dealt with that instead of Six Sigma.
1.4. Research questions of the thesis
The general research question of the thesis is:
How to implement and get the full potential out of Six Sigma in an industrial context
The sub-questions of the specific papers are all connected to this overall question. These are:
• How to organise for Six Sigma Management in an industrial context (appendix A)
• How to identify and select Six Sigma projects based on customer feedback (appendices B and C)
• How to select Six Sigma methodology based on the state of the process to be improved (appendix D)
• How to find hidden misunderstandings between people, as a tool in the analyse phase of Six Sigma projects where there are limited data for analysis (appendix E)
• How to simulate improvements to iterative processes as a complementary tool to pilot testing in the Improve Phase of Six Sigma projects (appendix F)
Even though these sub-questions are all logically related to the overall question of the thesis, the individual papers have a character of their own based on the specific topics, to what audience and journal they were addressed, with whom they were co-written and when – i.e.
Six Sigma Management - Action research with some contributions to theories and methods - Peter Cronemyr
18
how long ago – they were written. As a consequence, in addition to the sub-questions given above, each paper may also have additional research questions, not directly related to the implementation of Six Sigma. These are presented in the section entitled ‘Summary of Appended Papers’.
1.5. Purpose
1.5.1. Theoretical contribution
The title ‘Six Sigma Management - Action research with some contributions to theories and methods’ is a suggestion that the findings presented herein may contribute to the body of knowledge within the academic discipline investigating and developing Six Sigma and Process Management, i.e. one of the areas within Quality Sciences.
The concept of Six Sigma Management, i.e. the integration of Six Sigma and Process Management, will contribute to a more holistic view where, traditionally, these two disciplines have chiefly been treated separately.
It is also my wish that the new tools and the improvements to existing tools that are presented in the appended papers will contribute by improving the Six Sigma toolbox - or toolboxes - as presented in textbooks, papers and teaching material.
1.5.2. Industrial relevance
This has been an action research project conducted at an industrial company. As such, the main focus has clearly been to solve problems and realise potentials with industrial relevance. Even though the research results presented in this thesis have been shaped to fit in an academic thesis, which in some cases may have made it less easy to read for a non-academic audience, the results behind the academic words and references are all results from projects where the starting points have been real problems and potentials in industry.
While many industrial companies have implemented Six Sigma or have planned to do so, and may be interested in the results reported here, these results must be viewed in their own context. An aspect of action research is that it is conducted at a single company, which limits the possibility to make generalisations. It is up to the readers, in industry and academia, to draw their own conclusions about the applicability to their own contexts.
At the company studied, Siemens, Six Sigma is a top priority initiative in the development of future business processes. The research results have already been used on a local level – as a natural consequence of the action research process – and discussions are ongoing as to how to spread the knowledge to other parts of the company.

Six Sigma Management - Action research with some contributions to theories and methods - Peter Cronemyr
19
1.6. Outline of thesis
This thesis consists of the thesis framework, i.e. this part, and six appended papers.
After the introductory chapter the research methodology used is presented. The theoretical framework of implementing Six Sigma is then outlined. The six appended papers are summarised and viewed in the light of the time that has passed since they were written. Finally, a discussion, some reflections and recommendations for future research are given.
The relations of the appended papers are presented in Figure 1.
Figure 1. Relations between the appended papers. Drawn on the Project Selection Loop presented in appendix A

Six Sigma Management - Action research with some contributions to theories and methods - Peter Cronemyr
20
2. Research Methodology “Science is a journey, not a destination. … We need to take science personally. We have to trust our own experience and reflection.” (Gummesson, 2000, p. xi)
As in all research, the results of the research project presented in this thesis rely on the appropriate usage of a research methodology. The main method used, essentially an action research approach (see e.g. Lewin, 1946, 1947), is described in detail, but some other methods have also been used. These are presented in the last section, ‘Research Techniques of the Specific Papers’. But first I would like to give a short review of research methodology in general and my personal views of some central concepts.
2.1. A short overview of research methodology
This section starts with my personal views of some central concepts: truth, science, research and values. Many topics are touched upon but this is by no means meant to be an ‘introduction’ to philosophy or research methodology. Rather it is a quick look into the author’s views and positions on these subjects. The rest of the section deals with: data collection and theory founding; quantitative vs. qualitative approach; and comparisons of traditional academic, action and pragmatic research approaches. In the following section the action research approach used for this thesis will be described more thoroughly.
2.1.1. The Big Questions: Truth, Science, Research, Values
2.1.1.1. Truth
What is the truth? Logically, by testing a statement against predefined criteria, one can establish whether the statement is true or not, but, since the criteria may change with time, so does the truth. Plato told a story about the prisoners in the cave. They could not see the ‘real’ objects outside of the cave but they could see the shadows of the objects on the wall inside the cave. Only if they were to be released would they see ‘reality’ (see e.g. Philips and Soltis, 1991). Personally I do not believe the human race will ever be released from its cave. Even though science and research will help to expand the body of human knowledge about the universe and the human mind, I believe there are limits to what humans can understand, similar to Kant’s opinion about the unreachable ‘thing-in-itself’ (see e.g. Emond and Hansson, 1995). Many philosophers and theologians have seen the human species as ‘special’ vis a vis other species, i.e. we have been chosen by (some) God, but I do not think so. I believe, given other circumstances, some other species – or creature – may evolve as far, or further, than we have.
I have no problem with the ‘unreachable truth’. The more pragmatic ‘the truth as we know it’ is enough for me. Pragmatism was founded in the late nineteenth century by Charles Sanders Peirce, and was developed further in the early twentieth century by John Dewey and others. Dewey inspired C.I. Lewis, the founder of ‘conceptual pragmatism’ which was an important source of inspiration for Shewhart and Deming (see e.g. Mauléon and Bergman, 2002). Lewis

Six Sigma Management - Action research with some contributions to theories and methods - Peter Cronemyr
21
argued that science does not merely provide a copy of reality but must work with conceptual systems and that those are chosen for pragmatic reasons to aid inquiry (Lewis, 1929). In a casual conversation a research colleague once said “Truth is the glue that bonds reality.” I really like that metaphor. To a pragmatist, the truth is something useful. If a statement is not useful it is not true. That is my view; the reader may have another view.
2.1.1.2. Science
To a scientist “the truth is out there”; and science and research are all about finding the truth. Science explains reality but, according to believers, so does religion. According to, among others, Oxford-based Darwinist Richard Dawkins (see e.g. Dawkins 2006) and the late American astronomer Carl Sagan (1974), the main difference between science and religion is that ‘a scientific truth’ is based on proof while ‘a religious truth’ is based on faith. I am ‘a true believer’ of science but I do not consider science and religion to be very different. Those who believe in science ‘know what is true and what is not’ while those who do not ‘are ignorant’. That sounds like a religion to me. In his book ‘Dawkins’ God’ Alister McGrath (2004) – a former atheist himself, and a biochemist turned theologian and philosopher – challenges Dawkins on the very ground he holds most sacred – rational argument. McGrath argues that science is a cultural practice that is provisional and socially shaped – an enterprise to be cultivated and fostered but hardly worshipped or idolised. I find McGrath’s book fascinating but, even though I dislike Dawkin’s dogmatic style of writing, I still ‘believe’ in science as a method, although with limitations. In 1974 Carl Sagan thought the questions of the origin and the future faith of the cosmos would be finally answered within fifty years (Sagan, 1974, p.11). I hold a more pragmatic – I would say less religious – view, that we will modify our beliefs of ‘the truth’ as long as we live and learn. There are no ‘final’ answers.
2.1.1.3. Research
So what is scientific proof? It depends on who you ask and what scientific method that person advocates. A mathematical or a logical proof is deduced from established theory while a hypothesis induced from empirical data is tested with some statistical method. The users of statistical methods have often defined themselves as the sole practitioners of the scientific method (Collins, 1984, p. 329) but Collins argues that probability is a theory like any other, and each statistical method contains its particular theoretical bias (ibid). He also argues that “statistical testing is more a matter of faith than an ultimate criterion of truth [and] the fact that we do rely so much on statistics is more an indication of the social relationships that exist in the community of researchers than a sign of scientific progress” (Collins, 1984, p. 335). Others use more qualitative methods where empirical data (or observations) are viewed in context and interpreted into new theories. A qualitative proof could be when the new theory is supported by other independent observations or it could be only to show that the researcher and the method used were valid and unbiased. It is not as structured as quantitative proof. Hence it has often been mistrusted by positivist scientists. But sometimes the use of statistical methods has been proved not to secure a ‘scientific truth’. In his book The Mismeasure of Man Stephen Jay Gould (1981) explores how statistical ‘scientific’ methods have been misused in history to ‘prove’ the intellectual superiority of white Europeans to other people, especially
Six Sigma Management - Action research with some contributions to theories and methods - Peter Cronemyr
22
black Africans. Without common sense and fairness, statistics is a dangerous tool that can be used for one’s own purposes – may they be political, economic or personal.
But even if something can be proved not to be true, it may very well become true just because people believe it to be true. As the sociologist William I. Thomas wrote, and what is now known as the so-called ‘Thomas theorem’: “If men define situations as real, they are real in their consequences.” (Thomas, 1928). This applies to all social processes where humans participate. When conducting social research it is very important to be aware of this phenomenon. While a self-fulfilling prophecy is normally ‘bad research’ for a traditional academic researcher, it may very well be ‘a good approach for achieving the goals’ for an action researcher.
As discussed above, research methodology is a central topic to scientists and researchers. Many think research methodology is more important than research results, i.e. without an accepted research methodology the results are of no value. As a contrast non-scientists – by scientists sometimes contemptuously labelled ‘consultants’– are more interested in results, whatever the method used. In my daily work, which can be described as a ‘change management practitioner’, I often take the position of the non-scientist but, when I take on the role of an action researcher, I am fully aware of the importance of using an accepted research methodology. In the following sections I discuss the validity and reliability of action research and describe how I have conducted the research which has resulted in this thesis and the appended papers. Hence I believe the results can be trusted. For me, results and method are of equal importance. Without either, the research is not useful.
A final personal thought on research. I find it sad that the sceptical academic view on research results seems to prevent people from being bold. I do not mean that one should be rash but rather to be proud and to defend one’s opinions. On occasion I have got the comment from colleagues or reviewers that what I have found can not be true (or “will be questioned”) because I can not mention some one else who has presented the same results; “What are your references?” If I put a name and a year within brackets at the end of a sentence it is accepted but if I say “this is my experience” it is ‘non-scientific’. I try to be bold and make scientific arguments supporting my opinions when I am criticised by people with other opinions. I feel supported by the words of Alvesson and Sköldberg: “The risk with too much book-learning is to become over-dependent on earlier authorities and tangled up in all the old problems, so it becomes difficult to see new possibilities. Boldness in the process of interpretation can be enhanced by not having read too much about previous achievements.” (Alvesson and Sköldberg, 2000, p.17). For me, one of the most important differences between science and religion is, while most religions have settled answers to questions, in science as in philosophy, one should be allowed to ask any question and there should be no settled answers. That includes the willingness to question one’s own assumptions and results.
2.1.1.4. Values
I have come to the conclusion that there is not just one common view among researchers about scientific method. I accept that. I respect others and hope others respect me. I think basic values are more general than methods. The basic values that have governed me in my research, as in my everyday life, can be summarised by the following, earlier mentioned, three rules.
Six Sigma Management - Action research with some contributions to theories and methods - Peter Cronemyr
23
• Treat each individual with respect Research implication: be cautious about generalising people
• Do not lie Research implication: explain conditions and motives as thoroughly and truly as possible
• Be nice Research implication: try to find solutions, not conflicts
These are given in the order which I rate them. By applying these rules, when conducting action research, the results from my research project should be trustworthy, at least to people who share these basic values.
2.1.2. Data collection and theory founding
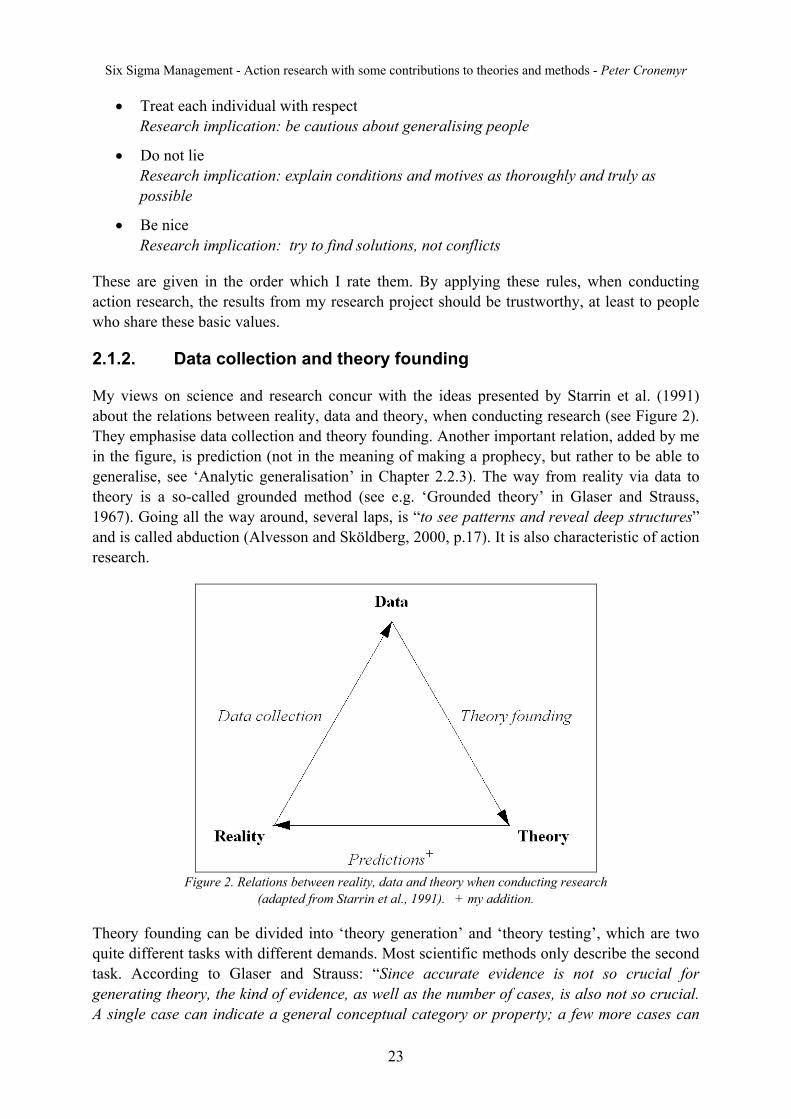
My views on science and research concur with the ideas presented by Starrin et al. (1991) about the relations between reality, data and theory, when conducting research (see Figure 2). They emphasise data collection and theory founding. Another important relation, added by me in the figure, is prediction (not in the meaning of making a prophecy, but rather to be able to generalise, see ‘Analytic generalisation’ in Chapter 2.2.3). The way from reality via data to theory is a so-called grounded method (see e.g. ‘Grounded theory’ in Glaser and Strauss, 1967). Going all the way around, several laps, is “to see patterns and reveal deep structures” and is called abduction (Alvesson and Sköldberg, 2000, p.17). It is also characteristic of action research.
Figure 2. Relations between reality, data and theory when conducting research
(adapted from Starrin et al., 1991). + my addition.
Theory founding can be divided into ‘theory generation’ and ‘theory testing’, which are two quite different tasks with different demands. Most scientific methods only describe the second task. According to Glaser and Strauss: “Since accurate evidence is not so crucial for generating theory, the kind of evidence, as well as the number of cases, is also not so crucial. A single case can indicate a general conceptual category or property; a few more cases can
Six Sigma Management - Action research with some contributions to theories and methods - Peter Cronemyr
24
confirm the indication.” (Glaser and Strauss, 1967, p.30). These are very important arguments when conducting action research on a single case (more on this subject is discussed in Chapter 2.2.3).
According to Glaser (1978) the demands on the relations between theory and data are:
• The theory has to fit the data, and not the other way around.
• The theory must work.
• The theory must have practical relevance.
• It must be possible to modify the theory when data are changing.
For a pragmatist, these rules are easily accepted. As a matter of fact, there is an obvious resemblance of the research model in Figure 2 to the PDSA (Plan, Do, Study, Act) cycle (see e.g. Bergman and Klefsjö, 2003), developed by Shewhart with inspiration from the pragmatist Lewis. As described later, Six Sigma is an evolution of the PDSA cycle.
According to Starrin et al. (1991) the most important link between data and theory is the coding and classification of the collected data. When going from data to theory one has to be sensitive to the data and should avoid – as much as possible – filtering them through pre-made assumptions, even though it is not possible to start the research without any assumptions. Hence it is very important to account for one’s initial assumptions.
2.1.3. Quantitative vs. qualitative approach
Quantitative or qualitative methods can be used to collect data.
The aim of a quantitative approach is either to study relationships between different concepts or to investigate the distribution of an earlier defined phenomenon. The quantitative approach adopts the ideals of the natural sciences, where the collected material and the results consist of quantitative data. Statistical methods – or rather theories, as emphasised by Collins (1984) – are frequently used.
The aim of the qualitative approach is instead to investigate – and describe – variations, structures and processes for phenomena that are not quite known. The qualitative approach takes its starting point in the opinion that every phenomenon consists of a unique combination of attributes (Starrin, 1994). Therefore statistical methods are not very useful.
While collection of quantitative data is based on measurements, collection of qualitative data is often based on questions, answers and stories as told by people. As described later, I have used questionnaires and semi-structured personal interviews.
Another source of qualitative data that is very important in action research is the researcher’s first-hand experiences. Research colleagues sometimes view this type of qualitative data with suspicion because they think the researcher may be biased or has ‘hidden motives’, but that may be so for anybody, even for people who answer questions in questionnaires or interviews.
Six Sigma Management - Action research with some contributions to theories and methods - Peter Cronemyr
25
Therefore qualitative data must be validated. The validity of data in this thesis is discussed in the following sections.
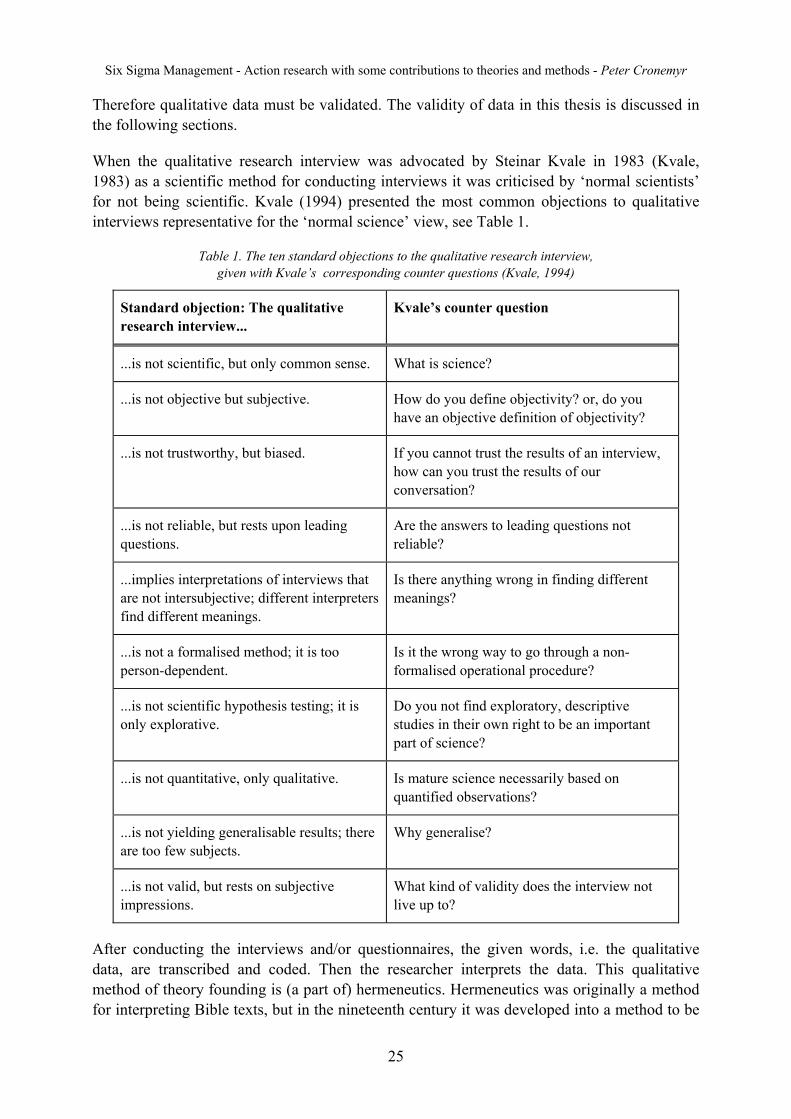
When the qualitative research interview was advocated by Steinar Kvale in 1983 (Kvale, 1983) as a scientific method for conducting interviews it was criticised by ‘normal scientists’ for not being scientific. Kvale (1994) presented the most common objections to qualitative interviews representative for the ‘normal science’ view, see Table 1.
Table 1. The ten standard objections to the qualitative research interview, given with Kvale’s corresponding counter questions (Kvale, 1994)
Standard objection: The qualitative research interview...
Kvale’s counter question
...is not scientific, but only common sense. What is science?
...is not objective but subjective. How do you define objectivity? or, do you have an objective definition of objectivity?
...is not trustworthy, but biased. If you cannot trust the results of an interview, how can you trust the results of our conversation?
...is not reliable, but rests upon leading questions.
Are the answers to leading questions not reliable?
...implies interpretations of interviews that are not intersubjective; different interpreters find different meanings.
Is there anything wrong in finding different meanings?
...is not a formalised method; it is too person-dependent.
Is it the wrong way to go through a non-formalised operational procedure?
...is not scientific hypothesis testing; it is only explorative.
Do you not find exploratory, descriptive studies in their own right to be an important part of science?
...is not quantitative, only qualitative. Is mature science necessarily based on quantified observations?
...is not yielding generalisable results; there are too few subjects.
Why generalise?
...is not valid, but rests on subjective impressions.
What kind of validity does the interview not live up to?
After conducting the interviews and/or questionnaires, the given words, i.e. the qualitative data, are transcribed and coded. Then the researcher interprets the data. This qualitative method of theory founding is (a part of) hermeneutics. Hermeneutics was originally a method for interpreting Bible texts, but in the nineteenth century it was developed into a method to be
Six Sigma Management - Action research with some contributions to theories and methods - Peter Cronemyr
26
used for analysing any text, and specifically interpreting the experiences, intentions and views of the author of the text (or the interviewee in the case of analysing a transcribed interview). The objective is to gain insight into the author’s/interviewee’s situation and way of looking at things (Emond and Hansson, 1995).
2.1.4. Traditional academic research vs. action research
Academic research, be it quantitative or qualitative as described above, has a long tradition since the days of Aristotle, but, even though more than six decades have passed since action research was first introduced by Kurt Lewin (see the following Sections), it is still not fully accepted as a scientific method by some academic researchers. Social science professors Lennart Svensson at Linköping University and Kurt Aagaard-Nielsen at Roskilde University insist that “contemporary action research is an organic part of the academic community”, and that “it should no longer be seen as a sect or an exclusive belief system among some isolated researchers” (Svensson and Aagaard-Nielsen, 2006, p.2).
What is the problem with traditional academic research? According to Svensson and Aagaard-Nielsen, the new production of knowledge often takes place outside the formal university system. Thus, external actors request a new kind of co-operation with researchers. Practitioners will no longer accept being objectified in the research process. Instead they prefer co-operation, which is based on equality, flexibility, closeness and joint learning (Svensson and Aagaard-Nielsen, 2006, p.22-23). As a consequence, during the past decades, the following shifts have taken place in research and strategies (Svensson and Aagaard-Nielsen, 2006, p.26):
• from an experimental to a learning design
• from a consensus, to a conflict, and back to a consensus paradigm
• from employee-based values to broader values
• from a vision of a grand theory to a more pragmatic approach
• from the use of single methods to broad variations
These shifts have not reached the same stage everywhere though. The Nordic countries have more action researchers than any other part of the world (Svensson and Aagaard-Nielsen, 2006, p.40). In some other parts of the world, action research may not be an accepted scientific method.
While traditional academic research aims at achieving generalisable knowledge that can be applied in other settings, action research aims at achieving a change with some performance target in a specific process or setting.
Svensson and Aagaard-Nielsen compare traditional academic research, sometimes labelled “MODE 1”, to action research, consequently labelled “MODE 2”, and define the major differences in the following way.
Six Sigma Management - Action research with some contributions to theories and methods - Peter Cronemyr
27
“[Traditional] academic research is defined here as research in which the researcher understands her-/himself to be in a privileged position together with other scientists in the construction of their theories and methods. They might be positivists, hermeneutic phenomenologists or even constructivist relativists. But, unlike action researchers, they understand themselves as having an important role in the development of knowledge, which is seen as quite a different kind compared to ordinary, practical oriented everyday experience. Action researchers see themselves as co-producers in the creation of new knowledge, but they do not see themselves as being in a privileged position in this joint learning process. On the contrary, action researchers can only create knowledge in co-operation with social actors based on trust and free agreement to participate. But at the same time, the researcher must possess and be respected for her/his professional competence in handling data, in constructing theories, in organising a learning process, in relating the results to existing research, in ethical matters, and so on.” (Svensson and Aagaard-Nielsen, 2006, pp.3-4).
Accepting their views, one can conclude that traditional academic research and action research are built on different paradigms: the scientist as an outsider vs. insider. The problems of being an insider, according to the critics of action research, are exactly what Svensson and Aagaard-Nielsen mention in the last sentence above. To be accepted as an action researcher in the academic community one has to show validity in questions concerning e.g. motives, ethics, process and knowledge of previous research. But, then again, why should that not apply to all types of research? Action research is presented in more detail in the following section (2.2).
2.1.5. Pragmatic research
So, there are different ways of conducting research; traditional academic research – which can be qualitative or quantitative – and action research. When should one choose to use the one or the other?
As is evident from the title of this thesis, I have chosen to use action research methodology but the truth is – as a pragmatist – I use whatever scientific method that is useful for fulfilling my research purposes. I do not say that “anything goes”, on the contrary, the methods I use are all accepted scientific methods. To be sure, the main approach has been action research but, to make some of the results more general and academically valid, I have also used qualitative and even some quantitative methods.
The combination of positivist quantitative methods and hermeneutic qualitative methods, and some action research methods, was advocated by Fishman (1999) as ‘pragmatic research’.
According to Fishman, neopragmatism, a theme emphasised by post-modern epistemology, allows for scientific effort, although the purpose of science is revised. Instead of being a search for underlying laws and truths of the universe , science serves to collect, organise and distribute the practices that have produced their intended results (Fishman, 1999, p.6). There has been – and still is – a political polarisation of the “positivist right” and the “hermeneutic left”, but pragmatism can be viewed as staking out a middle centrist position to be used to achieve the democratically derived program goals of particular, historically and culturally situated social groups (Fishman, 1999, p.8).
Six Sigma Management - Action research with some contributions to theories and methods - Peter Cronemyr
28
The pragmatic researcher recognises the trade-offs between the insider and the outsider roles and views the importance of integrating both of these perspectives in the design of a research project (Fishman, 1999, p.140). This is very similar to the role of the action researcher as described in the next section.
2.2. Action Research
2.2.1. To help the practitioner in an action of planned change
The concept of ‘action research’ was first introduced in social research by John Collier in 1945 (Collier, 1945). Psychologist Kurt Lewin, by many considered to be the father of action research, argued for a research discipline with the main purpose “to help the practitioner” (Lewin, 1946). According to Lewin, action research is a parallel action and a creation of a knowledge base for the researcher when he/she participates in an action of planned change in cooperation with the client/practitioner. “[Lewin’s] theory for turning research into action and vice versa enabled a merger of Taylor’s vision of labour-management cooperation with systematic social experiments. […] He taught that to understand a system you must seek to change it. […] He also pointed the way toward collaborative consultation.” (Weisbord, 1991, p. 71-72)
Lewin described the steps of research in an ‘action of planned change’ as planning, fact-finding and execution (Lewin, 1947; see Figure 3). It starts with an idea expressed as goals and means that is then transformed into a general plan. This is carried out by the researcher in co-operation with the client but the first seed for the idea comes from the client (sometimes the client is the researcher). The action then goes on with planning, fact-finding and execution in several steps, each step corresponding to a lap in Starrin’s model (Starrin et al., 1991, see Figure 2). In each step the local theory is modified and new knowledge is used in the planning of the next step. There is no definite end to the process where “the truth has been found”. Instead the process proceeds until the performance targets have been reached. It should be noted that the general plan, including the goals, can be changed at any step if new knowledge is gained that puts the original ideas into a new light. To describe the results one has to describe the process itself as it evolves.
This corresponds to my view of a research process where the mind expands as more knowledge is created. When empirical and theoretical knowledge are connected, an abduction (Alvesson and Sköldberg, 2000) inspires to a change in the research question along the way. If the opposite were true the research question would never change and no knowledge would have been created during the research project other than facts that can be viewed with the same view as the one started with.

Six Sigma Management - Action research with some contributions to theories and methods - Peter Cronemyr
29
Figure 3. Action research: planning, fact-finding and execution (re-drawn from Lewin, 1947).
Blake and Mouton (1984) describe action research as an example of a catalytic intervention characterised by the following: “In intervention, a catalytic consultant is the agent. He or she enters a situation with the intention of increasing the rate at which a process of change is occurring. The goal is to assist those within the status quo to do what they are doing in an improved way” (Blake and Mouton, 1984, p.288). Blake and Mouton identify the importance of the consultant, i.e. the researcher, in “accepting [the client’s] felt needs. The underlying real problems [...] are then likely to come to the surface and can be dealt with as they become evident” (Blake and Mouton, 1984, p.290).
In his book Qualitative Methods in Management Research Evert Gummesson (2000) emphasises the following advantages of action research:
• Firsthand experiences: “Preunderstanding could be based on a combination of firsthand personal experience and the experience of others [but] the researchers’ own experiences [are] the most important. [From his experience,] researchers’ preunderstanding was too infrequently based on their own experiences” (Gummesson, 2000, pp.208-209).
• Access to data: “Traditional forms of data collection […] were considered to provide only superficial access to processes of change. […]. The role of change agent would provide better access” (Gummesson, 2000, p.209).
• Inductive method: “Business administration is an applied science (or maybe an art) that has to be connected to real world data. Theories concerned with processes in organisations must primarily be generated on the basis of real data (inductive data), and not by means of logical deductions from established theory” (ibid).
All these comments support the design of my research project. I base my thesis on a combination of firsthand personal experience and the experience of others. I had access to explicit and tacit knowledge upon which the theories were developed.

Six Sigma Management - Action research with some contributions to theories and methods - Peter Cronemyr
30
2.2.2. Managing the many roles of an action researcher
2.2.2.1. Consultant vs. researcher
A question that emerges is: when am I a consultant and when am I a researcher? Westlander (1999) deals with this question (translated from the Swedish): “In action research, the researcher role and the consultant role are two different things. [...] In the consultant role the consultant can devote himself to the helping function and to the client’s needs and, if useful research results are available, these are used. In the researcher role the researcher has to carry out a double task, and not a very easy adjustment, to satisfy the client’s needs and at the same time deliver new, and, if possible, generalisable results to the body of change research.” Westlander concludes, “It is not surprising that the methodological discussion on the value of action research is periodically recurring” (Westlander, 1999).
Also Gummesson (2000) describes some of the possible conflicting demands of academic research and the requirements of management consultancy.
• Documentation: “The reporting of a project should be such as to allow the readers to draw their own conclusions. The researcher’s report should be sufficiently comprehensive to provide a coherent description of the research project and to allow the reader to assess its quality” (Gummesson, 2000, p.211). This is a demand made by other scientists. The client company is normally only interested in the results, not the way they were accomplished.
• Credibility: “The consultant is judged in terms of performance, be it tangible results or perceived confidence. The researcher’s credibility is assessed by people who do not participate in the research process but read a report” (Gummesson, 2000, p.213). For me, it has been two totally different things to act in industry and then to describe in academia what I did. Clearly, acting is a much more direct and richer way of communicating than describing something afterwards in a text. The reason why some of my texts are quite long has to do with my wish to paint the picture as close to the real thing as possible, as it was acted. Even so, the people reading my texts – judging my credibility – can never see the full picture as seen by the people who were present in the action.
• Validity: “Clients are interested in the validity of the results in their specific cases but not as interested in the general validity. However, there can be several similar cases in the company and it is therefore desirable that the methods and results can also be applied in these cases” (Gummesson, 2000, p.214). The tools and methods that I have developed in this research project have been presented to other parts of Siemens – a company of almost half a million employees. Hence, it is a big advantage to do action research in a large company. But, from a scientific point of view, this may give the researcher ‘hidden’ motives that may jeopardise the validity and reliability of the results. Validity and reliability of action research is discussed in more detail later.
• Confidentiality: “The researchers must make their results available to other researchers and not just to their immediate client. This may come into conflict with the

Six Sigma Management - Action research with some contributions to theories and methods - Peter Cronemyr
31
company’s wish to keep the assignment confidential and proprietary” (Gummesson, 2000, p.215). In my case there were never any real problems with confidentiality. Only in some cases have the real data and process maps been excluded or substituted. Both good results and not as good results were achieved and have been presented. It would be unwise not to present the failures that occurred along the way since they were the most important sources of knowledge about what to do and what not to do.
As a summary of possible conflicts, Gummesson concludes: “Once the research role comes into conflict with the role of consultant, the latter must be given priority. If this does not take place, the change process will itself be affected by the academic research. This creates an unsatisfactory situation both for the client and for science” (Gummesson, 2000, p.216). I fully agree with Gummesson on this point.
2.2.2.2. Outsider vs. insider
Westlander (1998) compiles six different action research approaches. The approach that I have been using is the ‘collaborative action inquiry’. It is characterised as follows: “The researcher has an almost total identification with the activities and direction of change of the client/company”. That is very true for me, which led to a confusion of roles. When am I a scientist/researcher/consultant, i.e. an outsider, and when am I the practitioner/client, i.e. an insider? That is a very important question for a researcher on a ‘normal science path’ where the researcher should always be an outsider without any influence on the results. However, since insiders and outsiders cooperate in action research, it is not equally important for me when doing action research. I am content with accepting that I am both.
Even though it is not mentioned frequently in the literature, this type of action research is becoming more common. “Increasingly, action research is moving to a model of ‘full partnership’ between researcher and practitioner, and practitioners are met not as help-seeking clients but as autonomous and potentially self-developing persons. In Scandinavian countries, embedded in a culture of democratisation, this principle has been received (at least in theory) as natural.” (Westlander, 2006, p.55)
In most of the literature (but not all, see below) the action researcher is presumed to be an academic who visits or joins the client company to participate in an action research project. In that case the researcher takes on the so-called consultant role, as described above. But in my case, I was a change management practitioner at a company, who visited the university to become an industrial Ph.D. student, to conduct action research in my home company. I would not call myself a ‘consultant’; I prefer ‘practitioner’. There are some major differences in these two roles. The most important one is the difference in long-term objectives. While a consultant may look for quick wins that will generate more commissions, the practitioner – since he/she will stay with the company and will be held accountable – may be more interested in dealing with problems on a deeper level securing the improvements so that the results are sustainable.
French and Bell (1973) deal with the issue of the internal practitioner in their book on organisational development (OD). They state that the action research model is the platform used for most OD interventions. They do not use the words ‘researcher’ or ‘consultant’ but instead consistently use the word ‘OD practitioner’. Westlander concludes: “It must be
Six Sigma Management - Action research with some contributions to theories and methods - Peter Cronemyr
32
stressed that action research in the context of OD is a much more pragmatic business than action research applied by researcher.” (Westlander, 2006, p.53). In my research project, I have been a practitioner and a researcher. Outside of the research project, I have on occasion taken on the role of consultant when I have been helping other departments at my company, but that is not covered in this thesis.
The set-up of a practitioner doing action research at his/her own home company – what I call a ‘practitioner action researcher’ – is often not recognised as ‘normal’ research by the scientific community. For some reason there is sometimes a suspicion towards the researcher that he/she can not be trusted because both the research questions and the research results are to a great extent based on his/her own experiences. But this is a question of reliability that has to be dealt with in all qualitative research, not only ‘practitioner action research’. Alvesson and Sköldberg have identified this when interviewing managers:
• “In interviews with senior managers, the picture that emerges of the subjects themselves and of their activities tends to have a positive charge: rationality, creativity, dependability, goal orientation, a client and market orientation, a desire for the well-being of the organization members - all these are claimed for the orientations of the interviewees personally, as well as for companies and other organizations they represent.” Alvesson and Sköldberg (2000, p.268)
I do not accept that an interview with a person at a company conducted by an external researcher is by default more reliable than first-hand experience of a ‘practitioner action researcher’. Both need to be reviewed by some other person to become reliable and valid.
I would like to conclude this section by making a rather personal note. I think, if I were a researcher employed at a university doing research projects that included going to companies to “find the truth” using questionnaires and interviews only, I would be very envious of practitioner action researchers’ access to data including historical facts, contact networks and the possibility to try out new ideas. Could that be the reason why practitioner action researchers are sometimes treated with suspicion? I am not saying it is so, but I suspect it could be part of the explanation.
2.2.2.3. Real-time vs. retrospective
The literature on action research normally requires the researcher to do action research in the course of the daily work in a project, i.e. real-time action research. There is, however, another approach as suggested by Gummesson (2000) called retrospective action research. He argues: “To deserve this tag, the studies should be systematic and relate to theory and other research. The experience of having lived the process should be triangulated by using additional methods such as document studies and interviews with other actors. The great advantage of retrospective action science is absolutely unique access and preunderstanding that should not be wasted by the scientific community.” (Gummesson, 2000, p. 122)
As described below in Section 2.3.1, this corresponds very well to what I have been doing when writing the paper in Appendix A. So I have been a ‘practitioner action researcher’ and,
Six Sigma Management - Action research with some contributions to theories and methods - Peter Cronemyr
33
at times, a ‘retrospective action researcher’. Maybe not a ‘normal’ action research approach. Then again, who’s normal?
2.2.3. Validity and reliability of action research
By describing how my research project was conducted, it is my intention that the reader shall be able to form his or her own opinion of the credibility of the study. In next section (2.3) I present the research techniques, including questions concerning validity and reliability, of the specific papers.
The credibility of a study, in terms of its validity and reliability, is as important for qualitative research – including action research – as it is for quantitative research. By internal validity is normally meant to what extent the chosen work method is appropriate for the problem studied whereas by external validity is meant to what extent the results are generalisable to other areas. Reliability normally measures whether the instruments are of good quality or not and to what extent the results rely on a firm empirical foundation.
Merriam (1988) describes internal validity as the extent to which results correspond to reality. But, because of three facts, the researcher must judge the internal validity from the researcher’s own experiences instead of from reality itself, which we cannot experience directly.
These facts are:
• Data do not speak for themselves. There is always an interpreter.
• A phenomenon cannot be measured or observed without changing it.
• Numbers and models are abstract concepts. They are only representations of reality, not reality itself.
Merriam concludes that what is considered to be true by the persons in the studied situation can be more important than what actually is true.
Merriam proposes six techniques that can be used to ensure internal validity, see Table 2.
As I indicate in the table, I have used all of the proposed techniques, but not all techniques in all parts of the research project. The technique that I think is the most important one for ensuring ‘truth value’ is ‘Member checks’. I have used that for all my papers. The following section (2.3) describes the usage in the research of the specific papers.
External validity is to what extent the results of a study can be applied to other (similar) situations, i.e. a question of generalisability, or what Lincoln and Guba chose to call ‘transferability’ (Lincoln and Guba, 1985, in: Merriam 1988). When researchers generalise, they really make claims about the applicability of their findings to other settings. Readers must always assess those claims critically (Firestone, 1993). Generalisability is clearly not the strength of qualitative research, but Firestone argues that qualitative methods are not at any great disadvantage, although there are things researchers can do to strengthen their case.

Six Sigma Management - Action research with some contributions to theories and methods - Peter Cronemyr
34
Table 2. Techniques for ensuring internal validity. (Adapted from Merriam, 1988)
Technique Description by Merriam Usage in this project
Triangulation Use of more researchers or more information sources.
Used partly
Member checks Taking data and interpretations back to the persons interviewed.
Used partly
Long-term observations Repeated observations of the phenomenon at the research site during a long time.
Used extensively
Peer examination Asking colleagues to comment on the findings as they emerge.
Used extensively
Participatory modes of research
The studied persons participate in the research design.
Used partly
Researcher’s biases Clarifying the researcher’s assumptions and theoretical orientation.
Used extensively
Merriam (1988) proposes two techniques for ensuring external validity, i.e. generalisability, see Table 3.
Table 3. Techniques for ensuring external validity. (Adapted from Merriam, 1988)
Technique Description by Merriam Usage in this project
Similar studies Cross-analysis of similar studies Used partly
Reader or user generalisability
Leaving the extent to which a study’s findings apply to other situations up to the people in those situations.
Used extensively
As mentioned in previous sections, there is no direct purpose of generalising the results when doing action research. The purpose is more to achieve a performance target and to present what contributed to the desired change in a positive way and what was negative. In this sense the technique used is ‘Reader or user generalisability’ as stated in Table 3. The client in the action research project is normally satisfied with this level of generalisability; the increase in the performance of their process is the main interest. But for the research community, ‘Reader or user generalisability’ is normally not enough to be viewed as ‘good research results’. One would like to use the technique ‘Similar studies’ to compare and get more general results, but how can that be done when working on a single case? One technique proposed by Firestone (1993) that can be used is called ‘Analytic generalisation’, see Table 4.

Six Sigma Management - Action research with some contributions to theories and methods - Peter Cronemyr
35
Table 4. Generalisation techniques according to Firestone (1993)
Technique Description by Firestone Usage in this project
Extrapolation from sample to population
Relies on sampling and probability theory. Requires large populations and large samples.
Not used
Analytical generalisation
Does not rely on samples and populations. Uses a theory to make predictions and then confirms those predictions. With varying conditions, the results should differ in predictable ways.
Used partly
Case-to-case translation Letting a person in one setting adopt a program or idea from another setting.
Used extensively
‘Extrapolation from sample to population’ can only be used in a very limited way when doing qualitative research. Even if qualitative data, e.g. information from questionnaires and interviews, are coded and transformed into quantitative data that could be treated as sampling data, they are all still taken from the same case. This does not make the data more general. Furthermore, the weakness of reviewing case data to generate variables and identify relationships is that cases lose their identity. The dynamic processes through which events unfold to create outcome of interest in each site are lost. Moreover, there is a tendency to ignore exceptions in order to identify the main patterns (Firestone, 1993, p.20).
‘Case-to-case translation’ corresponds to ‘Reader or user generalisability’ suggested by Merriam (see Table 3). According to Firestone, while transfer of findings from one case study to another is done by the reader, the researcher has an obligation to provide a rich, detailed, thick description of the case. But one cannot know the situations in which readers are likely to consider applying findings that are presented. (Firestone, 1993, p.18).
The middle course, as suggested by Firestone, is ‘Analytic generalisation’ which can be used to create and test theories in a single case. “In analytic generalisation, the investigator is striving to generalise a particular set of results to a broader theory. To generalise to a theory is to provide evidence that supports (but does not definitively prove) that theory. […] When one generalises to a theory, one uses the theory to make predictions and then confirms those predictions. […] Where ancillary conditions vary, the results should differ in predictable ways.” (Firestone, 1993, p.17). For a statistician it may be ‘non-scientific’ to extrapolate from a single case but, as Firestone concludes (referring to Campbell, 1986), “most high-quality scientific program studies have used illustrative rather than random samples, an approach [Campbell] endorses while arguing that generalisation is not necessarily lost as a result.” (Firestone, 1993, p.18).
This corresponds well to the arguments of Richard Normann: “The possibilities to generalise from one single case are founded in the comprehensiveness of measurements which makes it possible to reach a fundamental understanding of the structure, process and driving forces

Six Sigma Management - Action research with some contributions to theories and methods - Peter Cronemyr
36
rather than superficial establishment of correlation or cause-effect relationships.” (Normann, 1970, p. 53, cited in Gummesson, 2000, p.89)
In my case, I have studied a ‘single case’ but the case has changed over a period of several years; hence it could – with a little good will – be called ‘Cross-analysis of similar studies’ as suggested by Merriam (1988). Trying to implement Six Sigma in one setting did not work because of several ‘problems’. Once these ‘problems’ had been removed, the implementation was much more successful. This is a kind of analytical generalisation where the results differ in predictable ways. Also, in the case of Knowledge Overlapping Seminars, when one of the basic rules was broken, the consequences were exactly as predicted. Hence, the findings are presented as more general than just a snapshot of a single case.
Reliability means to what extent the results of a research project are consistent with reality. Due to the fact that human systems are never static and that the researcher is a part of the context of the studies, reliability is often a problem for qualitative research within social science. Merriam proposes three techniques for ensuring reliability, see Table 5.
Table 5. Techniques for ensuring reliability. (Adapted from Merriam, 1988)
Technique Description by Merriam Usage in this project
Investigator’s position Clarifying the researcher’s assumptions and theoretical orientation.
Used extensively
Triangulation Use of more researchers or more information sources.
Used partly
Audit trail The researcher gives a thorough description of the design of the study. Then another researcher replicates the study.
Not used
As mentioned above (Section 2.2) it is very important, especially for a ‘practitioner action researcher’, to show credibility in order to secure the reliability of the research results. This is done by displaying the researcher’s assumptions and motives. This can only be done in two ways: ‘Investigator’s position’ and ‘Triangulation’. The third technique given by Merriam above, ‘Audit trail’ is – for obvious reasons – absolutely impossible when doing action research. An action research path cannot be fully replicated.
In clarifying the ‘Investigator’s position’ the researcher describes what he/she did and why. Any personal motives should be presented as honestly and truthfully as possible. I really do not think there is one single committed researcher without any personal motives. Yet this is normally not something ‘normal’ researchers present in their theses.
The best way, from my point of view, to secure the reliability of results presented in the papers and in the thesis is to use ‘Triangulation’. In my research, triangulation was used through co-operation with other researchers – not action researchers – when conducting the research and

Six Sigma Management - Action research with some contributions to theories and methods - Peter Cronemyr
37
writing the papers. Most papers have been co-authored by other researchers, and in the ones that I am the sole author of, I have used other researchers as reviewers and advisors.
2.3. Research techniques of the specific papers
As the previous sections dealt with research methodology in general, in this section I will describe the research techniques used in the specific papers in a little more detail. Note that this section covers only methodological aspects of the papers. History, purpose and findings of the papers are presented in Chapter 4: Summary of appended papers.
2.3.1. Appendix A: “Six Sigma Management at Siemens”
2.3.1.1. Paper style
Appendix A is titled “Six Sigma Management at Siemens – A personal case story”. It is a very personal story describing a longitudinal case study of an action research project. While the other appended papers are designed to fulfil the requirements of scientific journals, this appendix is not. Many different topics are dealt with, often in chronological order. Each of these may very well be the seed that could germinate into a ‘traditional’ research paper.
2.3.1.2. The action research process
The overall goal of the client, i.e. the company now called Siemens, was to implement Six Sigma as a process improvement methodology. I have been a practitioner with the task of supporting this programme in one way or another since 2001. During this time I had several different positions, first Process Developer, then Six Sigma Black Belt, Business Excellence Manager, and finally Six Sigma Programme Manager. Since 2000, when I presented my Licentiate thesis, I have had connections with Quality Sciences Professor Bo Bergman and some of his Ph.D. students at Chalmers University of Technology. In 2005 I joined as an industrial Ph.D. student again. That was when I started to document the process as an action research project.
I return to the words of Gunnela Westlander: “It must be stressed that action research in the context of OD is a much more pragmatic business than action research applied by researcher.” (Westlander, 2006, p.53). In hindsight and using Westlander’s words, I would say this research project started as action research in the context of OD and later shifted to become more action research applied by a researcher.
As the story tells, when new knowledge was gained along the way, several corrections were made to the path. In the beginning there was no intention of making any generalisable results. That was added in the writing phase.
2.3.1.3. Longitudinal case study
The paper presents a thorough description of a change process that has taken place over a period of many years. The story starts some ten years ago and the detailed description spans over approximately four years.

Six Sigma Management - Action research with some contributions to theories and methods - Peter Cronemyr
38
When writing the story, the following information sources were used:
• Agendas and Minutes of meetings
• E-mails and Calendar appointments
• Presentation files
• Reports and Memos
• My personal memory
• Memory of colleagues (Six Sigma Black Belts, managers, process owners, project participants)
I did not conduct any interviews for this paper. The ‘memories of colleagues’ were used in two ways: i) If I could not remember clearly or if something in an information source was unclear, I called someone and asked “Do you remember how we did this?” and ii) Several colleagues checked the story, see below.
I have tried to maintain chronological order as much as possible but sometimes a specific issue spanning over a longer time period has been kept together to improve the readability of the text.
2.3.1.4. Selection of success factors
The success factors identified are the results of the so-called analytic generalisation. They were identified by me after the main story had been written. I compared ‘failures’ and ‘crises’ with the (mostly) more successful results after corrections had been made. Some success factors are based on comparisons of how we in Service implemented Six Sigma differently from other divisions of Siemens in Finspong and abroad. I also checked the list of success factors given in the literature study to see if I had ‘forgotten’ something. Some success factors were added in this way.
By using this procedure fourteen success factors were selected as critical for implementing Six Sigma at Siemens. These were then compared to what had previously been given in the literature. The success factors were divided into three groups depending on their occurrence (according to what I had found) in the literature: high, medium or low occurrence in the literature.
The conclusion that the success factors that were identified that had only a low occurrence in the literature were indeed the most central ones in my study implied that this research project really served a research purpose and that new knowledge had been presented.
2.3.1.5. Validity and Reliability
The complete story as well as the conclusions and the success factors identified have been checked by several colleagues that participated in the process. Except for parts that were a bit unclear and had to be made clearer, there were no real suggestions for changing the story. After reading the story, several persons said “The story is correct but I had forgotten that we

Six Sigma Management - Action research with some contributions to theories and methods - Peter Cronemyr
39
did all that. Now I remember it all!”. So, by letting them check the story, the results became more explicit and probably contributed to a common mental model.
The story has also been checked by my scientific advisors for weak parts and “questionable formulations”. This contributed to improving the quality and making it a more ‘scientific’ story.
2.3.2. Appendix B: “Selection of Six Sigma projects based on customer feedback – The idea”
2.3.2.1. Paper style
The paper in appendix B entitled “Use Customer Feedback To Choose Six Sigma Projects”, which was co-authored by Anders Fundin at Chalmers and myself, was published in Six Sigma Forum Magazine – not really a scientific journal but a management journal. The paper is rather “short”.
It is a conceptual paper, presenting a new idea. At the time of its writing we had no real results.
2.3.2.2. Research process
Anders Fundin was doing research on how to use ‘the voice of the customer’ – especially dissatisfied customers – in the development of new products. Professor Bo Bergman knew I was doing a Six Sigma project at Alstom Power with the purpose of finding root causes to re-occurring customer problems, so he brought us together.
The development of the application, which was called PIS (Process Improvement System), was conducted as a Six Sigma project. As a Black Belt I was managing the project, which included personnel from the gas turbine development department. At the time that the paper was being written, the project was in the Improvement phase (see Section 3.1 Six Sigma). There was plenty of documentation for the project: project charter, progress reports, minutes of meetings, presentation files, and the application itself developed in Lotus Notes software.
After discussing our common interests we decided to write a paper. I described what I had done in my Six Sigma project and we discussed how it fitted into Anders’ research.
After describing the idea and the application that was developed, some lessons learned are presented. These were derived by Anders and me in discussions where I was ‘informally’ interviewed. In his research project, Anders also conducted formal interviews with other people at Alstom Power concerned with customer feedback and new product development. These interviews were only partly related to this paper.
This was very early in the introduction of Six Sigma at Alstom Power. My ‘action research project’ had just started, even though at that time I was not thinking in terms of action research. Still, in hindsight, it is obvious that turning PIS into a scientific paper revealed some things, i.e. the lessons learned, that were fed back into the Six Sigma project. This helped to develop training material for the personnel.

Six Sigma Management - Action research with some contributions to theories and methods - Peter Cronemyr
40
2.3.2.3. Validity and Reliability
The paper was reviewed by managers, by members of my Six Sigma team and by Professor Bergman. This led to minor changes.
By interviewing not only myself but also other people at Alstom Power, Anders could ‘check the consistency’ of what I was saying and the views of others. This increased the validity and the reliability.
2.3.3. Appendix C: “Selection of Six Sigma projects based on customer feedback – Application”
2.3.3.1. Paper style
The paper in appendix C entitled “Changing from a product to a process perspective for Service Improvements in Manufacturing Companies”, which was co-authored by myself and Lars Witell at Karlstad University, has been submitted for publication in a scientific journal.
In the paper the idea presented in the previous paper is tested in a real application at the Service Department.
2.3.3.2. Research process
Some years had passed since PIS was developed and I was now working at the Service Department with the Six Sigma programme. As described in “Six Sigma at Siemens” (appendix A) we had developed processes and appointed process owners. I thought it was time to resurrect PIS, this time in Service. I presented the concept to the management team which approved a starting up PIS within the frame of the process management work conducted by process owners.
I met each process owner one by one. Each meeting started with an introduction to the ideas and purpose of PIS (using training material developed in my Black Belt project) and the real application in Lotus Notes was then started at the process owner’s computer. There were already 336 process fault reports in the system associated with the Service processes. These were investigated and grouped or sent on to other processes. Already existing and new Six Sigma projects were defined from the process fault report groups by the process owners and me together.
At this stage, in 2006, one of my scientific advisors, Lars Witell, and I decided we would write a paper on how PIS had been used within Service. Lars is an associate professor at the Service Research Center at Karlstad University, conducting research on service management and quality.
We met and discussed what had been done at Siemens and how that could be used in other Service Improvement activities. At this time I was more aware of action research methodology (than in the previous paper) and, as we discussed, new knowledge became evident – or revealed itself – that was fed back to the Service department. This corrected our way of
Six Sigma Management - Action research with some contributions to theories and methods - Peter Cronemyr
41
selecting Six Sigma projects to become more customer focused. Furthermore, the importance of having a process perspective was emphasised even more.
2.3.3.3. Quantitative analysis
This is the only of the appended papers where I use some quantitative analysis – which I normally often use in Six Sigma projects. I used the Chi square hypothesis test (for use on attribute data) on two different sets of data.
The ratio of reports classified as High/Medium/Low by product fault analysers was compared to the classifications made by the process owners. The classifications were coded in the process fault reports by product fault analysers and process owners, and were easily accessed in the PIS system. The hypothesis testing was done by me (null hypothesis: no differences in classifications).
Furthermore, the focus areas for improvement projects, i.e. Six Sigma projects, that were started before analysis of PIS reports were compared to those started after – as a result of – analysis of PIS reports. The classifications of projects into one or more of four different focus areas were made by me. The hypothesis testing was also done by me (null hypothesis: no differences in focus areas).
2.3.3.4. Validity and Reliability
The data used for quantitative analysis of report classifications were extracted from the PIS system. These classifications were not influenced by the research process. Hence these data have high reliability.
The data used for quantitative analysis of focus areas were coded by me on the basis of my own knowledge about the projects. The coding of the Six Sigma projects that had been started before PIS analysis had already been done before the writing of this paper. It was included in a presentation file, developed by me, to be presented by the Service division manager at a gas turbine user’s conference. However, the coding of new projects, was done later. The codings were checked by Black Belt colleagues. Hence, these data are somewhat less reliable than the report classifications, but the conclusions drawn from the analysis have been checked by the process owners, who agree with them. This increases the reliability.
An earlier version of the paper was reviewed by Black Belt colleagues, process owner and, Professor Bergman, thus increasing the validity.
2.3.4. Appendix D: “Selection of Six Sigma roadmap based on process state”
2.3.4.1. Paper style
The paper in appendix D entitled “DMAIC and DMADV – Differences, similarities, and synergies”, written by me, has been published in the scientific journal International Journal of Six Sigma and Competitive Advantage.
Six Sigma Management - Action research with some contributions to theories and methods - Peter Cronemyr
42
It is a conceptual paper, presenting a new Six Sigma roadmap to be used in specific situations.
2.3.4.2. Research process
This was very much based on my own experiences of running and coaching Six Sigma projects, but I ‘knew’ from many discussions that Black Belt colleagues had the same problems. The problem was that ‘by the book’ Six Sigma often did not work when improving ‘bad’ processes.
The idea of Wheeler’s process states (Wheeler, 2000) came from my trainer when I attended Black Belt training in 2001. I had made a picture on a flip chart that I kept and often showed to people when we discussed these problems.
The new roadmap – DMADC – was developed conceptually by me and was then tested in two Black Belt projects run by other Black Belts in Service and coached by me. Some of the details of the roadmap were changed along the way, once again using the action research methodology.
2.3.4.3. Validity and Reliability
I was the sole author of the paper but it was reviewed ‘theoretically’ by my colleagues at Chalmers and ‘practically’ by my colleagues at Siemens, especially those who had tried out – and improved – the new roadmap.
2.3.5. Appendix E: “Knowledge Overlapping Seminars – KOS”
2.3.5.1. Paper style
The paper in appendix E entitled “Knowledge Overlapping Seminars – KOS. Design and Applications.”, co-authored by myself and Christina Mauléon at Chalmers, has been submitted for publication in a scientific journal.
It is a comprehensive research paper that presents the design and two applications of a new method called Knowledge Overlapping Seminars. It has been revised by a professional editor.
2.3.5.2. Research process
I first got the idea that would later evolve into Knowledge Overlapping Seminars when I worked as an engineer at Saab Aerospace in 1984. It was based on my experiences from misunderstandings between people in product development teams. I ‘invented’ a type of seminar (see ‘Summary of appended papers’ for more detail) by combining my own experiences with ideas of colleagues at the Gas Turbine R&D Department about how to reveal misunderstandings. I later had the opportunity to try out KOS in a product development team at ABB STAL – now called Siemens. The results gathered from questionnaires and interviews with the participating persons were presented in my Licentiate thesis (Cronemyr, 2000:a).
When I re-started my research studies in 2005 I wanted to use KOS again, but now in a new setting, a Six Sigma project. I also wanted to make KOS ‘more scientific’, i.e. to connect my
Six Sigma Management - Action research with some contributions to theories and methods - Peter Cronemyr
43
ideas of KOS to more theoretical research on misunderstandings. Christina Mauléon at Chalmers University had the theoretical knowledge I lacked. Together we developed KOS further and a new application in a Six Sigma project was conducted and evaluated using questionnaires and interviews.
Once again, this is a typical example of ‘practitioner action research’. An initial idea, ‘how to detect and avoid misunderstandings’, based on first-hand experience, is developed into a new theory and a new method. When one of the rules defined by the method was broken, the consequences were exactly those predicted by the theory.
2.3.5.3. Questionnaires and Interviews
An initial meeting and six seminars were carried out in each of the two applications. Each seminar lasted between two and three hours. All meetings/seminars were documented by my taking notes and, at some of the meetings in the second application, by Christina. Summaries of the discussions are given in the paper.
The attitudes and opinions of the participants were explored using questionnaires and interviews. Westlander (2000) compiled four types of ‘question asking’, see Table 6. In the evaluation of KOS, I used questionnaires (type D) and semi-structured personal interviews (type B).
Questionnaires (type D in Table 6) were handed out before each seminar, after each seminar and (in the first application only) one month after the seminars.
The answers to items in the questionnaires were ‘semi-quantitatively’ analysed (because of the small sample sizes no real quantitative analyses could be made), i.e. mostly descriptive statistics were used. Answers to questions about attitudes given before and after the seminars were compared with the aim of identifying changes in the attendees’ attitudes towards other domains that were provoked by KOS.
Furthermore, semi-structured interviews (type B in Table 6) were carried out approximately one month after the seminars. The changes in attitudes, identified in analyses of the questionnaires, were compared to the person’s own opinions, given in the interviews, concerning whether or not there had been a change.
In the first application, 12 persons were interviewed, each for approximately half an hour. Answers were documented on paper by me. After the interviews, similar answers were grouped together and conclusions were drawn.
In the second application, seven persons were interviewed, each for approximately an hour, by me and (in some interviews) Christina. Interviews were recorded and transcribed by me and Christina. The answers were then coded, similar answers were grouped together, and conclusions were drawn.

Six Sigma Management - Action research with some contributions to theories and methods - Peter Cronemyr
44
Table 6. Types of question asking (from Westlander, 2000). (* types used in this project)
Type Study method Role of the interviewee
Role of the interviewer
Interview aids
A Unstructured personal interview
Decides what shall be discussed and to what extent.
Wants to investigate the individual’s own view of the existential situation.
Notes taken freely during/after the interview, possibly following a predetermined frame; tape-recording if permitted by interviewee.
B * Semi-structured personal interview
Has the freedom to specify what shall be taken up within the frame of each topic (conversation theme).
Wants to investigate the individual’s own view of conditions within each subject area.
Interview guide + notes taken freely during/after the interview; tape-recording if permitted by interviewee.
C Structured interview (conversation led in detail by interviewer)
Tied to the questions posed by the interviewer.
Wants to assess and compare responses of a number of specific questions set up in advance.
Interview form
D * Printed questionnaire (that may follow the pattern of either B or C, but normally type C)
Tied to the questions posed by the interviewer.
Wants to assess and compare responses of a number of specific questions set up in advance.
Questionnaire
2.3.5.4. Validity and Reliability
The questionnaires and interview guide used in the first application were developed as an assignment in Professor Emerita Gunnela Westlander’s post graduate course on Qualitative Research Methodology in 1999. However, before using them, test versions of questionnaires, the interview guide, the presentation material and the analysis model were developed and reviewed by Professor Westlander and personnel at the company for readability.
In the second application in 2006, Christina Mauléon and I designed the questionnaires and interview guide together. They were checked by Professor Bo Bergman. Presentation material developed for the first application was used.

Six Sigma Management - Action research with some contributions to theories and methods - Peter Cronemyr
45
To improve the reliability of our research, all interviewees checked their own interview answers. The paper was reviewed by the Black Belt that managed the Six Sigma team in the second application.
The question of external validity remains, i.e. transferability or generalisability. That question – even though KOS was tested in two different applications – can not be given a positive answer. The reason is that I was present in all 12 seminars in the two applications. KOS has never been conducted without me being present. Therefore, it can not be proved that KOS will work in ‘any’ project. That still needs to be tested and evaluated – by someone else. Still, as generalisability is not the main purpose of action research, the outcomes of the two applications were very successful for the ‘clients’, i.e. the product development team and the Six Sigma team. In this case, the technique of ‘reader or user generalisability’ must be used.
2.3.6. Appendix F: “Process improvement simulations”
2.3.6.1. Paper style
The paper in appendix F entitled “A Decision Support Tool for Predicting the Impact of Development Process Improvements”, which was co-authored by myself, Anna Öhrwall-Rönnbäck at Linköping University and Professor Steven Eppinger at Sloan School of Management, MIT, has been published in the Journal of Engineering Design.
It is a conceptual paper and a case study, presenting a new tool for simulating improvements to iterative processes.
2.3.6.2. Research process
At the time, in 1998, I was managing a process development team whose task was to map and develop the Gas Turbine Blade Development Process. In a course assignment for a graduate course on DSM conducted by Professor Eppinger, I used the process maps that we had already created in my project and converted the maps into DSM matrices (see ‘Summary of appended papers’ for more detail). In order to be able to simulate improvements to the process, I needed numbers for ‘task times’ and ‘re-work fractions’. These were provided by the team members. The work was divided between domain experts, i.e. stress engineers, aerodynamic engineers and mechanical designers.
The simulations, using numbers given by the team, were made by me using Matlab software. Several suggestions for improvements were simulated. Modified numbers had to be estimated for each potential improvement. That was done jointly by the domain experts and me.
Simulation results were discussed in the team to decide whether to introduce the improvement ‘in real life’ or not. One major improvement was finally decided upon – and approved by senior management – and was performed. The expected results were accomplished.
In another application at another company, Saab Aerospace, Anna Öhrwall-Rönnbäck used the simulation method in a similar way. Good results were accomplished in that application as well.

Six Sigma Management - Action research with some contributions to theories and methods - Peter Cronemyr
46
2.3.6.3. Validity and Reliability
Scientifically the method is based on matrix algebra and eigenvector analysis. That is ‘the easy part’. The assumptions about when the method can be used are harder. The assumption of fully parallel activities corresponds to a highly iterative process, e.g. a product development process, but not to sequential processes. In my case, the process that was analysed was highly iterative; hence the method should be valid. In the case of the Saab process, it was somewhat more sequential but it worked reasonable well anyway.
The numbers provided by the team for the simulations were discussed among experts within each domain before being decided upon. There was no ‘control group’ providing other numbers to make comparisons with. This may look like a weak link but, since the method is only used to calculate the impact of relative changes to the numbers, not absolute numbers, the sensibility to ‘small errors’ should be low.
The generalisability of the method has been strengthened by the facts that we tested it in two different companies and that it has been used by others after the publication of the paper, see Wright (2004).
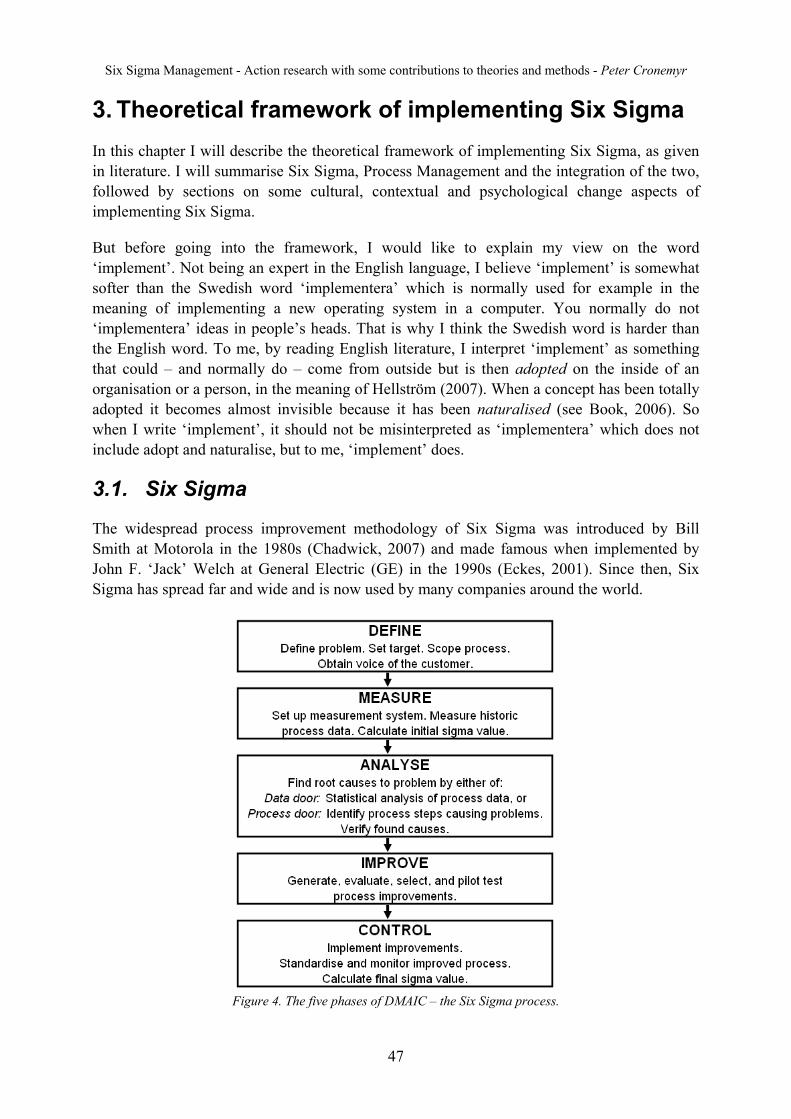
Six Sigma Management - Action research with some contributions to theories and methods - Peter Cronemyr
47
3. Theoretical framework of implementing Six Sigma In this chapter I will describe the theoretical framework of implementing Six Sigma, as given in literature. I will summarise Six Sigma, Process Management and the integration of the two, followed by sections on some cultural, contextual and psychological change aspects of implementing Six Sigma.
But before going into the framework, I would like to explain my view on the word ‘implement’. Not being an expert in the English language, I believe ‘implement’ is somewhat softer than the Swedish word ‘implementera’ which is normally used for example in the meaning of implementing a new operating system in a computer. You normally do not ‘implementera’ ideas in people’s heads. That is why I think the Swedish word is harder than the English word. To me, by reading English literature, I interpret ‘implement’ as something that could – and normally do – come from outside but is then adopted on the inside of an organisation or a person, in the meaning of Hellström (2007). When a concept has been totally adopted it becomes almost invisible because it has been naturalised (see Book, 2006). So when I write ‘implement’, it should not be misinterpreted as ‘implementera’ which does not include adopt and naturalise, but to me, ‘implement’ does.
3.1. Six Sigma
The widespread process improvement methodology of Six Sigma was introduced by Bill Smith at Motorola in the 1980s (Chadwick, 2007) and made famous when implemented by John F. ‘Jack’ Welch at General Electric (GE) in the 1990s (Eckes, 2001). Since then, Six Sigma has spread far and wide and is now used by many companies around the world.
Figure 4. The five phases of DMAIC – the Six Sigma process.

Six Sigma Management - Action research with some contributions to theories and methods - Peter Cronemyr
48
Six Sigma is in essence a structured way of solving problems in an existing process based on analysis of real process data, i.e. facts (see e.g. Magnusson, Kroslid and Bergman, 2003). Motorola called the procedure MAIC, which at GE became DMAIC, for Define, Measure, Analyse, Improve and Control; for the phases of the Six Sigma process, see Figure 4. One could argue that DMAIC is nothing new but a set of long well known tools used within Quality Management but, on the other hand, without Six Sigma these tools would probably still be in the possession of a limited number of people. What makes DMAIC into something new is rather the structuring of the individual tools to the process itself, which is basically the Shewhart cycle (Shewhart, 1931, 1939), also known as the PDSA cycle for Plan, Do, Study, Act (Bergman and Klefsjö, 2003).
Six Sigma is often referred to as a ‘statistical method’ (i.e. a quantitative method), because decisions are made on the basis of statistical analysis of quantitative data. That is only one part of the truth. Another part that should not be forgotten – especially in Six Sigma training – is that, without qualitative methods, Six Sigma does not work. The alternate use of quantitative and qualitative methods in the DMAIC process is described below.
The Define phase and the beginning of the Measure phase are mostly qualitative. A problem to be solved needs to be formulated from people’s experiences. Sometimes quantitative data from process evaluations are used. The rest of the Measure phase and the beginning of the Analyse phase are mostly quantitative. It is here where the statistical analysis takes place, but the statistical analysis does not by itself reveal the underlying root causes. It rather indicates where to look deeper into the problem. If, e.g., a correlation between two variables has been found, the Six Sigma team still needs to discuss, by using e.g. an Ishikawa diagram, what the possible underlying root causes may be, and how these could be avoided. Hence, the rest of the Analyse phase and the Improve phase are mostly qualitative, even though causation – not only correlation – should always be quantitatively verified before starting improvements. Finally, the Control phase is mostly quantitative since the improved process is measured and monitored.
To be a Black or Green Belt, i.e. a Six Sigma project leader, you must master both the quantitative and the qualitative approaches, and use a combination of these. In this respect it is very similar to pragmatic research. The use of qualitative methods to find the root causes in the Analyse phase is very similar to what the pragmatist John Dewey wrote. “Suggestion is the very heart of inference; it involves going from what is present to something absent. Hence, it is more or less speculative, adventurous. Since inference goes beyond what is actually present, it involves a leap, a jump, the propriety of which cannot be absolutely warranted in advance, no matter what precautions be taken.” (Dewey, 1910). One can see the influences of Dewey, which via C. I. Lewis inspired Shewhart and Deming to develop the PDSA cycle. It later evolved into the Six Sigma process DMAIC.
Originally, as developed by Motorola, the Six Sigma methodology was mainly based on statistical analysis with the aim of reducing variation in process outputs, typically to a ‘process sigma’ of six, corresponding to a defect level of 3.4 defects per one million opportunities. (A ‘process sigma’ of six corresponds to 4.5 standard deviations due to Motorola’s introduction of ‘the 1.5 sigma shift’ for long term variation of the mean.) Still today, emphasis is put on the
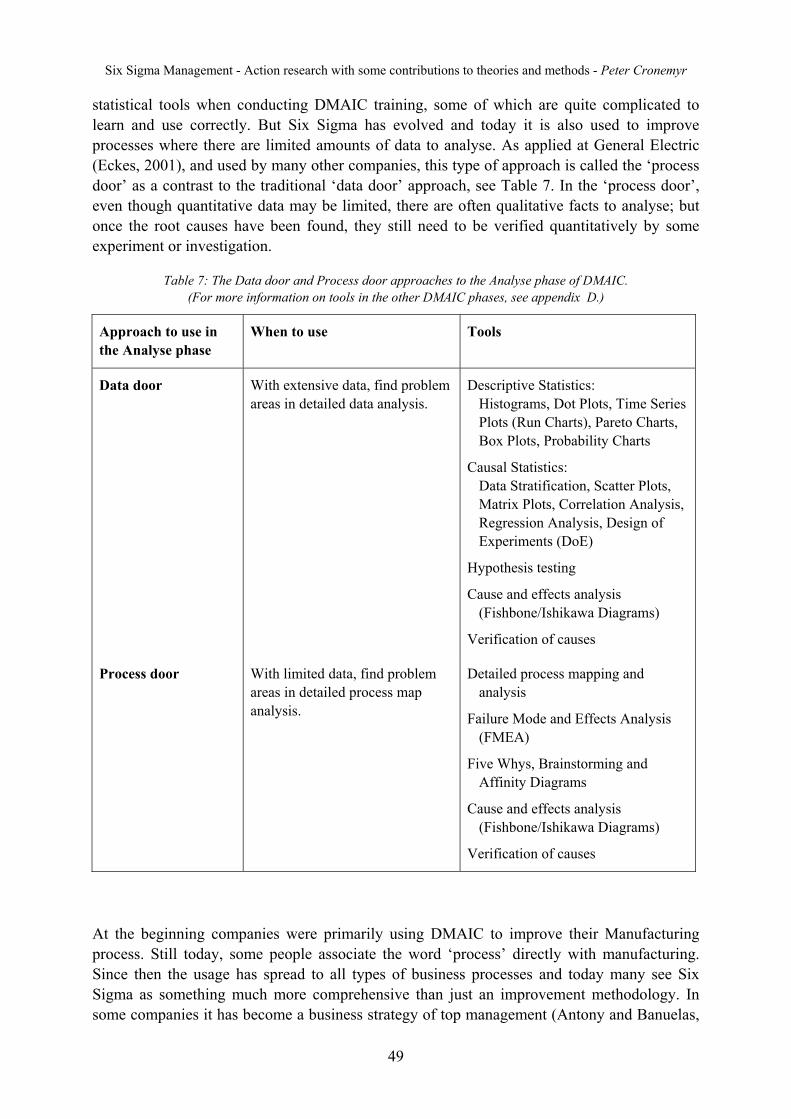
Six Sigma Management - Action research with some contributions to theories and methods - Peter Cronemyr
49
statistical tools when conducting DMAIC training, some of which are quite complicated to learn and use correctly. But Six Sigma has evolved and today it is also used to improve processes where there are limited amounts of data to analyse. As applied at General Electric (Eckes, 2001), and used by many other companies, this type of approach is called the ‘process door’ as a contrast to the traditional ‘data door’ approach, see Table 7. In the ‘process door’, even though quantitative data may be limited, there are often qualitative facts to analyse; but once the root causes have been found, they still need to be verified quantitatively by some experiment or investigation.
Table 7: The Data door and Process door approaches to the Analyse phase of DMAIC. (For more information on tools in the other DMAIC phases, see appendix D.)
Approach to use in the Analyse phase
When to use Tools
Data door With extensive data, find problem areas in detailed data analysis.
Descriptive Statistics: Histograms, Dot Plots, Time Series Plots (Run Charts), Pareto Charts, Box Plots, Probability Charts
Causal Statistics: Data Stratification, Scatter Plots, Matrix Plots, Correlation Analysis, Regression Analysis, Design of Experiments (DoE)
Hypothesis testing
Cause and effects analysis (Fishbone/Ishikawa Diagrams)
Verification of causes
Process door With limited data, find problem areas in detailed process map analysis.
Detailed process mapping and analysis
Failure Mode and Effects Analysis (FMEA)
Five Whys, Brainstorming and Affinity Diagrams
Cause and effects analysis (Fishbone/Ishikawa Diagrams)
Verification of causes
At the beginning companies were primarily using DMAIC to improve their Manufacturing process. Still today, some people associate the word ‘process’ directly with manufacturing. Since then the usage has spread to all types of business processes and today many see Six Sigma as something much more comprehensive than just an improvement methodology. In some companies it has become a business strategy of top management (Antony and Banuelas,
Six Sigma Management - Action research with some contributions to theories and methods - Peter Cronemyr
50
2002). Even so, the link between DMAIC projects on the floor and the Six Sigma programs driven by top management is not always obvious, neither in the literature nor in business. One other area that still needs development is how to identify and select Six Sigma projects.
3.2. Success factors in implementing Six Sigma
The success factors in the introduction and implementation of a Six Sigma program in a company have been investigated by several authors. In a literature review Schön (2006) found success factors, suggested by Henderson and Evans (2000), Goldstein (2001), Pande et. al. (2000), Antony and Banuelas (2002) and Sandholm and Sörqvist (2002). Schön compared the suggested success factors and found extensive overlap. Fourteen success factors were selected. Furthermore, the importance of the fourteen suggested success factors was ranked in a study on how Six Sigma had been implemented in three major Swedish companies: Volvo Cars, Ericsson and SKF. Schön’s ranking was based on how frequently the success factors were mentioned by the respondents at the companies.
The six success factors that were found to be most important were (Schön, 2006):
• Management commitment
• Focus on Training
• Project selection
• Strategy for implementation
• Linking Six Sigma to business strategy
• Focus on results
The other eight success factors were: (Schön, 2006):
• Linking Six Sigma to the customer, human resources and suppliers
• Organisational infrastructure
• Early communication to employees
• Understanding Six Sigma methodology, tools and techniques
• Investing in adequate resources
• A uniform language and terminology
• Follow-up and communication of success stories
• Developing a distinctive path to Six Sigma

Six Sigma Management - Action research with some contributions to theories and methods - Peter Cronemyr
51
In addition to these, the people at the studied companies also suggested the following success factors that Schön had not found in the literature (Schön, 2006):
• Involvement of middle management
• Creation of qualitative goals such as customer value
• Knowledge and competence
• Ability to learn from history
In their book “Leading Six Sigma” Snee and Hoerl (2002) compare very successful and less successful case studies of Six Sigma implementations and identify the following attributes as characteristics of the successful companies:
• Committed leadership
• Use of top talent
• Supporting infrastructure
As a contrast, the less successful companies had only ‘supportive’ leadership that did not really believe in Six Sigma; whoever was available was appointed Black Belt; and there was no supportive infrastructure, i.e. no formal project selection process, no formal project review process, only part time resources, and no integration with the companies’ financial systems (Snee and Hoerl, 2002, p. 43).
In an explorative case study Sören Karlsson and Pia Sandvik-Wiklund (1997) investigated critical aspects of ‘quality method’ implementation. The quality methods implemented in the study were Quality Awards and Design of Experiments. The results are interesting and may also be valid when implementing the ‘quality method’ Six Sigma. They define four different types of uncertainty:
• Company uncertainty: Uncertainty about the company’s situation.
• User uncertainty: Uncertainty about the method user’s situation.
• Process uncertainty: Uncertainty about the process where the quality method is applied.
• Method uncertainty: Uncertainty in ‘quality understanding’, i.e. understanding of e.g. variation and mental models.
While company uncertainty, e.g. a threat to the company, may be a motivation to implement the quality method, user uncertainty was not found to have any influence on the implementation. However, for a high output of implementing the quality method, low process uncertainty is required (Karlsson and Sandvik-Wiklund, 1997. p.63), i.e. there should be a high degree of knowledge and understanding of the process to be improved. Finally, as they found, “for a successful quality method implementation, a formula is not enough. The quality method must either in itself have a certain degree of uncertainty, or the uncertainty must be created. […] A balanced combination of method uncertainty and formula supports both

Six Sigma Management - Action research with some contributions to theories and methods - Peter Cronemyr
52
individual and organizational learning.” (Karlsson and Sandvik-Wiklund, 1997, p.64). My interpretation of this is, for an implementation to be successful, the method must be adaptable to the individuals’ and the organisation’s needs, hence supporting individual and organisational learning. A method that is too rigid, or ‘not uncertain enough’, will not fit in existing mental models.
In a later paper Pia Sandvik-Wiklund, together with Håkan Wiklund, continued the thread from the previous paper by investigating the Six Sigma method from an organisational learning perspective (Wiklund and Sandvik-Wiklund, 2002). They argued that, for Six Sigma to be successful, DMAIC should be complemented by ‘Soft Sigma’, which they define as “all aspects that deal with learning and implementation of Six Sigma, i.e. knowledge in behaviour science. The overall goal [is to] increase organizational learning […] by having Black Belts and Master Black Belts that have more of Deming’s Profound Knowledge, thus of knowledge and psychology.” (Wiklund and Sandvik-Wiklund, 2002, pp. 237-238). Black Belts are ‘internal change management consultants’ and hence need ‘softer’ training in addition to the ‘harder’ training in statistics normally given in Black Belt training. This must be regarded as a success factor, as given by Wiklund and Sandvik-Wiklund.
3.3. Process Management
Focusing on processes was promoted by Shewhart (1931, 1939) as a way to achieve quality and satisfied customers. So, what is a process? There are many definitions but most used within the quality context are similar to the one given by Bergman and Klefsjö, which is the one I choose to use:
• “A process is a network of activities that are repeated in time, whose objective is to create value to external or internal customers.” (Bergman and Klefsjö, 2003, p.426)
The boundaries of a process are illustrated by the model in Figure 5, sometimes called SIPOC (Supplier, Input, Process, Output, Customer). It shows the importance of the relations with suppliers and customers, something that is not equally obvious by looking at a traditional organisation chart for an organisation without defined processes.
Figure 5. The SIPOC model (based on a model by Rentzhog (1998))
Six Sigma Management - Action research with some contributions to theories and methods - Peter Cronemyr
53
The importance of adopting a process view and continuously improving processes has led to the creation of the Process Management philosophy. The idea was first developed at IBM (Bergman and Klefsjö, 2003). The ISO 9001 standard requires an organisation to apply a process approach to three types of actions: management, product and/or service realisation, and support. Process owners should be appointed who have a defined responsibility and authority to implement, maintain and improve the processes. The fundamentals of managing processes are (Westcott, 2007):
• Identifying the primary processes of the organisation
• Naming the process owners
• Mapping the flow of each process
• Specifying metrics of each process
• Determining each process’ interaction with other processes
• Assessing each process’ effect on the organisations strategic goal
• Having an improvement plan for each process aiming at fulfilling the strategic goals
Documentation of processes should include process objectives, process map/flow chart, procedures and work instructions, quality plans, measurements and audit results, and information on ongoing and finished improvements.
Goals and measurements of an organisation’s processes are often gathered and presented in a Balanced Scorecard (Kaplan and Norton, 1992).
Process Management has been a popular topic in the management literature for at least two decades. Hellström (2006) analysed the conceptions of Process Management in the management literature and identified two different descriptions: ‘TQM’ and ‘BPR’. “Some describe Process Management as one of the core principles in conventional Total Quality Management (TQM), aiming at long-term continuous improvements of the existing process structure. Others associate it with Business Process Reengineering (BPR), i.e. a more radical approach to improvements [...] The different natures of TQM and BPR can be explained by differences in origin. [...] Quality advocates promote well documented processes, defined control points, measurements and continuous monitoring. Reengineering advocates, on the other hand, with a tradition from information technology, stress the importance of redesign rather than control. However, there are also great similarities in the process perspective between TQM and BPR. They both advocate process mapping to identify the processes in the organisation.” (Hellström, 2006).
By developing and continuously improving processes an organisation can reach different maturity levels, as given by the CMM (Capability Maturity Model) in Figure 6. The last level is called ‘Optimising process’. This vocabulary is normally used in the BPR context. In the TQM language ‘optimising’ should be read as ‘continuously improved’.

Six Sigma Management - Action research with some contributions to theories and methods - Peter Cronemyr
54
Figure 6. The Capability Maturity Model (developed by the Software Engineering Institute,
from the original ideas by Philip Crosby, described in Paulk et al. (1993))
According to Russ Westcott, the outcomes of process management might include customer satisfaction and retention, profitability, environmental and social actions, and ethical and legal responsibilities. A favourable effect not only sustains an organisation but also fuels its growth, prosperity and contribution to society (Westcott, 2007).
Daly, Dowdle, McCarty and Stevens (2004) expand Process Management into something larger and more systematic, called Process Based Management – PBM. They argue “PBM goes beyond managing only a process or managing processes as if they were functions. PBM is dedicated to bringing what often appear to be unrelated activities, functions, processes, and lines of business together to work with a focused mindset towards achieving the organisation’s strategic goals.” (Daly et al., 2004). Furthermore, Todd Scaletta (2006) argues that “[process improvement methods, e.g. TQM, BPR, Activity-Based Costing, Lean, and Six Sigma] are often limiting because they tend to examine only individual processes rather than integrating these processes into an examination of the complete system at work within an organisation. Although the process view is critical part of the foundation for an organisation to become PBM oriented, this process view often leads to individual methods and tools competing for resources.” (Scaletta, 2006, p.22). According to Scaletta, there is a need for more integrated improvement, which can be realised by implementing PBM.
3.4. Integration of Six Sigma and Process Management
Magnusson, Kroslid and Bergman (2003) describe the three main deployment approaches for Six Sigma. These are:
• Company-wide strategy
• Improvement programme
• Toolbox
Six Sigma Management - Action research with some contributions to theories and methods - Peter Cronemyr
55
The first is the most ambitious approach. It is a top-down approach driven by the CEO. The second approach is narrower in focus than the first, and the third approach is only to take the raisins from the cake and integrate them into existing improvement methodologies. Strangely enough though, all these approaches are described as deploying Six Sigma ‘in an organisation’, not integrating Six Sigma and Process Management, i.e. it seems that Six Sigma should be run by – committed – managers in the organisation. There is no direct link to the owners of the business processes.
When Hammer and Champy published their ‘BPR manifesto’ in 1993 (Hammer and Champy, 1993), they did not mention how Six Sigma was related to Process Management – by then Six Sigma was still a relatively unknown concept. In 2002, however, Michael Hammer published a paper entitled ‘Process Management and the future of Six Sigma’ (Hammer, 2002). According to Hammer, Six Sigma has its roots in TQM but “Six Sigma should be a part of Process Management, not the other way around” (Hammer, 2002, p. 32). Hence one could interpret Hammer to mean that TQM is a part of BPR, even though he no longer uses the term BPR. Still, the question of how to integrate Six Sigma and Process Management remains.
Snee and Hoerl (2002) also write that Six Sigma has its roots in TQM but Six Sigma goes beyond TQM by the introduction of the DMAIC roadmap. Furthermore, they argue that Six Sigma must fit with other existing quality systems, e.g. a Process Management system based on ISO 9000. “Six Sigma is a methodology for making breakthrough improvements. It was never intended as a system for managing quality in an ongoing manner, nor was it intended to define the proper criteria for world-class quality management. […] You should integrate Six Sigma with existing quality management systems, rather than trying to make Six Sigma something that it is not” (pp. 226-227). Fortunately, they conclude “There are logical linkages between these systems. […] If you modify your ISO 9000 documentation to say what you are doing with Six Sigma, the quality audits and other ISO infrastructure that ensures compliance will also ensure that you continue to “do what you said” about Six Sigma” (p.227).
This agrees with the view of Gregory Watson: “I believe that eventually the ISO 9000 quality management system standard and the Malcolm Baldrige National Quality Award criteria might more explicitly ascribe to a more Six Sigma-focused approach to business improvement” (Watson, 2005, p.321).
Snee and Hoerl (2002) present the following guiding principles for integrating Six Sigma into Process Management systems and processes (pp. 163-164):
1. Focus on key processes
2. Routinely monitor and analyse data from key processes
3. Utilise two types of actions:
o Controlling/adjusting the process to maintain performance
o Making improvements [using Six Sigma] to the process to achieve even higher performance
Six Sigma Management - Action research with some contributions to theories and methods - Peter Cronemyr
56
Bergman and Klefsjö (2003) trace the origins of Process Management back to TQM authorities Shewhart and Juran. They also describe the Process Management methodology used at IBM as the following steps:
1. Organise for improvement
2. Understand the process
3. Observe the process
4. Improve the process continuously
Again, it is in the last step where Six Sigma may be used.
A similar picture is given by Magnusson et al. (2003) describing ‘The 9 Step Business Process Management Model developed by GE’:
1. Develop and agree on process charter and strategic goals
2. Map the process
3. Identify critical-to-quality characteristics
4. Identify process measurements
5. Create Process Management system
6. Develop data collection plan
7. Monitor performance
8. Visualise results
1. Improve process
Once again, it is in the last step where Six Sigma may be used. There seems to be an understanding that one should ‘first measure, then improve if necessary’. In this view, Six Sigma seems to be an ‘extra feature’, but not a ‘central part’, of Process Management, i.e. ‘if the processes are OK, there is no need to run Six Sigma’.
In the on-line paper ‘Can Six Sigma and Business Process Management Co-exist?’, Marvin Wurtzel (2007) claims that they definitively can. “The two strategies are not mutually exclusive, however, and some savvy companies have discovered that combining BPM and Six Sigma can create dramatic results. [...] It is easy to see how powerful it can be to combine the two practices. Their strengths complement each other and create a synergy that instils the entire operation with a focus on quality and performance.” (Wurtzell, 2007). He presents a model where Six Sigma should be used as improvement methodology in the BPM process defined as: Document, Assess, Improve, Manage. Unfortunately, he presents no details on how to do it.
Watson (2005) looks to the future of Six Sigma and argues “a proactive human-focused business environment can be developed only when both the “hard, analytical disciplines” and the “soft, psychological disciplines” merge into a unified approach for managing results
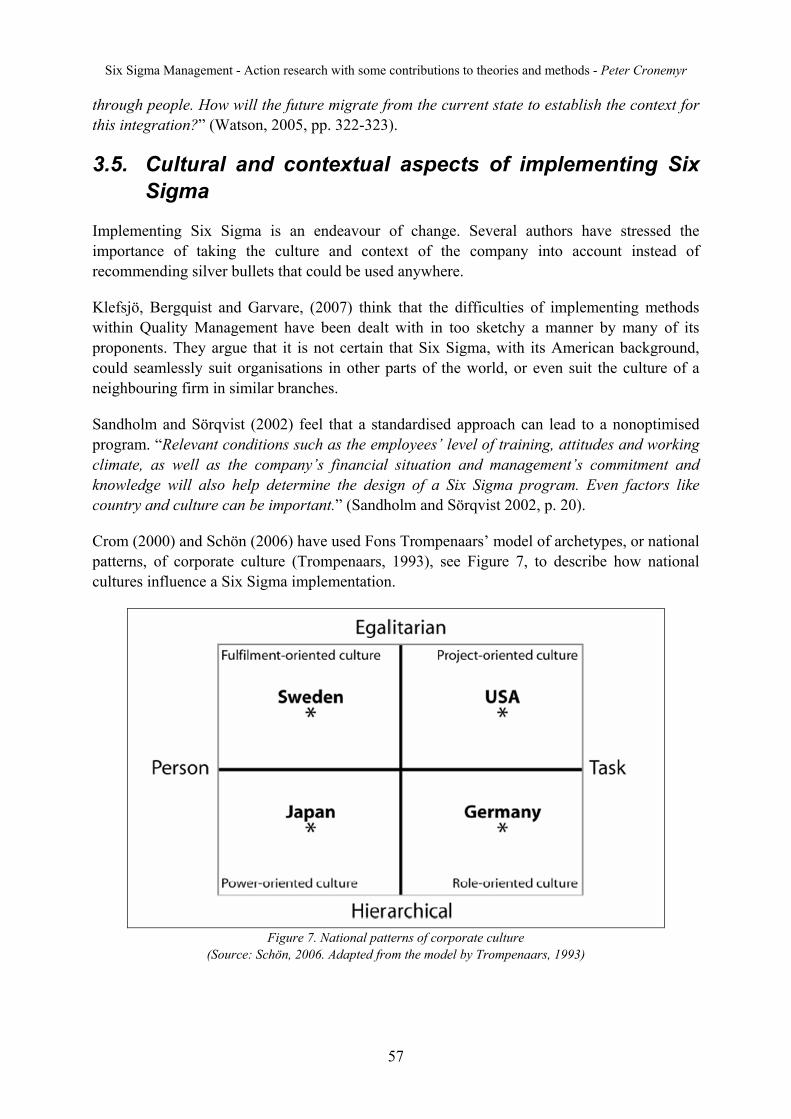
Six Sigma Management - Action research with some contributions to theories and methods - Peter Cronemyr
57
through people. How will the future migrate from the current state to establish the context for this integration?” (Watson, 2005, pp. 322-323).
3.5. Cultural and contextual aspects of implementing Six Sigma
Implementing Six Sigma is an endeavour of change. Several authors have stressed the importance of taking the culture and context of the company into account instead of recommending silver bullets that could be used anywhere.
Klefsjö, Bergquist and Garvare, (2007) think that the difficulties of implementing methods within Quality Management have been dealt with in too sketchy a manner by many of its proponents. They argue that it is not certain that Six Sigma, with its American background, could seamlessly suit organisations in other parts of the world, or even suit the culture of a neighbouring firm in similar branches.
Sandholm and Sörqvist (2002) feel that a standardised approach can lead to a nonoptimised program. “Relevant conditions such as the employees’ level of training, attitudes and working climate, as well as the company’s financial situation and management’s commitment and knowledge will also help determine the design of a Six Sigma program. Even factors like country and culture can be important.” (Sandholm and Sörqvist 2002, p. 20).
Crom (2000) and Schön (2006) have used Fons Trompenaars’ model of archetypes, or national patterns, of corporate culture (Trompenaars, 1993), see Figure 7, to describe how national cultures influence a Six Sigma implementation.
Figure 7. National patterns of corporate culture
(Source: Schön, 2006. Adapted from the model by Trompenaars, 1993)

Six Sigma Management - Action research with some contributions to theories and methods - Peter Cronemyr
58
The model uses two scales’ ‘status’ from egalitarian to hierarchical and ‘orientation’ from person-oriented to task-oriented to separate the four archetypes. These are (counter clockwise from lower left):
• Power-oriented culture – ‘Family’ Description: Family relations with an experienced ‘father’. Work for the good of the group. Individuals are important parts of the family. Examples: Japan, India, Spain.
• Role-oriented culture – ‘Eiffel tower’ Description: Centralised collective effectiveness with a focus on reaching the goals of the business unit. Individuals should not be singled out. Examples: Germany, Netherlands.
• Project-oriented culture – ‘Guided missile’ Description: Everything is aimed at achieving a strategic target, conducted in small project teams with less top management control. Celebrate individuals’ achievements related to the common goal. Examples: USA, UK.
• Fulfilment-oriented culture – ‘Incubator’ Description: The organisation should serve as an incubator for the individuals’ self-fulfilment with minimal hierarchy. As individuals grow, so does the organisation. Examples: Sweden, Norway.
Schön (2006) used the model to classify three major Swedish companies: Ericsson, Volvo Cars and SKF. She found that, while Ericsson had a fulfilment-oriented culture, i.e. a ‘Swedish culture’ according to the model, Volvo Cars (owned by the American company Ford) and SKF had more project-oriented cultures.
Steve Crom (2000) elaborates on the cultural aspects of implementing Six Sigma in Sweden: “To a Swede, an organisation is a vehicle through which the individual expresses him- or herself and can realise his/her full potential. It is an incubator. To generate enthusiasm for Six Sigma, one must anticipate the question, "How will Six Sigma help me be more creative?" The answer is, "When half of today’s problems are avoided through better processes, you will have more time to be creative!" Six Sigma frees up the capacity of individuals to grow and learn. Its success depends on it.” (Crom, 2000)
Crom concludes: “Six Sigma is universally applicable, though how one communicates the purpose of it and implements it should differ depending on the predominant national culture. Companies operating in Europe should beware of implementation approaches that are based on a U.S.-style emphasis on the capability of talented, well-trained individuals to get results ‘no matter what it takes’.” (Crom, 2000).
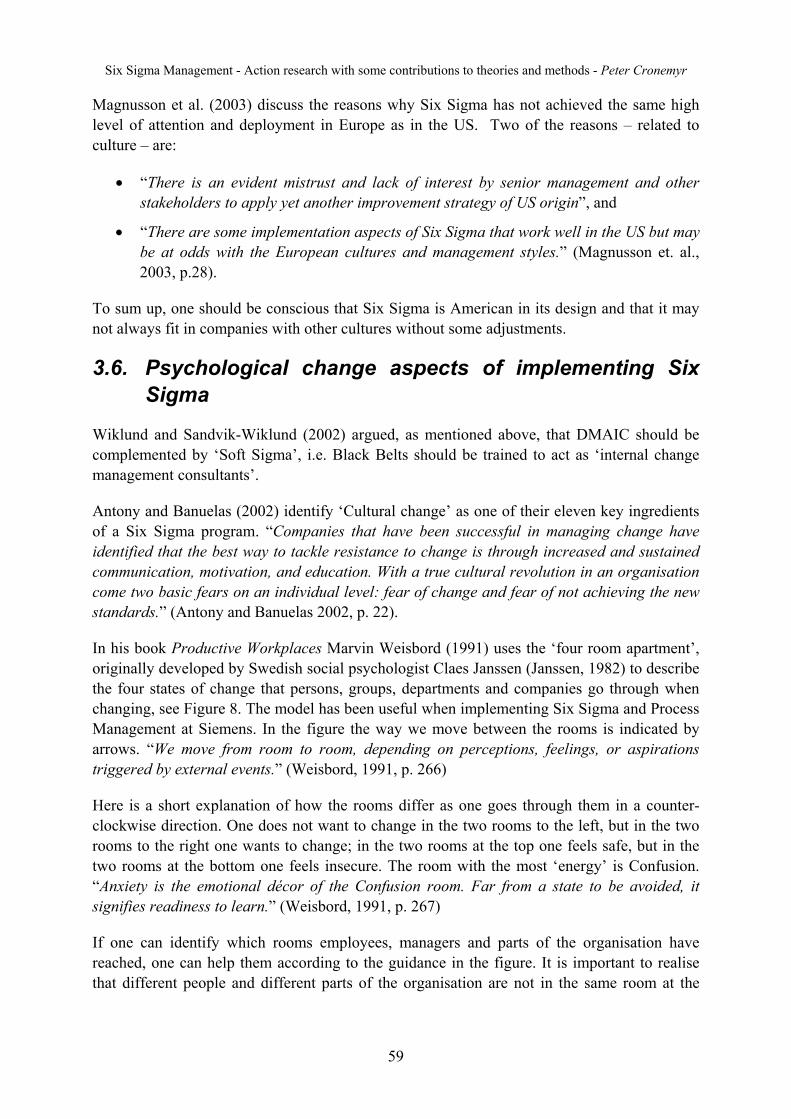
Six Sigma Management - Action research with some contributions to theories and methods - Peter Cronemyr
59
Magnusson et al. (2003) discuss the reasons why Six Sigma has not achieved the same high level of attention and deployment in Europe as in the US. Two of the reasons – related to culture – are:
• “There is an evident mistrust and lack of interest by senior management and other stakeholders to apply yet another improvement strategy of US origin”, and
• “There are some implementation aspects of Six Sigma that work well in the US but may be at odds with the European cultures and management styles.” (Magnusson et. al., 2003, p.28).
To sum up, one should be conscious that Six Sigma is American in its design and that it may not always fit in companies with other cultures without some adjustments.
3.6. Psychological change aspects of implementing Six Sigma
Wiklund and Sandvik-Wiklund (2002) argued, as mentioned above, that DMAIC should be complemented by ‘Soft Sigma’, i.e. Black Belts should be trained to act as ‘internal change management consultants’.
Antony and Banuelas (2002) identify ‘Cultural change’ as one of their eleven key ingredients of a Six Sigma program. “Companies that have been successful in managing change have identified that the best way to tackle resistance to change is through increased and sustained communication, motivation, and education. With a true cultural revolution in an organisation come two basic fears on an individual level: fear of change and fear of not achieving the new standards.” (Antony and Banuelas 2002, p. 22).
In his book Productive Workplaces Marvin Weisbord (1991) uses the ‘four room apartment’, originally developed by Swedish social psychologist Claes Janssen (Janssen, 1982) to describe the four states of change that persons, groups, departments and companies go through when changing, see Figure 8. The model has been useful when implementing Six Sigma and Process Management at Siemens. In the figure the way we move between the rooms is indicated by arrows. “We move from room to room, depending on perceptions, feelings, or aspirations triggered by external events.” (Weisbord, 1991, p. 266)
Here is a short explanation of how the rooms differ as one goes through them in a counter-clockwise direction. One does not want to change in the two rooms to the left, but in the two rooms to the right one wants to change; in the two rooms at the top one feels safe, but in the two rooms at the bottom one feels insecure. The room with the most ‘energy’ is Confusion. “Anxiety is the emotional décor of the Confusion room. Far from a state to be avoided, it signifies readiness to learn.” (Weisbord, 1991, p. 267)
If one can identify which rooms employees, managers and parts of the organisation have reached, one can help them according to the guidance in the figure. It is important to realise that different people and different parts of the organisation are not in the same room at the
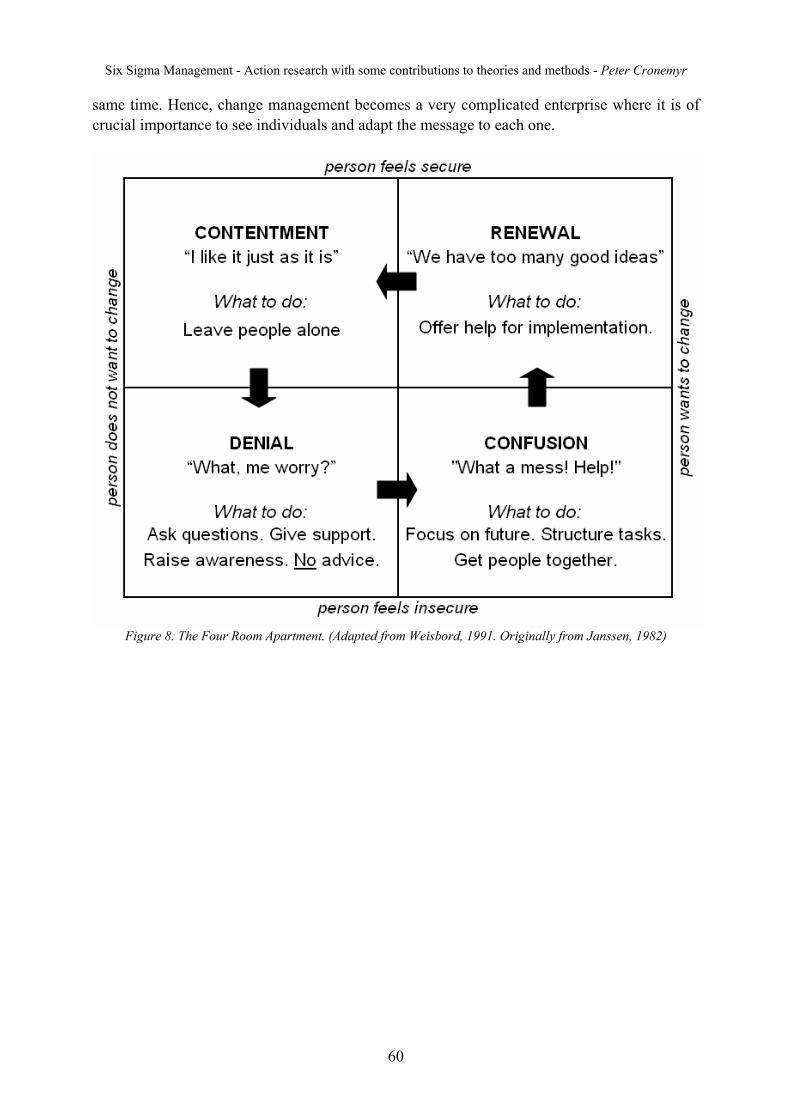
Six Sigma Management - Action research with some contributions to theories and methods - Peter Cronemyr
60
same time. Hence, change management becomes a very complicated enterprise where it is of crucial importance to see individuals and adapt the message to each one.
Figure 8. The Four Room Apartment. (Adapted from Weisbord, 1991. Originally from Janssen, 1982)
Six Sigma Management - Action research with some contributions to theories and methods - Peter Cronemyr
61
4. Summary of appended papers This section gives summaries of the appended papers. The title, author(s) and publication status are given for each paper, followed by the history, purpose and findings of the paper.
4.1. Six Sigma Management at Siemens (appendix A)
Title: Six Sigma Management at Siemens. A personal case story. Author: Peter Cronemyr Publication: Currently only published in this thesis (2007)
4.1.1. History of the paper
This appendix is not a ‘traditional’ research paper but rather a personal story. It presents a very thorough description of a change process that has taken place over a period of many years. The story starts some ten years ago and the detailed description spans over approximately four years. Many different topics are dealt with, often in chronological order. Each of these could very well be the seed that germinates into a ‘normal’ research paper.
4.1.2. Purpose of the paper
The purpose was to describe in detail the bumpy winding road of implementing Six Sigma at Siemens in Finspong, Sweden. It describes the history of Process Management and Six Sigma at the company to highlight the experiences of success and failure that formed the basis for the implementation. It also describes in detail the different events and incidents – most of them unplanned – that controlled and guided the evolution of Six Sigma Management.
In this thorough description, success factors and obstacles on the way are explained in context. If one wants to understand the validity of success factors one must understand the context in which they were identified. These success factors are compared to those given in the literature reporting on previous research studies.
4.1.3. Findings of the paper
4.1.3.1. Six Sigma Management
The set-up of Six Sigma Management, i.e. how management activities were organised around Six Sigma and Process Management, is presented in detail. The following figures (9-11) are the most central ones.
Figure 9 presents the Process Management model that had evolved during the years at the company, first under the name of Alstom Power and since 2003 under the name of Siemens. Order 1-2-3 that is given in the figure explains the order of implementation. To control processes, i.e. step 3, we first need established processes (step 1) and ‘Y as a function of X’ knowledge, which is only available by using the Six Sigma methodology for process improvements, i.e. step 2: not the other way around as described in the literature (see e.g. Snee and Hoerl (2002), Bergman and Klefsjö (2003), or Magnusson et. al. (2003)).
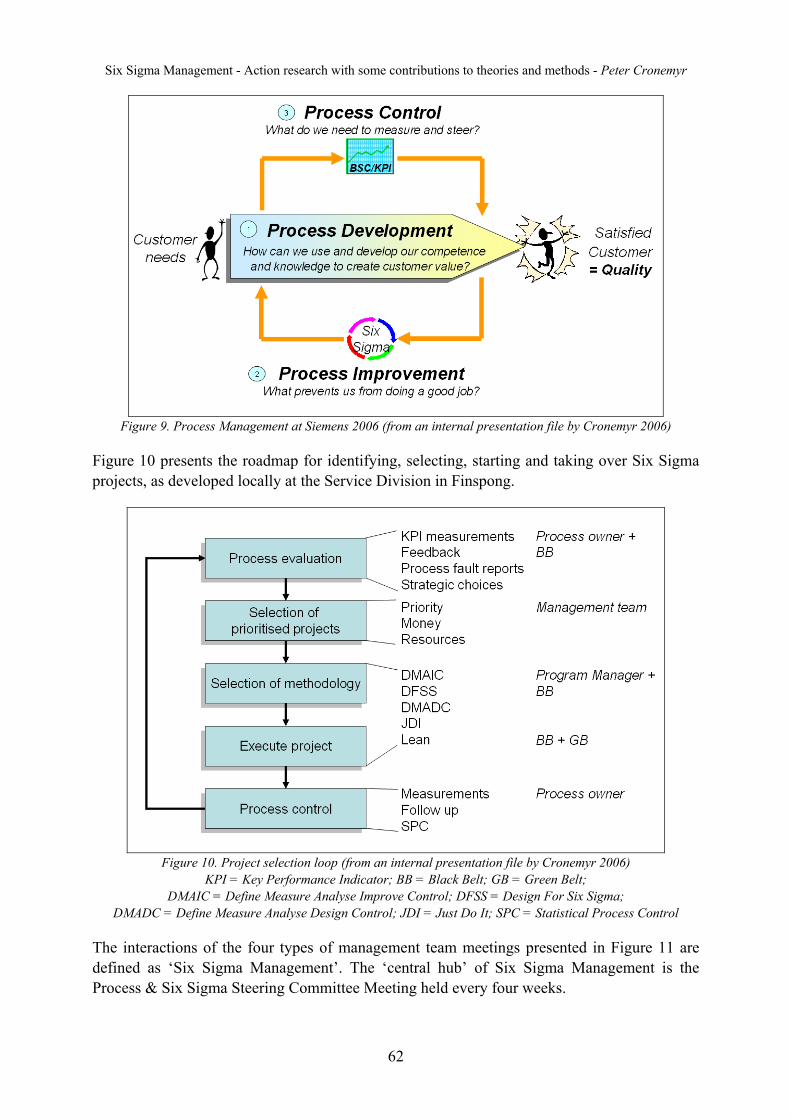
Six Sigma Management - Action research with some contributions to theories and methods - Peter Cronemyr
62
Figure 9. Process Management at Siemens 2006 (from an internal presentation file by Cronemyr 2006)
Figure 10 presents the roadmap for identifying, selecting, starting and taking over Six Sigma projects, as developed locally at the Service Division in Finspong.
Figure 10. Project selection loop (from an internal presentation file by Cronemyr 2006)
KPI = Key Performance Indicator; BB = Black Belt; GB = Green Belt; DMAIC = Define Measure Analyse Improve Control; DFSS = Design For Six Sigma;
DMADC = Define Measure Analyse Design Control; JDI = Just Do It; SPC = Statistical Process Control
The interactions of the four types of management team meetings presented in Figure 11 are defined as ‘Six Sigma Management’. The ‘central hub’ of Six Sigma Management is the Process & Six Sigma Steering Committee Meeting held every four weeks.
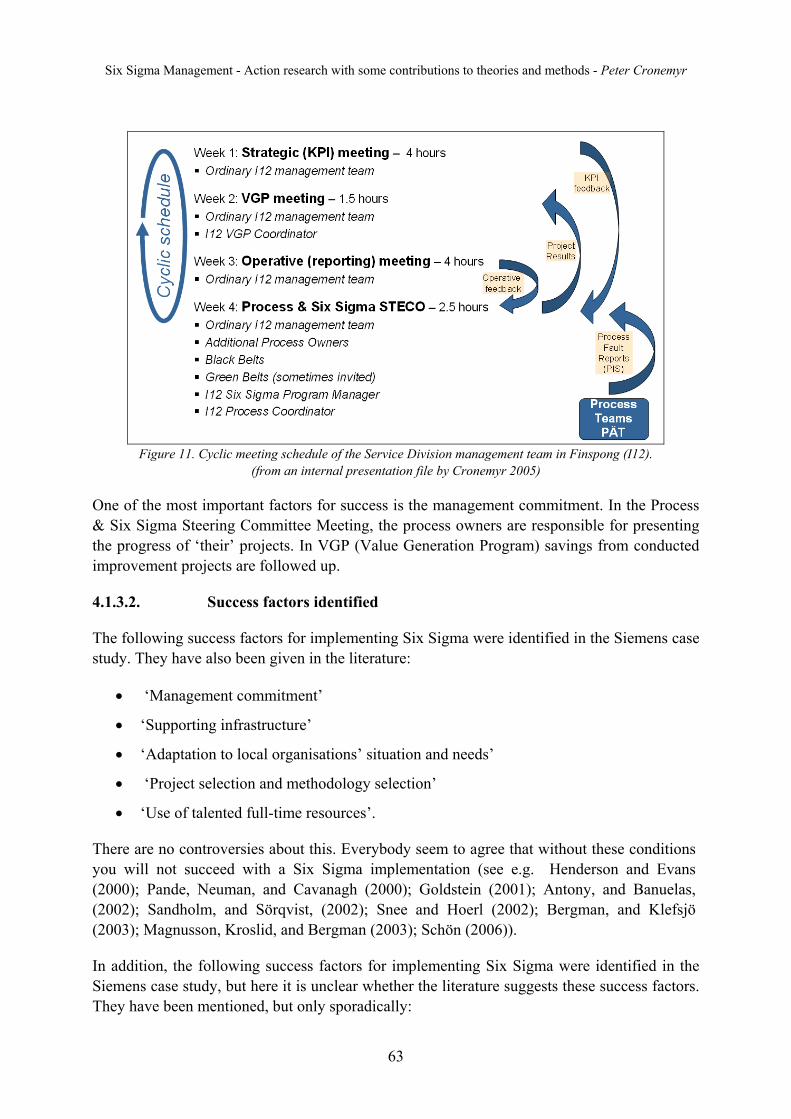
Six Sigma Management - Action research with some contributions to theories and methods - Peter Cronemyr
63
Figure 11. Cyclic meeting schedule of the Service Division management team in Finspong (I12).
(from an internal presentation file by Cronemyr 2005)
One of the most important factors for success is the management commitment. In the Process & Six Sigma Steering Committee Meeting, the process owners are responsible for presenting the progress of ‘their’ projects. In VGP (Value Generation Program) savings from conducted improvement projects are followed up.
4.1.3.2. Success factors identified
The following success factors for implementing Six Sigma were identified in the Siemens case study. They have also been given in the literature:
• ‘Management commitment’
• ‘Supporting infrastructure’
• ‘Adaptation to local organisations’ situation and needs’
• ‘Project selection and methodology selection’
• ‘Use of talented full-time resources’.
There are no controversies about this. Everybody seem to agree that without these conditions you will not succeed with a Six Sigma implementation (see e.g. Henderson and Evans (2000); Pande, Neuman, and Cavanagh (2000); Goldstein (2001); Antony, and Banuelas, (2002); Sandholm, and Sörqvist, (2002); Snee and Hoerl (2002); Bergman, and Klefsjö (2003); Magnusson, Kroslid, and Bergman (2003); Schön (2006)).
In addition, the following success factors for implementing Six Sigma were identified in the Siemens case study, but here it is unclear whether the literature suggests these success factors. They have been mentioned, but only sporadically:
Six Sigma Management - Action research with some contributions to theories and methods - Peter Cronemyr
64
• ‘Committed driver’ (mentioned by Magnusson et. al. (2003))
• ‘Learn from history’ (mentioned by Schön (2006))
• ‘Coaching’ (mentioned by Snee and Hoerl (2002))
• ‘Middle management involvement’ (mentioned by Schön (2006))
• ‘Take psychological aspects into account’ (mentioned by Antony and Banuelas (2002) and Wiklund and Sandvik-Wiklund (2002))
• ‘Take cultural aspects into account’ (mentioned by Sandholm and Sörqvist (2002) and Schön (2006))
As mentioned above all these success factors were indeed very important at Siemens. The author of this thesis was the ‘committed driver’ who always argued that one should ‘learn from history’, especially from the ‘goldmine’ of past failures. Both ‘coaching’ and ‘middle management involvement’ were identified from crises that were dealt with. The factors of ‘taking psychological aspects into account’ and ‘taking cultural aspects into account’ were partly dealt with by engaging behavioural scientists.
Finally, the following success factors were rated as most important in the Siemens case study but not mentioned as such in the literature:
• ‘Six Sigma integrated into Process Management’
• ‘Process perspective’
• ‘Utilise IT to support implementation of process improvements’.
This is the major conclusion in the Siemens case study, even though one should always be cautious about drawing conclusions from a contextually limited study. It is recommended in order to succeed with a Six Sigma implementation that Six Sigma should be integrated with Process Management. This is much easier if the organisation has a process perspective instead of a product perspective. IT is the natural way to implement process improvements, even in processes not primarily concerned with IT management. It is the essence of Six Sigma Management, as applied at Siemens.
4.2. Selection of Six Sigma projects based on customer feedback – The idea (appendix B)
Title: Use Customer Feedback to Choose Six Sigma Projects Authors: Anders Fundin and Peter Cronemyr Publication: Six Sigma Forum Magazine. November: 17-21 (2003)
4.2.1. History of the paper
My co-author in this paper was Anders Fundin at Chalmers University of Technology. It was written in 2002-2003 before I re-started my Ph.D. studies.
Six Sigma Management - Action research with some contributions to theories and methods - Peter Cronemyr
65
At the time I was working as an uncertified Black Belt at the Gas Turbine Department at Alstom Power (now Siemens). One of the Black Belt projects concerned the large number of product fault reports from the field that were dealt with every year. Even though many people were working on solving the problems behind the fault reports, the number of new fault reports each year was not decreasing. What we found in the Black Belt project was that, while product faults were solved and products were consequently improved, the underlying process faults were not dealt with, i.e. the process that caused a problem to appear in the first place was not improved. Hence the problems re-occurred, showing up as new product faults. The solution was a Process Improvement System – an application called PIS that we developed in the Lotus Notes software – supporting the new Process Fault Report Process that could be used to identify suitable Six Sigma projects from re-occurring process faults.
4.2.2. Purpose of the paper
The purpose was to present the idea of the Process Improvement System supporting the new Process Fault Report Process – at that time called the Process Improvement Process (PIP). It showed how knowledge could be transferred from the customer domain way back to the ‘causing processes’ of the company with special emphasis on the product development process.
4.2.3. Findings of the paper
4.2.3.1. Customer feedback
Measurement systems, nonconformity reports, business strategies and supplier problems are good places to look when you try to choose a Six Sigma project and they provide an opportunity to use customer complaints as a means to initiate improvement projects. Manufacturing organisations do not typically use customer input as a means to improve designs and processes because they lack formal processes that facilitate transferring feedback (Magnusson et. al., 2003). It is important for these processes to be established when customer feedback is used as a means for selecting Six Sigma projects. Selecting projects is one of the most difficult elements in the deployment of Six Sigma. It is essential to identify the process containing the actual root cause of the problem. According to W. M. Kelly (2002) Six Sigma projects should give priority to customer issues, and project selection lists should be reformulated continuously on the basis of new customer issues.
4.2.3.2. The case
Alstom Power was searching for a way to select Six Sigma projects to improve its products and processes by using feedback from dissatisfied customers. So, in 2002, the company initiated the development of its Process Improvement Process (PIP). Alstom Power decided to focus on improving the gas turbine development process. By doing so, it hoped to find the primary root causes of problems related to current products and improvement potentials in the creation of future products.
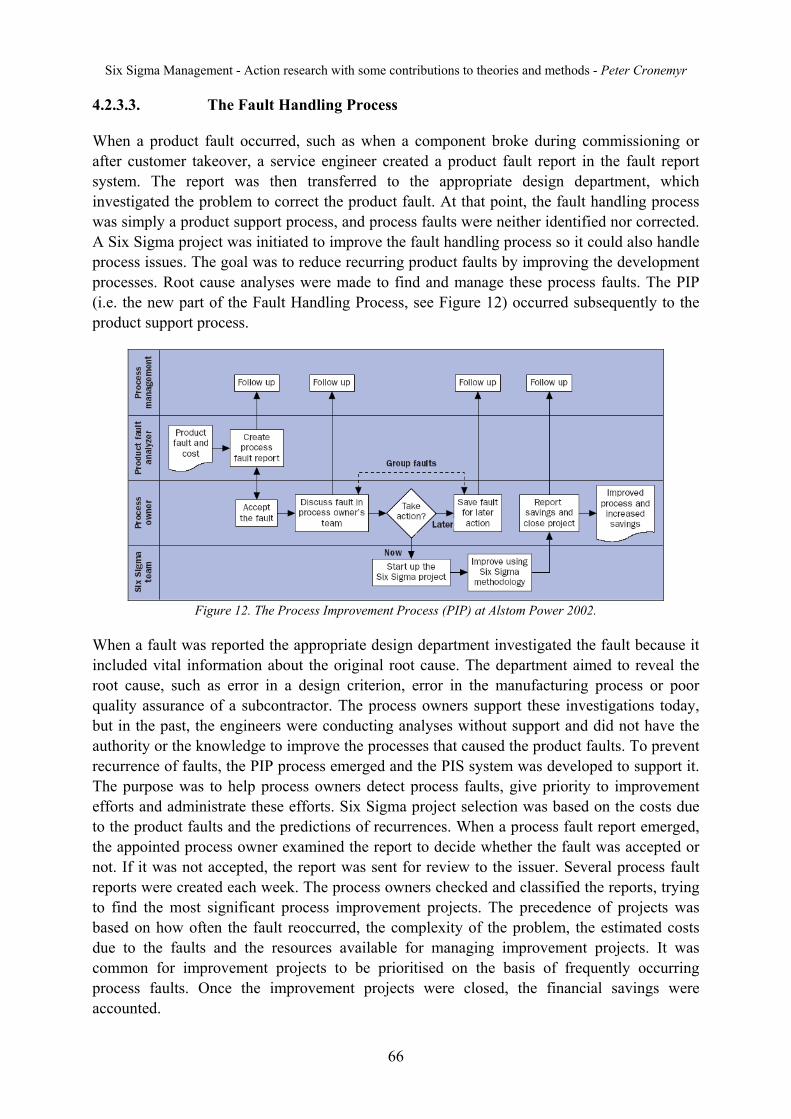
Six Sigma Management - Action research with some contributions to theories and methods - Peter Cronemyr
66
4.2.3.3. The Fault Handling Process
When a product fault occurred, such as when a component broke during commissioning or after customer takeover, a service engineer created a product fault report in the fault report system. The report was then transferred to the appropriate design department, which investigated the problem to correct the product fault. At that point, the fault handling process was simply a product support process, and process faults were neither identified nor corrected. A Six Sigma project was initiated to improve the fault handling process so it could also handle process issues. The goal was to reduce recurring product faults by improving the development processes. Root cause analyses were made to find and manage these process faults. The PIP (i.e. the new part of the Fault Handling Process, see Figure 12) occurred subsequently to the product support process.
Figure 12. The Process Improvement Process (PIP) at Alstom Power 2002.
When a fault was reported the appropriate design department investigated the fault because it included vital information about the original root cause. The department aimed to reveal the root cause, such as error in a design criterion, error in the manufacturing process or poor quality assurance of a subcontractor. The process owners support these investigations today, but in the past, the engineers were conducting analyses without support and did not have the authority or the knowledge to improve the processes that caused the product faults. To prevent recurrence of faults, the PIP process emerged and the PIS system was developed to support it. The purpose was to help process owners detect process faults, give priority to improvement efforts and administrate these efforts. Six Sigma project selection was based on the costs due to the product faults and the predictions of recurrences. When a process fault report emerged, the appointed process owner examined the report to decide whether the fault was accepted or not. If it was not accepted, the report was sent for review to the issuer. Several process fault reports were created each week. The process owners checked and classified the reports, trying to find the most significant process improvement projects. The precedence of projects was based on how often the fault reoccurred, the complexity of the problem, the estimated costs due to the faults and the resources available for managing improvement projects. It was common for improvement projects to be prioritised on the basis of frequently occurring process faults. Once the improvement projects were closed, the financial savings were accounted.
Six Sigma Management - Action research with some contributions to theories and methods - Peter Cronemyr
67
4.2.3.4. Lessons Learned
When the paper was published, Alstom Power’s implementation of the PIP process and the supporting PIS system was still in progress. The improve phase of the Six Sigma project had been completed. Of 2,295 reported faults, 1,070 had been classified by contributions from nine process owners. This classification had identified 67 potential Six Sigma projects. Even though the implementation project was strongly supported by company management and process owners, there were three main problems.
• First, the individuals who analysed product faults had given some resistance. Most were designers or engineers who were used to solving product problems, not specifying causal processes or classifying process faults. This was because they lacked knowledge of the processes and did not have sufficient time to work with them. Hence, managers had to remember to schedule any extra time needed.
• Second, Alstom Power’s processes were not sufficiently defined. Although this supported a separate initiative to define and map primary processes, the ‘not sufficiently defined’ processes were still used in the PIS. It would have been easier for Alstom Power to implement the PIP if the primary processes had been more defined and mapped before the project began.
• Third, the process owners had been involved to differing extents in mapping the processes. This caused instability when implementing the PIP. Some of the process owners considered these activities as something new and objectionable; however, most of them appreciated the PIS support. Consequently, only a small number of root causes had been detected, and only a small amount of process faults had been solved.
4.2.4. Postscript
In hindsight – five years after the paper was written – I can see many important steps towards this thesis. The process fault report system was a good idea even though there were no real results at the time. As indicated in the lessons learned: i) processes need to be established before running Six Sigma and ii) it is difficult to deal with process faults if you have a product fault perspective. I return to these topics in the next paper.
4.3. Selection of Six Sigma projects based on customer feedback – Application (appendix C)
Title: Changing from a product to a process perspective for service improvements in Manufacturing Companies Authors: Peter Cronemyr and Lars Witell Publication: Submitted for publication (2007)
Six Sigma Management - Action research with some contributions to theories and methods - Peter Cronemyr
68
4.3.1. History of the paper
The co-author of this paper was Lars Witell at Karlstad University. The paper was a continuation of and partly built on the previous paper (Fundin and Cronemyr, 2003). I was working at the Service Division and using the Process Fault Report System that I had developed some five years earlier at the Gas Turbine Development Department.
4.3.2. Purpose of the paper
The purpose was to present how the customer feedback system at Siemens – the Process Fault Report System – could be used to improve processes in a Service Business.
4.3.3. Findings of the paper
4.3.3.1. Service improvements
To maintain and improve service quality, manufacturing companies must adjust their quality improvement strategies to the context of services. Field service has often been run as an organisation dedicated to putting out fires at the customer’s location. Traditionally, not much knowledge has transferred to the rest of the organisation, but in organisations that have developed a process perspective, the knowledge gained is utilised to learn about how to more quickly put out future fires. Not often are these fires used in continuous improvement programs such as “gold in the mine” (Juran 1998), that can eliminate the cost of poor quality and prevent fires from occurring for existing products and their related services. To maintain and improve service quality, manufacturing companies need processes for conducting quality improvements based on customer feedback. Such feedback is often available through systems on fault reports, customer complaints and other kinds of field data – but it is not often used in service improvement initiatives. This includes changing the perspective of failures, i.e. changing from a product to a process perspective. In this paper we explain how the Service Division at Siemens Industrial Turbines AB in Sweden uses feedback from dissatisfied customers as a driving factor in process improvements. This helps Siemens select the most significant Six Sigma projects to improve the service processes and ultimately the fulfilment of customers’ needs.
As a supplier of advanced and highly customised products there was always a need at Siemens for close relations with customers and quick resolutions of product faults in the customer’ processes. Over the years the Fault Resolution Process has evolved and expanded. The Fault Resolution Process consists of six steps, ranging from repair of the customer’s failed product, finding the root cause of product failure, updating the customer’s and similar products in the installed base and then redesigning the standard product for future customers, see Table 8.
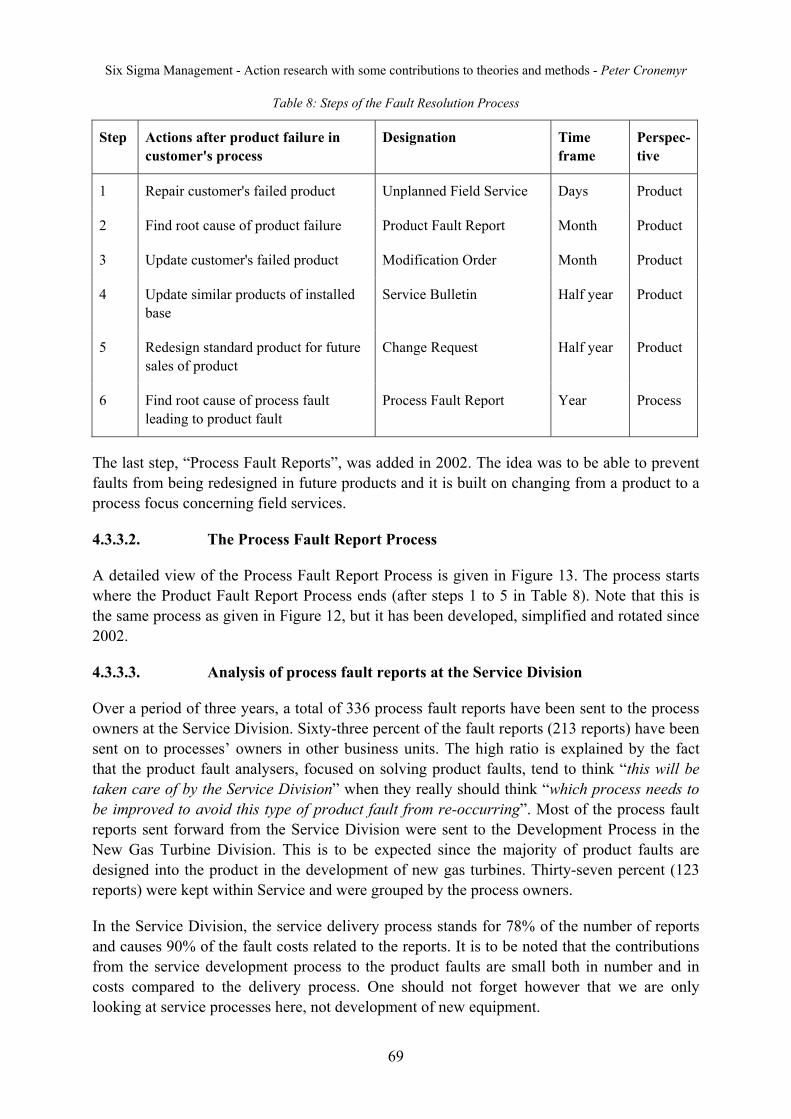
Six Sigma Management - Action research with some contributions to theories and methods - Peter Cronemyr
69
Table 8: Steps of the Fault Resolution Process
Step Actions after product failure in customer's process
Designation Time frame
Perspec-tive
1 Repair customer's failed product Unplanned Field Service Days Product
2 Find root cause of product failure Product Fault Report Month Product
3 Update customer's failed product Modification Order Month Product
4 Update similar products of installed base
Service Bulletin Half year Product
5 Redesign standard product for future sales of product
Change Request Half year Product
6 Find root cause of process fault leading to product fault
Process Fault Report Year Process
The last step, “Process Fault Reports”, was added in 2002. The idea was to be able to prevent faults from being redesigned in future products and it is built on changing from a product to a process focus concerning field services.
4.3.3.2. The Process Fault Report Process
A detailed view of the Process Fault Report Process is given in Figure 13. The process starts where the Product Fault Report Process ends (after steps 1 to 5 in Table 8). Note that this is the same process as given in Figure 12, but it has been developed, simplified and rotated since 2002.
4.3.3.3. Analysis of process fault reports at the Service Division
Over a period of three years, a total of 336 process fault reports have been sent to the process owners at the Service Division. Sixty-three percent of the fault reports (213 reports) have been sent on to processes’ owners in other business units. The high ratio is explained by the fact that the product fault analysers, focused on solving product faults, tend to think “this will be taken care of by the Service Division” when they really should think “which process needs to be improved to avoid this type of product fault from re-occurring”. Most of the process fault reports sent forward from the Service Division were sent to the Development Process in the New Gas Turbine Division. This is to be expected since the majority of product faults are designed into the product in the development of new gas turbines. Thirty-seven percent (123 reports) were kept within Service and were grouped by the process owners.
In the Service Division, the service delivery process stands for 78% of the number of reports and causes 90% of the fault costs related to the reports. It is to be noted that the contributions from the service development process to the product faults are small both in number and in costs compared to the delivery process. One should not forget however that we are only looking at service processes here, not development of new equipment.
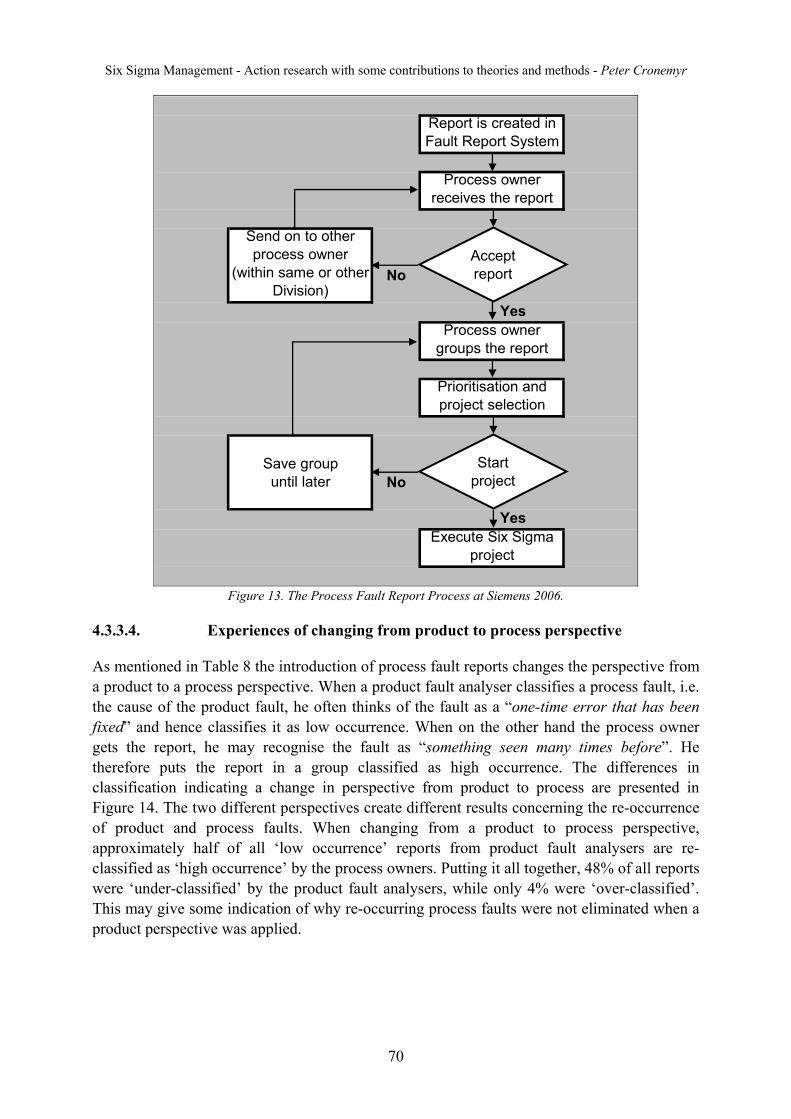
Six Sigma Management - Action research with some contributions to theories and methods - Peter Cronemyr
70
Report is created in Fault Report System
Process ownerreceives the report
Send on to other process owner
(within same or other Division)
No
YesProcess owner
groups the report
Prioritisation andproject selection
Save groupuntil later No
YesExecute Six Sigma
project
Acceptreport
Startproject
Figure 13. The Process Fault Report Process at Siemens 2006.
4.3.3.4. Experiences of changing from product to process perspective
As mentioned in Table 8 the introduction of process fault reports changes the perspective from a product to a process perspective. When a product fault analyser classifies a process fault, i.e. the cause of the product fault, he often thinks of the fault as a “one-time error that has been fixed” and hence classifies it as low occurrence. When on the other hand the process owner gets the report, he may recognise the fault as “something seen many times before”. He therefore puts the report in a group classified as high occurrence. The differences in classification indicating a change in perspective from product to process are presented in Figure 14. The two different perspectives create different results concerning the re-occurrence of product and process faults. When changing from a product to process perspective, approximately half of all ‘low occurrence’ reports from product fault analysers are re-classified as ‘high occurrence’ by the process owners. Putting it all together, 48% of all reports were ‘under-classified’ by the product fault analysers, while only 4% were ‘over-classified’. This may give some indication of why re-occurring process faults were not eliminated when a product perspective was applied.
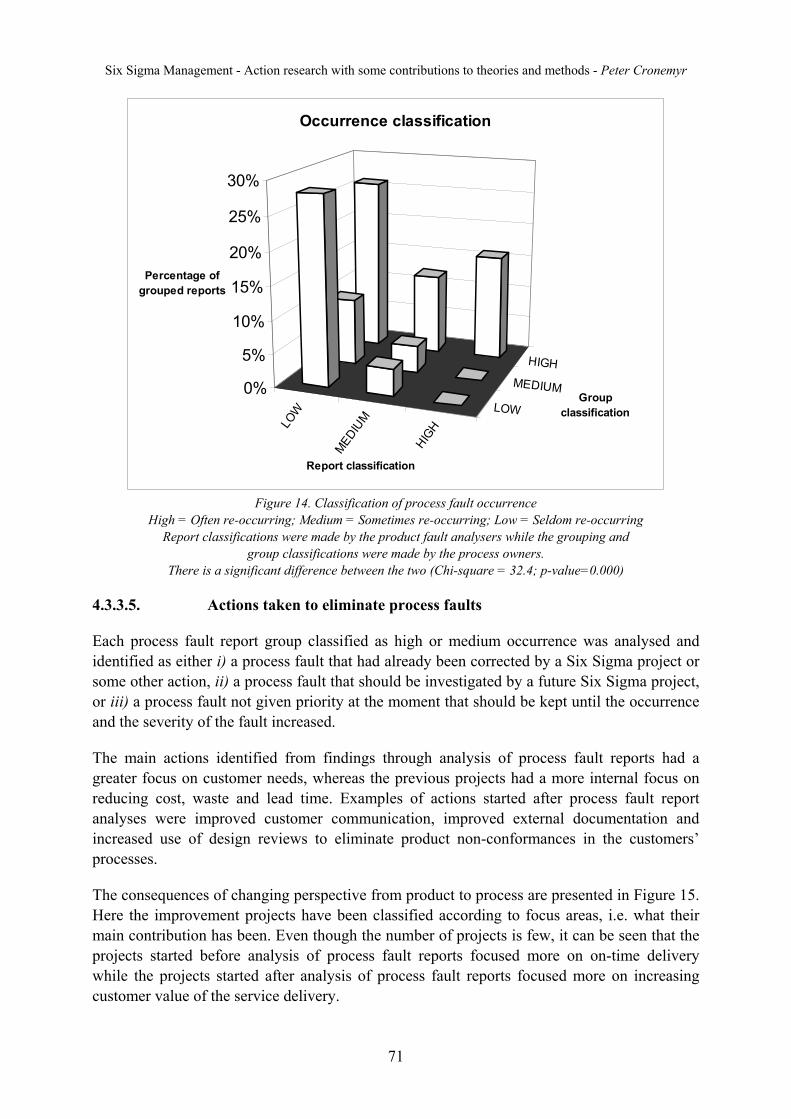
Six Sigma Management - Action research with some contributions to theories and methods - Peter Cronemyr
71
LOW
MEDIUM
HIGH
LOW
MEDIUM
HIGH
0%
5%
10%
15%
20%
25%
30%
Percentage of grouped reports
Report classification
Group classification
Occurrence classification
Figure 14. Classification of process fault occurrence
High = Often re-occurring; Medium = Sometimes re-occurring; Low = Seldom re-occurring Report classifications were made by the product fault analysers while the grouping and
group classifications were made by the process owners. There is a significant difference between the two (Chi-square = 32.4; p-value=0.000)
4.3.3.5. Actions taken to eliminate process faults
Each process fault report group classified as high or medium occurrence was analysed and identified as either i) a process fault that had already been corrected by a Six Sigma project or some other action, ii) a process fault that should be investigated by a future Six Sigma project, or iii) a process fault not given priority at the moment that should be kept until the occurrence and the severity of the fault increased.
The main actions identified from findings through analysis of process fault reports had a greater focus on customer needs, whereas the previous projects had a more internal focus on reducing cost, waste and lead time. Examples of actions started after process fault report analyses were improved customer communication, improved external documentation and increased use of design reviews to eliminate product non-conformances in the customers’ processes.
The consequences of changing perspective from product to process are presented in Figure 15. Here the improvement projects have been classified according to focus areas, i.e. what their main contribution has been. Even though the number of projects is few, it can be seen that the projects started before analysis of process fault reports focused more on on-time delivery while the projects started after analysis of process fault reports focused more on increasing customer value of the service delivery.
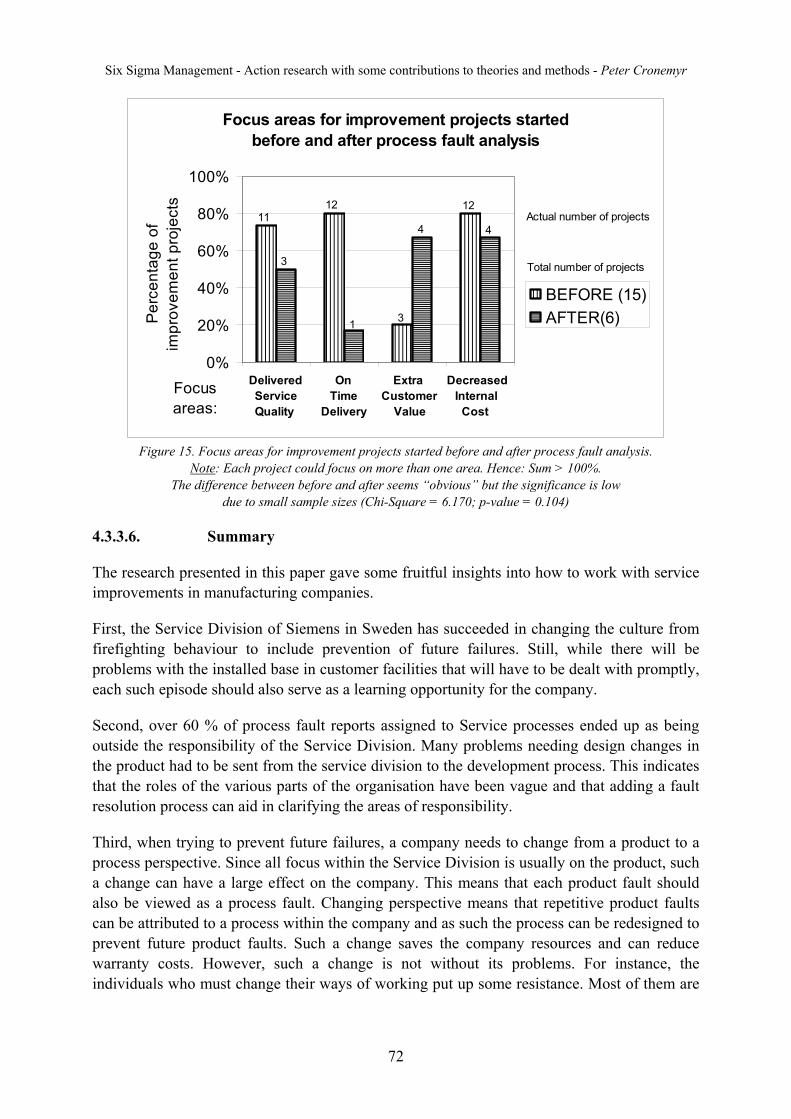
Six Sigma Management - Action research with some contributions to theories and methods - Peter Cronemyr
72
Focus areas for improvement projects started before and after process fault analysis
0%
20%
40%
60%
80%
100%
Q T V C
Per
cent
age
of
impr
ovem
ent p
roje
cts
BEFORE (15)AFTER(6)
Delivered On Extra Decreased Service Time Customer Internal Quality Delivery Value Cost
Focusareas:
11
3
12
1 3
4 4
12Actual number of projects
Total number of projects
Figure 15. Focus areas for improvement projects started before and after process fault analysis.
Note: Each project could focus on more than one area. Hence: Sum > 100%. The difference between before and after seems “obvious” but the significance is low
due to small sample sizes (Chi-Square = 6.170; p-value = 0.104)
4.3.3.6. Summary
The research presented in this paper gave some fruitful insights into how to work with service improvements in manufacturing companies.
First, the Service Division of Siemens in Sweden has succeeded in changing the culture from firefighting behaviour to include prevention of future failures. Still, while there will be problems with the installed base in customer facilities that will have to be dealt with promptly, each such episode should also serve as a learning opportunity for the company.
Second, over 60 % of process fault reports assigned to Service processes ended up as being outside the responsibility of the Service Division. Many problems needing design changes in the product had to be sent from the service division to the development process. This indicates that the roles of the various parts of the organisation have been vague and that adding a fault resolution process can aid in clarifying the areas of responsibility.
Third, when trying to prevent future failures, a company needs to change from a product to a process perspective. Since all focus within the Service Division is usually on the product, such a change can have a large effect on the company. This means that each product fault should also be viewed as a process fault. Changing perspective means that repetitive product faults can be attributed to a process within the company and as such the process can be redesigned to prevent future product faults. Such a change saves the company resources and can reduce warranty costs. However, such a change is not without its problems. For instance, the individuals who must change their ways of working put up some resistance. Most of them are
Six Sigma Management - Action research with some contributions to theories and methods - Peter Cronemyr
73
designers or engineers who solve product problems and do not usually specify causal processes or classify process faults.
Fourth, the greatest benefit of changing from a product to a process perspective is the change in focus from reduction of internal costs to value creation through service delivery. In Siemens, the introduction of process fault reports has changed the focus of improvement work from internal lead-times and process mapping to customer needs and customer communication. From a theoretical perspective, this means that improvements were first introduced in the processes in the back office that did not directly influence the customer. Over time, however, this has changed so that improvements are made outside, i.e. on the customer side, of the line of visibility so that they directly influence the customer experience. Such a shift makes it possible to improve the perceived customer value and build long-term relationships with customers.
4.4. Selection of Six Sigma roadmap based on process state (appendix D)
Title: DMAIC and DMADV – Differences, similarities, and synergies. Author: Peter Cronemyr Publication: International Journal of Six Sigma and Competitive Advantage (2007)
4.4.1. History of the paper
A previous version was presented at the QMOD conference in Liverpool in 2006 (Cronemyr, 2006). The paper was written as an assignment for a Ph.D. course on Design for Six Sigma (DfSS) conducted at Chalmers University of Technology in 2005 and 2006. I was the sole author of the paper but it was reviewed ‘theoretically’ by my colleagues at Chalmers and ‘practically’ by my colleagues at Siemens.
4.4.2. Purpose of the paper
While all the other papers produced by the course participants – as well as most books on DfSS – deal with DfSS in the context of product development, this paper deals with DfSS in the context of process development.
I had two ‘problems’ that I wanted to write about. The first was the view expressed by many that DfSS is something ‘completely different’ from DMAIC, i.e. normal Six Sigma, and it was often also said to be ‘better’ than DMAIC, claiming there should exist something called a ‘five sigma wall’. On the basis of my experiences, I did not agree at all with those opinions. I compared a DfSS roadmap called DMADV – Define, Measure, Analyse, Design, Verify – to DMAIC and found both differences and similarities.
My second problem was the feeling that DMAIC, as taught in Six Sigma trainings, did not really ‘fit’ in real situations. In projects that I had conducted or coached we could seldom fully follow DMAIC ‘by the book’ because our processes – destined to be analysed and improved – were not in the state where this method could be applied. Even though no one had mentioned this in the literature before – as far as I knew – I was sure we were not the only ones with this

Six Sigma Management - Action research with some contributions to theories and methods - Peter Cronemyr
74
problem. When I talked with other Black Belts at Siemens and at other companies the question of the ‘process door’ always came up, i.e. there were limited data to analyse so statistical tools were not very useful. I had kept a picture drawn on a flip chart from my own Black Belt training showing ‘Wheeler’s process states’ and used it several times in my own projects to show process owners and team members what to do in ‘bad processes’, i.e. what Wheeler calls ‘processes on the brink of chaos’ (Wheeler, 2000).
Now I had the possibility to write about these two problems of mine and present a solution for how they might be resolved.
4.4.3. Findings of the paper
4.4.3.1. Differences and similarities of DMAIC and DMADV
The paper starts with a presentation of the tools used in the two roadmaps DMAIC and DMADV. The DMADV roadmap was chosen because it is the most commonly used DfSS roadmap (Atwood, 2005). Some of the tools in DMAIC and DMADV are the same. Figure 16 gives a rough outline of the two roadmaps. As described below, the tools in the roadmaps are very similar at the beginning and at the end while they are quite different in the middle of DMAIC and DMADV.
blockDMAIC DMAIC tools # DMADV tools DMADV
Define project Define projectD Process map 1 Process map D
Voice of the customer Voice of the customerSet up measurement QFD1:VOC to QC* M
M Measure historic data 2 Design ScorecardInitial process sigma Benchmarking
A Root cause analysis QFD2:QC to DC* AGenerate improvements Generate concepts
(Pugh matrix) Pugh matrixQFD3:DC to CC*
3 Transfer functionsI FMEA Robust design D
Design ScorecardPilot test Implementation plan
Implementation plan Design reviewControl plan Pilot process
Standardization 4 Design ScorecardC Monitoring Control plan V
Final process sigma Formal releaseClosure Closure
Figure 16. Comparison of the DMAIC and DMADV roadmaps (rough outline).
* QFD: Quality Function Deployment; VOC: Voice of the Customer; QC: Quality Characteristics; DC: Design Characteristics; CC: Component Characteristic
Six Sigma Management - Action research with some contributions to theories and methods - Peter Cronemyr
75
Comparing the roadmaps one phase at a time, i.e. Define-Define, Measure-Measure etc., is somewhat difficult because the phases are misaligned. Instead the tools have been grouped into four blocks (#1-4) for each roadmap in such a manner that the tools align as much as possible.
Block #1 of the two roadmaps is similar. It can be called “Set target”.
Block #2 of the two roadmaps is not the same. In DMAIC it can be called “Get the data, find the root causes”. In DMADV on the other hand it can be called “Transform voice of the customer into functional requirements”.
Block #3 of the two roadmaps is similar. It can be called “Develop solution”.
Block #4 of the two roadmaps is similar. It can be called “Implement solution”.
The conclusion is that DMAIC and DMADV are not ‘completely different’. They are quite similar except for how to decide ‘what to do’. The question is however ‘when to do what’.
4.4.3.2. Choosing a roadmap based on process state
Processes come in different states, i.e. at different performance levels. While the purpose of process improvement is to make a process ‘better’, the inevitable effect of time is that it will become ‘worse’. As with everything else in the universe, the entropy, i.e. the level of disorder, will increase with time unless we do something to restore order. Hence even the best of all processes will eventually need to be improved. The concept of process entropy was introduced by Donald Wheeler (2000). According to Wheeler a process can be in either of four states. These are: the ideal state, the threshold state, the brink of chaos and the state of chaos (see also Table 10).
Wheeler argues that most managers are ‘chaos managers’, constantly ‘saving’ the company by taking care of big customer problems in a process in the ‘state of chaos’, the worse state of a process, and hence temporarily moving the process to the brink of chaos. To improve this kind of process one should identify and remove the assignable causes of variation. The suggestion given in the paper is to use the DMADV roadmap in the state of chaos.
On the other end of the scale, a process in an ideal state – since it is in control – is operating at its full potential. Furthermore, the output from the process ‘always’ conforms to customer specifications, i.e. a ‘six sigma’ process. Processes in the ideal state are not very common. They do not need to be improved, but they need to be monitored.
A little more common are processes that are in control but have lower sigma values, i.e. the outputs are not always within customer spec limits. These processes are in the threshold state. Since a process in the threshold state is already operating up to its full potential, it will need a major process upgrade. The suggestion given in the paper is to use the DMAIC roadmap in the threshold state.
A much more common state in a business process is that it is on the brink of chaos, i.e. a process out of control but – mostly – with only minor customer problems. While the customer

Six Sigma Management - Action research with some contributions to theories and methods - Peter Cronemyr
76
may be satisfied with the output, the company has to pay a lot for big losses before the output reaches the customer. In this case, there is a process that needs to be improved by identifying and removing assignable causes of variation. In this state – the brink of chaos – neither DMAIC nor DMADV fits because the process is out of control, but it may not need a total re-design. Instead a new roadmap – a combination of the two – is presented in the paper. It is called DMADC – Define, Measure, Analyse, Design, Control – and is summarised in Table 9 using the blocks defined in Figure 16.
DMADC is developed from the DMAIC roadmap where some of the tools of the Measure and Analyse phases have been substituted by some other tools from DMADV. This is a common practical solution when by-the-book DMAIC does not work.
Table 9: The phases of the suggested DMADC roadmap, to be used when improving out of control processes on the brink of chaos (* blocks defined in Figure 16)
Phase Basic block* Tools Additional tools
DEFINE Block #1 from DMAIC Define project Process map Voice of the customer
MEASURE First half of block #2 from DMADV
QFD1: VOC to QC Set up Design Scorecard
History of problems
ANALYSE Second half of block #2 from DMADV
Benchmarking QFD2: QC to DC
Process analysis Cause and effect analysis
DESIGN Block #3 and some of block #4 from DMAIC
Generate improvements Pugh matrix FMEA Pilot test Implementation plan
QFD3 p-diagram
CONTROL Rest of block #4 from DMAIC
Control plan Standardisation Monitoring Final process sigma Closure
4.4.3.3. Conclusions of the paper
A summary of suggested roadmaps for improving processes in different states is given in Table 10.
In our experience at Alstom Power and Siemens, most processes are out of control when a Six Sigma programme is started up in a company. This must be dealt with as it is a major threat to

Six Sigma Management - Action research with some contributions to theories and methods - Peter Cronemyr
77
the success of Six Sigma. By choosing to use the suggested DMADC methodology instead of ‘DMAIC by-the-book’ this threat can be minimised.
Table 10: Suggested process improvement roadmaps for the four process states.
Process state Process predictability Conformance to customer specifications
Suggested roadmap
Ideal State Process is predictable (in control)
Conforming (within spec limits)
Do nothing (Monitor)
Threshold State
Process is predictable (in control)
Nonconforming (not within spec limits)
DMAIC
Brink of Chaos
Process is unpredictable (out of control)
Conforming (within spec limits)
DMADC
State of Chaos
Process is unpredictable (out of control)
Nonconforming (not within spec limits)
DMADV
It should be noted that the suggestions above are exactly the opposite of those who claim that DfSS should be used to penetrate the so-called ‘five sigma wall’ (see e.g. Chowdhury, 2002). Those arguments are built on the logic of using DMAIC to improve the performance of the Manufacturing process and DfSS to improve product performance in the Design process. In this paper we are not looking at product improvement and design. We are looking at process improvements and in this case DMADV is used to design a new process when the old process is not good enough to be improved with DMAIC or DMADC. If we are to find evidence in the future for a five sigma wall, we will have to put DMADV at the top of the model. So far we do not have such evidence.
4.5. Knowledge Overlapping Seminars – KOS (appendix E)
Title: Knowledge Overlapping Seminars – KOS. Design and Applications. Authors: Peter Cronemyr and Christina Mauléon Publication: Submitted for publication (2007)
4.5.1. History of the paper
The co-author of this paper was Christina Mauléon at Chalmers University of Technology. A previous version was presented at the QMOD conference in Liverpool (Cronemyr and Mauléon, 2006). The paper was built upon previous work on KOS (Cronemyr, 2000:a, and Cronemyr, 2000:b) and on common concepts and conceptual pragmatism (Mauléon, C., Bergman, B. and Alänge, S., 2003, and Mauléon, C. and Bergman, B., 2002).
Six Sigma Management - Action research with some contributions to theories and methods - Peter Cronemyr
78
This part of the thesis has developed over many years, I would say since I started working as an engineer at Saab Aerospace in 1984. When I was a research student the first time between 1998 and 2000, which resulted in my Licentiate thesis (Cronemyr, 2000:a), I was mostly concerned with how to improve understanding between people from different knowledge domains within product development teams. I had many experiences of misunderstandings between people who thought they understood one another but, since I had knowledge from several domains, I realised they actually talked about different things. I had experienced misunderstandings for many years but it was not until I started my research studies that I could start to investigate the causes and, eventually, propose and test a solution to the problem. I called it Knowledge Overlapping Seminars (KOS). It was very successful when used in a product development team. Several misunderstandings were revealed.
When I restarted my research studies in 2005, now aiming at a ‘full Ph.D.’, I wanted to use KOS again, but in a new setting, a Six Sigma project. I had the idea that it could be used as a ‘mining tool’ in a project where there was a limited amount of data, i.e. a so-called ‘process door’ project. I also wanted to make KOS ‘more scientific’, i.e. to connect my ideas about KOS to other – more theoretical – research on misunderstandings conducted within Quality Sciences. When I read the Licentiate thesis of Christina Mauléon, a colleague at Chalmers University of Technology, I realised she had the theoretical knowledge I lacked. For her, KOS was a practical solution to the problem of how to achieve ‘common concepts for common action’, as stated by C.I. Lewis in 1929. Together we developed KOS further into what is now presented in the appended paper.
4.5.2. Purpose of the paper
In today’s highly specialised knowledge community, misunderstandings often lie hidden behind specialised languages in different knowledge domains (see e.g. Argyris et. al., 1985; Naess, 1968). One of the main sources of inspiration for the founders of the quality movement was the conceptualistic pragmatist C. I. Lewis who argued for the importance of common concepts to avoid misunderstandings (Lewis, 1929). More than three quarters of a century later, the need for common concepts has not decreased. To the contrary, the purpose of modern quality management initiatives like e.g. Six Sigma and Design for Six Sigma is to find root causes to quality problems, such as failing to meet customer expectations about delivery and functionality of products and services. Even though these failures are normally defined in a technical manner, the underlying root causes can often be traced back to misunderstandings between people. Tools and methods of quality management are often based on measurements and quantifications of process characteristics, but misunderstandings are hard to measure. There is still a need for a method that helps to reveal hidden misunderstandings between people who talk and work together. The paper presents a ‘tool’ for this, Knowledge Overlapping Seminars - KOS.
Six Sigma Management - Action research with some contributions to theories and methods - Peter Cronemyr
79
4.5.3. Findings of the paper
4.5.3.1. Knowledge Overlapping
Davenport and Prusak (1998) examine the work of Allen (1977) and Nonaka (1994) and conclude: “Giving people who work together at the same location opportunities to talk to one another does not by itself solve the problem of transferring knowledge [...] We also need to consider more formal and intentional ways of sharing knowledge within organizations” (Davenport and Prusak, 1998, p.95). Davenport and Prusak define ‘to transfer knowledge’ as ‘to share knowledge within organisations’. We use the term ‘knowledge overlapping’ in the sense of creating a ‘shared language’ between knowledge domains, i.e. ‘common concepts’ that make it possible to discover previously unknown misunderstandings. But what prevents knowledge overlapping in ‘ordinary’ meetings and seminars? Allen (1977) identifies prestige as the major obstacle. “An engineer’s prestige among his colleagues is founded to a great degree upon an almost mystical characteristic called ‘technical competence’. To admit a lack of technical competence, especially in an area central to the engineer’s technological specialty, is to pay a terrible price in terms of lost prestige.” (Allen, 1977, p.193). This could suggest that, for a method to be successful in facilitating knowledge overlapping, the design of the method needs to consider prestige as a possible obstacle.
As a way to facilitate knowledge overlap which we here argue is a solution to create common concepts we can take the example of Allen (1977) and Nonaka (1994): strategic rotation. They argue that moving people around at departments is an efficient way to build knowledge overlap (Nonaka uses the term ‘redundancy’) in an organisation but, in our experience, rotation is a way to build knowledge overlapping in the long term. The disadvantage of rotation of people is that it takes time and too much rotation does not allow people to get skilled in a certain task. There is a need for a method that quickly increases knowledge overlap between project team members from different knowledge domains without constantly re-defining their tasks. What is needed is some kind of meeting or seminar where the members of a team guide one another in domain specific knowledge. The condition to strive for is where the team members know enough about other domains to realise when their actions are creating or may create problems in other areas.
4.5.3.2. KOS – The Design
A Knowledge Overlapping Seminar (KOS) is designed in such a way that obstacles to knowledge overlapping in other types of meetings are avoided. KOS is defined by some simple rules:
• There is a guide who holds the seminar and talks about his/her domain specific knowledge in relation to the project goal (the guide is a single representative from his/her domain)
• The other participants all come from the same knowledge domain but a different one than the guide.
Six Sigma Management - Action research with some contributions to theories and methods - Peter Cronemyr
80
• There is a facilitator whose role it is to be the one who can go in and ask the so-called ‘silly questions’ (the facilitator is not from any of the present domains and not a manager).
• The guide and the participants have previous experience of working together and are formulating a common task and goal in a start-up meeting.
Failure to comply with these rules often leads to the introduction of prestige in the seminar – similar to other types of meetings – which prevents the creation of knowledge overlapping; hence ‘hidden’ misunderstandings between the team members are not found.
4.5.3.3. Application of KOS in a Product Development project team
A start-up meeting and six KOS seminars were conducted in a Gas Turbine Development team in 1999. The three knowledge domains were: Mechanical Design, Aerodynamic Design and Mechanical Integrity (i.e. stress and dynamics). Four engineers from each domain participated.
As a practical result, the participants became aware of several misunderstandings - unknown until KOS. The team members felt truly comfortable with the fact that one major misunderstanding was revealed at that phase of the project. It otherwise could have turned out to be a major - very expensive - problem later in the project when hardware had been manufactured and tested or, even worse, it may have appeared during the customer’s operation of the machine. The cost in terms of man-hours spent on KOS was comparatively very small.
Analysis of questionnaires before and directly after KOS shows that 45% of the participants had classified their knowledge of the other domain as deeper after KOS than before. Also, after KOS, 69% of the participants said that their knowledge had increased. The reason why more said their knowledge had increased than that it had deepened was given as comments to the questionnaires. “I thought I had deep knowledge about the other domain. Now I know that it was superficial.” Altogether, 86% of the participants gained new knowledge and/or deepened their knowledge about other domains.
Directly after KOS all participants thought – 45% of them were sure – that they would have good use and benefit from the knowledge gained at these KOS. One month after KOS the percent who were sure had increased to 64%.
Semi-structured interviews were carried out approximately one month after the six seminars. Each person was interviewed for approximately half an hour. After the interviews, similar answers were grouped together. The most common opinions were:
• The formulation of the common task in the start-up meeting improved the integration within the team. It was further improved by the six seminars.
• The possibility to ask questions was appreciated. In ordinary meetings the team members do not ask questions because: 1) There is no time, 2) One does not want to ask ‘silly’ questions and 3) One does not know what to ask. These obstacles were not present in KOS.
Six Sigma Management - Action research with some contributions to theories and methods - Peter Cronemyr
81
4.5.3.4. Application of KOS in a Six Sigma project team
A start-up meeting and six KOS were conducted in a Six Sigma project team at the Service Division in 2006. The three knowledge domains were: Service Product Managers (they were not heads of departments but engineers with certain areas of responsibility), Product Support Engineers and Application Engineers. Three persons from each domain were appointed to participate in the seminars but because of other tasks and unplanned evens only two from each domain attended.
In the first KOS, it became obvious that the first and most important rule of KOS had been broken. The guide was not alone from her domain. When selecting participants, it had not been taken into account that one of the participants had previously worked in another role for quite a long time. Hence he “knew” everything about the guide’s domain but that was not the same knowledge that the guide possessed. Because of this, the general feeling of the researchers after the first KOS was that it had been a failure. Looking at it in hindsight, however, it is obvious that many of the misunderstandings that were found in the six KOS as a whole in the Six Sigma project team were already showing up in the first seminar.
The second KOS was conducted in the afternoon of the same day. The guide and participant had now changed places. Surprisingly everything went very well. The new guide guided the participants into his (new!) domain and since none of the participants had any previous experience of that domain they gained a great deal of new knowledge. Since the guide had previous experience in the participants’ domain he could use their language to explain exactly what he was doing in relation to the tasks of the participants.
The following four KOS generated “revelations” and “frustrations” to the participants. Some realised what they had to do – but did not do until now – while others realised that nobody received and accepted the issues that they were sending out in the organisation. This caused a small conflict between two of the domains, which was good, since they had the time and place to sort it out. After the KOS both domains were fully aware what had to be done in the future and why.
The root causes of the problem investigated in the Six Sigma project known before the six KOS were gathered in a cause and effect diagram. It consisted of 12 small branches. After the seminars the Six Sigma team gathered again and extended the cause and effect diagram with new findings. The number of small braches increased from 12 to 40. The most important root causes were clustered into five topics. These were classified according to the degree to which the root causes were found before, in or after KOS. Many of the main findings were suspected before KOS but were investigated thoroughly and verified in the seminars. Nothing was found after KOS that was already not found in the seminars.
Semi-structured interviews were carried out approximately one month after the six seminars. Each person was interviewed for approximately an hour. Recorded interviews were transcribed and similar answers were grouped together. The most common opinions were:
• Most participants said they were sceptical to KOS before the seminars - “Yet another three-letter abbreviation” - but they were very positive after participating.
Six Sigma Management - Action research with some contributions to theories and methods - Peter Cronemyr
82
• Formulating the common goal in the start-up meeting was “difficult” but “useful”.
• Misunderstandings were found and hence root causes of problems have been found on a deeper level than before.
• You realise others’ expectations about yourself. You develop more respect for others.
• Managers should not be present. If so, one would not put “silly” questions. Managers do not know the details of the domain in the way that others do.
4.5.3.5. Conclusions
KOS could be applied in a variety of projects but, as we have found in our study, it fits especially well in a Six Sigma project where there are limited amount of data to analyse, a so-called ‘process door’ project, which is very often the case. It is our recommendation that KOS be included as a standard tool in the Six Sigma toolbox taught in Six Sigma training.
The study has also demonstrated that successful implementation of KOS is likely to be enhanced by:
• obtaining the support of the management team;
• training a facilitator;
• identifying projects with participants from several domains;
• beginning with one project; and
• distributing the results to managers and the wider organisation.
Common excuses for not implementing KOS include the following:
• ‘No time, no available resources’;
• ‘Not invented here; hence does not work here’; and
• ‘Managers must be present in all meetings.’
These inadequate excuses should not be allowed to prevent KOS being implemented with success.
Although KOS has been successfully applied to two quite different types of projects, it is acknowledged that the applications that have been investigated are limited and that the results must be considered in context. More applications in other settings would be valuable in providing more generalisable results. Nevertheless, the paper has shown that KOS is a most promising methodology for application in projects with a view to achieving common concepts, fewer misunderstandings, better quality, and, ultimately, more satisfied customers.
4.6. Process improvement simulations (appendix F)
Title: A Decision Support Tool for Predicting the Impact of Development Process Improvements
Six Sigma Management - Action research with some contributions to theories and methods - Peter Cronemyr
83
Authors: Peter Cronemyr, Anna Öhrwall-Rönnbäck and Steven Eppinger Publication: Journal of Engineering Design, Vol. 12, No. 3, pp. 177-199 (2001)
4.6.1. History of the paper
The co-authors of this paper were Anna Öhrwall-Rönnbäck at Linköping University and Professor Steven Eppinger at the Sloan School of Management, MIT. Previous versions were presented at the ICED99 conference in Munich (Cronemyr, Öhrwall-Rönnbäck, and Eppinger, 1999) and as a chapter in the Licentiate thesis (Cronemyr, 2000:a).
In 1998 I attended a Ph.D. course called ‘Managing Engineering Design, based on information flows’, conducted within the ENDREA graduate school – the Swedish Engineering Design Research and Education Agenda – by Professor Steven Eppinger from the Sloan School of Management, MIT. In the course several different applications of the Design Structure Matrix (DSM) were studied and used for analyses of information flows and design dependencies. The Design Structure Matrix was originally developed by Steward (1981) and had been further developed by Eppinger, Whitney, Smith and Gebala (1994). Every course participant was required to write a paper on some application as a course assignment. The application of DSM that caught my attention was presented in a rather complicated paper on how to use eigenvalues and eigenvector analysis to identify iteration loops in a coupled (i.e. iterative) process. The extension of DSM was called the Work Transformation Model (WTM) (Smith and Eppinger, 1997).
At that time I was working in Gas Turbine R&D and was involved in process development but I also did some structural dynamics analysis, which was actually my task when I was employed at ABB STAL in 1996 (the company now called Siemens). Since I normally used eigenvalues and eigenvector analysis in structural dynamics analysis I realised that it could be used to simulate improvements to the iterative development process which I was mapping and developing as well.
I used the process maps that we had created in a project I was managing at ABB STAL, the Gas Turbine Blade Development Process, and the team members supplied the numbers I needed to develop and test the new simulation method based on WTM.
Another course participant, Anna Öhrwall-Rönnbäck, was interested in the idea and we teamed up on the paper. She used the process simulation method in a research project that she was conducting at Saab Aerospace. We also invited Professor Eppinger to co-author the paper.
This was my first real paper and it may differ somewhat from the other papers in this thesis. I will comment more on that later in the postscript. I will also suggest how the process simulation method could be used in a Six Sigma project, even though that has not been conducted yet.
4.6.2. Purpose of the paper
The paper presents a method for engineering design process improvement simulations. It uses the design structure matrix (DSM) developed by Eppinger et al. (1994) from Steward’s design
Six Sigma Management - Action research with some contributions to theories and methods - Peter Cronemyr
84
structure system (Steward, 1981) and an extension of DSM called the work transformation model (WTM) developed by Smith and Eppinger (1997). We introduce two new concepts, total process time (TPT) and simulated ‘to-be’ ‘as-is’ ratio (STAR). The method can be used by process teams to give priority to the most valuable process improvements, among several suggested ones, before they actually take place. Application to gas turbine blade development is presented. (An application to buyer-supplier cooperation in Aircraft Development is also presented in the paper but is not discussed in this summary.)
4.6.3. Findings of the paper
4.6.3.1. Iterations
Iteration inside and between project phases is common in high-tech product development. There are two ways to shorten the development time for a development project with iterations (Ulrich and Eppinger, 1995): i) de-couple tasks to avoid iterations or ii) perform the iterations faster. In the paper we present a method for simulating the impact on the development time from suggested process improvements such as avoiding or speeding up iterations. According to Wheelwright and Clark (1992), being a fast developer is the key to successful product development.
4.6.3.2. Process Modelling
We are studying process maps at a very low level, consisting of detailed activities. Flow charts describing sequential and parallel activities are often referred to as PERT (Program Evaluation and Review Technique) charts. The problem is that iterations cannot be modelled because arrows going ‘backwards in time’ are not allowed. Instead, the time required for iteration loops is estimated. In the flow chart the iterations are therefore kept inside ‘black boxes’. It is clear that flow charts with a time line are not very useful for mapping iterative processes since the iterations are invisible, and consequently uncontrolled. However, the use of detailed flow charts is an intermediate step towards developing a design structure matrix (DSM) and a work transformation model (WTM). In a WTM the strength of dependency between process activities, expressed as rework fractions, is modelled and stored in a so-called transformation matrix. WTM assumes that all activities are carried out in parallel at the same time. The assumption of fully parallel activities is acceptable for highly coupled, i.e. iterative, processes but does not correspond to a fairly sequential process. Another assumption is that the transformation matrix is static and linear. It does not change with time and there are no ‘what-ifs’, i.e. no conditional relations. In a changing process, these are somewhat heavy assumptions and the WTM may not be reliable. Another fundamental assumption is that there is no noise, i.e. no stochastic variation, in the process. To deal with, that another approach has to be used, e.g. robust process design (Phadke, 1989, or Bergman, 1992).
4.6.3.3. Process Improvement Simulations
The work time required for each activity in each iteration step is calculated using matrix algebra (see appendix F). First the total work times for all activities are summarised for each iteration step. All steps are then summarised into the total process time, TPT. Given the right conditions the iteration will converge. As it was found in practical applications, the iteration
Six Sigma Management - Action research with some contributions to theories and methods - Peter Cronemyr
85
may be truncated after only very few iterations. The simulations presented in the paper were often truncated after ten iterations (see Figure 17).
TPT expressed as an absolute value is of somewhat limited value, however. Instead, TPT for the given ‘as-is’ process and TPT for the changed ‘to-be’ process are related. The change introduced to the process, e.g. a new work method, is a ‘small disturbance to the system’. Hence the simulated ‘to-be’ ‘as-is’ ratio, STAR, is a sensitivity measure of a suggested improvement as a linearisation around a given process.
STAR = TPTto-be / TPTas-is
STAR is a relative measure of the overall impact of a suggested process improvement.
One question that emerges is what improvements should be suggested. There may have been several suggestions already before the process map was developed, and those could of course be examined, but there is another way to find out where potential improvements could have the greatest effect: to use eigenvalue and eigenvector analysis. This is very useful but it is not described further in this summary. See the paper in appendix F for more details.
4.6.3.4. Application to Gas Turbine Blade Development
The method was applied at ABB STAL. The most critical parts in a gas turbine are the blades. Due to the extreme technical demands on gas turbine blades, the development of the blades is a very complicated, coupled process. It includes a number of specialists from several technical domains. As Allen (1977) found it is an important but difficult task to get integration across boundaries between specialised engineering domains. In an effort to achieve increased integration, a project was launched at ABB STAL with the mission to map the ‘as-is’ process and to suggest a ‘to-be’ process for gas turbine blade development.
The ‘as-is’ process map was developed over a period of several months by a small project team consisting of seven engineers normally working with gas turbine blade development. The process was highly coupled. Hence the map was transformed into a DSM and, from that, an activity time matrix and a transformation matrix for the ‘as-is’ process were created.
One process improvement that was suggested was a change of CAD/CAE software. The discussion concerning a choice of a common CAD/CAE software for mechanical designers and stress engineers had been going on for some time. Therefore, a study was made with the purpose of measuring the finite element modelling time, both with original and modified geometry, first with common and then with different CAD/CAE software at the different departments.
Results of simulations (see Figure 17) showed that the simulated ‘to-be’ process, compared to the ‘as-is’ process, has STAR=0.83, i.e. the overall development time for the gas turbine blades would decrease by 17% if the departments used a common CAD/CAE software. Since 17% of the total person hours for such a development project is a great deal of money, the company decided to make the suggested investment. After some months of implementation problems the simulated improvements were realised.

Six Sigma Management - Action research with some contributions to theories and methods - Peter Cronemyr
86
Figure 17. Results from simulations. To-be TPT is 17% lower than As-is TPT, hence STAR=0.83.
4.6.3.5. Conclusions
A task based design structure matrix is one of very few tools for mapping and visualising iterative processes. From a DSM, it is easy to get a holistic view of a complex development process where flow charts become too complicated.
The method for process improvement simulations presented in the paper demands a detailed process map. One could argue that the main process improvements come from the knowledge gained from the process mapping itself. Once the map exists the suggestions for improvements become obvious. On the other hand, the authors’ experience in process development is that it is difficult to get the authority to implement major changes in an organisation if one cannot show some estimate of the payback on the investment.
The simulated ‘to-be’ ‘as-is’ ratio, STAR, is an estimation of this kind, since it quantifies the impact on the overall process performance from a suggested improvement.
4.6.4. Postscript
4.6.4.1. In the beginning…
Even though it feels like a very long time ago since I wrote this paper – eight years – I still think the process simulation method is a very good tool. When I wrote the paper I had very little knowledge of variation in general and Six Sigma in particular. It can be seen that I was a ‘deterministic engineer’, trained in structural dynamics and aerodynamics, but with very little knowledge of ‘probabilistic disciplines’. The method was based on the assumption that there were no variations in re-work fractions and task duration times. I wrote “To deal with that, another approach has to be used, e.g. robust process design”. I still think that is true but I must admit I did not know very much about robust design at the time. I am certainly no expert today, but I know much more than I did in 1999.

Six Sigma Management - Action research with some contributions to theories and methods - Peter Cronemyr
87
In hindsight, another observation is interesting. I wrote: “As Allen (1977) found it is an important but difficult task to get integration across boundaries between specialized engineering domains. In an effort to achieve increased integration, a project was launched at ABB STAL with the mission to map the ‘as-is’ process and to suggest a ‘to-be’ process for gas turbine blade development.” Here the idea of ‘improving integration across boundaries between specialised engineering domains’ emerges for the first time. That later evolved into both the Process Management Model and Knowledge Overlapping Seminars that became other papers.
4.6.4.2. Including variation and sensitivity
As mentioned, our method was deterministic without taking variation and sensitivity into account. Some years after publication in the Journal of Engineering Design, another paper was published by Stuart Wright at MSC Software Corporation, presenting an extension to our method. In the paper, ‘Predicting and Measuring The Value in Process Change: A method and automation tool to qualify process improvement investment’ (Wright, 2004), he presented an Excel-based DSM Process Analysis tool based on our method with the extension of including process variability.
“A stochastic engine has been devised and included. In the stochastic analysis the tool assumes the deterministic data values to be mean data values and permits definition of a standard deviation of each individual data value. Thus variability matrices are created quickly for all process data. Once defined a stochastic process analysis, analogous to a robust design evaluation, is completed. The tool does this using a Monte-Carlo algorithm to sample every data value in the deterministic data set for a unique value with a normal statistical distribution.” (Wright 2004, p.4).
Even though limited details are provided in the paper to be evaluated, Wright gives some results of a stochastic analysis of this kind, see Figure 18.
Figure 18. Sample Results from Stochastic Analysis of As-Is Process (from Wright, 2004)
Six Sigma Management - Action research with some contributions to theories and methods - Peter Cronemyr
88
The charts to the left in Figure 18 show the iteration history of Total Process Time (TPT) and Total Process Cost (TPC). The calculations are truncated after six iterations. Each chart shows an envelope of max/min values (orange) and an average (red). The max, min and average values (after six iterations) can also be seen in the charts to the right, showing the distributions of Total Process Time and Total Process Cost, attained from Monte Carlo simulations. A visual inspection of the charts indicates that the outputs are normally distributed, but there is no information on the distributions of the input variables.
I think it is a very good extension to our method but, in addition to the distributions of the outputs TPT and TPC, I would like to include a sensitivity analysis in order to determine which process steps contribute most to the variation of the outputs. This is recommended as future research.
4.6.4.3. Possible application to a Six Sigma project
In his paper Wright also indicates – in one sentence only – that the tool can be used in Six Sigma/DfSS projects (Wright, 2004, p.1). That is exactly what I propose.
In the analysis phase of a Six Sigma project the method could be used to identify root causes for variations in the outputs. Furthermore, in the improve phase, it is often good to make simulations of different alternative improvements before going into pilot testing. If one has an iterative process, normal simulation tools, based on assumptions of sequential or parallel tasks, can not be used. The STAR simulation method could then be used.
Since coupled iterative processes are most common within advanced product development process but not very common in service delivery processes this method has not (yet!) been used in the Service Division.
As a general tool, it could be included in the Six Sigma toolbox, especially if variation and sensitivity analyses are included.
Six Sigma Management - Action research with some contributions to theories and methods - Peter Cronemyr
89
5. Conclusions and reflections of the thesis In this, the last, chapter I will summarise the conclusions of the thesis and make some reflections on Six Sigma and research. I give some recommendations for future research and end with some final words.
The general research question of the thesis was how to implement and get the full potential out of Six Sigma in an industrial context. I can not claim to have given the complete answer to that, but many small pieces of the answer have been presented. Lessons learned about ‘how to do’ and ‘how not to do’ can be identified in the Siemens case study. Some ideas for new and improved ways of conducting and implementing Six Sigma have also been given.
5.1. The main conclusions
The conclusions from the different papers were given in detail in Chapter 4. They are summarised below.
5.1.1. Success factors for implementing Six Sigma
The most important success factors for implementing Six Sigma at Siemens were:
• Management commitment; without it, forget it
• Committed driver; that was me
• Learn from history; failure is a goldmine
• Integration of Six Sigma and Process Management; organise as one
• Process perspective; use processes as common mental models
While ‘Management commitment’ is commonly mentioned in the literature as a success factor, the other success factors selected from the Siemens case study are not. The main problem with this is that it may give the impression that ‘Management commitment’ is the only important success factor. At Siemens, ‘Management commitment’ was indeed very important. When we did not have it Six Sigma failed, but we later succeeded when the management were committed and we fulfilled the other important success factors. Without for example a process perspective, people do not see incidents as something recurring, but instead try to fix each problem as though it were a one-time error. Without an integration of Six Sigma and Process Management, Black Belts and Green Belts are left on their own, without process owners shouldering their full responsibility of selecting, supporting and taking over results from the Six Sigma projects, i.e. the management continue to work with ‘business as usual’. To learn from history is nothing else than the Shewhart cycle and continuous improvement. If an organisation does not have this as natural way of working, my view is that they are not ready for Six Sigma. Finally, I was the committed driver. Even if management really want and try to change their behaviour, without the support and knowledge of a committed driver, there is a risk of ending up with ambitions and decisions without any action. I do not think I am unique. I am quite confident that someone else with the same knowledge and commitment could have achieved the same results.
Six Sigma Management - Action research with some contributions to theories and methods - Peter Cronemyr
90
5.1.2. Selection of Six Sigma projects
This thesis does not present a thorough investigation of different ways of selecting Six Sigma projects. That has not been the intention, but some approaches that have been mentioned are: To use gaps in KPI performance from BSC follow-up; To use operative feedback from line managers and process owners; To use suggestions from employees.
In two of the appended papers we present an alternative approach for selecting Six Sigma projects based on recurring faults and customer feedback. The conclusion made from using such an approach is that it leads to more customer focused projects instead of cost-cutting. It also clearly demonstrated the importance of having a process perspective instead of a product perspective.
Neither of the different project selection methods should be selected as the only – the best – way of selecting Six Sigma projects. Instead, a mix will assure good projects of different types, fulfilling different demands and needs of the organisation and of the customers.
5.1.3. Selection of Six Sigma roadmaps
An important pre-requisite when implementing Six Sigma – mentioned as the success factor called ‘Project selection and methodology selection’ – is that Six Sigma in itself must actually work as a process improvement methodology.
As it was found, if DMAIC is used ‘by-the-book’ in projects meant to improve out of control processes, it may fail. Since most processes are out of control when a Six Sigma programme is started in a company, this is a major threat to the success of Six Sigma. By choosing methodology based on the state of the process to be improved, as described in the paper in appendix D, this threat can be minimised.
A new roadmap, DMADC (Define, Measure, Analyse, Design, Control), is suggested, to be used when improving ‘processes on the brink of chaos’. It is a combination of the tools in DMAIC (used in normal Six Sigma) and DMADV (used in Design for Six Sigma).
It is a mystery to me why this has not been dealt with in the Six Sigma literature before. Maybe it is a symptom of the lack of integration between Six Sigma and Process Management, since process control – the topic of Wheeler’s book (Wheeler, 2000) – is a central part of Process Management but is sometimes taken for granted in Six Sigma. As suggested in appendix D, normal Six Sigma, i.e. DMAIC, works well in processes in ‘the threshold state’, i.e. processes in control, but may not always work in processes ‘on the brink of chaos’, i.e. processes out of control.
5.1.4. Tools for the ‘process door’ in Six Sigma projects
There are two approaches for Six Sigma projects: the so-called ‘data door’ and the so-called ‘process door’. In the beginning, Six Sigma was built around tools for statistical analysis of measured data, but Six Sigma has evolved and today is also used to improve processes where there is a limited amount of data to analyse. This type of approach is called the ‘process door’
Six Sigma Management - Action research with some contributions to theories and methods - Peter Cronemyr
91
in contrast to the traditional ‘data door’ approach. A shortcoming of most Six Sigma training material that has been identified is that it deals with ‘process door’ analysis in a very limited way when, in reality, many projects are in fact process door projects. Detailed process mapping and cause-and-effects analysis are commonly used in the process door, but these are not very effective when used on their own. They need to be complemented by tools that assist a Six Sigma team in finding root causes on a deeper level. Two new tools that can be used in process door projects are presented in this thesis.
The first tool, KOS (Knowledge Overlapping Seminars, see appendix E), is a method that can be used to reveal hidden misunderstandings between people from different knowledge domains. As was found, hidden misunderstandings were normally not revealed in ordinary meetings, e.g. Six Sigma team meetings. KOS could thus be used in a Six Sigma project with the process door approach, but it could also be used in other settings, e.g. product development projects. Twelve KOS were conducted in two different applications and proved to be a very efficient tool for finding root causes on a deeper level. The root causes of a problem investigated in a Six Sigma project known before conducting KOS were gathered in a cause-and-effects diagram consisting of 12 small branches. After conducting KOS the Six Sigma team extended the cause-and-effects diagram with new findings. The number of small braches increased from 12 to 40. According to the participants, this helped the project a great deal, compared to what would have been achieved by detailed process mapping only.
Another tool, Process Improvement Simulations (see appendix F), is a method for simulating improvements of iterative processes. Such processes are especially common within product development. The problem is that these processes can not be simulated with normal methods since normal methods can not deal with iterations, while the proposed method can. It can be used in the Analyse phase of a Six Sigma project to find weaknesses, i.e. sources of re-work, in a process where there are limited historical data to analyse. The method could also be developed further to make it possible to perform sensitivity analyses in order to find sources of variation in the process. In the Improve phase it can be used to simulate and select improvements, i.e. to ‘practise swimming on land’, before actually making any changes in the real process. In one application a proposed change of CAD software in a major product development project was simulated before it was actually carried out. Without the simulation it is unlikely that management would have decided on the costly change. The simulated savings in man-hours were later verified. This method is very promising, especially for improving iterative processes, but still needs some development.
5.1.5. Action research
Another conclusion worth mentioning is that the action research methodology has been very useful. I have taken on the role of a ‘practitioner action researcher’, and partially a ‘retrospective action researcher’ in the meaning of Gummesson (2000), a privileged role in industrial research. A ‘traditional’ researcher employed by a university does not normally have the same access to data, including historical facts and contact networks, or the possibility to try out new ideas. On the other hand, he/she may have the advantage of not having to justify his/her motives as thoroughly as a ‘practitioner action researcher’.

Six Sigma Management - Action research with some contributions to theories and methods - Peter Cronemyr
92
5.2. Reflections
5.2.1. Where are we going with Six Sigma?
Returning to the question posed by Watson (2005): “A proactive human-focused business environment can be developed only when both the hard, analytical disciplines and the soft, psychological disciplines merge into a unified approach for managing results through people. How will the future migrate from the current state to establish the context for this integration?” (Watson, 2005, pp. 322-323). In my opinion, the last word, ‘integration’, is the key word.
While some may think of integration as ‘mixing up things’, to me integration means ‘having a holistic view’. This makes it possible to achieve ‘global objectives’ without ending up sub-optimising. One should not confuse ‘integration’ with ‘harmonisation’, which instead aims at reducing variation. That could be very good when improving a process, for example, but not necessarily when talking about how to implement Six Sigma. It is too contextually sensitive.
It is my belief that what Six Sigma needs is more integration, i.e. integration of:
• Six Sigma and Process Management (see appendix A)
• Normal Six Sigma and Design for Six Sigma (see appendix D)
• Hard, analytical disciplines and soft, psychological disciplines (see e.g. Wiklund and Sandvik-Wiklund, 2002)
• Quantitative and qualitative methods (see Chapter 3.1)
• Six Sigma and other improvement initiatives (see e.g. Daly et. al., 2004).
The question is how to achieve this integration. I believe Watson has already given the answer himself: “when both the hard, analytical disciplines and the soft, psychological disciplines merge into a unified approach for managing results through people.” I believe the findings of this thesis bring some light to Watson’s question since the concept and implementation of Six Sigma Management at Siemens in Finspong has partly accomplished this. We had to deal with both ‘hard’ and ‘soft’ issues – and did so – to become successful. No one was punished for failures; instead failures were used as ‘goldmines’. The implementation was conducted in a culture based very much on participation and support of, and respect for, the individuals in the organisation, founded in democratic values.
Does this mean that Six Sigma Management only works in Sweden? I do not know. How should it be organised in another culture? I do not know. I hope I have contributed some interesting questions. These questions are left for others to write theses about.
5.2.2. Quantitative vs. qualitative methods
This research project was conducted as action research – in contrast to positivistic ‘normal science’ – because of the collaborative nature of the development of Six Sigma Management at Siemens. But one question then becomes unavoidable: Why introduce a ‘scientific’, i.e. a
Six Sigma Management - Action research with some contributions to theories and methods - Peter Cronemyr
93
positivistic, method such as Six Sigma if collaborative methods give better results? Reflecting on the words of Marvin Weisbord: “[Kurt] Lewin realised in 1920 that scientific management was incomplete. The old manager formula – planning, measuring, controlling, leading (a Frederick Taylor derivative) – sounds good, [but] it is very hard to apply today unless you include everybody. […] But Lewin added another value […] The new value was democracy.” (Weisbord, 1991, p. 95) Today this can be identified as one of the principles of ISO9001:2000; ‘Involvement of people’. What I have tried to show in this thesis is the importance in democratic values and collaborative actions when implementing Six Sigma Management. Hence, my conclusion is that it is easier to implement Six Sigma Management in a culture characterised as egalitarian and person-oriented – a so-called fulfilment-oriented culture, i.e. the upper-left corner in Trompenaars’ model of national patterns of corporate culture (Trompenaars, 1993; Crom, 2000; Schön, 2006) – than in hierarchical or task-oriented cultures where on the other hand ‘normal’ Six Sigma may work well as a scientific method, but then with other management styles. Some global managers in Siemens have suggested that I should help others at Siemens to do “like you did in Finspong”. I am not sure it would by default lead to success unless the culture of the local company supports it. A best practice may not be best when applied out of its context.
One reason that was identified for the successful implementation of Six Sigma Management at Siemens in Finspong was the collaborative approach of managers and employees, not just the scientific method itself. But, then again, Six Sigma is not only based on quantitative methods. As has been shown in Six Sigma projects carried out at Siemens, it is just as qualitative as quantitative. So, perhaps my research methodology dealing with how to implement Six Sigma and Six Sigma in itself are not that different. I believe so.
For me, action research is to create knowledge overlap between theory and practice. I want always to create more knowledge overlap between people. I see half full glasses everywhere. One could call that naïve but, to me, naïve is a positive word. To me, it means seeing possibilities and potentials in every situation without – and this is where the naiveté comes in – seeing the limitations and obstacles. Fortunately, I have received strong support and much ‘scientific advice’ from my advisers during the research process.
This is perhaps not the proper place to make such a confession, but I feel more like an inventor than a researcher. I like to invent things that realise potentials or are solutions to problems and – the research part of it – to describe and share new knowledge. That is what I have done in this thesis.
5.3. Recommendations for future research
In this thesis I have presented several new ideas that have been tested on a limited scale. They all need broader application to become more general and to find possible limitations. One could also put theoretical questions about these rather practical methods. Some are given below.
Six Sigma Management - Action research with some contributions to theories and methods - Peter Cronemyr
94
5.3.1. Six Sigma Management
Six Sigma Management is the concept of how to implement and integrate Six Sigma and Process Management. It has been tailored to fit a typical Swedish company. As I have indicated, it may not work in the other three corners of Trompenaars’ model (1993). It would be very interesting if someone tried. One could also extend the theoretical questions to look into factors such as company size, global vs. local company, markets and products, product vs. service focus etc.
5.3.2. Process Improvement System
The Process Improvement System (as a part of the Fault Report System) at Siemens is currently being upgraded and integrated into SAP. The Process Fault Report Process is still the same, even though the supporting systems have been upgraded. If the Process Fault Report Process should be used in another company or some other context, some things are needed. Processes must be defined and process owners must be appointed. According to this research the personnel must have a process perspective in order to be able to understand the concept of process faults. These constraints should be investigated further. It could be a very powerful method for steering process improvements from traditional cost cutting to more customer focused activities. Even though everyone – at least in the quality community – seems to agree on the importance of being customer focused, there still remains an opportunity to do research on how to become customer focused. How does one go from intentions to actions?
5.3.3. DMADC
Using DMADC in Six Sigma projects when improving processes on the brink of chaos is natural at Siemens in Finspong. From what I have heard from Black Belts at other companies, it is for them as well, but they do not know that it is called DMADC. They are simply frustrated that ‘by-the-book’ DMAIC does not work in their processes and they therefore take the ‘process door’ and perhaps use some extra tools such as QFD and Pugh. That is DMADC. If more researchers investigated and improved it, it may become an accepted roadmap. On a more theoretical level, one might wonder whether Six Sigma has become ‘a little bit of everything’. Even though it is based on the Shewhart cycle, is the ‘process door’ really Six Sigma as Bill Smith intended it? Another theoretical question to reflect upon is ‘how can we have processes that are out of control if we have a limited or no amount of data to analyse’. It is a chicken-or-the-egg paradox.
5.3.4. KOS
Knowledge Overlapping Seminars have been around for eight years now. All together, only twelve KOS have been conducted. Hopefully our paper (appendix E) will reach a broader audience once it is published. It would be very interesting for someone to test KOS in a context in which I am not present. The rules and the roles as defined in our paper may need to be adjusted to fit other settings. We have connected the basic theories of quality pioneers Shewhart and Deming, and their roots in conceptual pragmatism, to the practical method of knowledge overlapping. I am sure there are many more theoretical domains that may connect
Six Sigma Management - Action research with some contributions to theories and methods - Peter Cronemyr
95
to KOS or perhaps argue in favour of, or against, our ideas of knowledge, learning, transfer and sharing of ideas, mental models, social psychology etc. I see no limitations here.
5.3.5. Process Simulations
The method of process simulations with a simulated as-is to-be ratio can definitely be developed further. Variation and sensitivity analyses should be included to increase the usage, as partly done already by Wright (2004). If some researcher or practitioner developed the method further, it may perhaps become a general simulation tool in the Six Sigma toolbox. On a theoretical level, the method is firmly based on matrix algebra, as presented by Smith and Eppinger (1997). One question that remains, however, is that of what an iterative process is or, to put it in another way: ‘how many sequential and parallel (but not iterative) activities are allowed in the process for the method to work’. That should be investigated both theoretically and practically.
5.3.6. Action Research and Analytical Generalisation
Generalisation is not a prominent feature of action research. The purpose of action research is instead to achieve a performance target and to present what contributed to the desired change in a positive way and what was negative. The technique normally used for ensuring external validity is ‘Reader or user generalisability’. To make results from qualitative research more general Firestone (1993) proposed the technique of ‘Analytic generalisation’. That approach has, to some extent, been used in this project. I would appreciate if there were a more formalised way of using analytical generalisation when conducting action research. It is recommended that the relation between action research and analytical generalisation is investigated further and that analytical generalisation is included in text books on action research methodology.
5.4. Final words
My confirmation minister once told me “We humans have been given two great gifts – sense and sensibility – and the art of using both – in balance. In every situation you face, you will have to strike a balance.” While science in general, and Six Sigma in particular, are all about sense, in order to make them work in real life, one needs a good portion of sensibility. To be able to strike that balance, that is surely the most important success factor for implementing Six Sigma – as it is in life.
Six Sigma Management - Action research with some contributions to theories and methods - Peter Cronemyr
96
6. References Allen, T. (1977) Managing the Flow of Technology: Technology Transfer and the Dissemination of Technological Information Within the R&D Organization. MIT Press, Cambridge, MA.
Alvesson, M. and Sköldberg, K. (2000) Reflexive Methodology. Sage, London, England.
Antony, J. and Banuelas, R. (2002) Key ingredients for the effective implementation of Six Sigma programme, Measuring Business Excellence, Vol. 6 pp. 20–27.
Argyris, C., Putnam, R., Smith McLain, D. (1985) Action Science. San Francisco: Jossey-Bass Publishers.
Atwood, Jonathan (2005) Benchmarking. Using Design for Six Sigma. iSixSigma Magazine, July/August 2005. Volume 1, Number 4.
Bergman, B (1992): Industriell försöksplanering och robust konstruktion (in Swedish; English translation: Industrial design of experiments and robust design). Studentlitteratur.
Bergman, B., and Klefsjö, B. (2003) Quality from Customer Needs to Customer Satisfaction, McGraw-Hill, New York. 2nd ed.
Blake, R. R. and Mouton, J. S. (1984) Consultation. A handbook for Individual and Organizational Development. Addison-Wesley Publishing Company.
Book, S. (2006) Naturalizing quality management : a problem of organizing in processes of change. Ph.D. thesis. Division of Quality Sciences. Chalmers University of Technology.
Campbell, D. T. (1986) Relabeling internal and external validity for applied social scientists. In: Trochim, W. M. K. Advances in quasi-experimental design and analysis, no. 31 (pp. 67-78), San Francisco: Jossey-Bass.
Chadwick, G. C. (2007). Remembering Bill Smith, Father of Six Sigma. iSixSigma Magazine, January/February: 74-76.
Chowdhury, S. (2002) Design For Six Sigma. Financial Times Prentice Hill, London.
Collier, J. (1945) United States Indian Administration as a Laboratory of Ethnic Relations, Social Research, 12, 275-276.
Collins, R. (1984) Statistics versus words. In: Collins, R. (ed.) Sociological Theory. San Francisco: Jossey-Bass. (pp. 329-362)
Crom, S. (2000) Implementing Six Sigma in Europe: a cross-cultural perspective, Quality Progress, October, pp. 73–75.

Six Sigma Management - Action research with some contributions to theories and methods - Peter Cronemyr
97
Cronemyr, P. (2000:a) Towards a Learning Organisation for Product Development. Licentiate Thesis, Division of Quality Technology and Management, Department of Mechanical Engineering, Linköping University, Linköping, Sweden.
Cronemyr, P. (2000:b) Knowledge Overlapping Seminars. In the proceedings from SIGPM conference, Linköping.
Cronemyr, P. (2006) DMAIC and DMADV – Differences, similarities, and synergies. In the proceedings from Quality Management and Organisational Development International Conference 9 -11 August 2006 Liverpool .
Cronemyr, P. and Mauléon, C. (2006) Improving understanding between people from different knowledge domains in Knowledge Overlapping Seminars. A theory of quality perspective. In the proceedings from Quality Management and Organisational Development International Conference 9 -11 August 2006 Liverpool .
Cronemyr, P., A. Öhrwall-Rönnbäck and S. D. Eppinger (1999): Process Improvement Simulations Using the Work Transformation Model. In the proceedings from ICED99, 12th International Conference on Engineering Design, Munich, Germany, August 24-26.
Daly, D., Dowdle, P., McCarty, B., and Stevens, J. (2004) Process Based Management: A foundation for Business Excellence. CAM-I
Davenport, T. H. and Prusak, L. (1998) Working knowledge: how organizations manage what they know. Harvard Business School Press.
Dawkins, R. (2006) The God Delusion. Brantam Books.
Dewey, J. (1910) How We Think. Dover Publications; New Ed edition (July 10, 1997)
Eckes, G. (2001) Six Sigma Revolution: How General Electric and Others Turned Process Into Profits. John Wiley & Sons.
Emond, T. and Hansson, B. (1995) Vad är filosofi? Akademiförlaget, Göteborg.
Eppinger, S. D., Whitney, D. E., Smith, R. P., and Gebala, D. A. (1994) A Model-based Method for Organizing Tasks in Product Development, Res. Engineering Design, 6, 1, 1-13.
Firestone, W. (1993) Alternative Arguments for Generalizing from Data as Applied to Qualitative Research. Educational Researcher, Vol. 22, No. 4, May, pp. 16-23.
Fishman, D. (1999) The case for pragmatic psychology. New York University Press.
French, W. L. and Bell, C. H. (1973) Organization Development. Behavioral science interventions for organization improvement. Englewood Cliffs: Prentice Hall (6th ed. 1999)
Fundin, A. and P. Cronemyr (2003): Use Customer Feedback To Choose Six Sigma Projects. Six Sigma Forum Magazine. November: 17-21
Six Sigma Management - Action research with some contributions to theories and methods - Peter Cronemyr
98
Glaser, B. G. (1978) Theoretical Sensitivity, Mill Valley: The Sociology Press.
Glaser, B. G. and Strauss, A. L. (1967) The Discovery of Grounded Theory: Strategies for Qualitative Research, Weidenfeld and Nicholson, London.
Goldstein, M. D. (2001) Six Sigma programme Success Factors, Six Sigma Forum Magazine, Vol. 1, pp. 36–45.
Gould, S. J. (1981) The Mismeasure of Man. (Revised and expended 1996). W. W. Norton and Company, New York.
Gummesson, E. (2000) Qualitative Methods in Management Research, 2nd ed. Sage Publications, Newbury Park. (1st ed. 1991)
Hammer, M. (2002) Process management and the future of Six Sigma. MIT Sloan Management Review. Vol. 43e No. 2
Hammer, M. and J. Champy (1993). Reengineering the Corporation: a Manifesto for Business Revolution. New York, Harper Business.
Hellström, A. (2006) Conceptions Of Process Management – An Analysis Of The Discourse In The Management Literature. In the proceedings from QMOD Liverpool.
Hellström, A. (2007) On the Diffusion and Adoption of Management Ideas: Findings from six empirical studies in the quality field. Ph.D. thesis. Division of Quality Sciences. Chalmers University of Technology
Henderson, K. M. and Evans, J. R. (2000) Successful implementation of Six Sigma: benchmarking General Electric Company, Benchmarking: An International Journal, Vol. 7, pp. 260–281.
Janssen C. (1982) Personlig Dialektik. 2nd ed. Stockholm: Liber.
Juran, J. M. (1998) Juran’s Quality Handbook, fifth edition, McGraw-Hill.
Kaplan, R. S. and Norton, D. P. (1992) The Balanced Scorecard – Measures that drive performance. Harvard Business Review, January-February.
Karlsson, S. and Sandvik-Wiklund, P. (1997) Critical aspects of quality method implementation. Total Quality Management, vol. 8, no. 1, pp. 55-65.
Kelly W. M. (2002) Three Steps to Project Selection. Six Sigma Forum Magazine, Vol. 2, No. 1, pp. 29-32.
Klefsjö, B., Bergquist, B. and Garvare, R. (2007) Quality Management and Business Excellence, Customers and Stakeholders – Do we Agree on What We are Talking About, and Does it Matter? In the proceedings from QMOD Helsingborg.
Six Sigma Management - Action research with some contributions to theories and methods - Peter Cronemyr
99
Kvale, S. (1983) The qualitative research interview. Journal of Phenomenological Psychology, vol. 14, no.7, pp.171-196.
Kvale, S. (1994) Ten standard objections to qualitative research interviews. Journal of Phenomenological Psychology, vol. 25, no.2, pp.147-173.
Lewin, K. (1946) Action Research and Minority Problems, Journal of Social Issues, vol. 2, no. 4, 34-46.
Lewin, K. (1947) Group Decisions and Social Change. In: Newcomb, T. M. and Hartley, E. L. (Eds.), Reading in Social Psychology. New York: Henry Holt and Company.
Lewis, C. I. (1929) Mind and the world-order : outline of a theory of knowledge. New York: Dover Publications.
Lincoln Y. S and Guba, E. G. (1985) Naturalistic Inquiry. Sage, Newbury Park, California.
Magnusson, K., Kroslid, D., and Bergman, B. (2003): Six Sigma. The Pragmatic Approach. Second edition. Studentlitteratur, Lund.
Mauléon, C., Bergman, B. and Alänge, S. (2003) Common concepts for common action - sense making or senseless making in organisations? In the proceedings from the International Conference of European Group for Organizational Studies (EGOS), Copenhagen, Denmark, July 2003.
Mauléon, C. and Bergman, B. (2002) On the Theory of Knowledge in the Quality Movement - C.I. Lewis’ Contribution to Quality Pioneers. In the proceedings from the 8th Annual Research Seminar, Fordham University, New York. Feb. 2002, pp. 156-164
McGrath, A. (2004) Dawkins’ God. Genes, Memes, And The Meaning Of Life. Blackwell Publishing (2004)
Merriam, S. B. (1988) Case Study Research in Education. A Qualitative Approach. Jossey-Bass Inc. Publishers, San Francisco.
Naess, A. (1968) Empirisk semantik. Stockholm: Läromedelsförlagen Kungliga boktryckeriet.
Nonaka, I., (1994) A Dynamic Theory of Organizational Knowledge Creation. Organization Science, vol. 5, no. 1, pp. 14-37.
Normann, R. (1970) A Personal Quest for Methodology. Stockholm: Scandinavian Institute for Administrative Research.
Pande, P.S., Neuman, R.P. and Cavanagh, R.R. (2000) The Six Sigma Way: How GE, Motorola and Other Top Companies are Honing their performance, New York, NY: McGraw-Hill Professional.
Paulk, M. C., Curtis, B., Chrissis, M. B., and Weber, C. V. (1993) Capability Maturity Model, Version 1.1. IEEE Software, Vol. 10, No. 4, July, pp. 18-27.

Six Sigma Management - Action research with some contributions to theories and methods - Peter Cronemyr
100
Phadke, M. (1989) Quality Engineering using Robust Design, Prentice Hall, Englewood Cliffs, New Jersey.
Philips, D. C. and Soltis, J. F. (1991): Perspectives on Learning. Teachers Collage Press, New York.
Rentzhog, O. (1998) Processorientering. En grund för morgondagens organisationer. Studentlitteratur, Lund (in Swedish).
Sagan, C. (1974) Broca’s Brain: Reflections on the Romance of Science. Random House USA Inc.
Sandholm, L. and Sörqvist, L. (2002) 12 Requirements For Six Sigma Success, Six Sigma Forum Magazine, Vol. 2, pp. 17–22.
Scaletta, T. (2006) Beyond process improvement: the pathway to process-based management. CMA Management, June/July, pp. 22-25.
Schön, K. (2006) Implementing Six Sigma in a non-American culture, Int. J. Six Sigma and Competitive Advantage, Vol. 2, No. 4, pp. 404–428.
Shewhart, W. A. (1931) Economic control of quality and manufactured product. Van Nostrand, New York.
Shewhart, W. A. (1939) Statistical method from the viewpoint of quality control. Graduate School of the Department of Agriculture, Washington D. C.
Smith, R. P. and Eppinger, S. D. (1997) Identifying Controlling Features of Engineering Design Iteration, Management Science, Vol. 43, No. 3, 276-293
Snee and Hoerl (2002) Leading Six Sigma: A Step-by-Step Guide Based on Experience with GE and Other Six Sigma Companies. Financial Times Prentice Hall.
Starrin, B. (1994) Om distinktionen kvalitativ-kvantitativ i social forskning. In: Starrin, Bengt & Svensson, Per-Gunnar (ed.) Kvalitativ metod och vetenskapsteori. Lund: Studentlitteratur (in Swedish)
Starrin, B., Larsson, G., Dahlgren, L., and Styrborn, S. (1991) Från upptäckt till presentation: Om kvalitativ metod och teorigenerering på empirisk grund. Studentlitteratur: Lund. (in Swedish)
Steward, D. V., (1981) The Design Structure System: A Method for Managing the Design of Complex Systems, IEEE Trans. Engineering Management, EM-28, 3, 71-74.
Svensson, L. and Aagaard-Nielsen, K. (2006) Action and Interactive Research. Beyond practice and theory. Shaker Publishing BV, Maastricht.
Thomas, W. I. (1928) The child in America: Behavior problems and programs (New York: Knopf, pp. 571-572).

Six Sigma Management - Action research with some contributions to theories and methods - Peter Cronemyr
101
Trompenaars, F. (1993) Riding the waves of culture: Understanding Cultural diversity in Business. New York, NY: McGraw-Hill Professional.
Ulrich, K. T. and Eppinger, S. D. (1995) Product Design and Development, McGraw-Hill
Watson, G. H. (2005) Design For Six Sigma. Innovation for Enhanced Competitiveness. GOAL/QPC Publishing, Salem, NH.
Weisbord M. R. (1991) Productive Workplaces: Organizing and Managing for Dignity, Meaning, and Community. Jossey-Bass.
Westcott, R. (2007) Process Improvement and Process Management. Quality Progress, Vol. 40, No. 6, June.
Westlander, G. (1998) Aktionsforskning (in Swedish; English translation: Action research). Research report, Royal Institute of Technology. Stockholm.
Westlander, G. (1999) Forskarroller i varianter av aktionsforskning (in Swedish; English translation: Researcher roles in action research). Research report TRITA 1999:24. Royal Institute of Technology. Stockholm.
Westlander, G. (2000) Data collection methods by question-asking. The use of semi-structured interviews in research. Research report TRITA 2000:8. Royal Institute of Technology. Stockholm.
Westlander, G. (2006) Researcher Roles in Action Research. pp. 45-61, in: Svensson, L. and Aagaard-Nielsen, K. (2006) Action and Interactive Research. Beyond practice and theory. Shaker Publishing BV, Maastricht.
Wheeler, Donald (2000) Understanding Variation – the Key to Managing Chaos. (Second edition). SPC Press, Knoxville.
Wheelwright, S. C. and Clark, K. B. (1992) Revolutionizing Product Development. Quantum Leaps in Speed, Efficiency, and Quality, The Free Press
Wiklund, H. and Sandvik-Wiklund, P. (2002) Widening the Six Sigma concept: An approach to improve organizational learning. Total Quality Management, vol. 13, no. 2, pp. 233-239.
Wright, S. (2004) Predicting and Measuring The Value in Process Change: A method and automation tool to qualify process improvement investment. In the proceedings from Virtual Product Development Conference, Huntington Beach, California.
Wurtzel, M. (2007) Can Six Sigma and Business Process Management Co-exist? [http://www.bpminstitute.org/articles/article/article/can-six-sigma-and-business-process-management-coexist.html] February 21, 2007


Appendix A Title Six Sigma Management
at Siemens
Paper title Six Sigma Management at Siemens. A personal case story
Author Peter Cronemyr
Publication Currently only published in this thesis (2007)

Six Sigma Management at Siemens – A personal case story. Cronemyr(2007)
A-1
Six Sigma Management at Siemens A personal case story
By
Peter Cronemyr*+ *Quality Sciences, Chalmers. +Siemens Industrial Turbomachinery AB, Finspong.
2007
Abstract
This is not a normal research paper but rather a personal story. The implementation of Six Sigma over a period of several years at Siemens Turbomachinery AB in Sweden is described in a longitudinal case study. Success factors for implementing Six Sigma are identified and compared to those given in the literature. The major conclusion is: to succeed with Six Sigma it should be integrated with Process Management. This can be done if you have management commitment and an organisation with a process perspective. The utilisation of IT support systems is recommended as the natural way to implement process improvements. The set-up of Six Sigma Management at Siemens is described in detail.
Contents
1. Introduction ........................................................................................................................2
2. The case study: the story of Six Sigma Management at Siemens ......................................3 2.1. The company ...........................................................................................................................3 2.2. The history of Process Management and Six Sigma before 2003 ...........................................4 2.3. Phase 1: Starting up Process Management and Six Sigma in the service division..................9 2.4. Phase 2: Moving Six Sigma into management ......................................................................24 2.5. Phase 3: Implementing Statistical Process Control ...............................................................32 2.6. Goals and directions for the future ........................................................................................37
3. Analysis and findings .......................................................................................................39 3.1. Learning from past failures – using PDSA............................................................................39 3.2. Dealing with crises – the PDSA cycle keeps spinning ..........................................................39 3.3. Success factors (SF) for implementing Six Sigma identified at Siemens..............................40 3.4. Summary of success factors identified ..................................................................................48 3.5. Some other success factors mentioned in the literature.........................................................49 3.6. ‘The chicken or the egg’ of Six Sigma Management ............................................................51 3.7. What are the results? .............................................................................................................51
4. References ........................................................................................................................53

Six Sigma Management at Siemens – A personal case story. Cronemyr(2007)
A-2
1. Introduction Since the widely spread process improvement methodology of Six Sigma was introduced by Motorola in the 1980s its usage has spread to all types of business processes and many now see Six Sigma as something much more comprehensive than just an improvement methodology. In some companies it has become a business strategy of top management (Antony and Banuelas, 2002). According to Gregory Watson (2005) the Six Sigma methodology has been developed and improved in academia and in business over a couple of decades. “Six Sigma is quite literally the product of decades of work by a community of people and has been honed into a set of core processes and key methods through its application in a number of “thought leading” organisations. […] Sometimes too academic and obtuse methods have been applied pragmatically to solve real problems and create a real competitive advantage” (Watson, 2005, p.320).
In this case study the implementation of Six Sigma and the evolution of what might be called Six Sigma Management during a period of several years at Siemens Turbomachinery AB in Sweden are described. So-called ‘success factors’ for implementing Six Sigma are identified and compared to those given in the literature. Some success factors identified have not been found in previous research presented in the literature.
The major conclusion in the Siemens case study is: to succeed with Six Sigma it should be integrated with Process Management. This can be done if you have management commitment and an organisation with a process perspective. The utilisation of IT support systems is recommended as the natural way to implement process improvements. The set-up of what I choose to call ‘Six Sigma Management’ is described in detail in this paper.
This is not a ‘normal’ research paper but rather a personal story. It is very much my own story, as much as the story of the company, hence I write in a rather personal style. The paper presents a thorough description of a change process that has taken place over many years. The story starts some ten years ago and the detailed description spans approximately four years. Many different topics are dealt with, often in chronological order. Each one of these may very well be the seed that could germinate into a ‘normal’ research paper. I would be happy to do so if and when it should come into question.
Furthermore, as this paper is not published except for in this thesis, the chapters on Research Methodology and Theoretical Frame of Reference are not duplicated in this paper. The reader is advised to see the thesis for those topics.
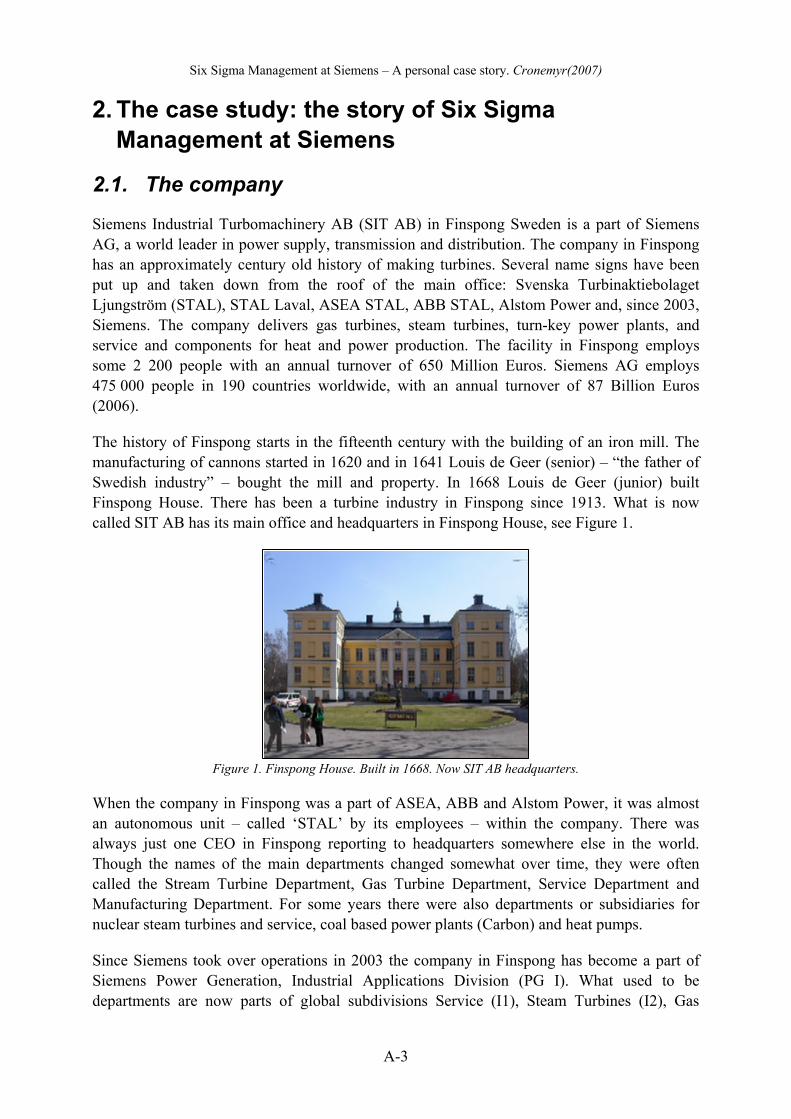
Six Sigma Management at Siemens – A personal case story. Cronemyr(2007)
A-3
2. The case study: the story of Six Sigma Management at Siemens
2.1. The company
Siemens Industrial Turbomachinery AB (SIT AB) in Finspong Sweden is a part of Siemens AG, a world leader in power supply, transmission and distribution. The company in Finspong has an approximately century old history of making turbines. Several name signs have been put up and taken down from the roof of the main office: Svenska Turbinaktiebolaget Ljungström (STAL), STAL Laval, ASEA STAL, ABB STAL, Alstom Power and, since 2003, Siemens. The company delivers gas turbines, steam turbines, turn-key power plants, and service and components for heat and power production. The facility in Finspong employs some 2 200 people with an annual turnover of 650 Million Euros. Siemens AG employs 475 000 people in 190 countries worldwide, with an annual turnover of 87 Billion Euros (2006).
The history of Finspong starts in the fifteenth century with the building of an iron mill. The manufacturing of cannons started in 1620 and in 1641 Louis de Geer (senior) – “the father of Swedish industry” – bought the mill and property. In 1668 Louis de Geer (junior) built Finspong House. There has been a turbine industry in Finspong since 1913. What is now called SIT AB has its main office and headquarters in Finspong House, see Figure 1.
Figure 1. Finspong House. Built in 1668. Now SIT AB headquarters.
When the company in Finspong was a part of ASEA, ABB and Alstom Power, it was almost an autonomous unit – called ‘STAL’ by its employees – within the company. There was always just one CEO in Finspong reporting to headquarters somewhere else in the world. Though the names of the main departments changed somewhat over time, they were often called the Stream Turbine Department, Gas Turbine Department, Service Department and Manufacturing Department. For some years there were also departments or subsidiaries for nuclear steam turbines and service, coal based power plants (Carbon) and heat pumps.
Since Siemens took over operations in 2003 the company in Finspong has become a part of Siemens Power Generation, Industrial Applications Division (PG I). What used to be departments are now parts of global subdivisions Service (I1), Steam Turbines (I2), Gas
Six Sigma Management at Siemens – A personal case story. Cronemyr(2007)
A-4
Turbines (I4), Power Plants (I5) and Solutions for Oil & Gas (I6). The subdivision for compressors (I3) does not exist in Finspong. The manufacturing department is now a part of I4 and, just recently, Plants (I5) has been incorporated in I4 as well. The local managers of the subdivisions in Finspong report directly to global managers somewhere in the world. The management of the whole PG I division is located in Germany.
This has had a big impact on the corporate culture, since ‘STAL’ is no longer an autonomous unit. Even though there is still a great deal of cooperation between departments in Finspong, there tends to be more and more coordination within the global subdivisions, which have shifted their focus from local cooperation to global business coordination. Still, there is a local management team for the joint stock company SIT AB in Finspong, although its autonomy is not the same as in the ‘STAL’ days.
The change of culture was expected and ‘feared’ by most employees in Finspong when Siemens took over. There was a fear that “we are not going to be allowed to do as we have always done”. After a year or so, most people started to realise that we could actually influence decisions if we just raised our voices a little and showed that we have good ways of working that give good results. Now, some four years later, few employees in Finspong long back to the ‘STAL’ days. We have learned to live with more bureaucratic procedures that have given more ‘Ordnung’ in our processes but – contrary to what was expected – we still have great influence on the way we work. Although sales volumes do vary, the financial results for SIT AB are very good and the business is growing.
2.2. The history of Process Management and Six Sigma before 2003
2.2.1. Process orientation and development
The company has a long history of quality work. In the 1980s – under the names of ASEA and ABB – there were quality circles and the famous T50 program (Bergman and Klefsjö, 2002). At the beginning of the 1990s the company started several initiatives to work with processes, initially under the name of BPR, i.e. Business Process Reengineering. Some managers and quality professionals had read the books of Hammer and Champy (1993) and – Scandinavia’s local BPR guru – Norwegian Bjørn-Erik Willoch (1996), who also was invited to give a presentation to the company in Finspong. Many small ‘islands’ of process mapping teams worked in the company but there were no real connections between the islands. At the end of the 1990s there was an effort to establish common ‘core processes’ for Development, Sales, Delivery of Gas and Steam Turbines and Plants and Service. This was mainly an activity of the ‘Process, IT and Quality Team’ (called PIK, a Swedish abbreviation) with representatives from the different departments, but top management was not really involved. When joined in 1999 by Alstom Power (the company was called ABB Alstom Power for a while before Alstom Power eventually bought the company from ABB) there ‘existed’ common core processes in the sense that they were defined on the top level, but there were no detailed process maps for the different business units.
Six Sigma Management at Siemens – A personal case story. Cronemyr(2007)
A-5
At the time I was working at the Quality Department as an internal Process Management consultant. I had just completed my Licentiate thesis on organisational learning within Product Development (Cronemyr, 2000). In my research I had developed some methods to be used to improve communication within Product Development. One of these, KOS – Knowledge Overlapping Seminar – was later used in the Service Division. Another method, Simulation of Improvements to Iterative Processes, was published (Cronemyr, Öhrwall-Rönnbäck, and Eppinger, 2001) and used by others (Wright, 2004).
My main task in 2000 was to lead a process development project in the Gas Turbine Development Department called PDPDP – Product Development Process Development Project. It was first one of my jokes to call it PDPDP; it was too complicated to say it but the abbreviation became popular and people liked to say it as quickly as they could – PDPDP! When the project started I made a one-page presentation in Power Point, a ‘simulation’ of what the main view of the process would look like when we had put it in the Business Viewer software – a software that I and my colleagues in the Quality Department had chosen from several available software programmes as the standard process mapping software to be used by the company. We were in the process of buying it and it would be available in a month or so. But the purchase was stopped by Alstom Power’s central quality staff in Paris because we were told to use Alstom Power’s standard process mapping software, called Mega. So we expected to get Mega soon and, while waiting, we continued to make the process maps in the Power Point file. For different reasons it took more than a year before Mega was available in Finspong. During that time the Product Development Process (PDP) was developed into an 80-page Power Point file. When process mapping eventually started – using Mega – in the other processes in the company it was ‘too late’ to start converting the PDP into Mega maps because of the many features – links and macros – that were used in the Power Point file. All processes were published on the company intranet using Mega and there was a link to the Power Point file for PDP. As we shall see, the PDP process developed in Finspong was later considered as ‘state of the art’ and became the standard PDP in Siemens PG-I.
When mapping and developing processes it is most important not to fall into pits common in this work. Common pitfalls are e.g. confusing organisation for process, focusing on roles instead of flow, mapping ‘error fixing’ processes instead of ‘making things right’ processes, mixing information flow with activities and considering management tasks in an operational process as a separate process. The most common pitfall is something I call ‘lobotomising’ processes, i.e. cutting off processes at organisational boundaries. When I was at the Quality Department we realised this and hence started the development of a Process Development Process to avoid the pitfalls. The main contributors to this process were me, two other persons at the Department and two consultants from a Swedish consultancy firm that specialised in quality management. We tried to help – tell – people in the organisation to use the Process Development Process but most people did not want to be told by the Quality Department what to do. Needless to say, this led to many problems in terms of ‘messy’ and ‘vague’ process maps. Just before Siemens took over from Alstom Power in 2003, all business units had established their own core processes on the top level – Develop, Sell, Deliver – and put them on the intranet, but not all of these processes were broken down into detailed process maps.
Six Sigma Management at Siemens – A personal case story. Cronemyr(2007)
A-6
2.2.2. Six Sigma
The Six Sigma program in Finspong was started by Alstom Power. Even though the ABB Corporation is famous for being one of the first companies to use Six Sigma (Magnusson et. al., 2003), it was not used by ABB STAL in Finspong until Alstom Power introduced it in 2001. I was on the first training wave of Black Belts. Over a period of two years, about 15 Black Belts and 30 Green Belts were trained. Later, a Siemens top manager expressed his view of what had been achieved by the Six Sigma programme at Alstom Power as ‘embarrassing’. I guess that was a polite way of saying ‘a complete failure’. But, as Juran once said, “Failure is a goldmine” (Juran, 1998). At that time I and my fellow Black Belts regarded it as an absolute failure, not as a goldmine, but what we did later in Siemens was to actively avoid making the same mistakes again. Hence it was an important step towards the goldmine.
The major mistakes of the Six Sigma programme conducted in Finspong during the time of Alstom Power were:
i) No management buy-in
Black and Green Belts were appointed and sent for training but were responsible for inventing their own projects. Very seldom was a process owner present when a project was selected and when it was time to hand over the results from a project – since there was no process owner – the local quality department took over. Some process owners were involved, but these were exceptions. Once the Black and Green Belts had been appointed, the managers thought they had done what was expected from them and – since no one in central Alstom Power said anything else – they were right.
ii) Black Belts not working full time
Only one Black Belt – not me – worked full time as a Black Belt. He ran several successful projects in the plant business. The rest of us tried to work with our projects while our managers wanted us to do something else. Approximately half of all the projects were never completed.
iii) No infrastructure of Six Sigma
There were no formal processes for selecting, reviewing, supporting or taking over projects. There was a formal way of documenting a project in a report but it was not necessary to write the report until the end of the project. By that time – if the project had not already been cancelled – it was difficult to remember what had happened – especially since projects lasted for a very long time, sometimes up to two years.
As a result of this failure, most Black Belts quit their Black Belt careers before becoming certified Black Belts and, when Siemens took over, most of them applied for new jobs and several went on to management positions. Only two Black Belts were certified by Alstom Power and two more were later accepted and certified by Siemens. I was one of those.

Six Sigma Management at Siemens – A personal case story. Cronemyr(2007)
A-7
I was working as an uncertified Black Belt and process developer at the Gas Turbine Development Department. Alstom Power required you to complete two projects to become a certified Black Belt. One of my Black Belt projects concerned the large number of product fault reports from the field that was dealt with every year. Even though there were many people who worked on solving the problems behind the fault reports, the number of new fault reports each year was not decreasing. What we found was that, while product faults were solved and, as a result, products were improved, the underlying process faults were not dealt with, i.e. the process that caused a problem to appear in the first place was not improved. Hence the problems re-occurred, showing up as new product faults. The solution was a Process Improvement System – an application called PIS that we developed in the Lotus Notes software – supporting the new Process Fault Report Process that could be used to identify suitable Six Sigma projects from re-occurring process faults. We started to use PIS in Gas Turbine Development, but no other parts of the organisation used it since it was only taken over by the local Quality Department and none of the other business units wanted to use it – since they were not told to. Years later, we used it very successfully in the Service Division. The Process Fault Report Process was presented as an idea of Fundin and Cronemyr (2003) and when it was applied in the Service Division by Cronemyr and Witell (2007).
2.2.3. Early Process Management
With my history as an internal Process Management consultant at the Quality Department and now working as a Black Belt, and also on the basis of my academic knowledge of TQM – Total Quality Management – I was the only one in Finspong working with three different things. I realised that they were interconnected, but no one else that I knew of saw this. Hence I developed and presented a picture at a PIK meeting in Finspong, see Figure 2. I also presented it at an Alstom Power top management meeting in Copenhagen that the global Quality Manager of Alstom Power attended. She was very interested and supported me in continuing this work.

Six Sigma Management at Siemens – A personal case story. Cronemyr(2007)
A-8
Figure 2. Process Management at Alstom Power (from an internal presentation file by Cronemyr 2002)
What Figure 2 shows is that basically three different initiatives were concurrently ongoing in the company but that the connections were missing.
i) The management team was involved in the strategic part of Quality Focus – a central initiative in Alstom Power – where vision and strategy were connected to Balanced Scorecards with the intention of identifying high priority improvement areas. I coached the management team.
ii) The different departments were mapping processes with the support of the Quality Department – support that was appreciated by some and viewed as unwanted supervision by others. The aim was to map processes and put them into the Quality Management System on the intranet. I was a process mapping expert.
iii) Black and Green Belts were involved in Six Sigma projects with the purpose of improving processes by removing root causes of problems. I was one of the Black Belts, even though not yet certified.
The arrows in the figure marked ‘Input’ and ‘Results’ are included with the intention to show how the three initiatives should be connected, but these connections did not exist at the time because, except for me, no one was involved in all three activities. I explained at the meetings that the top loop was called ‘process control’ (on a strategic level), the bottom loop ‘process improvement’ and both loops together ‘Process Management’. There was no immediate response except for some “hmmm”, “aaah” and “this is a little too academic for me”. Since the different departments were run like different business units, I did not have enough influence to make the indicated connections.
Six Sigma Management at Siemens – A personal case story. Cronemyr(2007)
A-9
2.3. Phase 1: Starting up Process Management and Six Sigma in the service division
2.3.1. Going into Service
My major experience was in R&D and I had also worked in quality and to some extent in IT, but when Siemens took over I thought it was time to try something else. At the end of September 2003 the manager of the Service Division advertised for a head of a new department in service called Business Excellence. It is standard in Siemens to have a business excellence department in divisions and subdivisions. This is almost like a local quality department. Responsibilities are process and quality management, improvement programmes such as Six Sigma and IT coordination. I thought it would be exciting to go into service, a field that I had very little experience of, except for one of my Black Belt projects that dealt with reducing the number of gas turbine starts during commissioning. In my application for the job I wrote “My goal is to be a certified Black Belt as soon as possible, to work as a Black Belt for couple more years, and then go for Master Black Belt”. We did not have a permanent Master Black Belt in Finspong at that time. The next day at a job interview, the manager of the Service Division convinced me that I should take on the manager position and promised that I could finalise my third project so that I could apply for Black Belt certification within Siemens. So I did. The next week I relocated one floor down to the Service Division to the surprise of my managers in Gas Turbine Development. This was not at all planned, it just happened; but it was a major step in my personal development and career.
It came to be a flying start at Service. Within three weeks I had convinced the service management team to let me advertise for three new Black Belts and one process mapping expert. I interviewed several people that applied for the positions and four were selected and appointed. In the fourth week the first three Six Sigma projects were selected by the management team, and a list of possible improvement projects was sent to division top management, as a part of the VGP – Value Generation Program – in Siemens Power Generation.
2.3.2. Starting up process development
Wise from earlier failures conducted in Finspong when we were owned by ABB and Alstom Power, I stressed that the Business Excellence Department would not take on any responsibility for the service business processes. All processes and improvements would always have to be owned by someone in the management team. We in the Business Excellence Department would supply the needed support, i.e. knowledge and resources, as well as structure and steering of improvement activities, but would never select or take over results from Six Sigma projects. Those are the ultimate tasks of a management team working with Process Management. To my surprise, the 13-man strong Service Management Team, most of whom had never worked with Six Sigma but did have some previous experience of process mapping, accepted. This buy-in was something that I had never achieved in Gas Turbine Development.
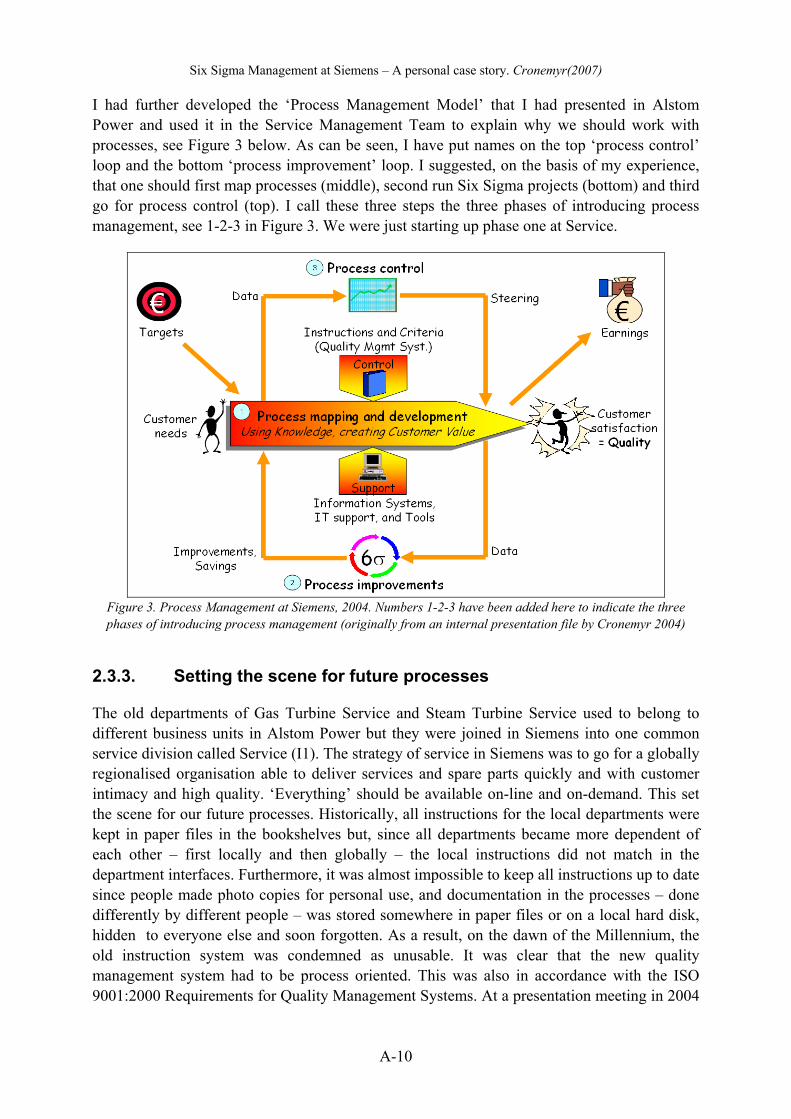
Six Sigma Management at Siemens – A personal case story. Cronemyr(2007)
A-10
I had further developed the ‘Process Management Model’ that I had presented in Alstom Power and used it in the Service Management Team to explain why we should work with processes, see Figure 3 below. As can be seen, I have put names on the top ‘process control’ loop and the bottom ‘process improvement’ loop. I suggested, on the basis of my experience, that one should first map processes (middle), second run Six Sigma projects (bottom) and third go for process control (top). I call these three steps the three phases of introducing process management, see 1-2-3 in Figure 3. We were just starting up phase one at Service.
Figure 3. Process Management at Siemens, 2004. Numbers 1-2-3 have been added here to indicate the three phases of introducing process management (originally from an internal presentation file by Cronemyr 2004)
2.3.3. Setting the scene for future processes
The old departments of Gas Turbine Service and Steam Turbine Service used to belong to different business units in Alstom Power but they were joined in Siemens into one common service division called Service (I1). The strategy of service in Siemens was to go for a globally regionalised organisation able to deliver services and spare parts quickly and with customer intimacy and high quality. ‘Everything’ should be available on-line and on-demand. This set the scene for our future processes. Historically, all instructions for the local departments were kept in paper files in the bookshelves but, since all departments became more dependent of each other – first locally and then globally – the local instructions did not match in the department interfaces. Furthermore, it was almost impossible to keep all instructions up to date since people made photo copies for personal use, and documentation in the processes – done differently by different people – was stored somewhere in paper files or on a local hard disk, hidden to everyone else and soon forgotten. As a result, on the dawn of the Millennium, the old instruction system was condemned as unusable. It was clear that the new quality management system had to be process oriented. This was also in accordance with the ISO 9001:2000 Requirements for Quality Management Systems. At a presentation meeting in 2004
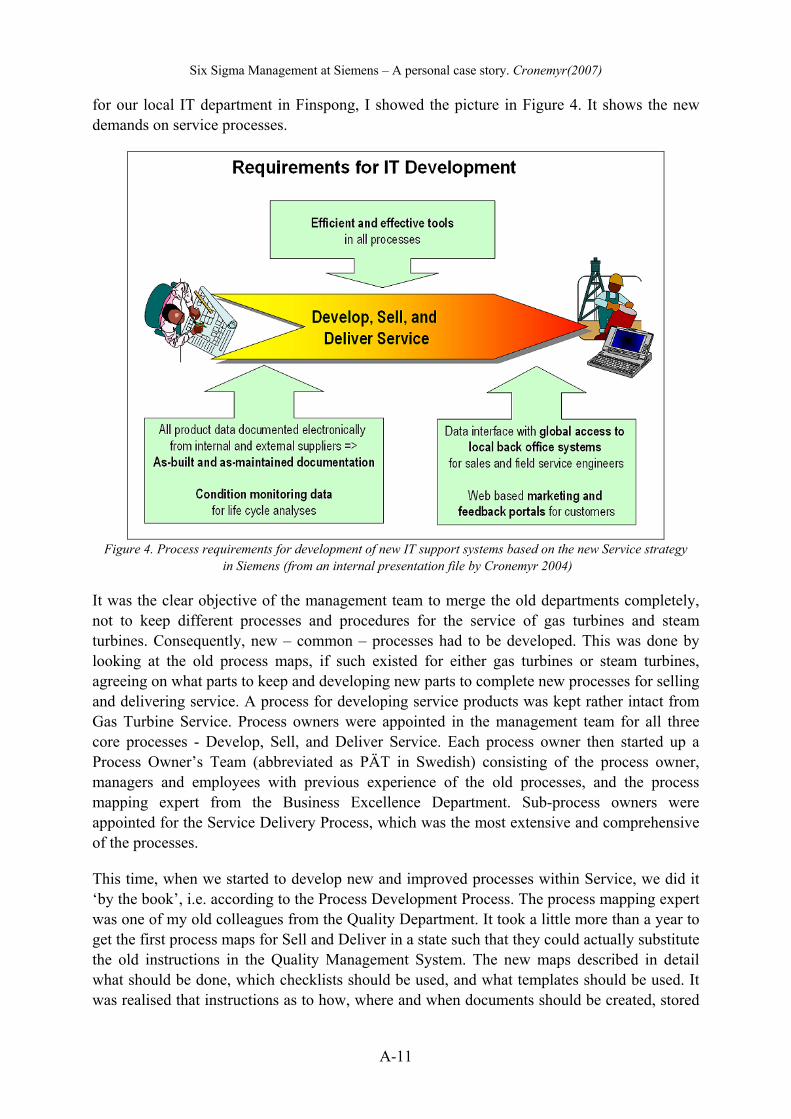
Six Sigma Management at Siemens – A personal case story. Cronemyr(2007)
A-11
for our local IT department in Finspong, I showed the picture in Figure 4. It shows the new demands on service processes.
Figure 4. Process requirements for development of new IT support systems based on the new Service strategy
in Siemens (from an internal presentation file by Cronemyr 2004)
It was the clear objective of the management team to merge the old departments completely, not to keep different processes and procedures for the service of gas turbines and steam turbines. Consequently, new – common – processes had to be developed. This was done by looking at the old process maps, if such existed for either gas turbines or steam turbines, agreeing on what parts to keep and developing new parts to complete new processes for selling and delivering service. A process for developing service products was kept rather intact from Gas Turbine Service. Process owners were appointed in the management team for all three core processes - Develop, Sell, and Deliver Service. Each process owner then started up a Process Owner’s Team (abbreviated as PÄT in Swedish) consisting of the process owner, managers and employees with previous experience of the old processes, and the process mapping expert from the Business Excellence Department. Sub-process owners were appointed for the Service Delivery Process, which was the most extensive and comprehensive of the processes.
This time, when we started to develop new and improved processes within Service, we did it ‘by the book’, i.e. according to the Process Development Process. The process mapping expert was one of my old colleagues from the Quality Department. It took a little more than a year to get the first process maps for Sell and Deliver in a state such that they could actually substitute the old instructions in the Quality Management System. The new maps described in detail what should be done, which checklists should be used, and what templates should be used. It was realised that instructions as to how, where and when documents should be created, stored
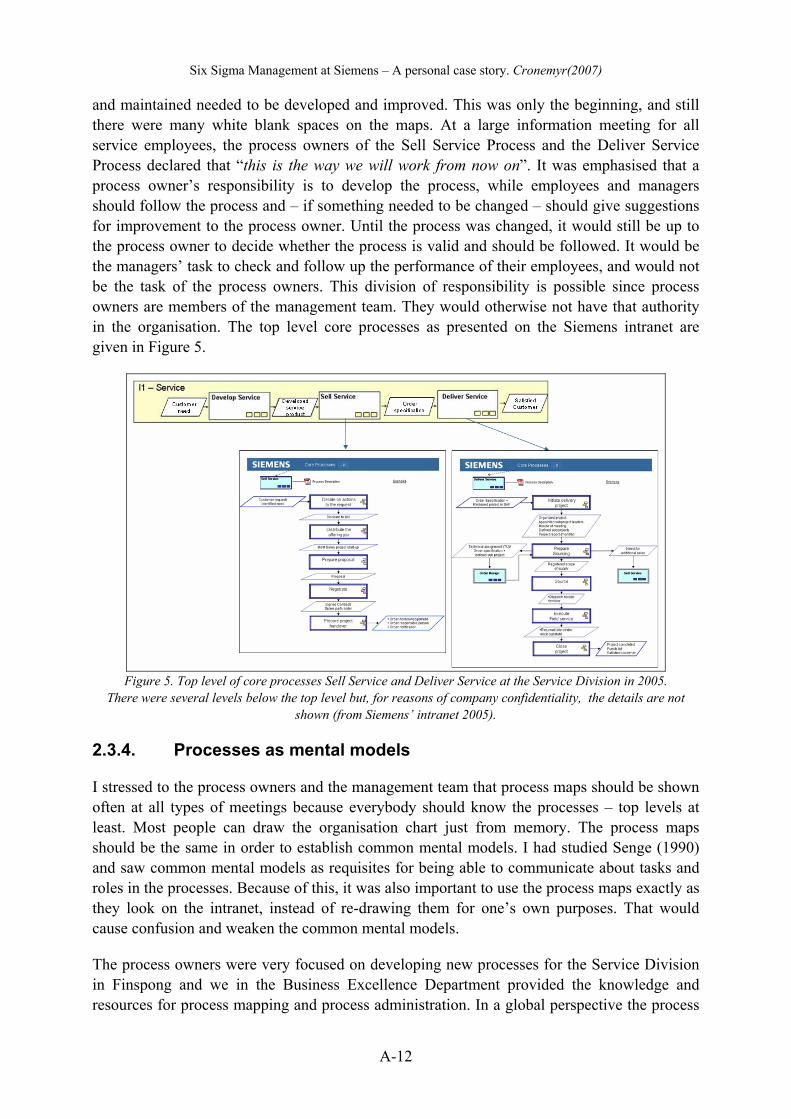
Six Sigma Management at Siemens – A personal case story. Cronemyr(2007)
A-12
and maintained needed to be developed and improved. This was only the beginning, and still there were many white blank spaces on the maps. At a large information meeting for all service employees, the process owners of the Sell Service Process and the Deliver Service Process declared that “this is the way we will work from now on”. It was emphasised that a process owner’s responsibility is to develop the process, while employees and managers should follow the process and – if something needed to be changed – should give suggestions for improvement to the process owner. Until the process was changed, it would still be up to the process owner to decide whether the process is valid and should be followed. It would be the managers’ task to check and follow up the performance of their employees, and would not be the task of the process owners. This division of responsibility is possible since process owners are members of the management team. They would otherwise not have that authority in the organisation. The top level core processes as presented on the Siemens intranet are given in Figure 5.
Figure 5. Top level of core processes Sell Service and Deliver Service at the Service Division in 2005.
There were several levels below the top level but, for reasons of company confidentiality, the details are not shown (from Siemens’ intranet 2005).
2.3.4. Processes as mental models
I stressed to the process owners and the management team that process maps should be shown often at all types of meetings because everybody should know the processes – top levels at least. Most people can draw the organisation chart just from memory. The process maps should be the same in order to establish common mental models. I had studied Senge (1990) and saw common mental models as requisites for being able to communicate about tasks and roles in the processes. Because of this, it was also important to use the process maps exactly as they look on the intranet, instead of re-drawing them for one’s own purposes. That would cause confusion and weaken the common mental models.
The process owners were very focused on developing new processes for the Service Division in Finspong and we in the Business Excellence Department provided the knowledge and resources for process mapping and process administration. In a global perspective the process

Six Sigma Management at Siemens – A personal case story. Cronemyr(2007)
A-13
development was also going on at different levels. We at Business Excellence participated in this work by ‘telling’ colleagues in different countries how far we had come in Finspong, but we avoided as much as possible ‘disturbing’ the local process owners by the activities in the global work because, although Siemens had established top level processes, these were not at all on the same level of detail as our processes. If we had said “let’s not develop our processes further, let’s wait for the common Siemens processes instead”, we would not have what we have today. Furthermore, now – in this writing in 2007 – the common Siemens processes are starting to come down to the same level of detail as our process maps. Many of our processes have been classified as best practice, and some have been implemented as global processes. The common Siemens processes were called Product Lifecycle Management (PLM), Customer Relations Management (CRM) and Supply Chain Management (SCM). Even though there are some minor differences in content and boundaries between the processes, these correspond reasonably well to Develop Service, Sell Service and Deliver Service.
2.3.5. Restarting Six Sigma
At the end of 2003 I employed three persons that would become Black Belts in the Business Excellence Department. They were sent to Germany for four weeks of training – spread out over the first half of 2004. The Black Belts were all previously employed at Siemens in Finspong but only one worked in service. The service employee worked in logistics and had only been with the company a couple of years. I thought he had ‘good potential’. The other two were very experienced people – a woman and a man – that had been with the company for several years. Both had been managers. They all had projects that had been selected by the management team. The selection was based on a ‘consensus gut feeling’ in the management team that these projects were related to the major gaps between current performance and targets of the Division’s Key Performance Indicators (KPI). There were no real measurements in place, so the projects were selected on the basis of ‘well known problems with unknown solutions’.
The first Black Belt projects were:
i) Correct parts to site on time
For a long time (how long is unknown) there had been problems with missing parts and equipment when field service engineers arrived at customer sites to do service tasks. This often led to delays, which lead to poor on time delivery and hence unsatisfied customers. Furthermore, many parts had to be sent to a particular site in special ‘emergency’ deliveries, which were very expensive. The problem had been investigated several times before, with the being focus on the packing and shipping of parts. The root cause was found after a very thorough investigation: the planning of field service activities was started too late. In order to get manufactured and purchased parts to the right site on time, planning activities had to start early in the sales phase, approximately two years before field service activities. As a result, a new planning and forecasting process was designed and launched. This project also generated several ideas for more projects, which later became Green and Black Belt projects.

Six Sigma Management at Siemens – A personal case story. Cronemyr(2007)
A-14
ii) Better forecasts for spare parts
The manufacturing facility of gas turbines and steam turbines in Finspong is a part of the Gas Turbine Division. Most of the work is concerned with new equipment for the delivery of new gas turbines and steam turbines. All projects need to be forecasted well in advance to make use of the manufacturing facility in an optimal way. Manufacturing orders for service parts were always last in line since they were seldom forecasted. This Black Belt project identified the problems and the root causes and then gave a proposal for how manufacturing forecasts for service should be done. The solution was partly the same as in the first project; hence the two projects together designed and released the Planning and Forecasting Process. It should be mentioned that these two projects – i.e. these two problems – did not appear to be related when they were started, but they arrived at a common solution. This indicates the importance of having a good integration of projects instead of a separation as suggested in some project selection criteria.
iii) Margin slippage - baseline project
The term ‘margin slippage’ is ambiguous. Other similar concepts are ‘margin erosion’, ‘non conformance costs’, ‘fault and warranty costs’, ‘low productivity’ and more. To give a simple explanation one could say: when the actual sales margin does not match the calculated one, there is margin slippage. This can be positive or negative. The latter – which is more common – can also be called margin erosion. The other concepts mentioned are parts or causes of margin erosion. The problem was that, compared to other parts of Siemen’s service organisation, we had high margin slippage (“bad”) but at the same time high margins (“good”). There were many opinions – both in Finspong and at the central business administration staff – about the ‘problem’ but no clear view of what the problem really was. A ‘baseline’ project was launched. This was something that we brought from Alstom Power which was actually quite good. In order to formulate good Six Sigma projects out of a complex problem area a baseline project runs through Define, Measure and Analyse – i.e. the first three phases of the DMAIC cycle. Then the problem is divided into new DMAIC projects. Siemens did not approve of this as a Six Sigma project so the Black Belt could not count this as his first project (of three necessary for certification). His next project, however, which dealt with one of the major problems found in the baseline project, was a DMAIC project and was counted. This was a transactional project and removed several errors in our business calculation and reporting systems. Other possible projects of ‘real’ margin slippage were identified and later started.
As described above all three projects were selected by the management team from serious and central problems to the Service Division. One indication that these were ‘real’ problems is the many new project ideas that emerged from these projects. As a comparison, I was unofficially coaching some Black Belts in the Gas Turbine Division, and their projects were selected by themselves, their direct manager or someone in their Business Excellence Department. The connections between their projects and the work of their management team were unclear, if
Six Sigma Management at Siemens – A personal case story. Cronemyr(2007)
A-15
there were any connections at all. To me it looked very much like nothing had changed since we were owned by Alstom Power. This was confirmed by the Black Belts in coaching sessions.
In parallel with working as the manager of the Business Excellence Department I succeeded in becoming certified as a Siemens PG Black Belt for my three projects that were done in Alstom Power. In everyday work I was coaching the Black Belts, taking on a Master Black Belt role, since we still did not have a local MBB in Finspong. Formal toll gate meetings were held by the Black Belts by phone and e-mail with an MBB in Germany. It went reasonably well since support and coaching was done locally, which is very important when inexperienced Belts are running their first projects. Once, in a toll gate meeting, the MBB in Germany ranked the project ‘Correct parts to site on time’ as one of the best projects he had ever seen. I took it as an indication that not only did we have a very good Black Belt, we were also doing the right things.
One thing perceived as a problem by the Belts was the difference between ‘textbook Six Sigma’ and ‘real projects’. In the DMAIC methodology taught in the Black Belt course the focus was very much on ‘data door’ analysis including statistical tools such as regression analysis and hypothesis testing. These tools were not very useful when an out of control process, but one with only minor customer problems – which we found was quite common – was to be analysed in a Six Sigma project. The ‘process door’ was used instead, but there were very few tools for this, except for detailed process analysis and cause-and-effects diagrams. The solution we used was to combine DMAIC tools and some tools used in the Design for Six Sigma roadmap called DMADV (Define, Measure, Analyse, Design, Verify). I called the new roadmap DMADC (Define, Measure, Analyse, Design, Control) and we used it in several projects. It was very good for us because we could deal with real problems in real projects, but it was sometimes difficult to get acceptance from external reviewers when going through the toll gates. Eventually all projects were accepted as successful projects, however. Later I presented the DMADC roadmap in the paper called DMAIC and DMADV – Differences, similarities, and synergies (Cronemyr, 2007). In our experiences at Alstom Power and Siemens, most processes are out of control when a Six Sigma programme is started in a company. This must be dealt with, as it is a major threat to the success of Six Sigma. By choosing to use the suggested DMADC methodology instead of ‘die hard DMAIC’ this threat can be minimised.
Late in 2004, approximately one year after launching Black Belts, we launched the first eight Green Belts from Service. They were identified and selected by the management team. They kept their regular jobs at some department in the Service Division and were not transferred to the Business Excellence Department.
All had projects that were selected by the management team prior to the start of the training. It was quite extensive work to produce eight good project charters at the same time. Although the process owners were responsible for their ‘own’ projects, I and the other Black Belts helped them to develop the project charters.

Six Sigma Management at Siemens – A personal case story. Cronemyr(2007)
A-16
We learned, after defining many projects, that a good project charter is characterised by the following elements (given here with suitable check-up questions):
• A good title. “What are we trying to achieve?”
• Process and customer. “Who is responsible and who is bleeding?”
• Output variable to measure. “What quality characteristic is not good enough?”
• Quantified problem statement. “How bad is it?”
• Quantified goal statement. “To what level do we need to improve?”
• Business benefit. “What will it cost if we do not run this project?”
• Resources: Belt and participants. “Who knows the process, who can change it?”
• Schedule. “When does the process owner need the new/improved process?”
Note that there should be no description of the solution to the problem. I noticed that it is very hard to avoid talking about solutions with people who have run implementation projects for many years. I had many discussions about trying to change project descriptions from “To implement a new database for…” into “To shorten the lead-time for…” etc. I always draw a process control chart on a whiteboard or a flip chart and ‘force’ the process owner to give me the details, see Figure 6. This is very useful when training people to think in quality characteristics instead of solutions. Furthermore, the chart can be used after the project to check the results against what was planned for. Note that current performance is given as an average of historic data. There is normally very limited information on the historic variation (this will be investigated in the Measure phase). The target, on the other hand, is given as a (lower and/or upper) specification limit. This will be used in calculating the sigma value at the end of the project. Sometimes process owners have no ideas about either specification limits or acceptable levels of variation. In those cases the target is given as an average.
The calculation of the business benefit of the project can be very complicated. How can one know the savings in advance? And compared to what? When comparing to ‘baseline’, i.e. ‘the way it used to be’, the savings may very well be negative because of some new demands on the process that were not there before. Instead one should compare to ‘what if we do nothing, what will it cost?’. Those are the only two options, either we do it or we don’t. There is no going back in time. New demands are here and we have to adapt to them. This is normally much easier to calculate and, if savings are negative in that type of calculation, we should probably not run the project.

Six Sigma Management at Siemens – A personal case story. Cronemyr(2007)
A-17
Figure 6. Elements of a Six Sigma project charter drawn on a process control chart.
2.3.6. The first crisis
While a Black Belt should run two concurrent projects on a full time schedule, the Siemens rules said a Green Belt should spend 20% of the working time with a project. This was accepted in the management team when the Green Belts were appointed, but it would prove to be a problem. The Green Belts were selected because of their skills and they were considered suitable as Six Sigma project leaders. They were not people ‘just hanging around’. As could be expected, these individuals were already very busy and involved in many activities, they were often important resources at their departments. The Green Belt training included ten days in a three month period, meaning that training took 16% of their working time in the first three months. If each Green Belt then spent one day per month on the project, that would add up to 20% of the working time. This is ridiculous, of course; everyone understands that you need to spend at least two days per week on your project. With training, that adds up to 50% during the three month period. If done in this way, the project could theoretically be completed in little more than three months.
Since the Green Belts – and their managers – were not committed to spending that much time on their projects, all of them were delayed. In Siemens, unlike Alstom Power, there were very rigorous follow-up of Six Sigma time schedules at central functions. All of a sudden we started to get angry e-mails from central functions in Germany about ‘red’ projects, i.e. late projects. I tried to ‘protect’ the Green Belts by taking the blame in the discussions with central functions but they continued to get angry e-mails. After some months most of the Green Belts were very dissatisfied and did not want to continue their projects. It was our first real crisis since starting up Six Sigma. I was determined to find and get rid of the root causes of the crisis.
Six Sigma Management at Siemens – A personal case story. Cronemyr(2007)
A-18
I summoned all Green Belts, Black Belts and process owners to a workshop. The manager of the Service Division started the workshop by assuring all – especially the Green Belts – that the Six Sigma projects were very important to the business. Even though a service business always puts customers first, which lead to interruptions in Six Sigma projects, the projects are important for the long term development of our customer relations. He said “I am the customer of the Six Sigma projects, and I want the problems to be solved.” The purpose of the workshop was to find the root causes of the delays in projects. A ‘yellow-post-it-notes-silent-affinity-diagram-exercise’ was carried out. This is a technique that all Belts use in their projects. Sixteen people wrote approximately 60 post-it notes which were then put together into seven clusters. Each cluster got a title, a responsible role and some suggested actions. Below is given a short summary of my minutes from the workshop.
• Lack of time and resources – Responsible: Process owners
When starting a new project the process owner is responsible for appointing team members from the organisation. The project should not be started up in ‘sigma+’ (the tracking system) until the process owner has found available people.
• Prioritising – Responsible: Green/Black Belts
The Belt must behave like ‘a normal project manager’, i.e. defend the project, keep the schedule and deliver. “Be nice but not too nice.” The team members, including the Belt, should not give priority to other activities unless this is accepted by their managers. Delays, or possible delays, should be reported to the process owner as soon as possible.
• Attitude – Responsible: Green/Black Belts, team members, and management
Avoid the ‘student syndrome’, i.e. doing everything as late as possible. Instead, try to do things as soon as possible and do not over elaborate. This is common when one is not sure what to do – especially in the first project – and when there are a million other things to do. Management should also take responsibility by always having Six Sigma projects on the agenda.
• Scope and boundaries – Responsible: Process owners
A project should be ‘broad’ in the beginning and ‘narrow’ at the end. ‘Too broad’ normally means the problem is poorly defined in the project charter. Another error can be to focus on an IT support system or a product instead of a process. Scope glide also occurs if one starts to forget what the problem was in the first place. Process owners are responsible but could always get help from Business Excellence.
• Schedules, Education, and Other – Responsible: Business Excellence
Belts suggested more standardised time schedules with typical resource allocations, less administration and double work. Education should be spread over a longer time. Functionality in the sigma+ tracking system could be improved. Business Excellence
Six Sigma Management at Siemens – A personal case story. Cronemyr(2007)
A-19
should give these suggestions to central functions. All divisions could benefit from these.
I analysed all topics from the workshop in more detail using the DMAIC methodology. I also found several misconceptions about our Six Sigma program in management reports based on the fact that “Many projects are ‘red’, i.e. late, and have too long duration times”. I wrote a report to my German Division manager. My messages were:
• Misleading information in management reports. Only duration times were followed up. There was never any information on:
o The reasons for late projects o The reasons for long duration times o The status and results so far from ongoing projects o The results of the completed projects, i.e. savings, improvements and new
processes o The resource allocations for Belts and team members o Management activities and attention o Number of ongoing projects per Belt, or o Number of completed projects per Belt.
I wrote: “The real problem is much more complex than presented. If top management wants to control and steer the Six Sigma program, a much more thorough description must be presented in management reports.”
• My suggestions for improvements to the Six Sigma programme to be implemented locally in Finspong were:
o Allocate people on a 50% schedule for the project. o Spend more time coaching Belts and process owners. o Belts must report progress and delays to process owners sooner. o Process owners must send updated schedules to programme administration. o Give an award to successful projects.
All these suggestions were implemented immediately by me or the local management team.
• My suggestions for improvements to the Six Sigma programme to be implemented centrally were:
o Complement management reports with real results, KPI improvements and savings as recorded in the tracking systems.
o Allow an increase of the head count if replacements for Belts are needed. o Change Green Belt training. Reduce the amount of statistics and increase
project management techniques. o Change unrealistic targets on duration times for Belts who are doing their first
project. o Allow process owners and Belts to update their own projects in the sigma+
tracking system. o Stop sending e-mails about red projects.

Six Sigma Management at Siemens – A personal case story. Cronemyr(2007)
A-20
The first suggestion led to a change in the global reporting process. Before statistics on duration times were sent out in management reports, we had the possibility to add comments to the numbers. In this way I could add some of the information that I thought was missing. Suggestions two and three are still under consideration. The last three suggestions were implemented some time after my report, even though ‘red e-mails’ were resurrected after some months. By that time we had improved our schedule updating process so we almost never had any red projects, hence very few annoying ‘red e-mails’.
2.3.7. Focusing on Six Sigma Management
In early 2005 I had spent so much time on other tasks related to managing the Business Excellence Department that I thought it was time to focus on Six Sigma only. I also wanted to re-start my university studies – to go for a Ph.D. (I already had completed my Licentiate degree in 2000.) I went to my manager, the head of the Service Division in Finspong, and said “I want to quit as a manager and restart my Ph.D. studies at the university.” After several lengthy discussions we agreed that I would leave the management team, but I would continue to run the Six Sigma program – only – in Service as a Six Sigma Program Manager under a new Business Excellence Manager. I could also spend 20% of my time working towards my Ph.D. thesis on Six Sigma Management. So, once again, two years after the last time, something unplanned just happened. Once again it was a major step in my personal development and career. Some of my German colleagues were surprised that I was ‘moving down’ in hierarchical levels at my own choice. I explained that it is quite common to do so in Sweden – it does not mean that you can not ‘move up’ again – and that I was not interested in hierarchical levels.
The job description for the new Six Sigma Program Manager position listed the following tasks and responsibilities, with approximate distribution of working time:
• Organise and chair the Six Sigma Steering Committee meeting once a month (10%)
This was the ‘central hub’ that all Six Sigma Management activities rotated around, see the detailed description in the next chapter.
• Coaching of Belts (30%)
In my investigations on root causes of delayed projects, I had identified that much more coaching was needed, especially of Green Belts.
• Coaching of process owners (10%)
Coaching on process development issues, measurements, identification of potential Six Sigma projects and using the Process Improvement System (more detail below).
• Six Sigma training of managers and employees (20%)
Training was organised by MBB or central functions. I participated as a trainer.

Six Sigma Management at Siemens – A personal case story. Cronemyr(2007)
A-21
• Follow-up and reporting of Six Sigma (5%)
There is a great deal of reporting at Siemens. I reported to the local management team, as well as to Business Excellence at different levels of the organisation.
• Support Six Sigma in the sub regions (5%)
The Service Division in Finspong was the headquarters of ‘Service Region 2’ with sub regions in Scandinavia, the Middle East and Russia. I supported the roll-out of Six Sigma, especially in the Middle East office located in Dubai.
• Conduct research within the area of Six Sigma Management (20%)
I was associated with the Department of Quality Sciences at Chalmers University, Göteborg. I was also to supervise one diploma work per year.
As described in the previous section I suggested several improvements to the Six Sigma program to be implemented locally in Finspong, and we did so. As a result, especially the increased coaching of Green Belts, the crisis was managed. Figure 7 shows the evolution of the ‘health’ of Six Sigma Projects in the Service Division in Finspong. As can be seen, in November 2005 when I changed position from manager of the Business Excellence Department to Six Sigma Program Manager, there was a significant improvement in progress. Duration times decreased and projects were completed on schedule. This was appreciated by the division’s top management.
Figure 7. Health of Six Sigma projects in ‘Service Region 2’.
Green/lower: On-time; Yellow/middle: Re-scheduled; Red/upper: Late.
2.3.8. Social psychology aspects of process orientation and change
At the end of 2004 we held an information meeting for all employees at the Service Division in Finspong where all ongoing Process Management projects were presented. These were i) process mapping and developing projects conducted by the process owners’ teams, ii) Six Sigma projects conducted by Black Belt teams and Green Belt teams and iii) IT support
Six Sigma Management at Siemens – A personal case story. Cronemyr(2007)
A-22
system development projects conducted by personnel at the Business Excellence Department. The presentation was made by us in the Business Excellence Department. Most projects presented were ongoing, and there was not much information on completed projects. In an evaluation survey 75% of the participants said it was interesting and that they had received new information.
There were concerns – from me – about how personnel at the Service Division experienced the great changes in their jobs because of the new processes and the new way of managing Service. Some managers thought ‘everybody was okay’ since we had informed everyone about the new processes in several different ways. I wanted to think that this was the case, but I suspected that employees did not say exactly what they thought. Hence I employed a student to do her diploma work at the Service Division in Finspong. The title was ‘Investigation of attitudes towards process orientation at Siemens Industrial Turbomachinery, Service Division, Finspong’ (Sundell, 2005). The student had an education in behaviour science, complemented with courses in quality and Process Management, a very good but rather unusual combination. She made a thorough investigation using semi structured interviews of seven employees and surveys (49 respondents, 100% respond rate).
The results of the investigation are given below.
• According to perceptions expressed by managers and process owners, the purposes of process orientation were:
o Meet customers’ demands o The right quality o Quality assurance o Internal efficiency o Systematic improvement work
• While, according to perceptions expressed by employees, the benefits of process orientation were:
o Do the right things in daily work o Find instructions, templates and check lists o Basis for feedback of errors in the processes o A holistic view for everyone who works in the process
• Furthermore, employees wanted: o More education on process orientation o More visible management
• According to the survey, 78% thought that process orientation as a way of working had a future within the Service Division; only 4% disagreed (see Figure 8).

Six Sigma Management at Siemens – A personal case story. Cronemyr(2007)
A-23
Figure 8. Responses from employees at Service Division. n=49, 100% response rate. (Sundell, 2005)
The overall evaluation was that we had made good progress and that there were mostly positive attitudes towards process orientation.
We used Marvin Weisbord’s ‘four room apartment’ (Weisbord, 1991) to describe the four states of change that persons, groups, departments and companies go through when changing, see Figure 9. In the figure the way we move between the rooms is indicated by the arrows. In the two rooms to the left, one does not want to change; in the two rooms at the bottom, one feels insecure; in the two rooms to the right, one wants to change; and in the two rooms at the top, one feels safe.
Figure 9. The Four Room Apartment. (Weisbord, 1991. Originally from Janssen, 1982)

Six Sigma Management at Siemens – A personal case story. Cronemyr(2007)
A-24
Most employees were in the two rooms to the right, i.e. they wanted to change. When planning future Process Management activities we focused on helping people to ‘move up’ from ‘Confusion’ to ‘Renewal’ by engaging more employees in process development teams and Six Sigma projects.
2.4. Phase 2: Moving Six Sigma into management
2.4.1. Six Sigma roles and infrastructure
A great difference in Siemens from Alstom Power was the infrastructure as defined by the central programme top+ Quality. This included definitions of roles, a roadmap for selection and execution of Six Sigma projects, and a central database, sigma+, for follow-up and administration of all Six Sigma projects. As mentioned before most of this was missing at Alstom Power – at least in Finspong – but, even though it was all very well defined in Siemens, the interpretations of the roles etc. were different in different parts of the organisation. We in the Service Division in Finspong took on the full potential of the infrastructure in our efforts to avoid previous failures.
Table 1. The roles and responsibilities as defined in Siemens top+ Quality.
Role Six Sigma Project Six Sigma Management
Master Black Belt (MBB)
Coaching of BB/GB, starting/ toll-gating/closing projects in sigma+ database, and teaching
Black Belt (BB) Full time Six Sigma project leader, coaching of GB
Green Belt (GB) Part time Six Sigma project leader
Team Member Employee with expert knowledge participating in Six Sigma project
Business Administrator (BA)
Determination and verification of business benefit of Six Sigma projects
Process Owner (PO) Define project, support Six Sigma team, select solution, order IT development, implement improved process in organisation
Suggest projects, report progress of projects to Management Team, control and follow up process
Program Manager (PM)
Support Management Team by controlling and follow-up of projects, allocation of projects to BB/GB, coaching of PO (+BB/GB)
Sponsor Local top manager, securing strategic focus of Six Sigma projects, securing of resources
Champion Head of global sector/division, securing resources for projects and training, signing of project charters and closure sheets
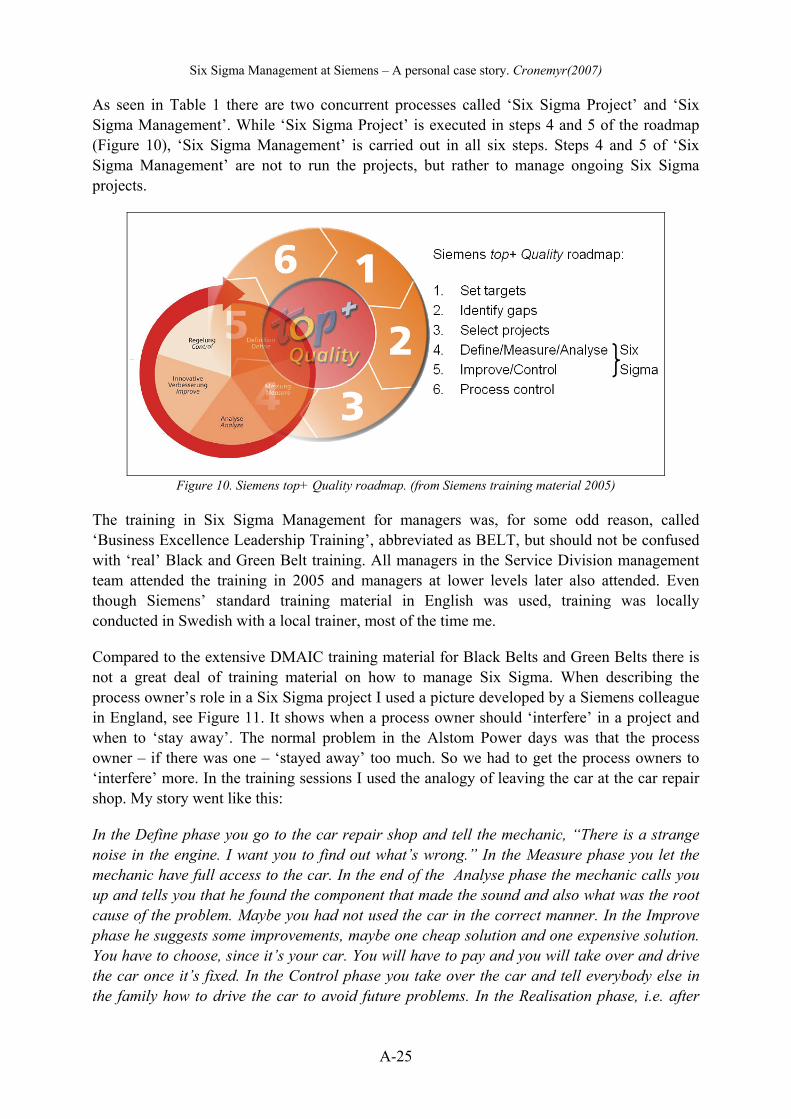
Six Sigma Management at Siemens – A personal case story. Cronemyr(2007)
A-25
As seen in Table 1 there are two concurrent processes called ‘Six Sigma Project’ and ‘Six Sigma Management’. While ‘Six Sigma Project’ is executed in steps 4 and 5 of the roadmap (Figure 10), ‘Six Sigma Management’ is carried out in all six steps. Steps 4 and 5 of ‘Six Sigma Management’ are not to run the projects, but rather to manage ongoing Six Sigma projects.
Figure 10. Siemens top+ Quality roadmap. (from Siemens training material 2005)
The training in Six Sigma Management for managers was, for some odd reason, called ‘Business Excellence Leadership Training’, abbreviated as BELT, but should not be confused with ‘real’ Black and Green Belt training. All managers in the Service Division management team attended the training in 2005 and managers at lower levels later also attended. Even though Siemens’ standard training material in English was used, training was locally conducted in Swedish with a local trainer, most of the time me.
Compared to the extensive DMAIC training material for Black Belts and Green Belts there is not a great deal of training material on how to manage Six Sigma. When describing the process owner’s role in a Six Sigma project I used a picture developed by a Siemens colleague in England, see Figure 11. It shows when a process owner should ‘interfere’ in a project and when to ‘stay away’. The normal problem in the Alstom Power days was that the process owner – if there was one – ‘stayed away’ too much. So we had to get the process owners to ‘interfere’ more. In the training sessions I used the analogy of leaving the car at the car repair shop. My story went like this:
In the Define phase you go to the car repair shop and tell the mechanic, “There is a strange noise in the engine. I want you to find out what’s wrong.” In the Measure phase you let the mechanic have full access to the car. In the end of the Analyse phase the mechanic calls you up and tells you that he found the component that made the sound and also what was the root cause of the problem. Maybe you had not used the car in the correct manner. In the Improve phase he suggests some improvements, maybe one cheap solution and one expensive solution. You have to choose, since it’s your car. You will have to pay and you will take over and drive the car once it’s fixed. In the Control phase you take over the car and tell everybody else in the family how to drive the car to avoid future problems. In the Realisation phase, i.e. after
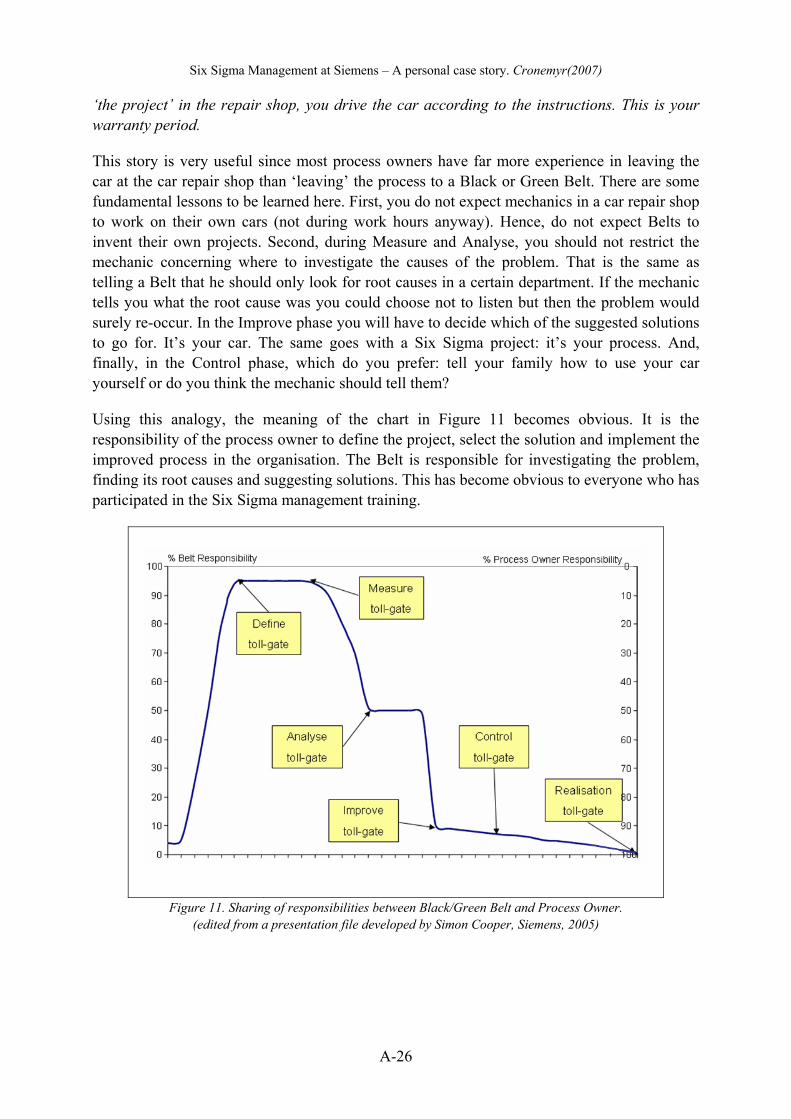
Six Sigma Management at Siemens – A personal case story. Cronemyr(2007)
A-26
‘the project’ in the repair shop, you drive the car according to the instructions. This is your warranty period.
This story is very useful since most process owners have far more experience in leaving the car at the car repair shop than ‘leaving’ the process to a Black or Green Belt. There are some fundamental lessons to be learned here. First, you do not expect mechanics in a car repair shop to work on their own cars (not during work hours anyway). Hence, do not expect Belts to invent their own projects. Second, during Measure and Analyse, you should not restrict the mechanic concerning where to investigate the causes of the problem. That is the same as telling a Belt that he should only look for root causes in a certain department. If the mechanic tells you what the root cause was you could choose not to listen but then the problem would surely re-occur. In the Improve phase you will have to decide which of the suggested solutions to go for. It’s your car. The same goes with a Six Sigma project: it’s your process. And, finally, in the Control phase, which do you prefer: tell your family how to use your car yourself or do you think the mechanic should tell them?
Using this analogy, the meaning of the chart in Figure 11 becomes obvious. It is the responsibility of the process owner to define the project, select the solution and implement the improved process in the organisation. The Belt is responsible for investigating the problem, finding its root causes and suggesting solutions. This has become obvious to everyone who has participated in the Six Sigma management training.
Figure 11. Sharing of responsibilities between Black/Green Belt and Process Owner.
(edited from a presentation file developed by Simon Cooper, Siemens, 2005)
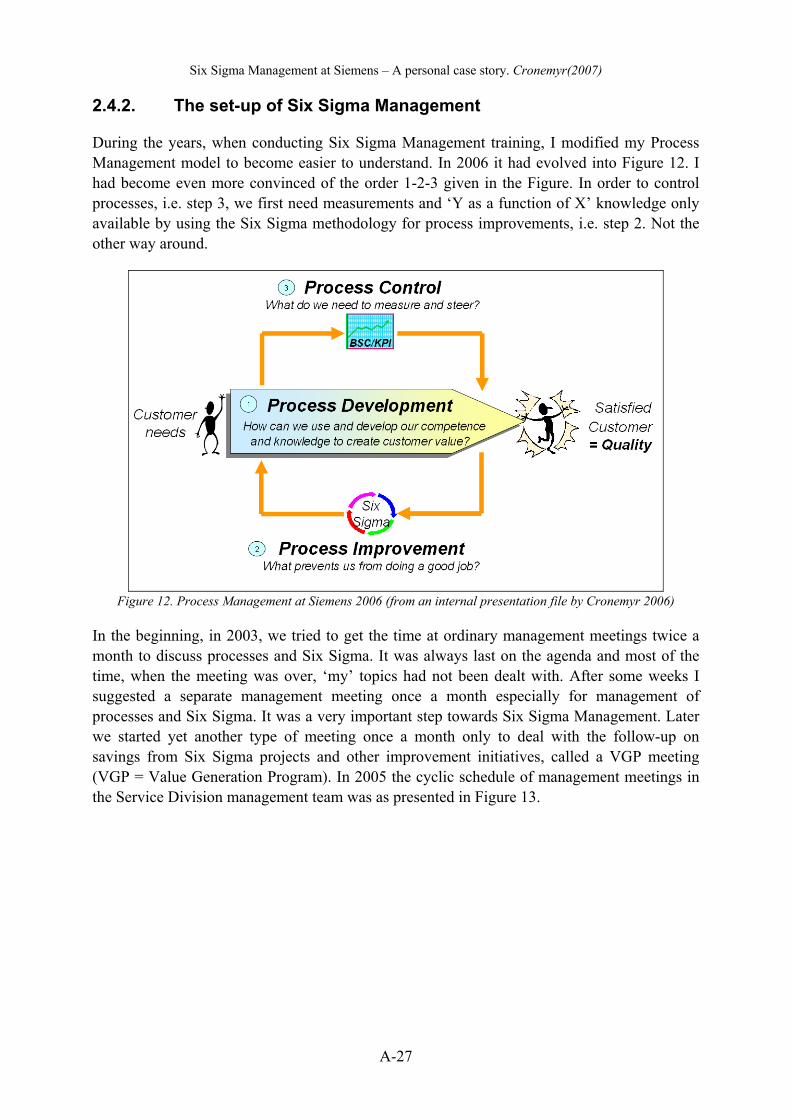
Six Sigma Management at Siemens – A personal case story. Cronemyr(2007)
A-27
2.4.2. The set-up of Six Sigma Management
During the years, when conducting Six Sigma Management training, I modified my Process Management model to become easier to understand. In 2006 it had evolved into Figure 12. I had become even more convinced of the order 1-2-3 given in the Figure. In order to control processes, i.e. step 3, we first need measurements and ‘Y as a function of X’ knowledge only available by using the Six Sigma methodology for process improvements, i.e. step 2. Not the other way around.
Figure 12. Process Management at Siemens 2006 (from an internal presentation file by Cronemyr 2006)
In the beginning, in 2003, we tried to get the time at ordinary management meetings twice a month to discuss processes and Six Sigma. It was always last on the agenda and most of the time, when the meeting was over, ‘my’ topics had not been dealt with. After some weeks I suggested a separate management meeting once a month especially for management of processes and Six Sigma. It was a very important step towards Six Sigma Management. Later we started yet another type of meeting once a month only to deal with the follow-up on savings from Six Sigma projects and other improvement initiatives, called a VGP meeting (VGP = Value Generation Program). In 2005 the cyclic schedule of management meetings in the Service Division management team was as presented in Figure 13.
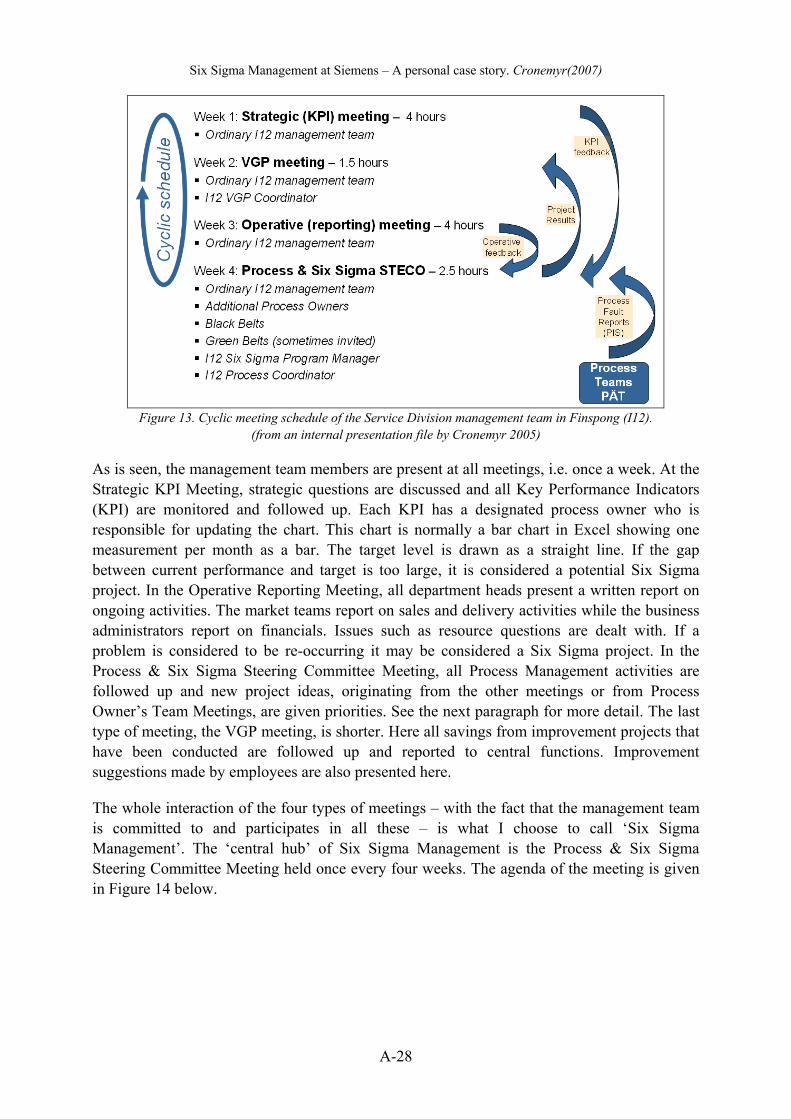
Six Sigma Management at Siemens – A personal case story. Cronemyr(2007)
A-28
Figure 13. Cyclic meeting schedule of the Service Division management team in Finspong (I12).
(from an internal presentation file by Cronemyr 2005)
As is seen, the management team members are present at all meetings, i.e. once a week. At the Strategic KPI Meeting, strategic questions are discussed and all Key Performance Indicators (KPI) are monitored and followed up. Each KPI has a designated process owner who is responsible for updating the chart. This chart is normally a bar chart in Excel showing one measurement per month as a bar. The target level is drawn as a straight line. If the gap between current performance and target is too large, it is considered a potential Six Sigma project. In the Operative Reporting Meeting, all department heads present a written report on ongoing activities. The market teams report on sales and delivery activities while the business administrators report on financials. Issues such as resource questions are dealt with. If a problem is considered to be re-occurring it may be considered a Six Sigma project. In the Process & Six Sigma Steering Committee Meeting, all Process Management activities are followed up and new project ideas, originating from the other meetings or from Process Owner’s Team Meetings, are given priorities. See the next paragraph for more detail. The last type of meeting, the VGP meeting, is shorter. Here all savings from improvement projects that have been conducted are followed up and reported to central functions. Improvement suggestions made by employees are also presented here.
The whole interaction of the four types of meetings – with the fact that the management team is committed to and participates in all these – is what I choose to call ‘Six Sigma Management’. The ‘central hub’ of Six Sigma Management is the Process & Six Sigma Steering Committee Meeting held once every four weeks. The agenda of the meeting is given in Figure 14 below.
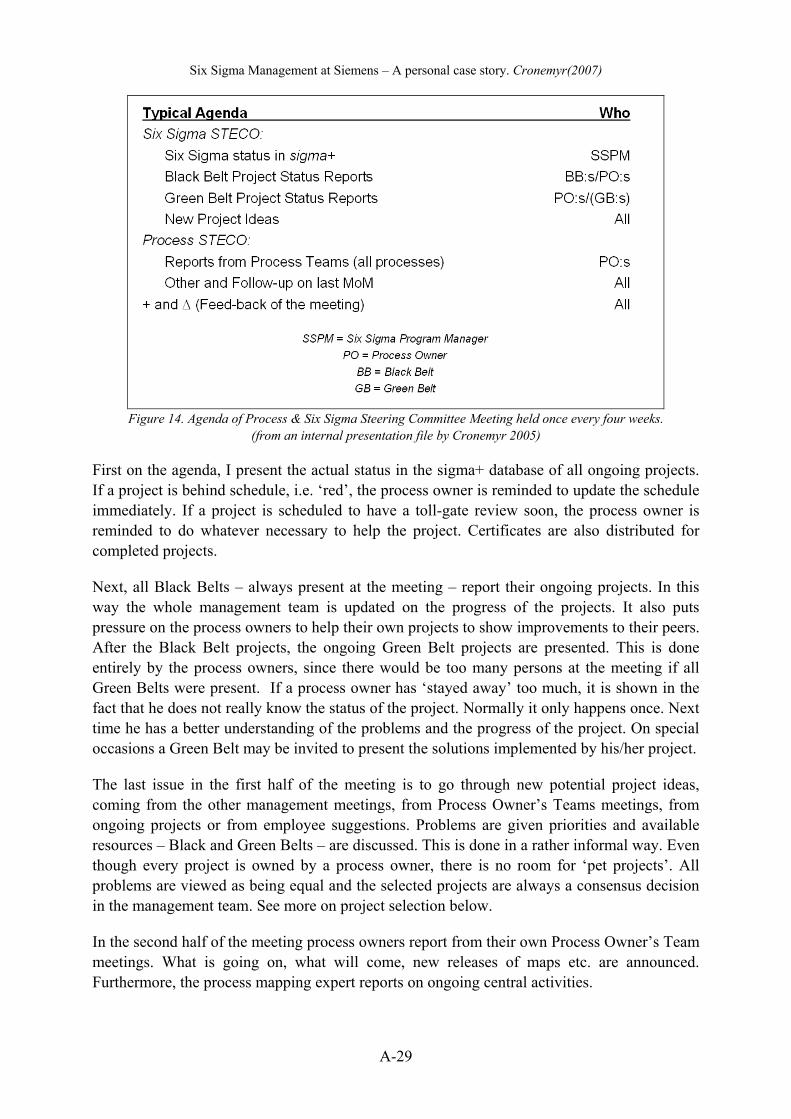
Six Sigma Management at Siemens – A personal case story. Cronemyr(2007)
A-29
Figure 14. Agenda of Process & Six Sigma Steering Committee Meeting held once every four weeks.
(from an internal presentation file by Cronemyr 2005)
First on the agenda, I present the actual status in the sigma+ database of all ongoing projects. If a project is behind schedule, i.e. ‘red’, the process owner is reminded to update the schedule immediately. If a project is scheduled to have a toll-gate review soon, the process owner is reminded to do whatever necessary to help the project. Certificates are also distributed for completed projects.
Next, all Black Belts – always present at the meeting – report their ongoing projects. In this way the whole management team is updated on the progress of the projects. It also puts pressure on the process owners to help their own projects to show improvements to their peers. After the Black Belt projects, the ongoing Green Belt projects are presented. This is done entirely by the process owners, since there would be too many persons at the meeting if all Green Belts were present. If a process owner has ‘stayed away’ too much, it is shown in the fact that he does not really know the status of the project. Normally it only happens once. Next time he has a better understanding of the problems and the progress of the project. On special occasions a Green Belt may be invited to present the solutions implemented by his/her project.
The last issue in the first half of the meeting is to go through new potential project ideas, coming from the other management meetings, from Process Owner’s Teams meetings, from ongoing projects or from employee suggestions. Problems are given priorities and available resources – Black and Green Belts – are discussed. This is done in a rather informal way. Even though every project is owned by a process owner, there is no room for ‘pet projects’. All problems are viewed as being equal and the selected projects are always a consensus decision in the management team. See more on project selection below.
In the second half of the meeting process owners report from their own Process Owner’s Team meetings. What is going on, what will come, new releases of maps etc. are announced. Furthermore, the process mapping expert reports on ongoing central activities.
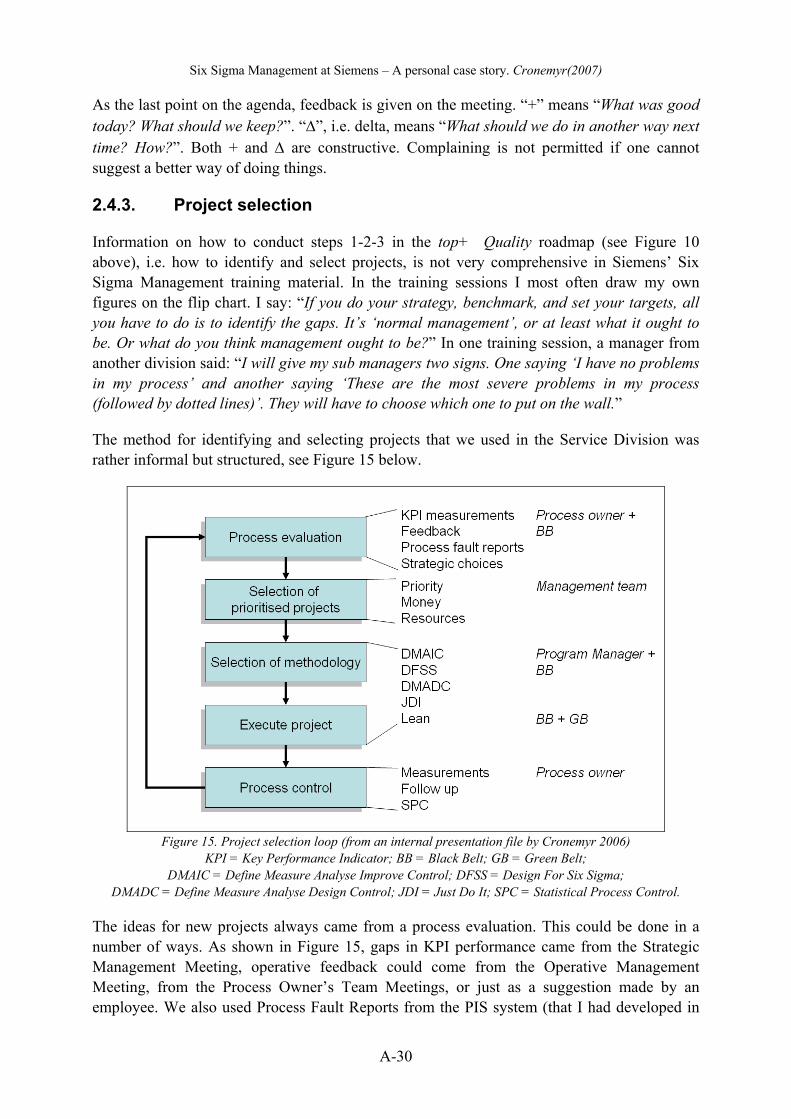
Six Sigma Management at Siemens – A personal case story. Cronemyr(2007)
A-30
As the last point on the agenda, feedback is given on the meeting. “+” means “What was good today? What should we keep?”. “∆”, i.e. delta, means “What should we do in another way next time? How?”. Both + and ∆ are constructive. Complaining is not permitted if one cannot suggest a better way of doing things.
2.4.3. Project selection
Information on how to conduct steps 1-2-3 in the top+ Quality roadmap (see Figure 10 above), i.e. how to identify and select projects, is not very comprehensive in Siemens’ Six Sigma Management training material. In the training sessions I most often draw my own figures on the flip chart. I say: “If you do your strategy, benchmark, and set your targets, all you have to do is to identify the gaps. It’s ‘normal management’, or at least what it ought to be. Or what do you think management ought to be?” In one training session, a manager from another division said: “I will give my sub managers two signs. One saying ‘I have no problems in my process’ and another saying ‘These are the most severe problems in my process (followed by dotted lines)’. They will have to choose which one to put on the wall.”
The method for identifying and selecting projects that we used in the Service Division was rather informal but structured, see Figure 15 below.
Figure 15. Project selection loop (from an internal presentation file by Cronemyr 2006)
KPI = Key Performance Indicator; BB = Black Belt; GB = Green Belt; DMAIC = Define Measure Analyse Improve Control; DFSS = Design For Six Sigma;
DMADC = Define Measure Analyse Design Control; JDI = Just Do It; SPC = Statistical Process Control.
The ideas for new projects always came from a process evaluation. This could be done in a number of ways. As shown in Figure 15, gaps in KPI performance came from the Strategic Management Meeting, operative feedback could come from the Operative Management Meeting, from the Process Owner’s Team Meetings, or just as a suggestion made by an employee. We also used Process Fault Reports from the PIS system (that I had developed in
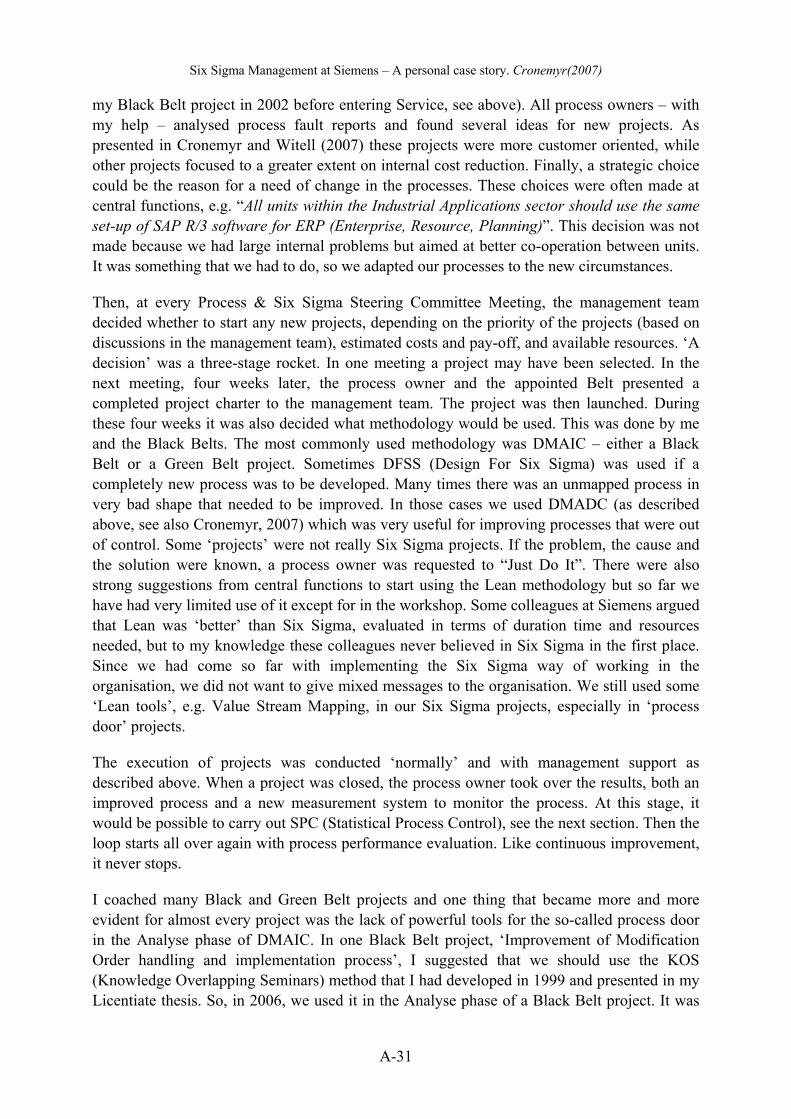
Six Sigma Management at Siemens – A personal case story. Cronemyr(2007)
A-31
my Black Belt project in 2002 before entering Service, see above). All process owners – with my help – analysed process fault reports and found several ideas for new projects. As presented in Cronemyr and Witell (2007) these projects were more customer oriented, while other projects focused to a greater extent on internal cost reduction. Finally, a strategic choice could be the reason for a need of change in the processes. These choices were often made at central functions, e.g. “All units within the Industrial Applications sector should use the same set-up of SAP R/3 software for ERP (Enterprise, Resource, Planning)”. This decision was not made because we had large internal problems but aimed at better co-operation between units. It was something that we had to do, so we adapted our processes to the new circumstances.
Then, at every Process & Six Sigma Steering Committee Meeting, the management team decided whether to start any new projects, depending on the priority of the projects (based on discussions in the management team), estimated costs and pay-off, and available resources. ‘A decision’ was a three-stage rocket. In one meeting a project may have been selected. In the next meeting, four weeks later, the process owner and the appointed Belt presented a completed project charter to the management team. The project was then launched. During these four weeks it was also decided what methodology would be used. This was done by me and the Black Belts. The most commonly used methodology was DMAIC – either a Black Belt or a Green Belt project. Sometimes DFSS (Design For Six Sigma) was used if a completely new process was to be developed. Many times there was an unmapped process in very bad shape that needed to be improved. In those cases we used DMADC (as described above, see also Cronemyr, 2007) which was very useful for improving processes that were out of control. Some ‘projects’ were not really Six Sigma projects. If the problem, the cause and the solution were known, a process owner was requested to “Just Do It”. There were also strong suggestions from central functions to start using the Lean methodology but so far we have had very limited use of it except for in the workshop. Some colleagues at Siemens argued that Lean was ‘better’ than Six Sigma, evaluated in terms of duration time and resources needed, but to my knowledge these colleagues never believed in Six Sigma in the first place. Since we had come so far with implementing the Six Sigma way of working in the organisation, we did not want to give mixed messages to the organisation. We still used some ‘Lean tools’, e.g. Value Stream Mapping, in our Six Sigma projects, especially in ‘process door’ projects.
The execution of projects was conducted ‘normally’ and with management support as described above. When a project was closed, the process owner took over the results, both an improved process and a new measurement system to monitor the process. At this stage, it would be possible to carry out SPC (Statistical Process Control), see the next section. Then the loop starts all over again with process performance evaluation. Like continuous improvement, it never stops.
I coached many Black and Green Belt projects and one thing that became more and more evident for almost every project was the lack of powerful tools for the so-called process door in the Analyse phase of DMAIC. In one Black Belt project, ‘Improvement of Modification Order handling and implementation process’, I suggested that we should use the KOS (Knowledge Overlapping Seminars) method that I had developed in 1999 and presented in my Licentiate thesis. So, in 2006, we used it in the Analyse phase of a Black Belt project. It was
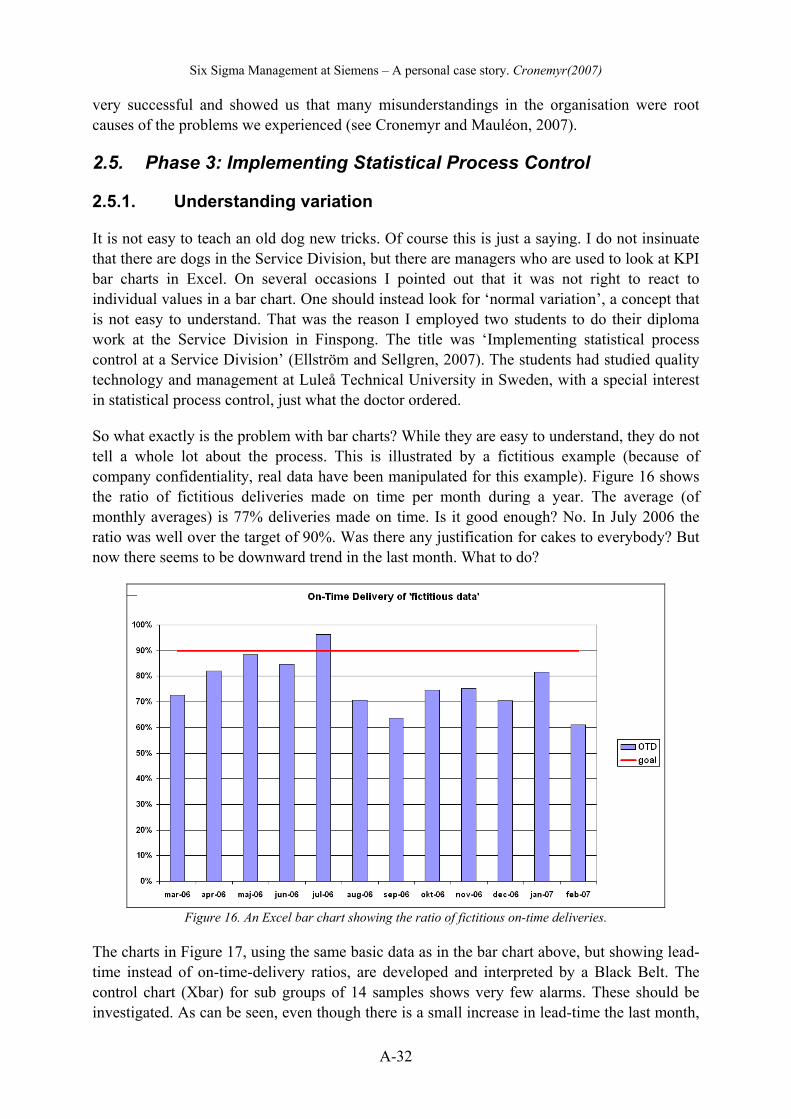
Six Sigma Management at Siemens – A personal case story. Cronemyr(2007)
A-32
very successful and showed us that many misunderstandings in the organisation were root causes of the problems we experienced (see Cronemyr and Mauléon, 2007).
2.5. Phase 3: Implementing Statistical Process Control
2.5.1. Understanding variation
It is not easy to teach an old dog new tricks. Of course this is just a saying. I do not insinuate that there are dogs in the Service Division, but there are managers who are used to look at KPI bar charts in Excel. On several occasions I pointed out that it was not right to react to individual values in a bar chart. One should instead look for ‘normal variation’, a concept that is not easy to understand. That was the reason I employed two students to do their diploma work at the Service Division in Finspong. The title was ‘Implementing statistical process control at a Service Division’ (Ellström and Sellgren, 2007). The students had studied quality technology and management at Luleå Technical University in Sweden, with a special interest in statistical process control, just what the doctor ordered.
So what exactly is the problem with bar charts? While they are easy to understand, they do not tell a whole lot about the process. This is illustrated by a fictitious example (because of company confidentiality, real data have been manipulated for this example). Figure 16 shows the ratio of fictitious deliveries made on time per month during a year. The average (of monthly averages) is 77% deliveries made on time. Is it good enough? No. In July 2006 the ratio was well over the target of 90%. Was there any justification for cakes to everybody? But now there seems to be downward trend in the last month. What to do?
Figure 16. An Excel bar chart showing the ratio of fictitious on-time deliveries.
The charts in Figure 17, using the same basic data as in the bar chart above, but showing lead-time instead of on-time-delivery ratios, are developed and interpreted by a Black Belt. The control chart (Xbar) for sub groups of 14 samples shows very few alarms. These should be investigated. As can be seen, even though there is a small increase in lead-time the last month,
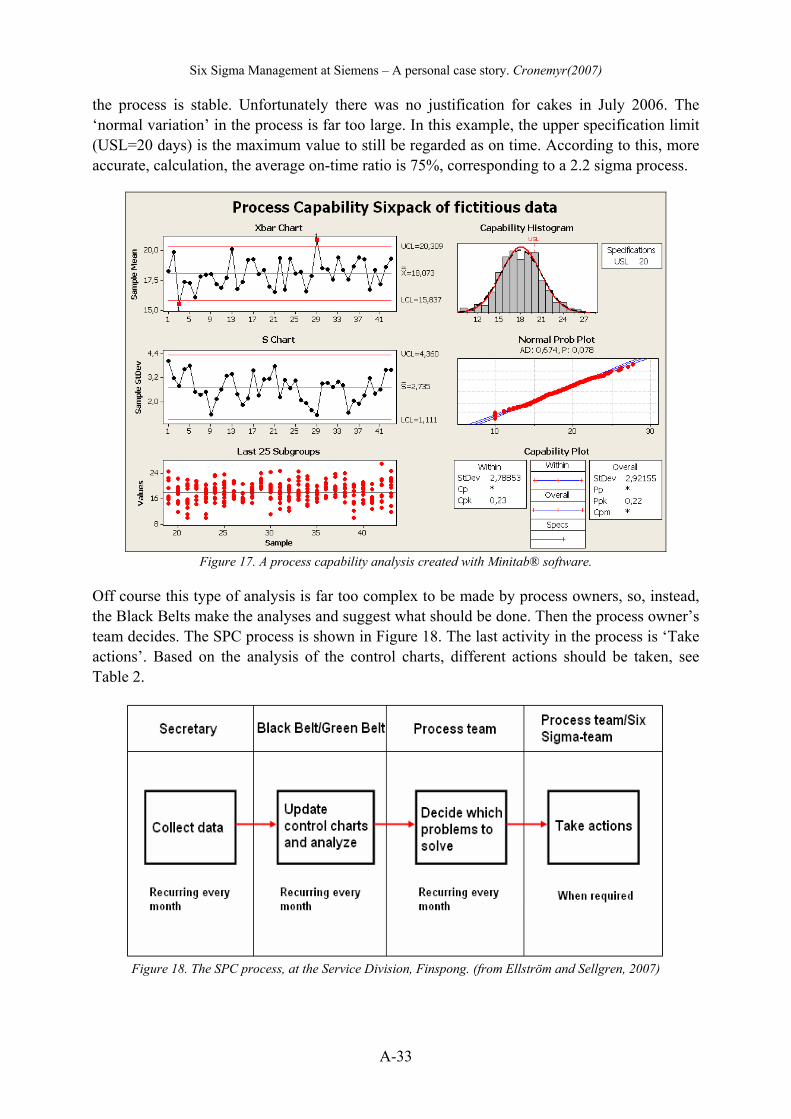
Six Sigma Management at Siemens – A personal case story. Cronemyr(2007)
A-33
the process is stable. Unfortunately there was no justification for cakes in July 2006. The ‘normal variation’ in the process is far too large. In this example, the upper specification limit (USL=20 days) is the maximum value to still be regarded as on time. According to this, more accurate, calculation, the average on-time ratio is 75%, corresponding to a 2.2 sigma process.
Figure 17. A process capability analysis created with Minitab® software.
Off course this type of analysis is far too complex to be made by process owners, so, instead, the Black Belts make the analyses and suggest what should be done. Then the process owner’s team decides. The SPC process is shown in Figure 18. The last activity in the process is ‘Take actions’. Based on the analysis of the control charts, different actions should be taken, see Table 2.
Figure 18. The SPC process, at the Service Division, Finspong. (from Ellström and Sellgren, 2007)

Six Sigma Management at Siemens – A personal case story. Cronemyr(2007)
A-34
Table 2. Actions to be taken from control chart analysis. (adapted from Ellström and Sellgren, 2007)
Problem Action
Too high natural variation Analyse and improve the process by means of a Six Sigma project.
Unsatisfying mean Adjust the mean, e.g. by adding resources. If the mean is not improved, launch a Six Sigma project.
Sporadically occurring alarms Investigate each alarm and fix the problem.
Acceptable mean and acceptable variation within control limits (i.e. no problem)
Do nothing.
Here is the dilemma. Most of the time there are no numbers to chart, as described above. Hence Six Sigma projects need to be run just to deliver measurement systems to the process owners. The systems can then be used when setting up the SPC process and generating the control charts. Furthermore, after a Six Sigma project, the process owner should have a reasonably good understanding of ‘the x:es, Y:s, and the Y=f(x)’, i.e. he should know what to do if the mean starts to drift.
The students set up seven different control charts by using results of previous Six Sigma projects. At the time of this writing, the SPC process is being implemented in the Service Division. Process owners’ teams are being trained. The benefits of using control charts as a complement to bar charts are still to be seen. It is the ‘Six Sigma’ way of thinking, but such a profound change takes long time.
2.5.2. Utilising processes with the help of IT solutions
In 2004 I had presented the process requirements for development of new IT support systems based on the new Service strategy (see Figure 4). Since then we had spent much time and resources locally on a very large project working on “Electronic as-maintained documentation” (to the left in the Figure). We had also participated in a global project to realise “Data interface with global access to local back office systems” (to the right in the Figure). Now it was time for the centre of the Figure, i.e. “Efficient and effective tools in all processes”. At the end of 2006 the processes had been developed to such a level that they could be implemented in the Customer Service (CS) module of the SAP R/3 software. The CS module had been investigated at least twice before but never thought to fit with the processes as they were then. All activities in Sell Service and Deliver Service were now ‘coded’ in the software. Many activities had to be changed to ‘fit’ the software but, as a result, many strengths of the software could be utilised. Furthermore, many solutions from Six Sigma projects, e.g. Planning, Forecasts, Modification Orders, Service Bulletins, Inspection Reports and Maintenance Plans, could be implemented in the ‘SAP coded’ process. The project manager for this large process development project was one of the Black Belts. It was clear to everyone at the Service Division that this was in fact a process development project, but at central functions and at the local IT department it was seen as an IT implementation project. We always had to argue that the IT support tools would generate profits in the processes but

Six Sigma Management at Siemens – A personal case story. Cronemyr(2007)
A-35
restrictions on ‘IT costs’ – without any consideration of process profits – often delayed and disturbed the progress of Six Sigma projects and other process development projects. All employees were trained in how to perform the tasks of the processes in the CS module.
2.5.3. The second crisis
In a period of more than three years, we had now run approximately 30 Six Sigma projects and worked extensively with mapping and developing the processes, including developing IT support systems and documentation systems. Even so, measurements and follow ups indicated that not everyone followed the processes. Some KPIs did not improve as much as expected.
We had found that one of the root causes of why processes were not followed was that many of the middle managers had not been sufficiently involved in the process development work. While most of them had gone to training and provided resources for process development projects, they had not had the time to sit down with their groups or departments to go through the processes thoroughly. The managers needed to know the processes at least as well as their employees did; otherwise they could not support, steer and follow up the work in their groups and departments.
It was time for another big information meeting, but this time we were much more ambitious than we were in the previous information meetings. This time all the process owners had to deliver their own presentations. We in the Business Excellence Department helped to provide charts and material but we would not do the talking. After a short introduction by the division manager of the Service Division, I started the meeting by talking about Six Sigma Management, showing several of the figures used in this paper. Each of the six main process owners then presented the name and a short overview of the process, summary of the problems we had two years ago, what we had done since then (including presentations of executed Six Sigma projects), what it looks like now, and a short hint as to what is next to come. As the last point on the agenda I presented what should be done next in all the groups within Service (see the QCC workshops below).
The presentation meeting described above was first held twice for all mangers within Service. The purpose was that all managers should know all the material so well that they could answer the questions of their employees. A further purpose was for all managers to be able to put questions and make improvement suggestions about the presentations. As a result, all presentations were modified and improved before the big information meeting for all the employees of Service.
A funny anecdote… During one of the presentations, the process owner of ‘Develop Service Product’ said “We are now going to use the common PDP [product development process] of Siemens PG I. Rumour has it that it was once developed here in Finspong.” I did not say anything, but it was the process I had developed in 2000. Even though it had been developed further since, it was still a Power Point file.
At Siemens there was a central initiative called Quality Culture Change (QCC). All parts of the PG organisation had to hold workshops as specified in slides sent out from central functions. We felt a little offended by this since we had come very far in our quality culture
Six Sigma Management at Siemens – A personal case story. Cronemyr(2007)
A-36
work compared to some other parts of the organisation, but we soon realised that we could actually use this in a beneficial way by getting people to know and follow the processes. Hence I presented to everybody what should be done in the QCC workshops within Service. Instead of telling everybody that they must improve their quality – naturally taken as an insult by people doing their best every day – I said “Let’s follow and improve our processes to free ‘error-fixing’ time to be able to use it as ‘satisfying-customers’ time instead.”
The managers were prepared. Now the activities that every group within Service had to do were:
1. Go through all Service processes as presented on the intranet. Focus on the processes in which the group normally works. Report when completed.
2. Identify areas where the group does not follow the processes. Make an action plan for training, follow-up etc. Report when completed. The action plan is kept in the group. We are not trying to change from a Quality Culture to a Blaming Culture.
3. Identify areas where the group is following the processes but there are suggestions for how they could be improved. Develop short improvement suggestions and deliver those to the process owners of the processes in question. The Process Owner’s Teams decide what changes should be implemented and when to do so. Until then, the current processes are still valid.
4. Consider whether there are processes not described on the intranet that the group is working in. Make a short description of who is the customer and what is done in the process. Contact other groups that work in the same process. Together, develop a short presentation of the process and an explanation for why the process should be mapped and developed. Report to Business Excellence. The management team will decide at a Process & Six Sigma Steering Committee Meeting which new processes should be launched. Processes that are launched will have process owners with teams and will work ‘by the book’, i.e. according to the Process Development Process.
Activities 1 and 2 were mandatory, while 3 and 4 were optional and were not necessary if all existing processes were considered sufficient and satisfactory. Follow-up of the progress in all groups was done by me and reported to the management team at Process & Six Sigma Steering Committee Meetings.
There is no quantification yet of the impact of the QCC workshops and the introduction of the CS module in SAP, but there is a general feeling that this was the first time that everyone in the organisation – including middle management – was truly committed and engaged in the processes.
In a recent survey of ‘Six Sigma and Work Satisfaction Consequences’ by Schön (2007) done at Siemens and Ericsson, the employees of the Service Division at Siemens were very positive to Six Sigma and how Six Sigma had affected their job situation and the company. As could be suspected, active people such as Black and Green Belts were very positive, but – maybe
Six Sigma Management at Siemens – A personal case story. Cronemyr(2007)
A-37
more surprisingly – people that had not been involved in Six Sigma projects were also positive, though not as much as the Belts.
Whether the second crisis has been fully managed remains to be seen. I think so, but there will more crises. You do not have to be Hari Seldon in Isaac Asimov’s Foundation to understand that. While “quality never goes out of style” it is the nature of continuous improvement to face and deal with crises.
2.6. Goals and directions for the future
2.6.1. Management processes
The Service processes at Siemens in Finspong are continuously being improved and new processes are established and developed, especially with the input of the ‘Quality Culture Change’ workshops. So far the three core processes have been thoroughly developed. There are six support processes under development. Some have come far while others are in the early phase of define. The next step is to establish management processes. This is something that we have very limited experience of.
According to Ljungberg and Larsson (2001) “Many managers have difficulties seeing how their work could be described as a structured process. […] Maybe they think their work is too complicated to be mapped and described as a process. […] With the support of management process descriptions it is easier for the manager to understand what is expected from him/her and what needs to be done in order to steer and coordinate the core and support processes. Unfortunately, in reality management processes are often left to their fate.” (Ljungberg and Larsson, 2001, pp. 186-187, translated from Swedish).
The management team had worked with processes for such a long time, trying to convince everybody about the pros of having described processes, that they realised it was in fact time to map ‘their own’ processes. The benefits are the same as in all other processes: easier to learn the job and transparency of work methods to other employees, i.e. in addition to the most important advantage: a mapped process can be improved. The four ‘top’ management processes defined so far are very roughly: ‘Develop Vision, Identity and Strategy’, ‘Financial Controlling’, ‘Resource Management’ and, finally, ‘Process Management’. It was an embarrassing fact that the Process Management process had not been sufficiently mapped and described. It was high time.
2.6.2. Process development instead of reorganising
One consequence of conducting Process Management over a period of several years was fewer reorganisations. This was not expected but it seems to be a perfectly plausible consequence since problems that used to be viewed as ‘organisational problems’ were now instead viewed as ‘process problems’. Unlike reorganisations, dealing with the process problems solved the problems. The organisation could focus on the development of skills and knowledge of certain roles, while problems were solved in the processes.
Six Sigma Management at Siemens – A personal case story. Cronemyr(2007)
A-38
When the major processes had been described and accepted as a way of working, another phenomenon appeared. The market teams were central parts of the Service organisation. They had lived on since ‘before processes’. They were designed as cross-functional project organisations to take on ‘all sorts of problems’ that could arise in marketing, selling, delivering and getting paid for service in their specific market regions. Now, when processes were described, it was obvious that the same people had to do too many things at the same time, i.e. the members of the market teams now had several ‘new’ tasks in addition to the ‘old’ tasks. These new tasks were things that had not been carried out before, leading to many of the problems that now had been dealt with by the Six Sigma projects conducted during the last years. Hence the discussion started of whether it would not be better to go back to functional departments, i.e. more specialisation. The way of Taylor once again. Had we gone full circle? Was that really what we wanted? These discussions have not led to a decision yet. It could lead to a major reorganisation and disintegration of the market teams, but it is more likely that some new roles will be defined and that the existing roles in the market teams will be more clearly defined. The future will tell.

Six Sigma Management at Siemens – A personal case story. Cronemyr(2007)
A-39
3. Analysis and findings
3.1. Learning from past failures – using PDSA
On several occasions I have suggested that the Six Sigma programme at Alstom Power was a failure. That should not be misinterpreted such that the company Alstom Power should be ‘blamed’ for it. I am personally very happy that Alstom Power initiated Six Sigma in Finspong. In some details, as described elsewhere, the Six Sigma programme at Alstom Power was not as strong as the one in Siemens, but the main difference between the two is the following: at Alstom Power we did everything for the first time, while at Siemens we had the chance to try it again. If, purely hypothetically, we had started Six Sigma in Siemens, and then have been bought by Alstom Power, and then re-started Six Sigma, perhaps the same would have happened. It is not impossible. Since implementing Six Sigma means such large and fundamental changes to an organisation, how could you expect it to succeed without failures when it was done for the first time?
If I were to choose only one failure as the worst one, it would clearly have to be ‘lack of management commitment’. Because of that, Six Sigma failed when it was first implemented in Finspong – under the company name of Alstom Power. When Siemens took over we were ‘forced’ to re-start Six Sigma. I was one of very few people who were happy about this. If we had not been forced, Six Sigma would today be just another failed programme launched by top management – located somewhere else in the world, and not in Finspong.
Instead, we had the chance to do it again, this time with a fresh memory of how not to do it. When we started up the Six Sigma programme and other process management activities in the Service Division, I expressed very clearly why the management team had to take on full responsibility for the implementation, and they did. Hence we used the learning opportunity given by Shewhart in the Shewhart cycle (see e.g. Bergman and Klefsjö, 2002), i.e. PDSA – Plan, Do, Study, Act – where “Act” means to study past failures and to learn from them. When the cycle re-starts with “Plan” one is expected to do it in a new – better – way, not make the same mistake again. That is indeed what we did.
3.2. Dealing with crises – the PDSA cycle keeps spinning
So, while we experienced some failures in Alstom Power, we experienced some more in Siemens. Fortunately the PDSA cycle continued to spin as well. When we had small problems we dealt with them on a day-to-day basis. But when we had big problems, there was a crisis.
The first crisis was the delays in the Green Belt projects and the unmotivated Green Belts. We solved that by several changes, the most important one being much more time and resources spent on coaching.
The second crisis was the lack of middle management involvement. We solved that by training and the QCC workshops (QCC = Quality Culture Change) and, to some extent, also by the introduction of the CS module in SAP R/3.

Six Sigma Management at Siemens – A personal case story. Cronemyr(2007)
A-40
Both crises evolved and were dissolved in a similar manner. They were no bolts from the blue. Rather, they gathered steam over a long time – when we tried to solve the problems on a day-to-day basis but they did not disappear – until a day when something more thorough had be done. Even then, there were no quick changes. There were several meetings and discussions among the Belts, in the Business Excellence Department, and in the Management Team. It took several months for me to change position to become a Six Sigma Program Manager, and to plan and conduct all the QCC workshops. On both occasions the PDSA cycle and actually the DMAIC methodology were used, even though no formal project was run. When I described the first crisis in an internal report I even used the phase names of DMAIC as headings. The ‘Control Phase’ of the second crises is still to be completed.
3.3. Success factors (SF) for implementing Six Sigma identified at Siemens
Below is an analysis of the so-called success factors identified at the Service Division. I have selected them on the basis of past failures, crises and other events and issues that I claim were very important to the success of the Six Sigma programme in the Service Division at Siemens in Finspong. The success factors are compared with ones given in the literature. Note that they are not given in order of importance. They are all important, but I do not want to rank them.
3.3.1. SF #1: Management commitment
I have not read one single research or management paper on success factors that did not mention management commitment. It goes without saying.
How can one expect anything to happen without management commitment? Some may argue that one can use a ‘bottom-up approach’ but that is not the same as uncommitted management. Even with a ‘bottom-up approach’ management needs to be committed if the results of Six Sigma projects will have any effect on the business. Otherwise management is conducting ‘business as usual’ while people in the organisation are trying to change. That was our experience from the time when we were Alstom Power, and some divisions had not left that condition, but the Management Team of the Service Division had left that behaviour behind and changed. Not even a ‘top-down approach’ will work without management commitment. It is actually quite common to have ‘top-down’ initiatives without management commitment. When this happens, some new ‘very important’ PowerPoint presentation is sent out from top management while everyone can see that, since management is still conducting ‘business as usual’, it can not be that important.
Management commitment is much more than saying ‘this is important’. Management needs to change behaviour and show it. That was what happened in the Service Division when process owners and the rest of the management team actively participated in Six Sigma projects and Process Management activities, i.e. in Six Sigma Management.
Six Sigma Management at Siemens – A personal case story. Cronemyr(2007)
A-41
3.3.2. SF #2: Committed driver
This is seldom mentioned in the literature, except as a part of management commitment, e.g. Jack Welsh of GE.
Since 2005, my role has been Six Sigma Program Manager. My tasks were very much the same as Magnusson et al. (2003) describe the tasks of a Champion but, from what I have seen, the Champion is often ‘too high up’ in the organisation to deal with the nitty gritty. I was also doing ‘MBB tasks’ since I was coaching Belts, teaching employees and managers, and developing new Six Sigma tools. In a business review meeting our German Division manager told me: “The reason why Six Sigma Management has been so successful in Finspong is you. You have the knowledge and the motivation to drive this process”. Being a Swede I was of course very embarrassed to receive this compliment in front of the management team so I immediately replied: “That may be so but remember that I did not succeed in the same way in the Gas Turbine Division. Without these individuals in the Service Management Team it would not have happened.” I guess both are needed. The management team may really want and try to change their behaviour but, without the support and knowledge of a committed driver, there is a risk of ending up with ambitions and decisions without any action.
3.3.3. SF #3: Learn from history
‘Ability to learn from history’ was suggested as a success factor by the people at the companies studied by Schön (2006) but was not mentioned elsewhere in the literature.
On several occasions when someone suggested taking a shortcut I said “no, we tried that before and it did not work”. That is normally not a good argument – it sounds like a whining old man – unless you can give the reasons why it did not work and a better way to do it. The whole idea of the Process Management model and Six Sigma management was built on ‘past failures’. If failure is a goldmine, you have to first experience the failure, then learn from it, and finally make it right. It is the true meaning of “the A” in PDSA – Plan, Do, Study, Act – i.e. the Shewhart cycle (see e.g. Bergman and Klefsjö, 2002). That is the path to success.
3.3.4. SF #4: Coaching
This is not directly mentioned in the literature, but may very well lie hidden in ‘Focus on training’, ‘Knowledge and competence’ or ‘Supporting infrastructure’.
A lack of coaching was the root cause of the first crisis. In a report to central functions in Germany I tried to explain why it takes longer to carry out the first project and why extensive coaching is needed. I wrote:
It is almost like learning to drive a car. We have given the Green Belt a book on how to drive, then we say, “OK, drive to Stockholm. I’ll meet you there and we can discuss whether you had any problems. See you in 180 minutes. It can be done!”. Sure it can be done by someone who is experienced but not the first time you sit behind the wheel. Of course the Green Belt needs a coach by his side all the time in the beginning. If we leave him it will take 360 minutes because he didn’t know which way to go and he never changed from first gear.

Six Sigma Management at Siemens – A personal case story. Cronemyr(2007)
A-42
As the reader surely understands, the 200 km from Finspong to Stockholm is the project and the minutes of driving correspond to the number of days the project runs.
When I quit my job as manager of the Business Excellence Department and turned full time Six Sigma Program Manager in November 2005, I could spend much more time on coaching Green and Black Belts as well as process owners. As seen in Figure 7, this put many projects on track again.
3.3.5. SF #5: Middle management involvement
‘Involvement of middle management’ was also suggested as a success factor by the people at the companies studied by Schön (2006).
It was our second crisis. We had found that one of the root causes of why processes were not followed was that many of the middle managers had not been sufficiently involved in the process development work. They had not had the time to sit down with their groups or departments to go through the processes thoroughly. The managers needed to know the processes at least as well as their employees did; otherwise they could not support, steer and follow up the work in their groups and departments. This was taken care of in the so-called ‘QCC workshops’, which made employees and middle management truly committed to and engaged in the processes and Six Sigma.
3.3.6. SF #6: Six Sigma integrated into Process Management
In the literature, integration is treated ‘outside’ of Six Sigma as a separate topic, even though it ought to be included in ‘Strategy for implementation’, mentioned as a success factor. From previous research on ‘Integration of Six Sigma and Process Management’ it can be concluded that no one has really suggested how to do it, even though several say it ought to be done (see e.g. Scaletta, 2006). There is one discussion on the level to which Six Sigma should be deployed (see e.g. Magnusson et al., 2003), i.e. should one use Six Sigma tools only, should one use the DMAIC roadmap, or should one change every part of the business including management, but it is deployed ‘in an organisation’, not a process. Then there are the descriptions of ‘business Process Management models’ at IBM and GE where Six Sigma seems to be an ‘extra feature’, but not ‘a central part’, of Process Management. To me it is all confusing and inconsistent.
Our experiences at Siemens tell us that, to gain sustainable results and to have a natural framework for starting, executing and closing Six Sigma projects, Six Sigma must be integrated into Process Management. It can not be run ‘in the organisation’ without processes. The proposed Process Management model (see Figure 12) is built of three stages: 1) Process Mapping and Development, 2) Process Improvement and 3) Process Control. In order to control processes, i.e. step 3, we first need established processes (step 1) and ‘Y as a function of X’ knowledge, which is only available by using the Six Sigma methodology for process improvements, i.e. step 2. Not the other way around, as described in the literature (see e.g. Snee and Hoerl (2002), Bergman and Klefsjö (2003) or Magnusson et al. (2003)).
Six Sigma Management at Siemens – A personal case story. Cronemyr(2007)
A-43
3.3.7. SF #7: Supporting infrastructure
‘Supporting Infrastructure’ is almost as frequently mentioned in the literature as ‘Management commitment’. Snee and Hoerl (2002) suggest there should be: a formal project selection process, a formal project review process, full time resources and integration of Six Sigma projects with the companies’ financial systems.
In Alstom Power we lacked most of that; in Siemens we had it all. Many of the ‘systems’, such as the sigma+ project tracking software system, roles and procedures for managing projects, were provided by the top+ Quality system at Siemens, but the most important part was the Six Sigma Management system, as described in Figures 13-15, developed locally in the Service Division in Finspong. The central hub of Six Sigma Management was the Process and Six Sigma Steering Committee Meeting every four weeks.
3.3.8. SF #8: Process perspective
The literature elaborates on differences between BPR and TQM, but very few debaters discuss the differences between a ‘product perspective’ and a ‘process perspective’. This is somewhat surprising since one of Shewhart’s main messages was to focus on the process and the prediction of future products instead of focusing on each and every sample of today’s products (Shewhart, 1931).
As we found and presented in a paper (Cronemyr and Witell, 2007), product fault analysers (designers and engineering specialists) often thought of a product fault as “a one-time error that only needed to be fixed once; when the design had been changed the problem was solved” while the process owners recognised the fault as “something seen many times before”, i.e. as re-occurring. This is called ‘a product perspective’ vs. ‘a process perspective’. One explanation could be the more theoretical nature of the knowledge domains involved in gas turbine development compared to the knowledge domains involved in service execution, which does not involve as many theoretical calculations or as much theoretical knowledge. Almost everyone at the Gas Turbine Development Department had a university degree while the average level of education at the Service Department was lower. The ‘theoretical knowledge’ in gas turbine development was in deterministic areas such as physics or engineering but was limited in probabilistic areas such as statistics. Hence most people in the Gas Turbine Division had a product perspective, while most people in the Service Division had a process perspective. I suspect this may be an explanation for why the deployment of Process Management and Six Sigma was more successful in Service.
Another very important aspect of a process perspective is the skills and experiences of process mapping techniques. Common pitfalls in mapping are e.g. confusing organisation for process, focusing on roles instead of flow, mapping ‘error fixing’ processes instead of ‘making things right’ processes, mixing information flow with activities, considering management tasks in an operational process as a separate process, and especially ‘lobotomising’ processes, i.e. cutting off processes at organisational boundaries. The reason why we developed the Process Development Process was to avoid these pitfalls. We used it successfully – and still do – in Service, but other parts of the organisation did not use it.
Six Sigma Management at Siemens – A personal case story. Cronemyr(2007)
A-44
3.3.9. SF #9: Adaptation to local organisations situation and needs
Sandholm and Sörqvist (2002) identify ‘adaptation to an organisation’s situation and needs’ as one of the twelve requirements for Six Sigma success. One also gets an inkling of this idea in Karlson and Sandvik-Wiklund’s (1997) suggestion that one should have a certain level of method uncertainty when implementing a quality method.
We were driving according to our local goals in Finspong, certainly adapting to what was decided centrally and using the best parts of the central initiative top+ Quality, but we always adapted everything to our local history and current needs. People need to feel they are in charge of the situation, not simply executing what has been decided by top management. The process owners in Finspong implemented and used Six Sigma to fit their own purposes, and that is why they were so committed.
On several occasions central functions told us ‘what to do’ but I always argued for the benefits of doing it our way. Many times ‘our way’ became ‘best practice’, which was something we had not aimed for. As we did not want others to tell us what to do, we did not want to tell others to do it our way. I say, let people be committed and do it their way. Some may disagree, since Process Management to many people means ‘standardisation’.
3.3.10. SF #10: Project selection and methodology selection
‘Giving priority to and selecting projects’ is one of the top success factors suggested, mentioned by e.g. Goldstein (2001), Antony and Banuelas (2002) and Sandholm and Sörqvist (2002). The latter feel that “operational managers – the problem owners – should make these decisions”.
When identifying, suggesting and selecting projects, we used the division of responsibilities as given in Figure 15. The ideas for new projects always came from a process evaluation. Often they were created by an ‘operational manager’ and given to one of process owners. The process owner suggested a new project and the management team then decided which projects would be started. Sandholm and Sörqvist do not mention the process owners, but that is because they run Six Sigma in an organisation, not as an integral part of Process Management.
The most important lesson to be learnt from our failures is that Black Belts and Green Belts should not select their own projects. It should be done by management, i.e. ‘the car owners’.
When it comes to the selection of methodology, it is not mentioned in the literature as a success factor. There are of course detailed descriptions of how to use DMAIC, DFSS, Lean etc., but limited information about when to choose what. Some authors are very dogmatic about their own favourite methodology (e.g. Chowdhury (2002) on DFSS) but that is not very helpful.
As we found, if DMAIC is used ‘by the book’ in projects improving out of control processes, it may fail. Since most processes are out of control when a Six Sigma programme is started in a company, this is a major threat to the success of Six Sigma. By choosing methodology based
Six Sigma Management at Siemens – A personal case story. Cronemyr(2007)
A-45
on the state of the process to be improved, as described in Cronemyr (2007), this threat can be minimised.
3.3.11. SF #11: Use of talented full time resources
Snee and Hoerl (2002) had ‘use of top talent’ as one of the their three characteristics in successful Six Sigma companies. At less successful companies whoever was available was appointed Black Belt. ‘Investment in adequate resources’ has been suggested as a success factor by e.g. Goldstein (2001), Pande et al. (2000) and Sandholm and Sörqvist (2002). Thus, according to the literature, both the quality and the quantity of resources are important.
We were very serious in our appointment of both full time Black Belts and part time Green Belts. They were selected because of their skills and they were considered suitable as Six Sigma project leaders. They were not people ‘just hanging around’. As for the Black Belts, it was successful because they successfully conducted very complex projects in the Service organisation, which proved that they were of ‘the right stuff’. On the other hand, the first crisis showed us that we had problems with the Green Belts. They were already busy people and it was almost impossible to manage their projects on a 20% basis. They needed to spend at least 50% on their projects, which they were not prepared for. We now know that this has to be planned well in advance before sending people to training.
We also need team members for all the Six Sigma projects. The questions that should be put when participants are selected are: “Who knows the process, who can change it?”. So far approximately 50% of all employees at the Service Division have participated in a Six Sigma project. Many of them have participated in several.
3.3.12. SF #12: Utilise IT to support implementation of process improvements
As Hellström (2006) pointed out, there is a strong connection to information technology associated with BPR (see e.g. Hammer and Champy, 1993), but there seem to be no obvious connections between Six Sigma and BPR in the literature, ‘IT support’ is not suggested as a success factor in the literature. There are some case studies on the Internet that concern how to use Six Sigma to improve IT management processes, but very little is found about the importance of IT support to implement process improvements in ‘non IT’ business processes using the Six Sigma methodology.
The process requirements for developing new IT support systems were derived from the new Service strategy (see Figure 4). Almost every Six Sigma project resulted in process changes that were ‘coded’ in software. It was clear to everyone at the Service Division that these were in fact process development projects but, since the projects included IT developments, they were classified as IT implementation projects. We always argued that the IT support tools would generate profits in the processes, but restrictions on ‘IT costs’ – without any consideration of process profits – often delayed and disturbed the progress of Six Sigma projects and other process development projects. In this case we could not simply do as we wanted locally, since everyone uses the same software; the IT development naturally needs to

Six Sigma Management at Siemens – A personal case story. Cronemyr(2007)
A-46
be controlled and harmonised. These frustrating discussions were partly taken over by the new Business Excellence Manager when I switched to the position as Six Sigma Program Manager.
3.3.13. SF #13: Take psychological aspects into account
One success factor suggested by several authors in the literature that was not selected as a top candidate by surveyed companies (Schön, 2006) was ‘Early communication to employees’. Antony and Banuelas (2002) identify ‘Cultural change’ as one of their eleven key ingredients of a Six Sigma program and mean that the best way to tackle resistance to change is through increased and sustained communication, motivation and education. This is in essence what Weisbord (1991) recommends with the guides in the ‘four room apartment’, see Figure 9. By identifying which rooms employees, managers and parts of the organisation have reached, one can help them according to the guides. It is of crucial importance to see individuals and adapt the message to each one. Furthermore, Wiklund and Sandvik-Wiklund (2002) argued for ‘Soft Sigma’, i.e. training in behavioural science in addition to training in statistics, giving the skills needed for Black Belts to be able to act as ‘internal change management consultants’.
During the years of change, we have continuously tried to identify the specific needs of employees and inform and engage people in different ways. While some managers thought ‘everybody was okay’, I suspected that employees did not say exactly what they thought. Hence the investigation of attitudes towards process orientation was conducted by a behaviour scientist. The overall evaluation was that we had good progress and mostly positive attitudes towards process orientation. Most employees were in the two rooms to the right, i.e. they wanted to change. When planning future Process Management activities we focused on helping people to ‘move up’ from ‘Confusion’ to ‘Renewal’ by engaging more employees in process development teams and Six Sigma projects.
Siemens has ‘project coaching’ training for Black Belts. The course is completely different from ‘normal’ Six Sigma training as it deals only with behaviour science and is taught by a behavioural scientist. Two of the Black Belts in Service attended the training when it was given in Sweden. Unfortunately I was ill that week and could not attend. The people that attended said to me “You would have liked it. It dealt with topics that you often speak about.”
3.3.14. SF #14: Take cultural aspects into account
In relation to the success factor ‘Adaptation to organisation’s situation and needs’, Sandholm and Sörqvist (2002) stress that “even factors like country and culture can be important”. This is in accordance with Trompenaars’ model of national patterns of corporate culture (Trompenaars, 1993; Crom, 2000; Schön, 2006), see Figure 19 below. As can be seen in his model, there are quite different cultures in e.g. Sweden and Germany.
On one occasion in a web conference I presented the paper by Crom (2000) to my colleagues in Germany, the USA and the UK. I said “now do you understand why we don’t understand one another?” As usual when presenting a scientific paper, there was no immediate response. I also presented the model to my German division manager. I guess it was a little offensive because his response was “We used to be very hierarchical but we are not any more.” I have no reason to doubt that there has been a change but, compared to Swedes, Germans are still
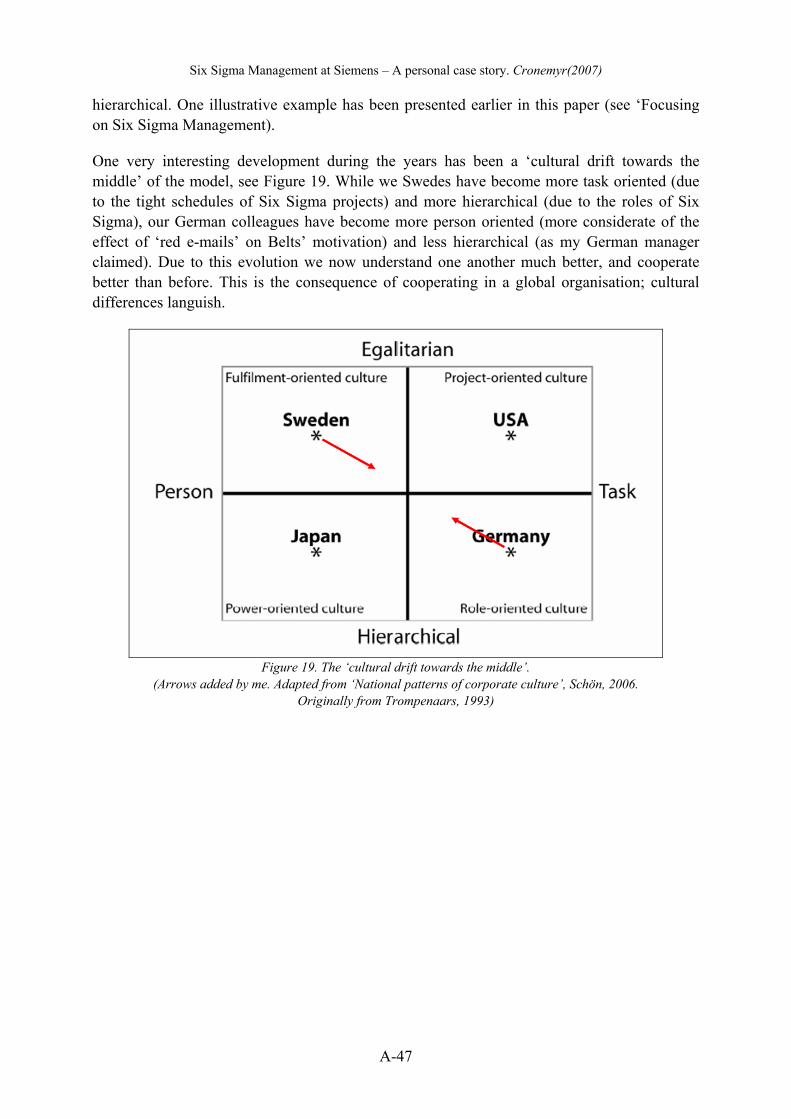
Six Sigma Management at Siemens – A personal case story. Cronemyr(2007)
A-47
hierarchical. One illustrative example has been presented earlier in this paper (see ‘Focusing on Six Sigma Management).
One very interesting development during the years has been a ‘cultural drift towards the middle’ of the model, see Figure 19. While we Swedes have become more task oriented (due to the tight schedules of Six Sigma projects) and more hierarchical (due to the roles of Six Sigma), our German colleagues have become more person oriented (more considerate of the effect of ‘red e-mails’ on Belts’ motivation) and less hierarchical (as my German manager claimed). Due to this evolution we now understand one another much better, and cooperate better than before. This is the consequence of cooperating in a global organisation; cultural differences languish.
Figure 19. The ‘cultural drift towards the middle’.
(Arrows added by me. Adapted from ‘National patterns of corporate culture’, Schön, 2006. Originally from Trompenaars, 1993)
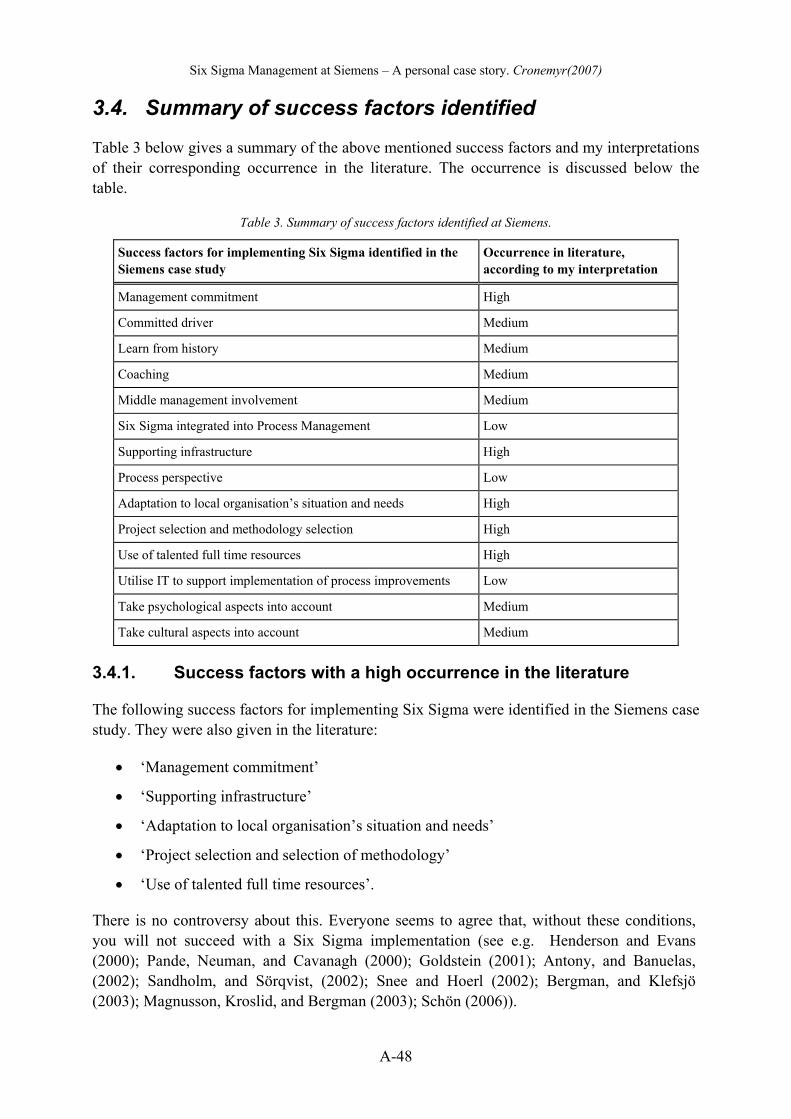
Six Sigma Management at Siemens – A personal case story. Cronemyr(2007)
A-48
3.4. Summary of success factors identified
Table 3 below gives a summary of the above mentioned success factors and my interpretations of their corresponding occurrence in the literature. The occurrence is discussed below the table.
Table 3. Summary of success factors identified at Siemens.
Success factors for implementing Six Sigma identified in the Siemens case study
Occurrence in literature, according to my interpretation
Management commitment High
Committed driver Medium
Learn from history Medium
Coaching Medium
Middle management involvement Medium
Six Sigma integrated into Process Management Low
Supporting infrastructure High
Process perspective Low
Adaptation to local organisation’s situation and needs High
Project selection and methodology selection High
Use of talented full time resources High
Utilise IT to support implementation of process improvements Low
Take psychological aspects into account Medium
Take cultural aspects into account Medium
3.4.1. Success factors with a high occurrence in the literature
The following success factors for implementing Six Sigma were identified in the Siemens case study. They were also given in the literature:
• ‘Management commitment’
• ‘Supporting infrastructure’
• ‘Adaptation to local organisation’s situation and needs’
• ‘Project selection and selection of methodology’
• ‘Use of talented full time resources’.
There is no controversy about this. Everyone seems to agree that, without these conditions, you will not succeed with a Six Sigma implementation (see e.g. Henderson and Evans (2000); Pande, Neuman, and Cavanagh (2000); Goldstein (2001); Antony, and Banuelas, (2002); Sandholm, and Sörqvist, (2002); Snee and Hoerl (2002); Bergman, and Klefsjö (2003); Magnusson, Kroslid, and Bergman (2003); Schön (2006)).

Six Sigma Management at Siemens – A personal case story. Cronemyr(2007)
A-49
3.4.2. Success factors with medium occurrence in literature
The following success factors for implementing Six Sigma were also identified in the Siemens case study, but it is unclear here whether the literature suggests these factors. They have been mentioned but only sporadically:
• ‘Committed driver’
• ‘Learn from history’
• ‘Coaching’
• ‘Middle management involvement’
• ‘Take psychological aspects into account’
• ‘Take cultural aspects into account’.
As mentioned above, all these success factors were indeed very important at Siemens. I was the ‘committed driver’ who always argued that one should ‘learn from history’, especially from the ‘goldmine’ of past failures. Both ‘coaching’ and ‘middle management involvement’ were identified in crises that we dealt with. The factors of ‘taking psychological aspects into account’ and ‘taking cultural aspects into account’ were partly dealt with by engaging behavioural scientists.
3.4.3. Success factors with low occurrence in literature
Finally, the following important success factors were identified in the Siemens case study but were not mentioned as such in the literature:
• ‘Integrating Six Sigma into Process Management’
• ‘Process perspective’
• ‘Utilising IT to support implementation of process improvements’
This is the major conclusion from the Siemens case study, even though one should always be cautious about drawing conclusions from a contextually limited study. It is recommended, in order to succeed with a Six Sigma implementation, that ‘Six Sigma should be integrated with Process Management’. This is much easier if the organisation has a ‘process perspective’ instead of a ‘product perspective’. It has been said that IT is the natural way to implement process improvements, even in processes not primarily concerned with IT management. This is the essence of Six Sigma Management, as applied at Siemens.
3.5. Some other success factors mentioned in the literature
It is not possible to list all of the success factors mentioned in the literature, but I will comment below on some of the commonly mentioned ones, in addition to those already identified at Siemens. I do not disagree with any of the success factors given in the literature – i.e. the ones I have found – but that is not the same as saying they all are top candidates. If

Six Sigma Management at Siemens – A personal case story. Cronemyr(2007)
A-50
some are to be selected as those that are most important, some others have to be ranked lower.
3.5.1. ‘Strategy for implementation’ and ‘Linking Six Sigma to the business strategy’
These were ranked high in Schön’s study (Schön, 2006). The first was mentioned by Goldstein (2001) and Sandholm and Sörqvist (2002) and the second by Pande, Neuman and Cavanagh (2000) and Antony and Banuelas (2002).
Even though they were not identified as success factors at Siemens, both these conditions were satisfied. The strategy for implementation was the top+ Quality roadmap on a global level and the 1-2-3 of Six Sigma Management locally in Finspong. All projects were linked to strategic business targets via process performance targets. Otherwise the projects would not have been selected in the first place. When we introduced Six Sigma the first time, these conditions were often not fulfilled and, as a consequence, Six Sigma projects were not equally successful. Hence, these success factors are very close to being included in the list of success factors from the Siemens case study.
3.5.2. ‘Focus on results’ and ‘Creation of qualitative goals such as customer value’
The first was mentioned by Pande, Neuman and Cavanagh (2000) and Sandholm and Sörqvist (2002). The second was mentioned by people at the companies investigated in Schön’s study (Schön, 2006).
At Siemens globally there is a very strong focus on financial results of Six Sigma projects. This was perceived as a problem for us because we were sometimes improving processes that did not give any direct savings in the short run. Many times we improved the ‘customer value’ in terms of on-time delivery rate, reduced inspection time or higher quality of reports to customers. These measures were sometimes hard to translate into monetary units. Most of the time we argued for ‘less errors in the future’, ‘happier customers and employees’ and ‘ability to grow without increasing the head count’ as results that ought to count equal with financial bottom line results. These arguments were not accepted at the beginning, but, during the years, while drifting towards the middle of Trompenaars’ model, we have actually received some acceptance for these arguments. Even though it is important to ‘focus on results’, as a Swede, I do not rank that success factor as a top candidate. ‘Creation of qualitative goals such as customer value’ is very close to qualifying.
3.5.3. ‘Focus on Training’ and ‘Knowledge and competence’
The first was mentioned by many researchers (e.g. Henderson and Evans, 2000; Pande, Neuman, and Cavanagh, 2000; Goldstein, 2001; Antony and Banuelas, 2002; and Sandholm and Sörqvist, 2002). The second, which is closely connected to the first, was mentioned by a person at a Swedish company in Schön’s study (Schön, 2006).
Six Sigma Management at Siemens – A personal case story. Cronemyr(2007)
A-51
Of course training is very important. Without training, no new knowledge, no changed behaviour, no results. That is why so many authors have listed it as a critical success factor. It goes without saying, just like management commitment, but training can quite easily be conducted if the time, money and resources are allocated to it. Management commitment on the other hand is built on a change in mind-set and behaviour. That can not be bought. By conducting training, employees and managers learn the terminology. But they must also fully understand the meaning of the words used in Six Sigma. Otherwise, according to a respondent in Schön’s study, “some people know how to recite the Six Sigma terminology, but do not really know how to make a project happen” (Schön, 2006, p.424). Trying to implement Six Sigma without focusing on training is like participating in a swimming competition without first learning how to swim. I would not recommend it.
3.6. ‘The chicken or the egg’ of Six Sigma Management
According to Hammer “Six Sigma should be a part of Process Management, not the other way around” (Hammer, 2002, p. 32). Which is ‘the chicken’ and which is ‘the egg’ here? What I call Six Sigma Management is bigger than Six Sigma. Six Sigma Management is actually Process Management with the addition of managers speaking and acting in a Six Sigma fashion, i.e. making decisions based on facts. As stated earlier, without Process Management, there is no real basis and infrastructure to ‘save and store’ results of Six Sigma projects to ensure sustainable results. Hence, in my humble opinion, both Process Management and Six Sigma are parts – crucial parts – of Six Sigma Management, but one of them is not a part of the other, i.e. ‘no chicken and no egg’.
3.7. What are the results?
So far approximately 30 Six Sigma projects have been conducted in Service with an average estimated annual savings of 200,000 Euros per project, but the bottom line results of Six Sigma Management are not easily quantified. While sales volumes and earnings have increased, on-time delivery rate has improved, lead-times have been shortened, productivity has increased, and the log of ‘future savings’ from improvement projects has increased, there is no easy way to prove that this would not have happened had we not implemented Six Sigma in the way we did. But it is a fact that this happened, see the example in Table 4 on next page.
We used to have very stressful working conditions for everyone at the Service Division, but especially for the field service engineers. That has changed thanks to better described processes where the root causes of many problems have been removed by Six Sigma projects.
During the last two years no remarks or observations have been given at the ISO 9000 and ISO 14000 audits done at the Service Division by external reviewers.
Since this is action research in a single context, it not possible to find a ‘twin’ company, but it is in fact possible to compare the success of the implementation itself at different companies. When communicating with colleagues within and outside of Siemens, we have found that we have succeeded where others have failed. We have been asked to share our knowledge and to help. That is a qualitative measurement that is felt by everyone involved. It is up to the readers to draw their own conclusions on the applicability to a more general case.

Six Sigma Management at Siemens – A personal case story. Cronemyr(2007)
A-52
Table 4. Changes during a period of two years of some sample KPIs of the Service Division in Finspong (Siemens has a fiscal year from 1 October to 31 September).
Key Performance Indicator (KPI) Fiscal Year 2003/2004
Fiscal Year 2005/2006
On-Time Delivery to External Customer 70% 90%
On-Time Delivery of External Suppliers 70% 85%
On-Time Delivery of Internal Technical Requests
56% 84%
Employee Absence due to Illness 2% 1.5%
Non Conformance Cost 3% 1%
Overdue Customer Invoices >50% 10%
Sales Volume € 100 M € 130 M
Finally, some words as expressed by the head of the Service Division in Finspong on the impact of Six Sigma.
Of all the different methods for Business Improvement throughout the years, Six Sigma has by far proven to be the most successful. Most problems occurring in large organisations are found to be quite complicated, once you get under the surface of the actual symptom. For us to be able to make a long lasting change, we need to have a large part of the organisation doing things in a different way after an improvement is implemented. That you can only succeed with if the staff is convinced that the change is right. By having the thorough structure and the participation of different functions of the organisation in the projects, Six Sigma gives that plausibility and assurance.
But of course Six Sigma does not become a success just by itself. For us the key has been long and methodical work with our processes to a stage where they today are used daily in the organisation. This combined with a dedicated and committed management team supported by knowledgeable and enthusiastic Black Belts is really what has brought us to where we are today.
Håkan Sidenvall Head of Service Division, Finspong May, 2007
Even though we have run Six Sigma for three years, these results are ‘short term’ results. The ‘long term’ result is a new way of thinking.

Six Sigma Management at Siemens – A personal case story. Cronemyr(2007)
A-53
4. References
Antony, J. and Banuelas, R. (2002) Key ingredients for the effective implementation of Six Sigma programme, Measuring Business Excellence, Vol. 6 pp. 20–27.
Bergman, B., and Klefsjö, B. (2003) Quality from Customer Needs to Customer Satisfaction, McGraw-Hill, New York. 2nd ed.
Chowdhury, Subir (2002) Design For Six Sigma. Financial Times Prentice Hill, London.
Crom, S. (2000) Implementing Six Sigma in Europe: a cross-cultural perspective, Quality Progress, October, pp. 73–75.
Cronemyr, P. (2000) Towards a Learning Organisation for Product Development. Licentiate Thesis, Division of Quality Technology and Management, Department of Mechanical Engineering, Linköping University, Linköping, Sweden.
Cronemyr, P. (2007) DMAIC and DMADV – Differences, similarities, and synergies. International Journal Of Six Sigma and Competitive Advantage, October.
Cronemyr, P. and Mauléon, C. (2007) Knowledge Overlapping Seminars – KOS. Design and Applications. Working paper. (submitted for publication)
Cronemyr, P. and Witell, L. (2007) Changing from a product to a process perspective for Service Improvements in Manufacturing Companies. Working paper. (submitted for publication)
Cronemyr, P., Öhrwall-Rönnbäck, A., and Eppinger, S. (2001) A decision support tool for predicting the impact of development process improvements. Journal of Engineering Design, Vol. 12, No. 3, pp. 177-199.
Ellström, J. and Sellgren, E. (2007) Implementering av SPS på en serviceavdelning. Division of Quality and Environmental Management, Luleå University of Technology
Fundin, A. and P. Cronemyr (2003): Use customer feedback to choose Six Sigma projects. Six Sigma Forum Magazine. November: 17-21
Goldstein, M. D. (2001) Six Sigma programme success factors, Six Sigma Forum Magazine, Vol. 1, pp. 36–45.
Hammer, M. (2002) Process management and the future of Six Sigma. MIT Sloan Management Review. Vol. 43e No. 2
Hammer, M. and J. Champy (1993). Reengineering the Corporation: a Manifesto for Business Revolution. New York, Harper Business.
Hellström A. (2006) Conceptions of Process Management – An Analysis of the Discourse in the Management Literature. In the proceedings from QMOD Liverpool.
Six Sigma Management at Siemens – A personal case story. Cronemyr(2007)
A-54
Henderson, K. M. and Evans, J. R. (2000) Successful implementation of Six Sigma: benchmarking General Electric Company, Benchmarking: An International Journal, Vol. 7, pp. 260–281.
Janssen C. (1982) Personlig Dialektik. 2nd ed. Stockholm: Liber.
Juran, J. M. (1998) Juran’s Quality Handbook, fifth edition, McGraw-Hill.
Karlsson, S. and Sandvik-Wiklund, P. (1997) Critical aspects of quality method implementation. Total Quality Management, vol. 8, no. 1, pp. 55-65.
Ljungberg, A, and Larsson, E (2001) Processbaserad verksamhetsutveckling. Studentlitteratur
Magnusson, K., Kroslid, D., and Bergman, B. (2003): Six Sigma. The Pragmatic Approach. Second edition. Studentlitteratur, Lund.
Pande, P.S., Neuman, R.P. and Cavanagh, R.R. (2000) The Six Sigma Way: How GE, Motorola and Other Top Companies are Honing their performance, New York, NY: McGraw-Hill Professional.
Sandholm, L. and Sörqvist, L. (2002) 12 Requirements For Six Sigma success, Six Sigma Forum Magazine, Vol. 2, pp. 17–22.
Scaletta, T. (2006) Beyond process improvement: the pathway to process-based management. CMA Management, June/July, pp. 22-25.
Schön, K. (2006) Implementing Six Sigma in a non-American culture, Int. J. Six Sigma and Competitive Advantage, Vol. 2, No. 4, pp. 404–428.
Schön, K. (2007) Six Sigma and Work Satisfaction Consequences. In the proceedings from QMOD Helsingborg.
Shewhart, W. A. (1931) Economic Control of Quality and Manufactured Product. Van Nostrand, New York.
Senge, P. M. (1990): The Fifth Discipline: The Art and Practice of the Learning Organization. New York: Currency/Doubleday.
Snee and Hoerl (2002) Leading Six Sigma: A Step-by-Step Guide Based on Experience with GE and Other Six Sigma Companies. Financial Times Prentice Hall.
Sundell, C (2005) Kartläggning av attityder till processorientering på Siemens Industrial Turbomachinery Servicedivisionen, Finspång. Mittuniversitetet. Institutionen för teknik, fysik och matematik. Examensarbete: Kvalitet och ledarskapsutveckling.
Trompenaars, F. (1993) Riding the Waves of Culture: Understanding Cultural Diversity in Business. New York, NY: McGraw-Hill Professional.

Six Sigma Management at Siemens – A personal case story. Cronemyr(2007)
A-55
Watson, G. H. (2005) Design For Six Sigma. Innovation for Enhanced Competitiveness. GOAL/QPC Publishing, Salem, NH.
Weisbord M. R. (1991) Productive Workplaces: Organizing and Managing for Dignity, Meaning, and Community. Jossey-Bass.
Wiklund, H. and Sandvik-Wiklund, P. (2002) Widening the Six Sigma concept: an approach to improve organizational learning. Total Quality Management, vol. 13, no. 2, pp. 233-239.
Willoch, B. (1996) Business Process Reengineering – En praktisk innføring og veiledning. 2nd ed. Fagbokforlaget, Bergen.
Wright, S. (2004) Predicting and Measuring the Value in Process Change: A Method and Automation Tool to Qualify Process Improvement Investment. In the proceedings from Virtual Product Development Conference, Huntington Beach, California.


Appendix B
Title Selection of Six Sigma
projects based on customer feedback – The idea
Paper title Use Customer Feedback To Choose Six Sigma Projects
Authors Anders Fundin and Peter Cronemyr
Publication Six Sigma Forum Magazine. November: pp. 17-21 (2003)


n an article in the Harvard Business Review, D.A. Garvin stresses the opportu-nity to learn from failures while noting many managers are indifferent to thepast.1 So how can we use feedback from dissatisfied customers to develop
future products? It costs approximately five times as much to gain a new cus-tomer as to keep a current one.2 Most companies spend 95% of their resourcessolving individual complaints and less than 5% of their resources analyzing howto solve the original problem.3
One way to approach an organization’s improvement potential is to use SixSigma methodology. However, selecting Six Sigma projects is “…one of the mostfrequently discussed frustrations,” according to M.D. Goldstein.4 He says teamsresponsible for developing project selection processes could provide valuableproject portfolios by establishing significant project success factors.
Goldstein goes on to say organizations that have formalized customer feed-back systems or field quality data systems have to establish critical factors thatgive priority to the information as a means to provide reliable and valuableinformation to project selection teams. When selecting project candidates, hesays it is important to identify significant quality characteristics. The customershould be able to notice the improvement, and the response variables should beeasy to measure. Also, a project should be able to be completed in four to sixmonths and have a high probability of success.
Dissatisfied customers are an almost unending source of ideas concerningproduct innovation and product improvement. Unfortunately, this resource isoften left untapped.5 There is a gap between the knowledge of service person-nel and that of product development personnel. Service personnel obtain muchinformation from dissatisfied customers; however, the transfer of that informa-tion to the new product development process (NPDP) and the NPDP improve-ment teams is lacking.
To learn how a systematic process can be developed, we will explain how AlstomPower Industrial Turbines in Sweden uses feedback from dissatisfied customers asa driving factor in its process improvement process (PIP). This process helpsAlstom select the most significant Six Sigma projects to improve the company’sdevelopment processes where future products emerge and can be developed.
Customer Dissatisfaction Feedback
An effective reliability program, including several methods for predictions,needs vital information from field failures.6 The presence of a reliability groupin charge of field data is crucial to product quality. Interestingly, in an investi-gation of first tier suppliers to the automotive industry, Sime Curkovic discov-ered reliability, durability and product support are closely related to the finan-cial performance of the supplier; however, most CEOs focus on the importanceof other quality dimensions, such as conformance and design.7
According to Walter Shewhart, “The object of industrial research is to estab-lish ways and means of making better and better use of past experience.”8 J.M.
P R O C E S S I M P R O V E M E N T
Use Customer Feedback ToChoose Six Sigma ProjectsHOW ALSTOM
POWER USES
PRODUCT FAULT
REPORTS TO
IMPROVE ITS
PROCESSES.
I
By Anders P.
Fundin,
Chalmers
University of
Technology,
and Peter
Cronemyr,
Alstom Power
S I X S I G M A F O R U M M A G A Z I N E I N O V E M B E R 2 0 0 3 I 17
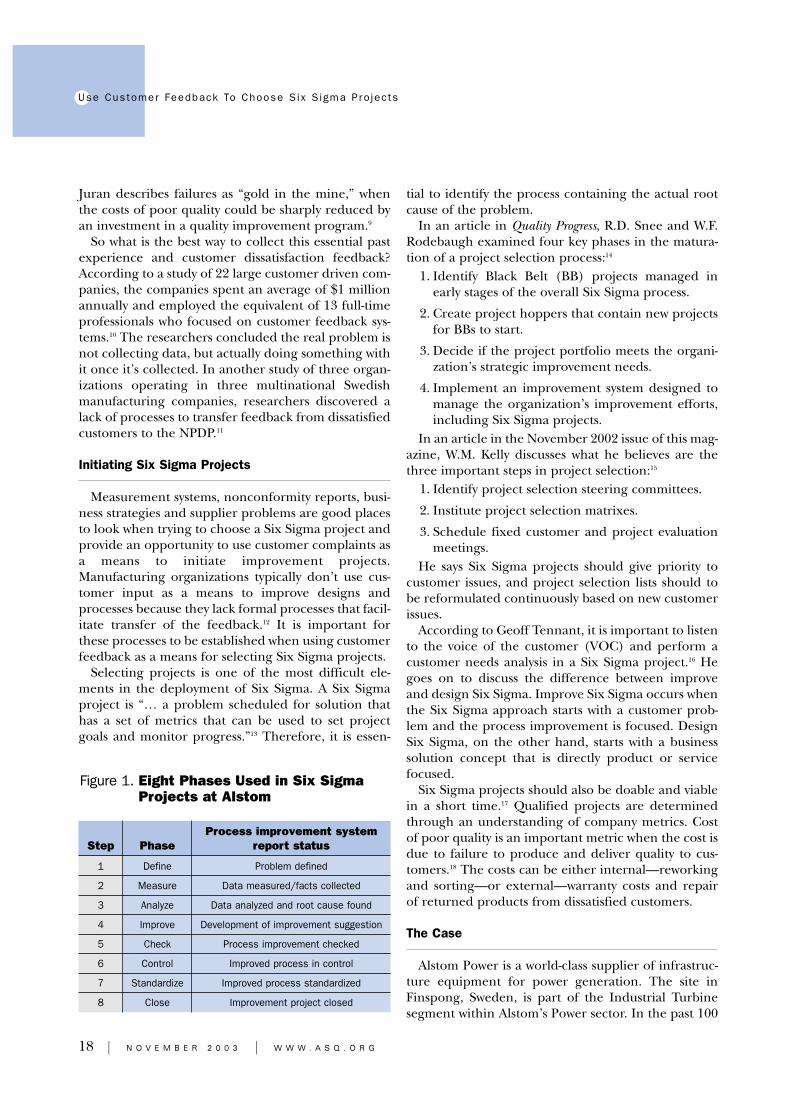
Use Customer Feedback To Choose S ix S igma Pro jec ts
Juran describes failures as “gold in the mine,” whenthe costs of poor quality could be sharply reduced byan investment in a quality improvement program.9
So what is the best way to collect this essential pastexperience and customer dissatisfaction feedback?According to a study of 22 large customer driven com-panies, the companies spent an average of $1 millionannually and employed the equivalent of 13 full-timeprofessionals who focused on customer feedback sys-tems.10 The researchers concluded the real problem isnot collecting data, but actually doing something withit once it’s collected. In another study of three organ-izations operating in three multinational Swedishmanufacturing companies, researchers discovered alack of processes to transfer feedback from dissatisfiedcustomers to the NPDP.11
Initiating Six Sigma Projects
Measurement systems, nonconformity reports, busi-ness strategies and supplier problems are good placesto look when trying to choose a Six Sigma project andprovide an opportunity to use customer complaints asa means to initiate improvement projects.Manufacturing organizations typically don’t use cus-tomer input as a means to improve designs andprocesses because they lack formal processes that facil-itate transfer of the feedback.12 It is important forthese processes to be established when using customerfeedback as a means for selecting Six Sigma projects.
Selecting projects is one of the most difficult ele-ments in the deployment of Six Sigma. A Six Sigmaproject is “… a problem scheduled for solution thathas a set of metrics that can be used to set projectgoals and monitor progress.”13 Therefore, it is essen-
tial to identify the process containing the actual rootcause of the problem.
In an article in Quality Progress, R.D. Snee and W.F.Rodebaugh examined four key phases in the matura-tion of a project selection process:14
1. Identify Black Belt (BB) projects managed inearly stages of the overall Six Sigma process.
2. Create project hoppers that contain new projectsfor BBs to start.
3. Decide if the project portfolio meets the organi-zation’s strategic improvement needs.
4. Implement an improvement system designed tomanage the organization’s improvement efforts,including Six Sigma projects.
In an article in the November 2002 issue of this mag-azine, W.M. Kelly discusses what he believes are thethree important steps in project selection:15
1. Identify project selection steering committees.
2. Institute project selection matrixes.
3. Schedule fixed customer and project evaluationmeetings.
He says Six Sigma projects should give priority tocustomer issues, and project selection lists should tobe reformulated continuously based on new customerissues.
According to Geoff Tennant, it is important to listento the voice of the customer (VOC) and perform acustomer needs analysis in a Six Sigma project.16 Hegoes on to discuss the difference between improveand design Six Sigma. Improve Six Sigma occurs whenthe Six Sigma approach starts with a customer prob-lem and the process improvement is focused. DesignSix Sigma, on the other hand, starts with a businesssolution concept that is directly product or servicefocused.
Six Sigma projects should also be doable and viablein a short time.17 Qualified projects are determinedthrough an understanding of company metrics. Costof poor quality is an important metric when the cost isdue to failure to produce and deliver quality to cus-tomers.18 The costs can be either internal—reworkingand sorting—or external—warranty costs and repairof returned products from dissatisfied customers.
The Case
Alstom Power is a world-class supplier of infrastruc-ture equipment for power generation. The site inFinspong, Sweden, is part of the Industrial Turbinesegment within Alstom’s Power sector. In the past 100
18 I N O V E M B E R 2 0 0 3 I W W W . A S Q . O R G
Figure 1. Eight Phases Used in Six SigmaProjects at Alstom
Process improvement systemStep Phase report status
1 Define Problem defined
2 Measure Data measured/facts collected
3 Analyze Data analyzed and root cause found
4 Improve Development of improvement suggestion
5 Check Process improvement checked
6 Control Improved process in control
7 Standardize Improved process standardized
8 Close Improvement project closed
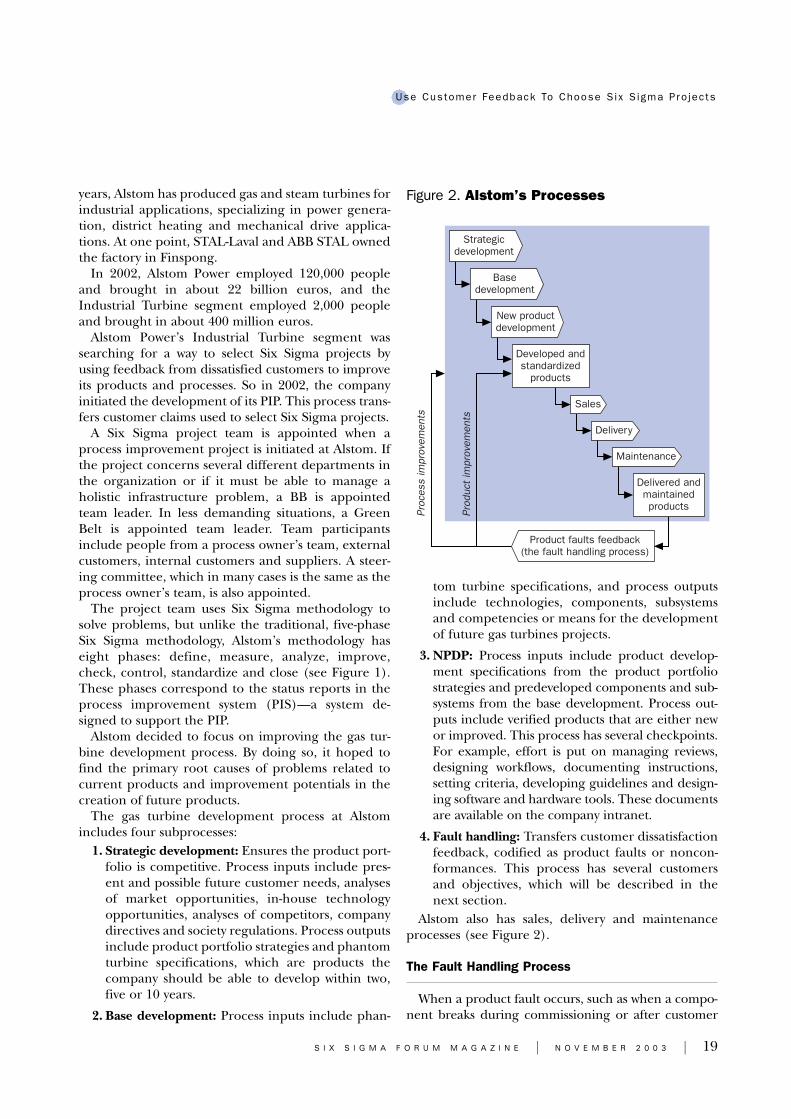
Use Customer Feedback To Choose S ix S igma Pro jec ts
years, Alstom has produced gas and steam turbines forindustrial applications, specializing in power genera-tion, district heating and mechanical drive applica-tions. At one point, STAL-Laval and ABB STAL ownedthe factory in Finspong.
In 2002, Alstom Power employed 120,000 peopleand brought in about 22 billion euros, and theIndustrial Turbine segment employed 2,000 peopleand brought in about 400 million euros.
Alstom Power’s Industrial Turbine segment wassearching for a way to select Six Sigma projects byusing feedback from dissatisfied customers to improveits products and processes. So in 2002, the companyinitiated the development of its PIP. This process trans-fers customer claims used to select Six Sigma projects.
A Six Sigma project team is appointed when aprocess improvement project is initiated at Alstom. Ifthe project concerns several different departments inthe organization or if it must be able to manage aholistic infrastructure problem, a BB is appointedteam leader. In less demanding situations, a GreenBelt is appointed team leader. Team participantsinclude people from a process owner’s team, externalcustomers, internal customers and suppliers. A steer-ing committee, which in many cases is the same as theprocess owner’s team, is also appointed.
The project team uses Six Sigma methodology tosolve problems, but unlike the traditional, five-phaseSix Sigma methodology, Alstom’s methodology haseight phases: define, measure, analyze, improve,check, control, standardize and close (see Figure 1).These phases correspond to the status reports in theprocess improvement system (PIS)—a system de-signed to support the PIP.
Alstom decided to focus on improving the gas tur-bine development process. By doing so, it hoped tofind the primary root causes of problems related tocurrent products and improvement potentials in thecreation of future products.
The gas turbine development process at Alstomincludes four subprocesses:
1. Strategic development: Ensures the product port-folio is competitive. Process inputs include pres-ent and possible future customer needs, analysesof market opportunities, in-house technologyopportunities, analyses of competitors, companydirectives and society regulations. Process outputsinclude product portfolio strategies and phantomturbine specifications, which are products thecompany should be able to develop within two,five or 10 years.
2. Base development: Process inputs include phan-
tom turbine specifications, and process outputsinclude technologies, components, subsystemsand competencies or means for the developmentof future gas turbines projects.
3. NPDP: Process inputs include product develop-ment specifications from the product portfoliostrategies and predeveloped components and sub-systems from the base development. Process out-puts include verified products that are either newor improved. This process has several checkpoints.For example, effort is put on managing reviews,designing workflows, documenting instructions,setting criteria, developing guidelines and design-ing software and hardware tools. These documentsare available on the company intranet.
4. Fault handling: Transfers customer dissatisfactionfeedback, codified as product faults or noncon-formances. This process has several customersand objectives, which will be described in thenext section.
Alstom also has sales, delivery and maintenanceprocesses (see Figure 2).
The Fault Handling Process
When a product fault occurs, such as when a compo-nent breaks during commissioning or after customer
S I X S I G M A F O R U M M A G A Z I N E I N O V E M B E R 2 0 0 3 I 19
Strategicdevelopment
Basedevelopment
New productdevelopment
Developed andstandardized
products
Delivered andmaintainedproducts
Delivery
Sales
Maintenance
Product faults feedback(the fault handling process)
Proc
ess
impr
ovem
ents
Prod
uct
impr
ovem
ents
Figure 2. Alstom’s Processes
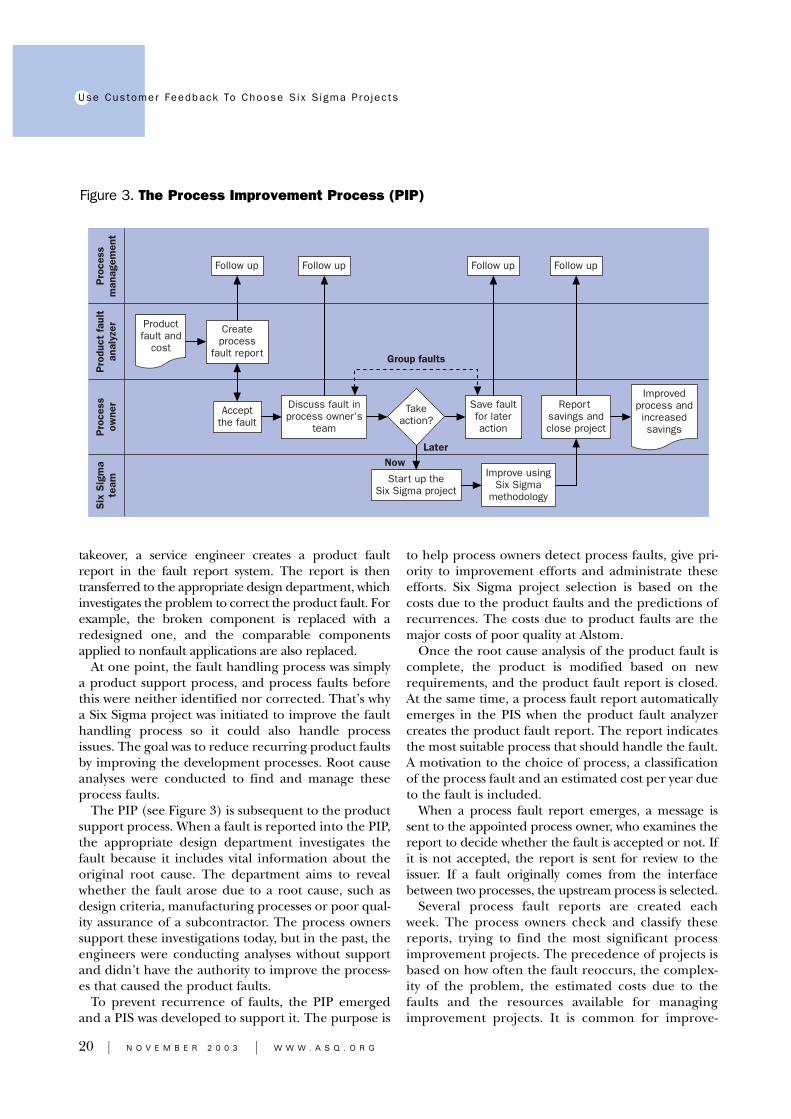
Use Customer Feedback To Choose S ix S igma Pro jec ts
takeover, a service engineer creates a product faultreport in the fault report system. The report is thentransferred to the appropriate design department, whichinvestigates the problem to correct the product fault. Forexample, the broken component is replaced with aredesigned one, and the comparable componentsapplied to nonfault applications are also replaced.
At one point, the fault handling process was simplya product support process, and process faults beforethis were neither identified nor corrected. That’s whya Six Sigma project was initiated to improve the faulthandling process so it could also handle processissues. The goal was to reduce recurring product faultsby improving the development processes. Root causeanalyses were conducted to find and manage theseprocess faults.
The PIP (see Figure 3) is subsequent to the productsupport process. When a fault is reported into the PIP,the appropriate design department investigates thefault because it includes vital information about theoriginal root cause. The department aims to revealwhether the fault arose due to a root cause, such asdesign criteria, manufacturing processes or poor qual-ity assurance of a subcontractor. The process ownerssupport these investigations today, but in the past, theengineers were conducting analyses without supportand didn’t have the authority to improve the process-es that caused the product faults.
To prevent recurrence of faults, the PIP emergedand a PIS was developed to support it. The purpose is
to help process owners detect process faults, give pri-ority to improvement efforts and administrate theseefforts. Six Sigma project selection is based on thecosts due to the product faults and the predictions ofrecurrences. The costs due to product faults are themajor costs of poor quality at Alstom.
Once the root cause analysis of the product fault iscomplete, the product is modified based on newrequirements, and the product fault report is closed.At the same time, a process fault report automaticallyemerges in the PIS when the product fault analyzercreates the product fault report. The report indicatesthe most suitable process that should handle the fault.A motivation to the choice of process, a classificationof the process fault and an estimated cost per year dueto the fault is included.
When a process fault report emerges, a message issent to the appointed process owner, who examines thereport to decide whether the fault is accepted or not. Ifit is not accepted, the report is sent for review to theissuer. If a fault originally comes from the interfacebetween two processes, the upstream process is selected.
Several process fault reports are created eachweek. The process owners check and classify thesereports, trying to find the most significant processimprovement projects. The precedence of projects isbased on how often the fault reoccurs, the complex-ity of the problem, the estimated costs due to thefaults and the resources available for managingimprovement projects. It is common for improve-
20 I N O V E M B E R 2 0 0 3 I W W W . A S Q . O R G
Follow up Follow up Follow up Follow up
Pro
cess
man
agem
ent
Pro
duct
faul
tan
alyz
erP
roce
ssow
ner
Group faults
NowLater
Six
Sig
ma
team
Takeaction?
Createprocess
fault report
Productfault and
cost
Improvedprocess andincreasedsavings
Discuss fault inprocess owner’s
team
Save faultfor lateraction
Report savings andclose project
Improve usingSix Sigma
methodology
Acceptthe fault
Start up theSix Sigma project
Figure 3. The Process Improvement Process (PIP)
Use Customer Feedback To Choose S ix S igma Pro jec ts
ment projects to be prioritized on the basis of fre-quently occurring process faults.
Every fault is reported in the PIS, and the systemoverview selects the most convenient process. Oncethe improvement projects are closed, the financial sav-ings are accounted.
Lessons Learned
Alstom’s implementation of the PIP and the sup-porting PIS is still in progress due to a Six Sigma proj-ect initiated to improve the fault handling process.The improve phase has been completed, and thecheck phase has been started. Out of 2,295 reportedfaults, 1,070 have been classified by contributionsfrom nine process owners. This classification hasinduced 67 potential Six Sigma projects.
Even though the implementation project was strong-ly supported by company management and processowners, there have been three main problems. First,the individuals who analyze product faults have put upsome resistance. Most are designers or engineers whoare used to solving product problems, not specifyingcausal processes or classifying process faults. This isbecause they lack knowledge about the processes andhaven’t had sufficient time to work with them. Hence,managers have to remember to schedule for any extratime needed.
Second, Alstom’s processes are not sufficientlydefined. Though this has supported a separate initia-tive to define and map primary processes, the previousprocesses and process owners are still used in the PIS.This can be frustrating and confusing. It would havebeen easier for Alstom to implement the PIP if the pri-mary processes had been defined and mapped beforethe project began.
Third, the process owners have been involved to dif-ferent extents in mapping the processes. This hascaused instability when implementing the PIP. Someof the process owners think of these activities as some-thing new and objectionable; however, most of themappreciate the PIS support.
Consequently, only a small number of root causeshave been detected, and only a small amount ofprocess faults have been solved.
Future Research
Alstom learned how to employ a fault handlingprocess as a means to transfer customer dissatisfactioninto the organization and believes it would be inter-esting to eventually involve experienced dissatisfied
customers as catalysts in the development processes.They could be used as a means to improve the process-es and to help create future products.
ACKNOWLEDGEMENTS
The authors are grateful to the employees at Alstom fortheir support and cooperation. Anders Fundin would alsolike to thank SKF, AB, for its continuous financial support ofthe department of quality sciences at Chalmers University ofTechnology.
REFERENCES
1. D.A. Garvin, “Building a Learning Organization,” Harvard BusinessReview, Vol. 71, No. 4, pp. 78-91.
2. A.F. Dutka, AMA Handbook for Customer Satisfaction, NTC Business Booksin Association with the American Marketing Association, 1994.
3. Colin Adamson, “Evolving Complaint Procedures,” Managing ServiceQuality, Vol. 3, No. 2.
4. M.D. Goldstein, “Six Sigma Program Success Factors,” Six Sigma ForumMagazine, Vol. 1, No. 1, pp. 36-45.
5. Anders Fundin and Bo Bergman, “Exploring the Customer FeedbackProcess,” Measuring Business Excellence, Vol. 7, No. 2, pp. 55-65.
6. D.A. Garvin, Managing Quality: The Strategic and Competitive Edge, FreePress, 1988.
7. Sime Curkovic, Shawnee K. Vickery and Cornelia Droge, “Quality andBusiness Performance: An Empirical Study of First Tier AutomotiveSuppliers,” Quality Management Journal, Vol. 6, No. 2, pp. 29-40.
8. W.A. Shewhart, Economic Control of Quality of Manufactured Product, D. VanNostrand, 1931.
9. J.M. Juran, Juran’s Quality Handbook, fifth edition, McGraw-Hill, 1998.
10. John Goodman, David DePalma and Scott Broetzmann, “Maximizing theValue of Customer Feedback,” Quality Progress, Vol. 29, No. 12, pp. 35-39.
11. Fundin, “Exploring the Customer Feedback Process,” Measuring BusinessExcellence, see reference 5.
12. Kjell Magnusson, Dag Kroslid and Bo Bergman, Six Sigma: The PragmaticApproach, second edition, Studentlitteratur, 2002.
13. R.D. Snee, “Frontiers of Quality: Dealing With the Achilles’ Heel of SixSigma Initiatives,” Quality Progress, Vol. 34, No. 3, pp. 66-72.
14. R.D. Snee and W.F. Rodebaugh Jr., “Frontiers of Quality: The ProjectSelection Process,” Quality Progress, Vol. 35, No. 9, pp. 78-80.
15. W.M. Kelly, “Three Steps to Project Selection,” Six Sigma ForumMagazine, Vol. 2, No. 1, pp. 29-32.
16. Geoff Tennant, Design for Six Sigma: Launching New Products and ServicesWithout Failure, Gower, 2002.
17. G.J. Hahn, “20 Key Lessons Learned,” Six Sigma Forum Magazine, Vol. 1,No. 3, pp. 28-34.
18. Dave Harrold, “Designing for Six Sigma Capability,” Control Engineering,Vol. 46, No. 1.
S I X S I G M A F O R U M M A G A Z I N E I N O V E M B E R 2 0 0 3 I 21
WHAT DO YOU THINK OF THIS ARTICLE? Please share
your comments and thoughts with the editor by e-mailing

Appendix C
Title Selection of Six Sigma
projects based on customer feedback – Application
Paper title Changing from a product to a process
perspective for Service Improvements in Manufacturing Companies
Authors Peter Cronemyr and Lars Witell
Publication Submitted for publication (2007)


Changing from a Product to a Process Perspective for Service Improvements in Manufacturing Companies Cronemyr and Witell (2007)
C-1
Changing from a Product to a Process Perspective for Service Improvements in Manufacturing Companies
By
Peter Cronemyr*+ and Lars Witell§ *Quality Sciences, Chalmers. +Siemens Industrial Turbomachinery AB, Finspong.
§Service Research Center, Karlstad University.
2007
Abstract
The paper presents an investigation of service improvements in a manufacturing context. It is shown how feedback from dissatisfied customers can be used as a driving factor in process improvements. Based on this knowledge, the company, Siemens, can select the most important Six Sigma projects to improve their service processes. When moving from a fire fighting culture to a proactive culture, a company needs to change from a product to a process perspective. As shown in the paper, the benefit of changing from a product to a process perspective is the change in focus from reduction of internal costs to value creation through service delivery.
Contents
1. Introduction ........................................................................................................................2
2. Services Quality and Learning from Things Gone Wrong ................................................3
3. Quality Improvements based on Customer Feedback........................................................4
4. Research Methodology.......................................................................................................6
5. Case Description ................................................................................................................7 5.1. The company ...........................................................................................................................7 5.2. Dealing with product faults .....................................................................................................7 5.3. The Process Fault Report Process ...........................................................................................8 5.4. Analysis of process fault reports at the Service Division ......................................................10 5.5. Experiences when changing from product to process perspective ........................................10 5.6. Actions taken to eliminate process faults ..............................................................................12
6. Discussion and Conclusions.............................................................................................13
7. References ........................................................................................................................16

Changing from a Product to a Process Perspective for Service Improvements in Manufacturing Companies Cronemyr and Witell (2007)
C-2
1. Introduction Service infusion in manufacturing companies has emerged as a new territory in the research on service and quality management, which is in contrast to previous research that has focused mainly on pure service organisations (Neu and Brown, 2005). In many companies service has been an important and profitable part of the business for a long time, but until recently research mainly focused on production and product development. Service quality issues of special importance to customers of services in manufacturing companies are reliability in terms of on-time delivery and readiness to help out (Johnson and Nilsson, 2003). To maintain and improve service quality, manufacturing companies need to adjust their quality improvement strategies to the context of services.
Traditionally, field and maintenance services of the installed base have been seen purely as a cost for a company, but recently it is argued that these services are part of the solution for specific customer problems (Woodruff and Flint, 2006). In the transition from traditional goods suppliers to solution providers, “consolidation of existing services” is an important step for organisations in order to combine service development and delivery into one organisational unit (Oliva and Kallenberg, 2003). One of the activities in this transition is the initiation of quality improvement systems for existing services, of which our knowledge is limited. Feedback systems are frequently created in order to follow up and measure the outcome of the service offerings. Often field service has operated as an organisation dedicated to putting out fires at the location of the customers. Traditionally, little knowledge has transferred to the rest of the organisation. More evolved organisations use the knowledge to put out fires faster. Not often enough are these fires used within continuous improvement programs as the “gold in the mine” (Juran and Gryna, 1988) to learn from and therefore eliminate the cost of poor quality and prevent future fires from occurring for existing products and their related services.
To maintain and improve service quality, manufacturing companies need processes for conducting quality improvements based on customer feedback. Such feedback is often available through systems on fault reports, customer complaints, and other kinds of field data – but it is not often used in service improvement initiatives. This includes changing perspective on failures, i.e., from a product to a process perspective. The purpose of our study is to investigate service improvements in a manufacturing context. We investigated the fault report process used at Siemens - a large company that develops, manufactures, delivers, and maintains gas turbines. We analysed 336 field reports on product and service failures to identify the consequences of changing from a product to a process perspective on failures. Our results provide guidance on how to work with service improvements in manufacturing companies.
Changing from a Product to a Process Perspective for Service Improvements in Manufacturing Companies Cronemyr and Witell (2007)
C-3
2. Services Quality and Learning from Things Gone Wrong
The interest in service quality followed the interest in goods quality during the late 1970s and the beginning of the 1980s. The argument used by researchers in service marketing was that the existing knowledge about goods quality provided by quality experts such as W. Edwards Deming, Philip Crosby, and Joseph Juran, was not sufficient to understand the quality of services (Edvardsson, Gustafsson, and Witell, 2006). The roots of service quality research reside in early conceptual work from the Nordic countries, i.e., work by Christian Grönroos and Evert Gummesson. In 1982, Christian Grönroos introduced a conceptual model of perceived service quality, which is based on the effect of expectations on customers’ post-consumption evaluations (Grönroos 2000). According to Grönroos, the quality of a service as perceived by the customer has two dimensions: a technical or an outcome dimension, and a functional or process-related dimension. The technical dimension concerns “what” the customer is actually receiving from a service, while the functional quality concerns “how” the service is provided. Some parts of the functional quality are co-produced by the customer in the front-office, while others are produced in the back-office (Lovelock and Wirtz, 2007). The line of visibility distinguishes between what is visible by the customer and what is not visible in the processes (Eiglier and Langeard, 1976).
For industrial firms, Kotler (1994) identifies two categories of services: (I) maintenance and repair services and (II) business advisory services. For large machine suppliers the installed base (IB) is the total number of products currently in use and the IB services is the range of product or process related services required by an end-user over the useful life of a product in order to run it effectively in the context of its operating process (Oliva and Kallenberg, 2003). In the field of services in relation to the installed base, the classical view is based on whether the service is offered before, during, or after the sale (Lalonde and Zinszer, 1976).
As a result, for an industrial firm to be able to apply its traditional views on quality within the service division, both the outcome and the process of service delivery need to be considered as well as the relation to the IB. Juran emphasises that quality is the extent to which a product or service successfully serves the purpose of the user (Juran and Gryna, 1988). The customer’s view of quality is similarly derived from two distinctly different dimensions: performance and freedom from deficiencies (Juran and Gryna, 1988). Product or service performance is the degree to which the product’s specifications are customised to meet the needs of any given customer. For the purpose of our discussion, we refer to these two components of quality as customisation and reliability (Johnson and Nilsson, 2003). Two traditional quality improvement strategies emerge: improving things gone right and eliminating things gone wrong (Johnson and Nilsson, 2003; Gustafsson and Johnson, 2003). Due to the inseparability of production and consumption of services, and a greater ratio of human involvement, there are more inherent things gone wrong for services. In turn, eliminating things gone wrong can be a fruitful strategy for not only eliminating customer dissatisfaction but also for improving customer satisfaction.

Changing from a Product to a Process Perspective for Service Improvements in Manufacturing Companies Cronemyr and Witell (2007)
C-4
3. Quality Improvements based on Customer Feedback
According to a multiple case study of 22 large companies, the average spending on customer feedback systems was about $1 million dollars annually and employed about 13 full-time professionals (Adamson, 1993). The authors concluded that the real problem did not concern data collection, but actually how to use the data once it was collected. In a technical assistance research program (TARP Inc.), it was found that of the resources used for complaint handling, most companies spent 95% on reacting to the individual complaint and less than 5% on analysing and using them as a means for improvement (Adamson, 1993).
Fundin and Bergman (2003) describe a situation where the service function of global multinational companies is geographically situated a long distance from the product development unit, which makes it difficult to transfer and use this knowledge in other parts of the organisation. Fundin and Elg (2006) suggest creating customer dissatisfaction systems as an infrastructure that makes it possible to transform complaints from the user into information and usable knowledge for the product developers in their everyday work. Following Wirtz and Tomlin (2000), we argue that this is not sufficient since to drive continuous improvement and learning such a system should be designed to also provide customer feedback to front-line staff, process owners, department managers, and the development organisation.
The collection of customer feedback and field reports from service personnel allows an organisation to assess and upgrade their services and product capabilities as needed to maintain and improve their competitiveness (Wisner and Corney, 2001). Among available service improvement strategies, the service division should focus relatively more attention on driving variation out of the service production process. Traditionally, quality management in the service divisions of manufacturing companies can best be described as following a fire fighting approach, meaning “the allocation of scarce resources to solve unanticipated problems or ‘fires’” (Repenning, 2001). We suggest that it is time to shift perspective and reallocate resources such that service firms pay greater attention to improving basic reliability instead of putting out fires. Companies must use their experience from improving production processes and adjusting to the specific characteristics of services, and start working to improve the outcome and process of service production on both sides of the line of visibility. Fundin and Cronemyr (2003) describe how customer feedback can be used in a continuous improvement strategy to identify the underlying process problems that cause product failures. One improvement strategy that can be used in conjunction with customer feedback is the Six Sigma methodology.
The widely spread process improvement methodology of Six Sigma was introduced by Bob Smith (Chadwick, 2007) at Motorola in the 1980s and made famous when implemented by Jack Welsh at General Electric (GE) in the 1990s. The Six Sigma process is basically a structured way of solving problems in an existing process based on analysis of real process data, i.e., facts. Motorola called the procedure MAIC which at GE became DMAIC, for Define, Measure, Analyse, Improve, and Control: the phases of the Six Sigma process. One could argue that DMAIC is nothing new since they are well known tools in quality
Changing from a Product to a Process Perspective for Service Improvements in Manufacturing Companies Cronemyr and Witell (2007)
C-5
management, but on the other hand without Six Sigma these tools would probably still be the possession of a limited number of people. What makes DMAIC new is the structuring of the individual tools to the process itself, which is basically the Shewhart cycle (Shewhart, 1931) also known as the PDSA cycle for Plan, Do, Study, Act (Bergman and Klefsjö, 2002). Since it was introduced, Six Sigma has spread widely and is now used by many companies around the world. Today many view Six Sigma as more comprehensive than just an improvement methodology. In some companies it has become a business strategy of top management (Antony and Banuelas, 2002). As a business strategy, there is a need for deployment of the goals and targets throughout the company. One important feature in the deployment process is to identify and select the Six Sigma projects with the highest potential.
In this paper we will explain how the Service Division of Siemens Industrial Turbines AB in Sweden uses feedback from dissatisfied customers as a driving factor in process improvements. This information helps Siemens select the most significant Six Sigma projects in order to improve the service processes and ultimately the fulfilment of customers’ needs.

Changing from a Product to a Process Perspective for Service Improvements in Manufacturing Companies Cronemyr and Witell (2007)
C-6
4. Research Methodology In this research project, the first author has taken on the role of an action researcher. Lewin (1946) defines action research as a parallel action and knowledge base creation for the researcher when participating in an action of planned change in cooperation with the client/practitioner. The approach of action research, ‘collaborative action inquiry’ (Westlander, 1999), is characterised by the researcher having an almost total identification with the activities and direction of change of the company. This is the case in this study since the first author has been employed by the company under investigation for eleven years and has actively influenced changes based not only on knowledge gained at the company but also on research studies conducted in academia. In action research the change initiative under investigation is conducted and analysed in a single context. It is up to the readers to draw their own conclusions on the applicability to more general cases.
The fault report process was developed in a Six Sigma project lead by the first author, who is a certified Black Belt and Six Sigma Program Manager, see e.g. Fundin and Cronemyr (2003). Through this action research project we had access to 336 fault reports sent to the Service Division of our case company. These fault reports contained a description of what problems the customer experienced, what fault had happened, who was responsible for fixing the fault, and what actions had been performed. Data were also available on i) causing process, ii) business unit, iii) estimated process fault occurrence, and iv) estimated process fault cost per year. This enabled us to investigate the consequences of changing from a product to a process perspective on failures and to perform statistical tests to verify our qualitative results.
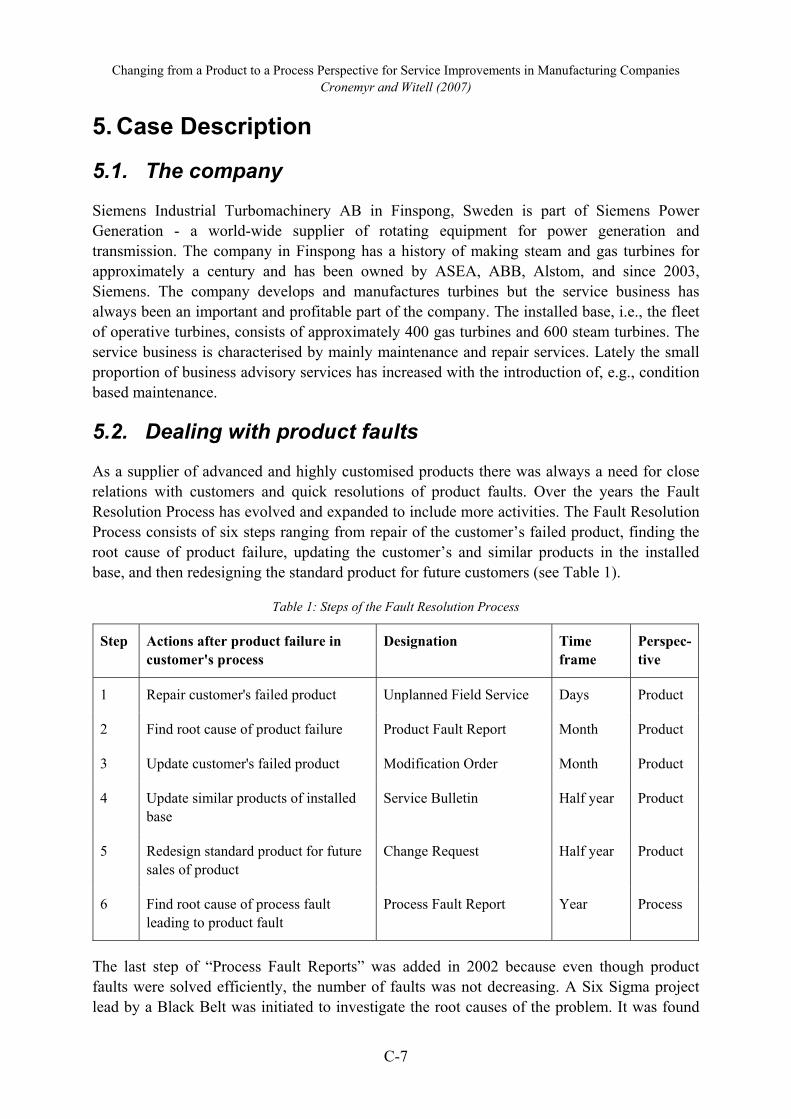
Changing from a Product to a Process Perspective for Service Improvements in Manufacturing Companies Cronemyr and Witell (2007)
C-7
5. Case Description
5.1. The company
Siemens Industrial Turbomachinery AB in Finspong, Sweden is part of Siemens Power Generation - a world-wide supplier of rotating equipment for power generation and transmission. The company in Finspong has a history of making steam and gas turbines for approximately a century and has been owned by ASEA, ABB, Alstom, and since 2003, Siemens. The company develops and manufactures turbines but the service business has always been an important and profitable part of the company. The installed base, i.e., the fleet of operative turbines, consists of approximately 400 gas turbines and 600 steam turbines. The service business is characterised by mainly maintenance and repair services. Lately the small proportion of business advisory services has increased with the introduction of, e.g., condition based maintenance.
5.2. Dealing with product faults
As a supplier of advanced and highly customised products there was always a need for close relations with customers and quick resolutions of product faults. Over the years the Fault Resolution Process has evolved and expanded to include more activities. The Fault Resolution Process consists of six steps ranging from repair of the customer’s failed product, finding the root cause of product failure, updating the customer’s and similar products in the installed base, and then redesigning the standard product for future customers (see Table 1).
Table 1: Steps of the Fault Resolution Process
Step Actions after product failure in customer's process
Designation Time frame
Perspec-tive
1 Repair customer's failed product Unplanned Field Service Days Product
2 Find root cause of product failure Product Fault Report Month Product
3 Update customer's failed product Modification Order Month Product
4 Update similar products of installed base
Service Bulletin Half year Product
5 Redesign standard product for future sales of product
Change Request Half year Product
6 Find root cause of process fault leading to product fault
Process Fault Report Year Process
The last step of “Process Fault Reports” was added in 2002 because even though product faults were solved efficiently, the number of faults was not decreasing. A Six Sigma project lead by a Black Belt was initiated to investigate the root causes of the problem. It was found

Changing from a Product to a Process Perspective for Service Improvements in Manufacturing Companies Cronemyr and Witell (2007)
C-8
that the number of product faults was highly correlated to the number of gas turbines delivered during a year and dealing with them did not decrease the number of product faults the following year. The reason for continued problems was that even though product faults were solved, the causing process faults were not dealt with.
The following example illustrates this problem. A turbine at a customer site has a break down. A field service engineer finds out that a bolt has come loose and destroyed part of the turbine. Later it is found that the bolt had cracked due to poor sizing, i.e., it could not withstand the high load. The bolt is then resized and similar bolts are replaced as well to avoid more failures, but the owner of the bolt sizing process may not be aware of the problem and does not change the process to prevent bolts from being undersized in the future, leading to additional failures of other bolts. Hence the process fault reoccurs even though the product fault has been corrected. In reality the process faults are more obscure and complicated than in this example.
As a result of the Six Sigma project the Process Fault Reports were added to the Fault Resolution Process. The idea was to be able to prevent faults from being redesigned into future products; the idea is built on changing from a product to a process focus concerning field services.
5.3. The Process Fault Report Process
A detailed view of the Process Fault Report Process is given in Figure 1. The process starts where the Product Fault Report Process ends (after step 1 to 5 in Table 1).
When the product fault has been solved and all changes have been implemented in the machines of the installed base as well as in the standard design descriptions, the product fault report is closed and archived. Before closing the report in the database some mandatory fields must be filled in. These process fields are i) causing process, ii) business unit, iii) estimated process fault occurrence, and iv) estimated process fault cost per year. These fields are filled in by the engineers who have solved the product fault and who are not normally service engineers. It is not possible to identify the causing process until the product fault has been solved. In the previous example it was not possible to attribute the process fault to the bolt sizing process until it was found that the bolt was undersized. If the bolt instead was found to be poorly fitted, the causing process should have been the turbine assembling process. Upon the closing of a product fault report, a process fault report is always automatically created. The process fields, short descriptions of the product fault, and the solution are transferred to the new report.
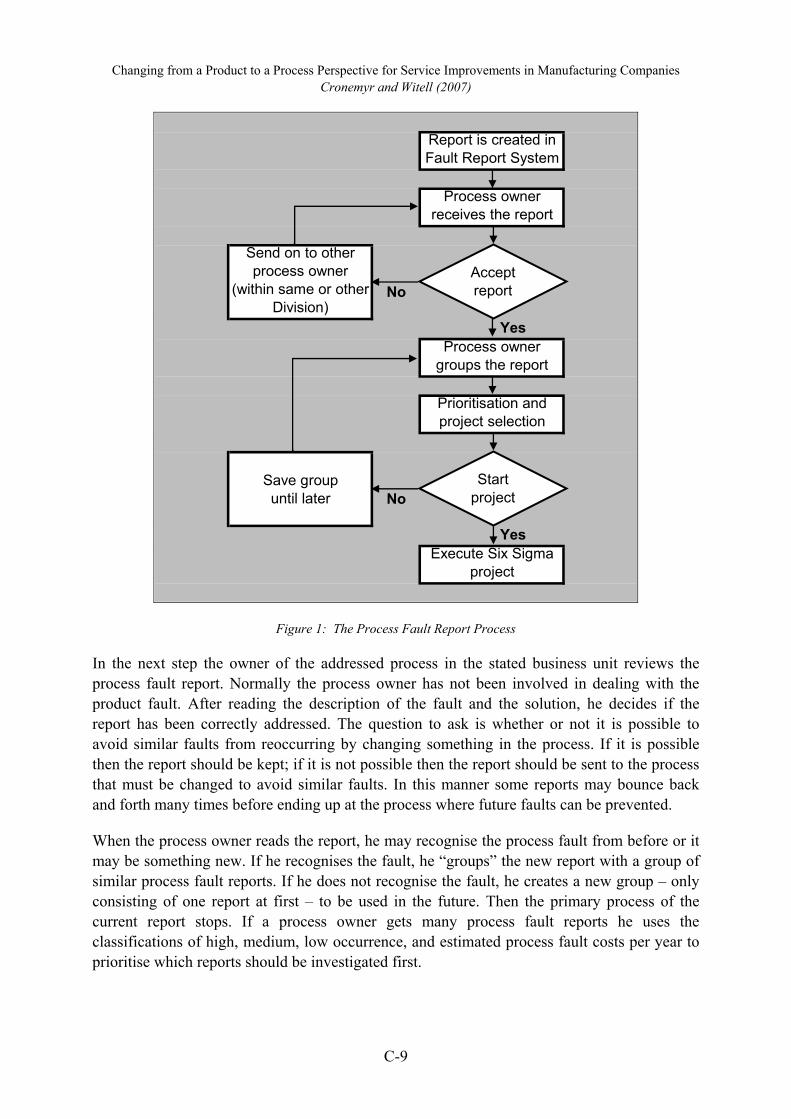
Changing from a Product to a Process Perspective for Service Improvements in Manufacturing Companies Cronemyr and Witell (2007)
C-9
Report is created in Fault Report System
Process ownerreceives the report
Send on to other process owner
(within same or other Division)
No
YesProcess owner
groups the report
Prioritisation andproject selection
Save groupuntil later No
YesExecute Six Sigma
project
Acceptreport
Startproject
Figure 1: The Process Fault Report Process
In the next step the owner of the addressed process in the stated business unit reviews the process fault report. Normally the process owner has not been involved in dealing with the product fault. After reading the description of the fault and the solution, he decides if the report has been correctly addressed. The question to ask is whether or not it is possible to avoid similar faults from reoccurring by changing something in the process. If it is possible then the report should be kept; if it is not possible then the report should be sent to the process that must be changed to avoid similar faults. In this manner some reports may bounce back and forth many times before ending up at the process where future faults can be prevented.
When the process owner reads the report, he may recognise the process fault from before or it may be something new. If he recognises the fault, he “groups” the new report with a group of similar process fault reports. If he does not recognise the fault, he creates a new group – only consisting of one report at first – to be used in the future. Then the primary process of the current report stops. If a process owner gets many process fault reports he uses the classifications of high, medium, low occurrence, and estimated process fault costs per year to prioritise which reports should be investigated first.
Changing from a Product to a Process Perspective for Service Improvements in Manufacturing Companies Cronemyr and Witell (2007)
C-10
It is then the process owner’s task once a month or every second month to explore the groups to see if process faults are reoccurring. He makes his own classifications of the grouped reports because he has more knowledge about the process than the product fault analysers. When a group grows, its occurrence classification increases (from low and medium to high) and it may be selected to be investigated by a Six Sigma project to find the root causes and the solution to the common process fault. Sometimes a group can be identified as a problem that has already been taken care of since a product fault may have been built into the product by a process that is no longer used. The process owner uses additional sources of information to initiate Six Sigma projects, such as key performance indicators and the balanced scorecard of the division. If the work is successful the result in the long run should be a decreased number of product fault reports per year, which leads to more satisfied customers and lower non-conformance costs.
5.4. Analysis of process fault reports at the Service Division
During the last three years, 336 process fault reports have been sent to the process owners at the service division. Of these process fault reports, 63 % (213 reports) have been sent on to process owners within other business units. The high ratio is explained by the fact that the product fault analysers, focused on solving product faults, tend to think “this will be taken care of by the Service Division” when they really should think “which process needs to be improved to avoid this type of product fault reoccurring”. Most of the process fault reports that were sent forward from the Service Division were sent to the Development Process within the New Gas Turbine Division. This is to be expected since the majority of product faults are designed into the product in the development of new gas turbines. A few reports (9%) were kept within the Service Division but were sent to different process owners than originally stated. The rest (28%) were accepted and kept by the process owners, hence 123 reports (37%) were kept within Service and were grouped by the process owners.
Within the Service Division, the service delivery process stands for 78% of the number of reports and causes 90% of the fault costs related to the reports. In addition, 15% of the product fault reports adhere to the sales process and 7% adhere to the service development process. Concerning fault costs, 9% are attributed to the sales process and 1% to the development process. It is to be noted that the contributions from the service development process to the product faults are small both in number and in costs, contrary to the rule of thumb that most faults are created during development and not in the delivery process. One should not forget, however, that we are only looking at service processes here and not development of new equipment.
5.5. Experiences when changing from product to process perspective
As mentioned in Table 1, the introduction of a process fault report changes the perspective from a product to a process perspective. When a product fault analyser classifies a process fault, i.e., the cause of the product fault, he often thinks of the fault as a “one-time error that
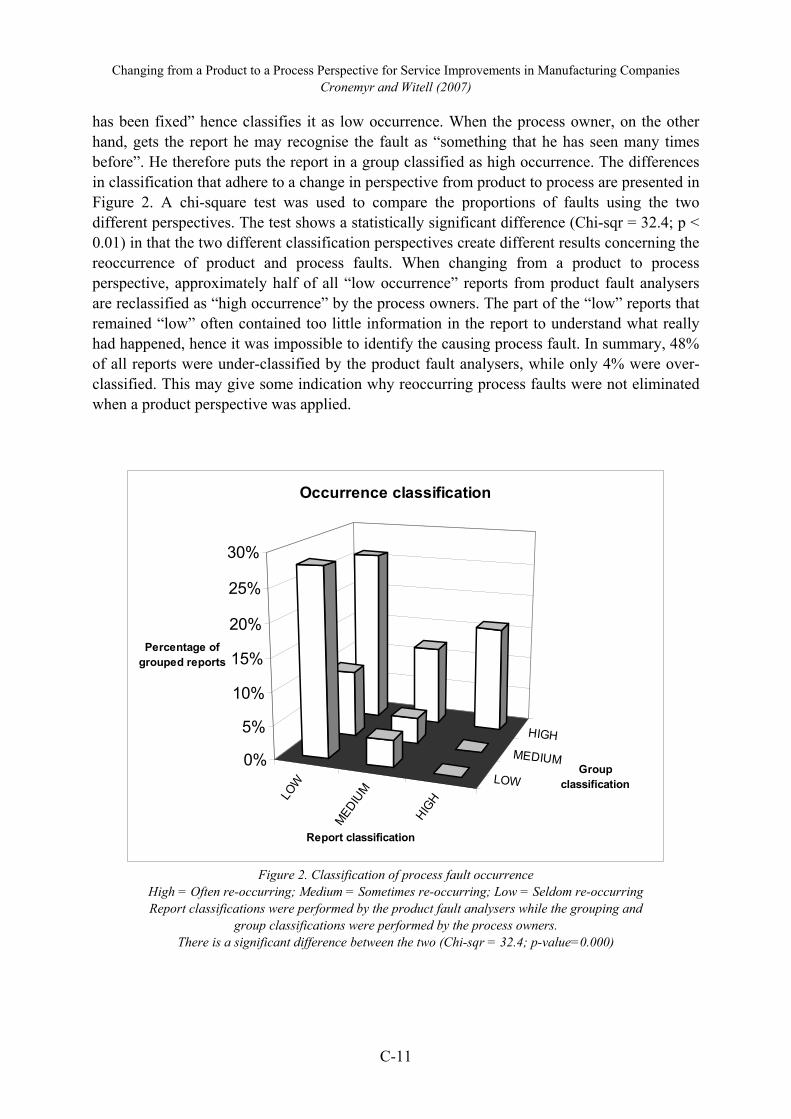
Changing from a Product to a Process Perspective for Service Improvements in Manufacturing Companies Cronemyr and Witell (2007)
C-11
has been fixed” hence classifies it as low occurrence. When the process owner, on the other hand, gets the report he may recognise the fault as “something that he has seen many times before”. He therefore puts the report in a group classified as high occurrence. The differences in classification that adhere to a change in perspective from product to process are presented in Figure 2. A chi-square test was used to compare the proportions of faults using the two different perspectives. The test shows a statistically significant difference (Chi-sqr = 32.4; p < 0.01) in that the two different classification perspectives create different results concerning the reoccurrence of product and process faults. When changing from a product to process perspective, approximately half of all “low occurrence” reports from product fault analysers are reclassified as “high occurrence” by the process owners. The part of the “low” reports that remained “low” often contained too little information in the report to understand what really had happened, hence it was impossible to identify the causing process fault. In summary, 48% of all reports were under-classified by the product fault analysers, while only 4% were over-classified. This may give some indication why reoccurring process faults were not eliminated when a product perspective was applied.
LOW
MEDIUM
HIGH
LOW
MEDIUM
HIGH
0%
5%
10%
15%
20%
25%
30%
Percentage of grouped reports
Report classification
Group classification
Occurrence classification
Figure 2. Classification of process fault occurrence
High = Often re-occurring; Medium = Sometimes re-occurring; Low = Seldom re-occurring Report classifications were performed by the product fault analysers while the grouping and
group classifications were performed by the process owners. There is a significant difference between the two (Chi-sqr = 32.4; p-value=0.000)

Changing from a Product to a Process Perspective for Service Improvements in Manufacturing Companies Cronemyr and Witell (2007)
C-12
5.6. Actions taken to eliminate process faults
An important step in eliminating process faults is to have a rigorous process of going through all reports. In this case, the grouping of process fault reports followed a specific procedure including 5 steps. All work in each step was conducted by the six process owners (including three sub-process owners to the Delivery process) with the assistance of the Six Sigma program manager.
1. All process fault reports classified as HIGH occurrence were analysed. Some were sent on to other processes or business units. The rest were clustered into new HIGH groups.
2. All process fault reports classified as MEDIUM occurrence were analysed. Some were sent on to other processes or business units. The rest were either put into existing HIGH groups or clustered into new HIGH or MEDIUM groups.
3. All process fault reports classified as LOW occurrence were analysed. Some were sent on to other processes or business units. The rest (with sufficient information) were either put into existing HIGH or MEDIUM groups or clustered into new HIGH, MEDIUM, or LOW groups.
4. Reports that did not have sufficient information were put into a LOW group called “Unknown process fault”
5. All HIGH and MEDIUM groups were analysed and identified as either i) a process fault that had already been corrected by a Six Sigma project or some other action (started after the occurrence of the faults), or ii) a process fault that should be investigated by a future Six Sigma project, or iii) a process fault not prioritised at the moment that should be kept until the occurrence and the severity of the fault increase (iii also included the LOW groups).
Actions planned and started before the analysis of process fault reports were identified from benchmarking of either key performance indicators or internal process feedback. The actions were, e.g., process mapping and development carried out in the process owners' teams, and Six Sigma projects mainly in the Supply Chain (a part of the Delivery Process). Some Service Product Development projects were also performed.
The main actions identified from findings through analysis of process fault reports were more focused on customer needs, where as the previous projects were more internally focused on reducing cost, waste, and lead time. Examples of initial actions are improved customer communication, improved external documentation, and increased use of design reviews to eliminate product non conformances in the customers' processes (see Table 2).
Groups with no action planned mainly include reports where the underlying process faults are not obvious and where more data is needed to determine the actual problem.
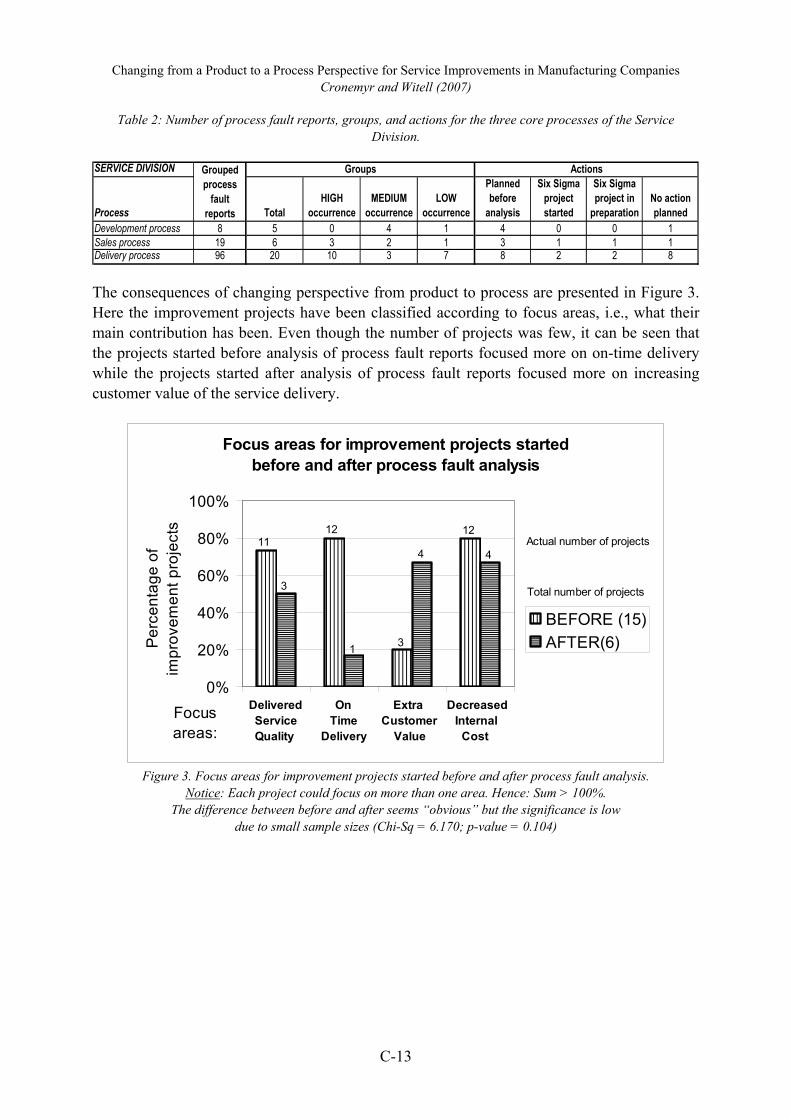
Changing from a Product to a Process Perspective for Service Improvements in Manufacturing Companies Cronemyr and Witell (2007)
C-13
Table 2: Number of process fault reports, groups, and actions for the three core processes of the Service Division.
SERVICE DIVISION
Process TotalHIGH
occurrenceMEDIUM
occurrenceLOW
occurrence
Planned before
analysis
Six Sigma project started
Six Sigma project in
preparationNo action planned
Development process 8 5 0 4 1 4 0 0 1Sales process 19 6 3 2 1 3 1 1 1Delivery process 96 20 10 3 7 8 2 2 8
GroupsGrouped process
faultreports
Actions
The consequences of changing perspective from product to process are presented in Figure 3. Here the improvement projects have been classified according to focus areas, i.e., what their main contribution has been. Even though the number of projects was few, it can be seen that the projects started before analysis of process fault reports focused more on on-time delivery while the projects started after analysis of process fault reports focused more on increasing customer value of the service delivery.
Focus areas for improvement projects started before and after process fault analysis
0%
20%
40%
60%
80%
100%
Q T V C
Per
cent
age
of
impr
ovem
ent p
roje
cts
BEFORE (15)AFTER(6)
Delivered On Extra Decreased Service Time Customer Internal Quality Delivery Value Cost
Focusareas:
11
3
12
1 3
4 4
12Actual number of projects
Total number of projects
Figure 3. Focus areas for improvement projects started before and after process fault analysis.
Notice: Each project could focus on more than one area. Hence: Sum > 100%. The difference between before and after seems “obvious” but the significance is low
due to small sample sizes (Chi-Sq = 6.170; p-value = 0.104)

Changing from a Product to a Process Perspective for Service Improvements in Manufacturing Companies Cronemyr and Witell (2007)
C-14
6. Discussion and Conclusions Quality initiatives have a strong tradition in manufacturing firms but are mainly applied within the production process. Previous research has shown that product development, for instance, is often excluded in quality initiatives (Caffyn, 1997; Sterman et al., 1997) and the same stands for activities in the service division. Within the service division there are both service production and development, although service development is often performed adhoc. It is first when companies have started their transition from traditional goods suppliers to solution providers that quality initiatives in the service division start to become more important to manufacturing companies (Oliva and Kallenberg, 2003). Since service divisions are often driven by a fire fighting culture, however, a number of changes incorporating both structural and cultural changes have to be made to ensure quality initiative success.
The case study of the service division of Siemens Industrial Turbomachinery AB provides us with a number of fruitful insights on how to work with service improvements in manufacturing companies. First, they have succeeded in changing the culture from a fire fighting behaviour to include prevention of future failures. Still, there will be problems with the installed base in customer facilities that will have to be dealt with promptly, but in addition, each such episode should also serve as a learning opportunity for the company. In addition, the structural change through the introduction of an improvement structure can, to a certain extent, promote the principles of prevention and continuous improvement throughout the organisation.
Second, the fire fighting tradition within the service division in many manufacturing companies makes them a target for dealing with product problems. In the case company, over 60% of the product faults that the person in charge assigned to services were outside the responsibility of the service division. Many problems needing design changes in the product have to be sent from the service division to the development process. This indicates that the roles of the various parts of the organisation have been vague and that adding a fault resolution process can aid in clarifying the areas of responsibility.
Third, when taking in prevention of future failures a company needs to change from a product to a process perspective. Since all focus within the service division is usually on the product, such a change can have a great effect on the company. This means that each product fault should also be viewed as a process fault. Changing perspective means that repetitive product faults can be attributed to a process within the company and as such the process can be redesigned to prevent future product faults. Such a change saves the company resources and can reduce warranty costs. Such a change, however, is not without problems. For instance, the individuals who must change their ways of working put up some resistance. Most of them are designers or engineers who solve product problems and do not usually specify causal processes or classify process faults. To some extent this is because they lack knowledge about the processes and have not had sufficient time to work with them. Hence, managers have to remember to provide workers with more resources, knowledge, and motivation to perform their work.

Changing from a Product to a Process Perspective for Service Improvements in Manufacturing Companies Cronemyr and Witell (2007)
C-15
Fourth, the largest benefit of changing from a product to a process perspective is the change in focus from reduction of internal costs to value creation through service delivery. In Siemens, the introduction of process fault reports has changed the focus of improvement work from internal lead-times and process mapping to customer needs and customer communication. From a theoretical perspective, this means that improvements were first introduced in the processes in the back-office that did not directly influence the customer. Over time, however, this has changed so that improvements are made outside the line of visibility so that they directly influence the customer experience. Such a shift makes it possible to improve the perceived customer value and build long-term relationships with customers. This follows the trend in the manufacturing industry where companies focus on value creation through services. The installed base of gas and steam turbines becomes a platform for services which creates value in use for the customer. In addition, this provides opportunities to complement the maintenance and repair services with other types of services such as business advisory services and integrated solutions.
Within manufacturing firms, product development is often the source of most costs associated with products faults since they are designed into the product. When it comes to services in manufacturing firms, this rule of thumb is no longer true. Instead of the development process, it is the service delivery process that causes about 80% of the costs. Such differences between a goods-centred and a service-centred logic are important to reveal since otherwise managers will continue using their previous experience in this new context. Additional case studies are needed to reveal further traditional rules of thumb that no longer apply.
Changing from a Product to a Process Perspective for Service Improvements in Manufacturing Companies Cronemyr and Witell (2007)
C-16
7. References Adamson, C. (1993) Evolving complaint procedures, Managing Service Quality, Vol. 3, No. 2, pp. 439-444.
Antony, J. and R. Banuelas (2002) Key ingredients for the effective implementation of Six Sigma programme, Measuring Business Excellence, Vol. 6, pp.20–27.
Bergman, B. and Klefsjö, B. (2002) Quality from Customer Needs to Customer Satisfaction, McGraw-Hill, New York.
Caffyn, S. (1997) Extending Continuous Improvements to the New Product Development Process, R&D Management, Vol. 27, No. 3, pp. 253-267.
Chadwick, G. C. (2007) Remembering Bill Smith, Father of Six Sigma, i SixSigma Magazine, January/February: 74-76.
Edvardsson, B., Gustafsson, A., and Witell, L. (2006) Services Marketing: History, Current trends and the Future in Stefan Lagrosen and Göran Svensson (eds.) Marketing: Broadening the Horizons forthcoming Studentlitteratur.
Eiglier, P. and Langeard, E. (1976) Principles de politique marketing pour les enterprises de service, I A E Aix-en-Provence.
Fundin, A. and Bergman, B. (2003), Exploring the customer feedback process, Measuring Business Excellence, Vol. 7, No. 2, pp. 55-65.
Fundin, A. and Cronemyr, P. (2003) Use Customer Feedback To Choose Six Sigma Projects, Six Sigma Forum Magazine, November: 17-21.
Fundin, A. and Elg, M.(2006) Exploring routes of dissatisfaction feedback: A multiple case study within a machine industry segment, International Journal of Quality & Reliability Management, Vol. 23, No. 8, pp. 986-1001.
Glaser, B. and Strauss, A. (1967) The discovery of grounded theory, Chicago: Aldine.
Grönroos, C. (2000) Service Management and Marketing, Wiley, Chichester.
Gustafsson, A., and Johnson, M. D. (2003) Competing in a Service Economy: How to Create a Competitive Advantage Through Service Development and innovation, Jossey-Bass, San Francisco.
Johnson, M. D. and Nilsson, L. (2003) The Importance of Customization and Reliability from Goods to Services, Quality Management Journal, Vol. 10, No. 1, pp. 8-19.
Juran, J. M. and Gryna, F. M. (1988), Juran’s Quality Control Handbook, Fourth Edition, New York: McGraw-Hill.

Changing from a Product to a Process Perspective for Service Improvements in Manufacturing Companies Cronemyr and Witell (2007)
C-17
Kotler, P. (1994) Marketing Management: Analysis, Planning, Implementation and Control, 8th ed., Prentice-hall, Englewood Cliffs, NJ.
Lalonde, B. and Zinszer, P. H. (1976) Customer Service: Meanings and Measurement, National Council of Physical Distribution Management, Chicago, IL.
Lewin, K. (1946) Action Research and Minority Problems, Journal of Social Issues, Vol. 2, No. 4, pp. 34-46.
Lovelock, C. and Wirtz, J. (2007) Services Marketing - People, Technology and Strategy, New Jersey: Pearson Prentice Hall.
Neu, W. A. and Brown, S. W. (2005) Forming Successful Business-to-Business Services in Goods-Dominant Firms, Journal of Service Research, Vol. 8, No. 1, pp. 3-17.
Oliva, R. and Kallenberg, R. (2003) Managing the transition from products to services, International Journal of Service Industry Management, Vol. 14, No. 2, pp. 160-172.
Repenning, N. P. (2001) Understanding fire fighting in new product development, Journal of Product Innovation Management, Vol. 18, No. 5, pp. 285–300.
Shewhart, W. A. (1931) Economic control of quality and manufactured product. Van Nostrand, New York.
Sterman, J., Repenning, N. P., and Kofman, F. (1997) Unanticipated Side Effects of Successful Quality Programs: Exploring a Paradox of Organizational Improvement, Management Science, Vol. 43, No. 4, pp. 503-520.
Westlander, G. (1999) Forskarroller i varianter av aktionsforskning (in Swedish; English translation: Researcher roles in action research), Research report TRITA 1999:24, Royal Institute of Technology, Stockholm.
Wirtz, J. and Tomlin, M. (2000) Institutionalizing customer-driven learning through fully integrated customer feedback systems, Managing Service Quality, Vol. 10, No. 4, pp. 205-215.
Wisner, J. D. and Corney, W. J. (2001) Comparing practices for capturing bank customer feedback - Internet versus traditional banking, Benchmarking: An International Journal, Vol. 8, No. 3, pp. 240-250.
Woodruff, R. B. and Flint, D. J. (2006) Marketing's service-dominant logic and customer value, in: The Service-dominant Logic of Marketing: Dialog, Debate, and Directions, Lusch, R. and Vargo, S., eds., M.E. Sharpe, NY, 2006.

Appendix D
Title Selection of Six Sigma
roadmap based on process state
Paper title DMAIC and DMADV Differences, similarities, and synergies
Author Peter Cronemyr
Publication International Journal of Six Sigma and
Competitive Advantage. Vol. 3, No. 3, pp. 193–209. (2007)

Int. J. Six Sigma and Competitive Advantage, Vol. 3, No. 3, 2007 193
Copyright © 2007 Inderscience Enterprises Ltd.
DMAIC and DMADV – differences, similaritiesand synergies
Peter Cronemyr
Business Excellence, Service Division Siemens Industrial Turbomachinery AB SE-612 83 Finspong, Sweden E-mail: [email protected]
Abstract: Define, Measure, Analyse, Improve, Control (DMAIC) is the well-known Six Sigma methodology, while Define, Measure, Analyse, Design, Verify/Validate (DMADV) is the most commonly used methodology within Design for Six Sigma (DfSS). Many emphasise the differences between the two, but there are similarities as well. Based on Donald Wheeler’s four process states, it is suggested when it is appropriate to use DMAIC or DMADV. However, in one specific state, which is quite common, neither of the two is appropriate. In the case of a process that is out of control but with only minor customer problems, a combination of DMAIC and DMADV, called for Define, Measure, Analyse, Design, Control (DMADC), is suggested. It was developed from experiences gained in process-improvement projects at Siemens in Sweden. Furthermore, contrary to the views of some authors, it is argued that there is no such thing as a ‘five-sigma wall’ between DMAIC and DfSS when improving processes.
Keywords: Six Sigma; Define, Measure, Analyse, Improve, Control; DMAIC; Design for Six Sigma; DfSS; Define, Measure, Analyse, Design, Verify/Validate; DMADV; Define, Measure, Analyse, Design, Control; DMADC; Wheeler’s process states; process door; five-sigma wall.
Reference to this paper should be made as follows: Cronemyr, P. (2007) ‘DMAIC and DMADV – differences, similarities and synergies’, Int. J. Six Sigma and Competitive Advantage, Vol. 3, No. 3, pp.193–209.
Biographical notes: Peter Cronemyr is a certified Six Sigma Black Belt and Six Sigma Programme Manager within the Service Division at Siemens Industrial Turbomachinery AB in Finspong, Sweden. He is also a PhD student at the Department of Quality Sciences at Chalmers University, Gothenburg, Sweden. He is conducting research on ‘Six Sigma Management’ under Professor Bo Bergman. In 2000, he earned the degree of ‘Teknisk Licentiat’ at the Department of Quality Technology and Management at Linköping University, Sweden. He has been with Siemens since 1996 in different positions, e.g., Structural Dynamics and Acoustics Engineer, Process Developer at the Development Department within the Gas Turbine Division, and Manager of the Business Excellence Department within the Service Division. For 11 years he worked at Saab Aircraft in Linköping, Sweden, on the development of the JAS 39 Gripen fighter aircraft. He has an MSc in Mechanical and Aeronautical Engineering.

194 P. Cronemyr
1 Introduction
Within the framework of Process Management, there exist activities linked to the development, improvement and control of business processes within a company or the public sector. While the purpose of controlling a process is to have predictable results that fall within specification limits set by the customer, most processes are rather “managed to fulfil customer requirements” than controlled to give predictable results (Wheeler, 2000). When the performance of a process – controlled or not – is not good enough, in terms of customer satisfaction or internal process cost, it is necessary to improve the process or to develop a new process. Depending on which, more and more companies choose to use some proven methodology to either improve an existing or develop a new process. During the last decade Six Sigma has emerged as a popular process-improvement methodology and for some years it has been complemented by the product and process design methodology Design for Six Sigma (DfSS).
In this paper the tools and phases of the Six Sigma road map DMAIC for process improvement and the DfSS road map DMADV for process design are compared. In real-life applications it is not always clear which of the two methodologies to use. Are we improving an existing process or are we designing a new one? Which road map should we use? By identifying differences and similarities, the purpose is to establish when to use DMAIC and when to use DMADV.
From experiences gained in Black and Green Belt projects, it has sometimes been found difficult to use DMAIC straight on due to the state of the process. Processes are often assumed to be designed the way they are working at present when, in fact, they were never designed at all. They evolved organically over a long time with many changes in organisation, personnel, company names, etc. Nobody ‘knows’ the process and the process is not the same for different people using the process on different occasions. That is why something often needs to be done before using DMAIC.
The concepts of ‘process states’ and ‘process entropy’ as presented by Wheeler (2000) have been used to differentiate processes. The aim of the paper is, furthermore, to use the differences and similarities to synthesise the two methodologies into something that can be used in those process states where neither DMAIC nor DMADV can be used effectively.
The outline of the paper is as follows. First, short backgrounds of Six Sigma and DfSS are presented. These are followed by a comparison of DMAIC and DMADV, where differences and similarities of the tools and phases are presented. Next, in order to investigate when DMAIC and DMADV are applicable, processes are classified according to the definitions by Wheeler (2000). We identify a process state, ‘on the brink of chaos’, where neither DMAIC nor DMADV fits. Finally, we present a new road map, DMADC, suitable to use when improving processes on the brink of chaos.
2 Process improvements: Six Sigma – DMAIC
The widely spread process-improvement methodology of Six Sigma was introduced by Motorola in the 1980s and made famous by General Electric in the 1990s. Since then it has spread widely and is now, some ten years later, used by many companies around the world.
DMAIC and DMADV – differences, similarities and synergies 195
Six Sigma is in essence a structured way of solving problems in an existing process based on analysis of real process data, i.e., facts. It is often referred to as DMAIC, which is an abbreviation of Define, Measure, Analyse, Improve, Control; the phases of the Six Sigma process, described later. One could argue that DMAIC is nothing new, but rather a set of long well-known tools used within quality management, but on the other hand without Six Sigma these tools would probably still be the possession of a limited number of people. What makes DMAIC something new is rather the structuring of the individual tools to the process itself, which is basically the Shewhart cycle (also known as the PDSA cycle, for Plan, Do, Study, Act; see, e.g., Bergman and Klefsjö, 2002).
In the beginning companies were using primarily DMAIC to improve their manufacturing process, since the process flow of material was obvious (some people associate the word ‘process’ directly with manufacturing), and also for the short cycle time and the repetitive nature of the manufacturing process. Since then the usage has spread to all types of business processes, and one of the most successful applications of DMAIC within pioneer General Electric has been to improve transactional processes within the GE Capital. Even so, many people view DMAIC as ‘something for the manufacturing process’. In this paper the focus is on service processes, which are mainly transactional and logistical but also include elements of manufacturing.
3 Product and process design: Design for Six Sigma – DfSS
While Six Sigma has been around for almost two decades, Design for Six Sigma (DfSS) was introduced in the late 1990s and is now a common buzzword of many management journals. As with Six Sigma, DfSS builds on previously known topics and techniques but is sometimes presented as something new. One significant difference between the two is that, while the concept and structure of Six Sigma is highly standardised, DfSS is the opposite. There are almost as many variants – or road maps – of DfSS as there are companies using it and authors describing it. There seems to be no clear consensus on the definition of DfSS. According to Berryman (2002): “No prior quality initiative seems to be more misunderstood, poorly communicated or inconsistently deployed in industry”. Bergman and Gremyr (2006, p.7) use the following pragmatic definition: “The purpose of Six Sigma can be summarised as minimising variation in processes whereas DfSS is about designing products and processes so that they can allow for more variation without being affected in their performance”. According to General Electric: “The essence of DfSS is predicting design quality up front and driving quality measurement and predictability improvement during the early design phases” (quoted in Treichler and Carmichael, 2002). Watson (2005, p.42) uses the following definition:
“Design for Six Sigma is a process to define, design, and deliver innovative products, processes, and services that provide competitively attractive value to customers in a manner that achieves the critical-to-quality characteristics for all the significant functions.”
Chowdhury (2002, p.13) uses a more anecdotal language: “While Six Sigma helps fix what is broken […] Design for Six Sigma helps to design things that don’t break in the first place, things that do more and cost less”.
196 P. Cronemyr
In an empirical study, Gremyr (2003) showed that it is equally common to focus DfSS efforts on each of the following four categories: design of new products, design of new processes, improvement of existing products and improvement of existing processes. In the study presented in this paper we are only considering the design and improvement of processes – not products. Most literature on DfSS deals with the design and improvement of products – not processes. However, a short summary of the roots of DfSS – as applied to both products and processes – is presented below.
The idea of driving quality improvements in design phases has been indicated already by Shewhart (1931). He noticed that it would be much better to turn attention to the process that delivered the products and to make improvements in the process rather than focusing on the individual units produced. He also noticed that many sources of variation in the production process were inherent in the design of the products, hence indicating the importance of improving the design process (Bergman and Gremyr, 2006).
During the 1920s Fisher initiated the development of a tool often used in Six Sigma: Design of Experiments (DoE). Based on the ideas of DoE, Taguchi (1986) later proposed a three-step strategy for the development of products and making them insensitive to variation. The steps are system design, parameter design and tolerance design. The efforts to find design solutions which are insensitive to variation is often referred to as Robust Design Methodology, which belongs to the core of DfSS (Phadke, 1989; Bergman, 1992; Bergman and Gremyr, 2006).
Shewhart also emphasised the importance of the customer. Later, in the 1960s, Mizuno and Akao developed Quality Function Deployment (QFD) to translate and deploy customer requirements into functional requirements. The use of QFD in product development was developed further by Clausing (1994) and Cohen (1995). Another important model related to the area of customer satisfaction, the Kano model, characterises product attributes into basic ‘necessary/must be’, expected ‘more is better’, and attractive ‘delighter’ attributes. Today, in most literature on DfSS, both QFD and the Kano model have prominent roles (Bergman and Gremyr, 2006). Hence, one might expect the main emphasis of DfSS would be to reduce sources of variation in customer use, but in a study by Gremyr (2003), the category that most of the respondents worked with in DfSS was production variation.
Even though the main ideas of DfSS are very similar to those of systems engineering (Clausing, 1994), i.e., to design and optimise a robust system to customer requirements, very few DfSS variants have a link to systems engineering. One that does is RCI – Requirements, Concepts, Improvements – as defined by Clausing et al. (1999; see also Magnusson et al., 2003; Lönnqvist, 2006).
The rationale behind the name ‘Design for Six Sigma’ is the need to do things right from the beginning to be able to achieve Six Sigma process capability, i.e., 3.4 defects per million opportunities (dpmo). It is sometimes claimed (see, e.g., Chowdhury, 2002) that DMAIC will stop at ‘the five-sigma wall’, i.e., 233 dpmo, because in that case something that was not optimised in the beginning has been improved as far as it is possible. However – as far as the author is aware – these statements have never been proved. As a matter of fact, many DfSS methodologies do not even include a sigma calculation. It is more about which tools to use and then ‘Six Sigma capability will come by default’. As a contrast, Magnusson et al. (2003, p.306) present a more pragmatic approach to DfSS:
DMAIC and DMADV – differences, similarities and synergies 197
“Design for Six Sigma does not intend to design products and processes that will perform at Six Sigma level or 3.4 dpmo. […] DfSS is about contributing to the goal of 50% improvement rate in dpmo. […] Design for Six Sigma is the natural way to include design and development activities and functions in a Six Sigma initiative.”
A more fair metaphor could be that DMAIC and DfSS can be used complementarily to ‘penetrate the five-sigma wall’, instead of placing the two methodologies on opposite sides of the wall.
As mentioned before, there are many DfSS road maps. Some of the commonly used are given below (from Atwood, 2005):
DMADV Define, Measure, Analyse, Design, Verify 47%
DMADOV Define, Measure, Analyse, Design, Optimise, Verify 15%
DMEDI Define, Measure, Explore, Develop, Implement 9%
IDOV Identify, Design, Optimise, Validate 7%
DMAIC Define, Measure, Analyse, Improve, Control 4%
DCOV Define, Characterise, Optimise, Verify 2%
According to Atwood’s benchmarking, DMADV is the most commonly used DfSS road map, and together with DMADOV (Optimise is often included in the Design of DMADV) the share of companies which use DMADV or DMADOV for DfSS is 62%. One should also notice from the same study that 4% of the surveyed companies answered that they used DMAIC for DfSS.
For the surveyed companies that used DfSS the primary purposes were most frequently reported as ‘enhance process capability’ and ‘new product introduction’, as well as ‘design for reliability’ and ‘design for manufacturing’. The two factors that distinguished companies utilising DfSS from those that did not were strong senior management commitment and a high ratio of full-time Six Sigma resources (Atwood, 2005; Lönnqvist, 2006).
There is limited information on success factors for implementing DfSS, but the two factors given in Atwood’s study correspond to the most commonly mentioned success factors for implementing Six Sigma. According to a literature review, these are (a) committed leadership, (b) use of top talent resources full time, and (c) supporting infrastructure (i.e., formal project-selection process, formal project-review process, and integration with the companies’ financial systems) (see, e.g., Henderson and Evans, 2000; Pande et al., 2000; Goldstein, 2001; Antony and Banuelas, 2002; Sandholm and Sörqvist, 2002; Snee and Hoerl, 2002; Bergman and Klefsjö, 2002; Magnusson et al., 2003; Schön, 2006).
For a company to evaluate its readiness for DfSS, Watson (2005) suggests the following procedure:
Determine the company’s generic change capacity
Evaluate the company’s performance in new product development
Conduct a self-assessment audit of best practices.

198 P. Cronemyr
Since DfSS is such a scattered topic with such a lack of uniformity, it is very hard to predict how DfSS will evolve and develop in the future. Some have waited for ‘the final’ DfSS road map to be established, but even though DMADV is the most commonly used one, other road maps are still used in specific applications and new ones arrive as well. Yet another one is presented in this paper. Regardless of road maps, it is no wild guess that DfSS is here to stay, at least for the next decade. It is the author’s belief that Six Sigma and DfSS will be more integrated in the future – not more separated.
4 Differences and similarities of DMAIC and DMADV
As described above, DMAIC and DfSS are often associated with different domains – Manufacturing versus Product Development – and consequently many see the two topics as very different. From now on – as it is the most commonly used DfSS road map – we select DMADV as our DfSS road map. When examining the tools of DMAIC and DMADV and considering only process development (not product development), both differences and similarities can be found.
5 Overview of the tools in the DMAIC phases
The DMAIC process and the tools of the phases are highly standardised (even though minor differences in terminology and applied tools may occur) and can be found in many books (see, e.g., Rath and Strong, 2002) and on numerous internet sites. In Table 1 an overview of the most commonly used tools is given. Some companies use the list as a set of tools to optionally choose from, while others use it as a procedure to be followed strictly.
Table 1 Tools of the DMAIC phases
Phase Tool Explanation
Define Business case Define gap between current process performance and strategic targets; estimate financial benefit of project.
Project charter Set target, scope, boundaries, schedule and team members.
SIPOC High-level process map (Suppliers, Inputs, Process, Outputs and Customers).
VOC Voice of the customer. Who and what? Use the Kano model.
CTQ driver tree Critical to quality. Transform the voice of the customer to internal process measurements.
Measure Measure variables Gather all variables that could be measured.
Prioritisation Select most important variables to be measured.
Data collection plan Characterise variable type, set up measurement system, define operational definition.
Gage R&R Check measurement system for errors and built-in noise.
Sampling Perform measurement of historic and/or current data.
Data presentation ‘Eyeball data’. Usually with Pareto charts and histograms
Process capability Calculate initial process capability and process sigma.
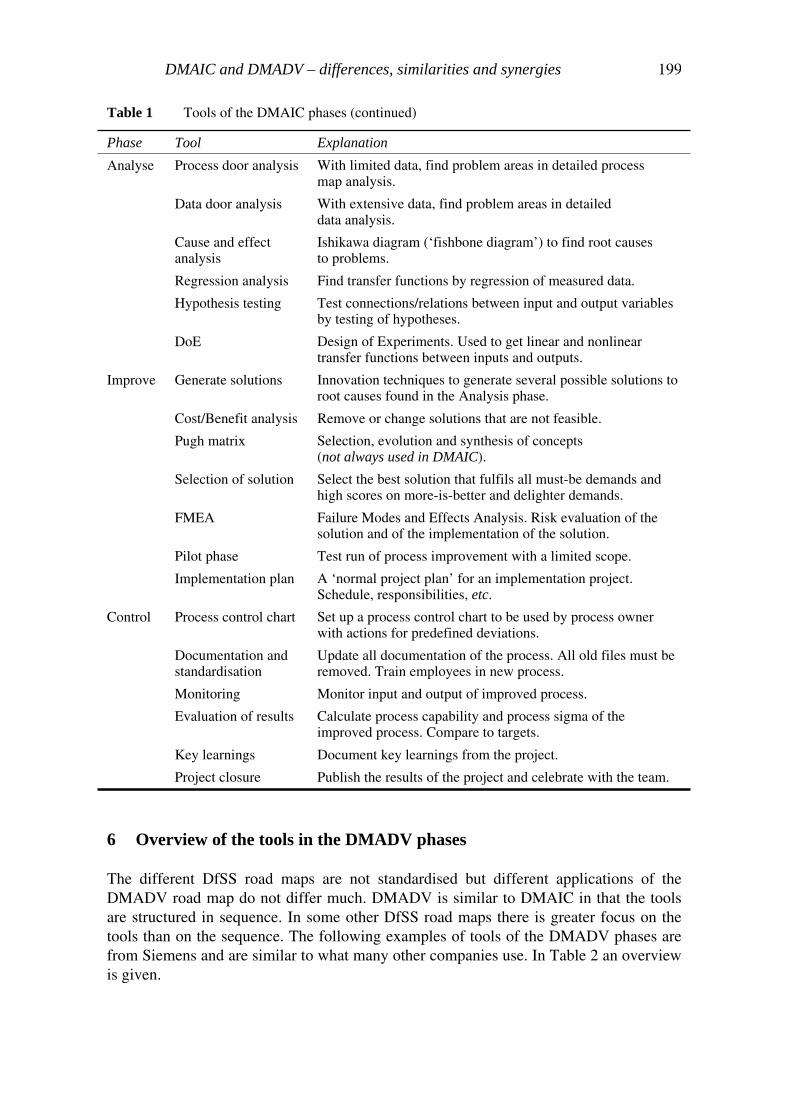
DMAIC and DMADV – differences, similarities and synergies 199
Table 1 Tools of the DMAIC phases (continued)
Phase Tool Explanation
Analyse Process door analysis With limited data, find problem areas in detailed processmap analysis.
Data door analysis With extensive data, find problem areas in detaileddata analysis.
Cause and effect analysis
Ishikawa diagram (‘fishbone diagram’) to find root causesto problems.
Regression analysis Find transfer functions by regression of measured data.
Hypothesis testing Test connections/relations between input and output variables by testing of hypotheses.
DoE Design of Experiments. Used to get linear and nonlinear transfer functions between inputs and outputs.
Improve Generate solutions Innovation techniques to generate several possible solutions to root causes found in the Analysis phase.
Cost/Benefit analysis Remove or change solutions that are not feasible.
Pugh matrix Selection, evolution and synthesis of concepts(not always used in DMAIC).
Selection of solution Select the best solution that fulfils all must-be demands and high scores on more-is-better and delighter demands.
FMEA Failure Modes and Effects Analysis. Risk evaluation of the solution and of the implementation of the solution.
Pilot phase Test run of process improvement with a limited scope.
Implementation plan A ‘normal project plan’ for an implementation project. Schedule, responsibilities, etc.
Control Process control chart Set up a process control chart to be used by process owner with actions for predefined deviations.
Documentation and standardisation
Update all documentation of the process. All old files must be removed. Train employees in new process.
Monitoring Monitor input and output of improved process.
Evaluation of results Calculate process capability and process sigma of the improved process. Compare to targets.
Key learnings Document key learnings from the project.
Project closure Publish the results of the project and celebrate with the team.
6 Overview of the tools in the DMADV phases
The different DfSS road maps are not standardised but different applications of the DMADV road map do not differ much. DMADV is similar to DMAIC in that the tools are structured in sequence. In some other DfSS road maps there is greater focus on the tools than on the sequence. The following examples of tools of the DMADV phases are from Siemens and are similar to what many other companies use. In Table 2 an overview is given.

200 P. Cronemyr
Table 2 Examples of tools of the DMADV phases
Phase Tool Explanation
Define Opportunity and project charter
Mission of the project. Assign project team.
Kano model and CTQ Business and project requirements.
Quality goals Define quality goals to be reached and checkfor contradictions.
SIPOC Sketch target process.
Mini FMEA Check for global risks.
Measure Questionnaire,interviews
Identify requirements of the process customer andinternal requirements.
QFD1 Quality Function Deployment 1. Transform requirements into quality characteristics.
Design Scorecard Set up Design Scorecard (no numbers yet).
Analyse Benchmarking Check best practice internally and of competitors.
QFD2 Quality Function Deployment 2. Transform quality characteristics into design characteristics.
TRIZ and other creativity techniques
Theory of Inventive Problem Solving (translated from Russian). Prepare design concepts.
Simulations and DoE Evaluate availability, capability and feasibility.
Pugh matrix Evaluate, reduce, combine, select and freeze design concepts.
Design Scorecard Update scorecard with simulated numbers. Calculate process sigma.
FMEA Complete risks before development and reassess.
Design QFD3 Quality Function Deployment 3. Transform design characteristics into component* characteristics. (* subprocesses, tasks, or support systems)
Transfer functions, simulation, DoE
Formulate and expand transfer functions.Simulate performance.
Specifications and tolerances
Define specification limits and tolerances forcomponent-specific measures.
Robust Design Methodology
Loss function, p-diagram, noise factors, explore nonlinearities incl. interactions, DoE
Statistical tolerancing Calculate/Simulate defect propagation.
Design Scorecard Predict design quality and fulfilment of requirements.
Implementation plan Tree and Gantt charts for the implementation
FMEA Risk analysis before design review and reassess
Design review Perform design review. If not acceptable, go back.
Freeze design Document new process and substitute any old documents.
Control plan Prepare control plan for pilot test.
Verify Pilot process Test new process. Revise implementation plan if necessary.
Design scorecard Update with pilot results. Process sigma
Control plan Update and hand over control plan to process owner.
Formal release Formal release of the new process by the process owner
Project closure Publish the results of the project and celebrate with the team.

DMAIC and DMADV – differences, similarities and synergies 201
7 Major differences and similarities
Some of the tools of DMAIC and DMADV are the same. The order of those tools are almost the same in the two road maps but sometimes the sequence of tools are in the reverse order. That is partly because the tools of DMADV keep recurring (e.g., QFD, FMEA and Design Scorecard) so the exact sequence is not very important. In Figure 1 a rough outline of the two road maps is given. As described below the tools of the road maps are very similar at the beginning and at the end, while they are quite different in the middle of DMAIC and DMADV. In the following chapter the appropriate usage of the two road maps is discussed.
Figure 1 Comparison of the DMAIC and DMADV road maps (rough outline)
block
DMAIC DMAIC tools # DMADV tools DMADV
Define project Define project
D Process map 1 Process map
Voice of the customer Voice of the customer
Set up measurement QFD1:VOC to QC* M
M Measure historic data 2 Design Scorecard
Initial process sigma Benchmarking
A Root cause analysis QFD2:QC to DC* A
Generate improvements Generate concepts
(Pugh matrix) Pugh matrix
QFD3:DC to CC*
3 Transfer functions
I FMEA Robust design D
Design Scorecard
Pilot test Implementation plan
Implementation plan Design review
Control plan Pilot process
Standardisation 4 Design Scorecard
C Monitoring Control plan V
Final process sigma Formal release
Closure Closure
D
Notes: *QFD: Quality Function Deployment.
VOC: Voice of the Customer.
QC: Quality Characteristics.
DC: Design Characteristics.
CC: Component Characteristics.
Comparing the road maps one phase at a time, i.e., Define-Define, Measure-Measure, etc., is somewhat difficult because the phases are sometimes misaligned. Instead, the tools have been grouped into four blocks (1–4) for each road map in such a manner that the tools align as much as possible.
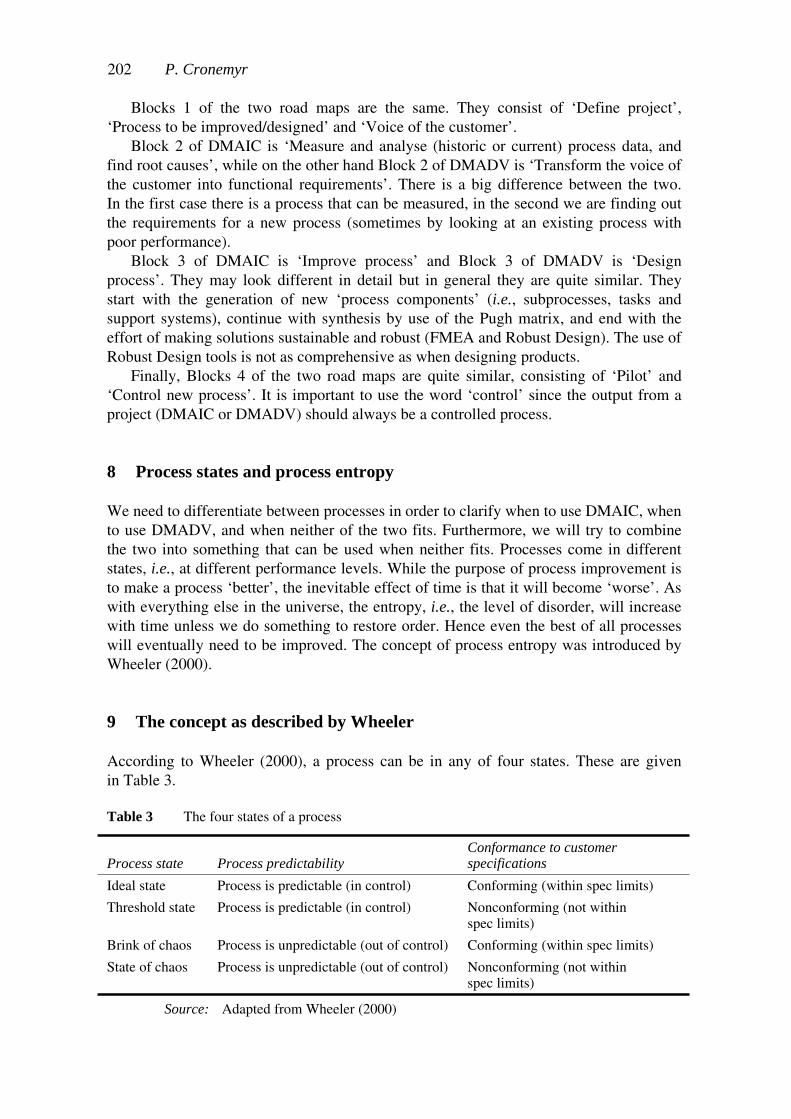
202 P. Cronemyr
Blocks 1 of the two road maps are the same. They consist of ‘Define project’, ‘Process to be improved/designed’ and ‘Voice of the customer’.
Block 2 of DMAIC is ‘Measure and analyse (historic or current) process data, and find root causes’, while on the other hand Block 2 of DMADV is ‘Transform the voice of the customer into functional requirements’. There is a big difference between the two. In the first case there is a process that can be measured, in the second we are finding out the requirements for a new process (sometimes by looking at an existing process with poor performance).
Block 3 of DMAIC is ‘Improve process’ and Block 3 of DMADV is ‘Design process’. They may look different in detail but in general they are quite similar. They start with the generation of new ‘process components’ (i.e., subprocesses, tasks and support systems), continue with synthesis by use of the Pugh matrix, and end with the effort of making solutions sustainable and robust (FMEA and Robust Design). The use of Robust Design tools is not as comprehensive as when designing products.
Finally, Blocks 4 of the two road maps are quite similar, consisting of ‘Pilot’ and ‘Control new process’. It is important to use the word ‘control’ since the output from a project (DMAIC or DMADV) should always be a controlled process.
8 Process states and process entropy
We need to differentiate between processes in order to clarify when to use DMAIC, when to use DMADV, and when neither of the two fits. Furthermore, we will try to combine the two into something that can be used when neither fits. Processes come in different states, i.e., at different performance levels. While the purpose of process improvement is to make a process ‘better’, the inevitable effect of time is that it will become ‘worse’. As with everything else in the universe, the entropy, i.e., the level of disorder, will increase with time unless we do something to restore order. Hence even the best of all processes will eventually need to be improved. The concept of process entropy was introduced by Wheeler (2000).
9 The concept as described by Wheeler
According to Wheeler (2000), a process can be in any of four states. These are given in Table 3.
Table 3 The four states of a process
Process state Process predictability Conformance to customer specifications
Ideal state Process is predictable (in control) Conforming (within spec limits)
Threshold state Process is predictable (in control) Nonconforming (not within spec limits)
Brink of chaos Process is unpredictable (out of control) Conforming (within spec limits)
State of chaos Process is unpredictable (out of control) Nonconforming (not within spec limits)
Source: Adapted from Wheeler (2000)
DMAIC and DMADV – differences, similarities and synergies 203
Wheeler argues that most managers are ‘chaos managers’, constantly ‘saving’ the company by taking care of big customer problems in a process in the state of chaos and hence temporarily moving the process to the brink of chaos. While this is sometimes seen as ‘power of initiative’ and ‘taking care of business’, it is just a temporary solution since the process is still out of control. To improve this kind of process one should identify and remove the assignable causes of variation, which is something totally different from ‘saving’ the company over and over again by ‘fire fighting’.
On the other end of the scale, a process in an ideal state – since it is in control – is operating to its full potential. Furthermore, the output from the process always conforms to customer specifications. The word ‘always’ is of course impossible in the long run but we could translate it into Six Sigma language and say that we have a Six Sigma process, i.e., we are outside of specification limits less than 3.4 times per million opportunities. This kind of process, even though it may be the dream of every process owner, is rarely seen. Such a process does not need to be improved!
A little more common are processes that are in control but with lower sigma values, i.e., the outputs are not always within customer specification limits. These processes are in the threshold state. We have a predictable process that sometimes or most of the time performs well enough, but sometimes we need to correct things that went wrong. Even though the process is operating to its full potential, it is not good enough for the customer. Since this process is already operating to its full potential, it will need a major process upgrade.
A much more common state for a business process is on the brink of chaos, i.e., a process out of control but – mostly – with only minor customer problems. Why is it the most common state? As mentioned before, ‘chaos managers’ put chaos processes in this state by temporary solutions that will do for a while before the process shows its unpredictability by falling into chaos again. Sometimes processes stay on the brink of chaos a little longer, often when there is a ‘calculated loss’ in the process. This means that while the customer may be satisfied with the output, the company has to pay a lot for big losses before the output reaches the customer. For example, the on-time delivery of a process may be unpredictable but when the output is late the company may buy, borrow or ‘steal internally’ to be able to deliver to the customer on time. The calculated losses are normally called ‘margin slippage’, ‘margin erosion’, or ‘nonconformance cost’. In this case, there is a process that needs to be improved by identifying and removing assignable causes of variation.
It is the purpose of process improvement to move any process up to the next better state; but if we are satisfied with the performance of a process it will – by outside or inside influences – eventually ‘erode’ down to the next worse state. Outside influences may be new laws, new competitors or changing customer requirements. Inside influences may be change of personnel or wear of equipment. That is what Wheeler calls an increase in process entropy. Hence, while it may be unnecessary to improve a process in the ideal state, eventually we will need to improve it once it has eroded down to the threshold state.
204 P. Cronemyr
10 Different approaches to process improvements
Wheeler suggests different approaches to improve a process depending on the state of the process. A process in chaos or on the brink of chaos, i.e., a process out of control, needs to be improved by identifying and removing assignable causes of variation. Sometimes ‘the process’ is unknown due to the recurring disturbances from assignable causes. In that case it may be better to design a new process altogether.
With a process in the threshold state, already operating up to its full potential, the only way to improve is to make a major process upgrade, also called to ‘reengineer the process’. A process in the ideal state – if such exists – does not need to be improved but it needs to be monitored.
11 Where DMAIC fits in the model
The purpose of DMAIC is to increase the sigma level by measuring the process, analysing data and removing the root causes. Anybody trained in the Six Sigma methodology DMAIC knows that this is ‘the only way’ to find the real previously unknown root causes. This is what Wheeler calls ‘to reengineer the process’. Hence it is obvious that DMAIC is to be used when improving a process in the threshold state. Unfortunately, and as discussed above, this is not the most common state.
12 Where DMADV fits in the model
When do we need to design a completely new process? The answer is when there is no process to improve. ‘No process’ does not fit anywhere in Wheeler’s model since he only discusses the four states of existing processes. Looking at the model, though, it is clear that processes in the chaos state are in a very poor condition. It may be better to design a new process than trying to improve the old process.
13 Where neither DMAIC nor DMADV fits in the model
So far three states out of four have been covered. The ideal state: Monitor. The threshold state: Use DMAIC. The chaos state: Use DMADV. What about the brink of chaos? Does DMAIC fit? According to Wheeler, since the process is out of control, it should be improved by identifying and removing assignable causes of variation. That is what needs to be done before using DMAIC. On the brink of chaos ‘the process’ is often hidden due to the recurring disturbances from assignable causes. Since the assignable causes are so frequent (but not always the same), it is hard work to look into each and every point outside the control limits. Instead, it is easier and quicker to think about how the process should be, i.e., more to-be than as-is analysis.
Since this state is the most common for processes in need of improvement, it is also common to select this type of process when running Six Sigma projects with the DMAIC methodology. It can be quite confusing and frustrating for a Black Belt or a Green Belt to attend DMAIC training and then try to use the methodology in reality on a process where there is not much to measure and analyse.
DMAIC and DMADV – differences, similarities and synergies 205
Can we use DMADV instead? Yes, we can, but is it really necessary to throw away the old process and design a completely new one? Wheeler (2000, p.150) explains:
“Yes, you could [replace the old process with a new process] but it will cost less to find the assignable causes and remove their effects. […] If you can not operate your current process predictably, what makes you think that you can operate a new process predictably?”
There are often parts of the process that work well but the overall performance is not good. It would be better if we could use the good parts of the old process and join them together with some new parts into an improved process that is not totally new. For that we cannot use DMADV as it is defined, but maybe we can with some modifications.
14 Introducing ‘DMADC’
When using DMAIC in processes on the brink of chaos, the major problem is that there is ‘nothing to measure’. Of course there is, but due to the disturbance from the assignable causes the performance of the undisturbed process is hard to see. On the other hand, we should not throw away the old process by using DMADV straight on. Maybe a combination of the two could work. We will call this new road map DMADC. Experiences from using DMAIC at Siemens Power Generation in Sweden to improve out-of-control processes, i.e., processes on the brink of chaos, show that the major obstacle is that – even though the problems from assignable causes can be measured – the undisturbed process performance cannot be measured. This makes it difficult to perform all tasks according to the road map in the Measure and Analyse phases. Instead, the Six Sigma team focuses more on what the customers expect from the process, which is more similar to the Measure and Analyse phases of DMADV (even though the team may not be trained in DMADV and may not be aware of that methodology). Since there are limited data in this type of project, it is common to take the ‘process door’ (detailed process analysis, cause and effects analysis, five whys, verification of causes) in the Analyse phase. Normally, in DMAIC training, the emphasis is put on the ‘data door’, which is built around tools as regression analysis and several types of hypothesis testing. We have limited use for these here.
Once in the Improve phase, the team starts to design a new process, consisting of old (good) components and newly designed components. Some of the activities are similar to those of the Analyse and Design phases of DMADV. When the best concept has been designed, by use of the Pugh concept evolution and selection matrix (Pugh, 1991), it is the task of the team to make the new process sustainable. For that purpose an FMEA is conducted. This is one of the most important steps of the project. The new process would be even better, i.e., more insensitive to noise and disturbances, if some of the tools of the Robust Design Methodology in DMADV were used, e.g., the p-diagram (Phadke, 1989) to identify noise factors. This is seldom done.
When it is time for pilot testing of the process, it is rather straightforward to use the rest of the tools in Improve and Control of DMAIC. There are basically two outputs from the project delivered to the process owner: an improved/new process and a measurement system making it possible to control the process. Hence, when the project is completed, we should be at least in the threshold state or, even better, in the ideal state.
The road map described above, from now on called DMADC, is summarised in Table 4, using the blocks defined in Figure 1.
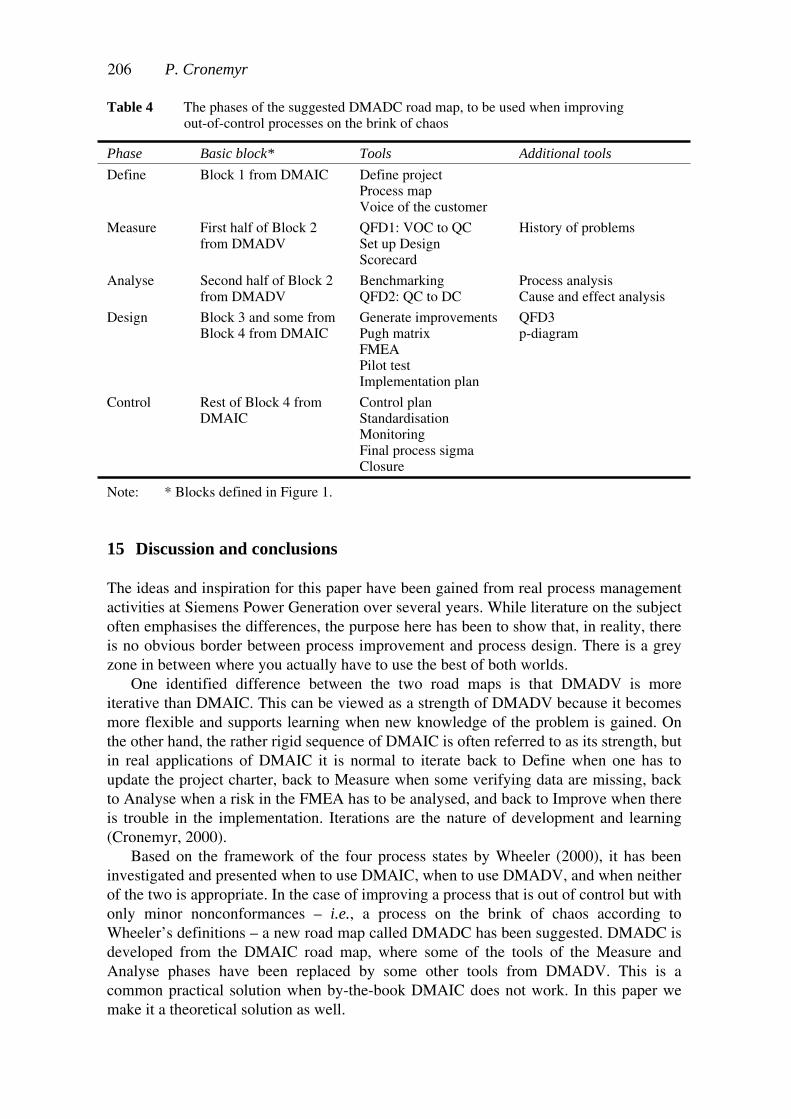
206 P. Cronemyr
Table 4 The phases of the suggested DMADC road map, to be used when improvingout-of-control processes on the brink of chaos
Phase Basic block* Tools Additional tools
Define Block 1 from DMAIC Define project Process map Voice of the customer
Measure First half of Block 2 from DMADV
QFD1: VOC to QC Set up Design Scorecard
History of problems
Analyse Second half of Block 2 from DMADV
BenchmarkingQFD2: QC to DC
Process analysis Cause and effect analysis
Design Block 3 and some from Block 4 from DMAIC
Generate improvements Pugh matrix FMEA Pilot test Implementation plan
QFD3p-diagram
Control Rest of Block 4 from DMAIC
Control plan StandardisationMonitoringFinal process sigma Closure
Note: * Blocks defined in Figure 1.
15 Discussion and conclusions
The ideas and inspiration for this paper have been gained from real process management activities at Siemens Power Generation over several years. While literature on the subject often emphasises the differences, the purpose here has been to show that, in reality, there is no obvious border between process improvement and process design. There is a grey zone in between where you actually have to use the best of both worlds.
One identified difference between the two road maps is that DMADV is more iterative than DMAIC. This can be viewed as a strength of DMADV because it becomes more flexible and supports learning when new knowledge of the problem is gained. On the other hand, the rather rigid sequence of DMAIC is often referred to as its strength, but in real applications of DMAIC it is normal to iterate back to Define when one has to update the project charter, back to Measure when some verifying data are missing, back to Analyse when a risk in the FMEA has to be analysed, and back to Improve when there is trouble in the implementation. Iterations are the nature of development and learning (Cronemyr, 2000).
Based on the framework of the four process states by Wheeler (2000), it has been investigated and presented when to use DMAIC, when to use DMADV, and when neither of the two is appropriate. In the case of improving a process that is out of control but with only minor nonconformances – i.e., a process on the brink of chaos according to Wheeler’s definitions – a new road map called DMADC has been suggested. DMADC is developed from the DMAIC road map, where some of the tools of the Measure and Analyse phases have been replaced by some other tools from DMADV. This is a common practical solution when by-the-book DMAIC does not work. In this paper we make it a theoretical solution as well.
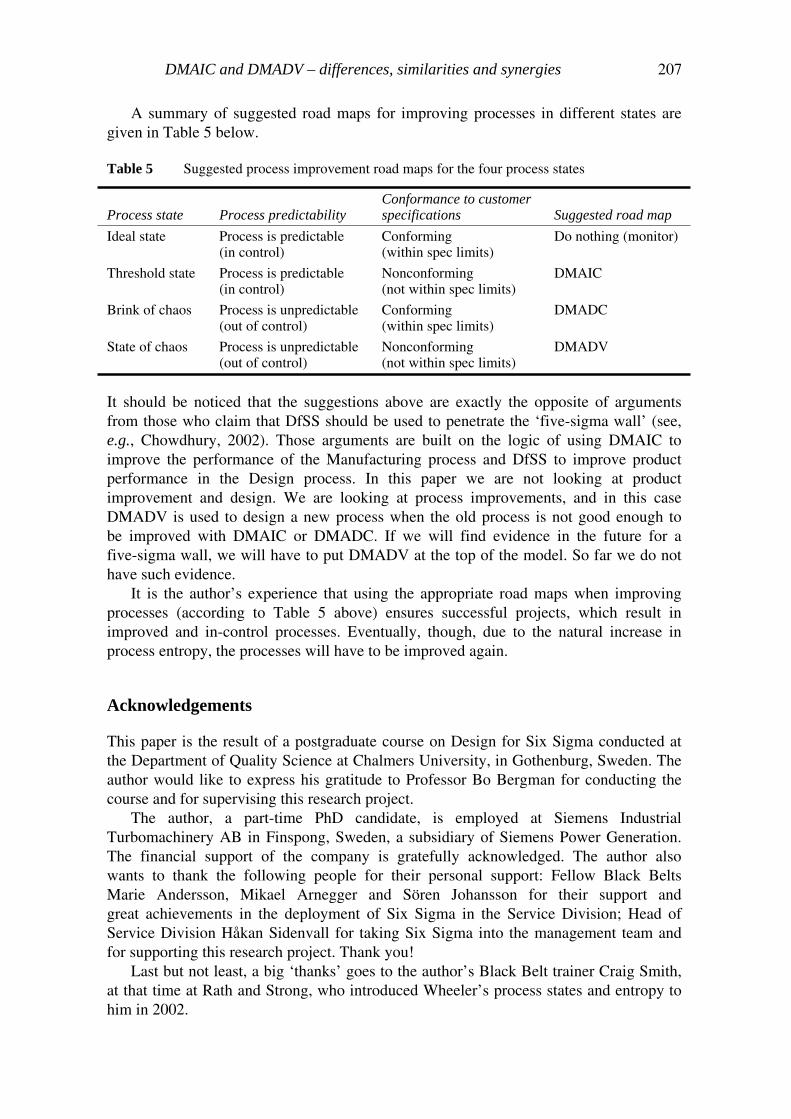
DMAIC and DMADV – differences, similarities and synergies 207
A summary of suggested road maps for improving processes in different states are given in Table 5 below.
Table 5 Suggested process improvement road maps for the four process states
Process state Process predictability Conformance to customer specifications Suggested road map
Ideal state Process is predictable (in control)
Conforming(within spec limits)
Do nothing (monitor)
Threshold state Process is predictable (in control)
Nonconforming(not within spec limits)
DMAIC
Brink of chaos Process is unpredictable (out of control)
Conforming(within spec limits)
DMADC
State of chaos Process is unpredictable (out of control)
Nonconforming(not within spec limits)
DMADV
It should be noticed that the suggestions above are exactly the opposite of arguments from those who claim that DfSS should be used to penetrate the ‘five-sigma wall’ (see, e.g., Chowdhury, 2002). Those arguments are built on the logic of using DMAIC to improve the performance of the Manufacturing process and DfSS to improve product performance in the Design process. In this paper we are not looking at product improvement and design. We are looking at process improvements, and in this case DMADV is used to design a new process when the old process is not good enough to be improved with DMAIC or DMADC. If we will find evidence in the future for a five-sigma wall, we will have to put DMADV at the top of the model. So far we do not have such evidence.
It is the author’s experience that using the appropriate road maps when improving processes (according to Table 5 above) ensures successful projects, which result in improved and in-control processes. Eventually, though, due to the natural increase in process entropy, the processes will have to be improved again.
Acknowledgements
This paper is the result of a postgraduate course on Design for Six Sigma conducted at the Department of Quality Science at Chalmers University, in Gothenburg, Sweden. The author would like to express his gratitude to Professor Bo Bergman for conducting the course and for supervising this research project.
The author, a part-time PhD candidate, is employed at Siemens Industrial Turbomachinery AB in Finspong, Sweden, a subsidiary of Siemens Power Generation. The financial support of the company is gratefully acknowledged. The author also wants to thank the following people for their personal support: Fellow Black Belts Marie Andersson, Mikael Arnegger and Sören Johansson for their support and great achievements in the deployment of Six Sigma in the Service Division; Head of Service Division Håkan Sidenvall for taking Six Sigma into the management team and for supporting this research project. Thank you!
Last but not least, a big ‘thanks’ goes to the author’s Black Belt trainer Craig Smith, at that time at Rath and Strong, who introduced Wheeler’s process states and entropy to him in 2002.

208 P. Cronemyr
References
Antony, J. and Banuelas, R. (2002) ‘Key ingredients for the effective implementation of Six Sigma programme’, Measuring Business Excellence, Vol. 6, pp.20–27.
Atwood, J. (2005) ‘Benchmarking. Using design for Six Sigma’, iSixSigma Magazine,July–August, Vol. 1, No. 4.
Bergman, B. (1992) Industriell försöksplanering och robust konstruktion (in Swedish. Translation: DOE & Robust Design), Studentlitteratur, Lund.
Bergman, B. and Gremyr, I. (2006) ‘Underlying themes of design for Six Sigma’, QualityManagement and Organisational Development International Conference, Liverpool, 9–11 August.
Bergman, B. and Klefsjö, B. (2002) Quality from Customer Needs to Customer Satisfaction,2nd ed., Studentlitteratur, Lund.
Berryman, M.L. (2002) ‘DFSS and big payoffs’, Six Sigma Forum Magazine, Vol. 2, No. 1, pp.23–28.
Chowdhury, S. (2002) Design for Six Sigma, London: Financial Times Prentice Hall.
Clausing, D. (1994) Total Quality Development. A Step by Step Guide to World-class Concurrent Engineering, New York: ASME Press.
Clausing, D., Cohen, L. and Phadke, M. (1999) ‘RCI – Requirements, Concepts, Improvements’, ENDREA Course on Systems Engineering, Linköping University.
Cohen, L. (1995) Quality Function Deployment, Reading, MA: Addison Wesley Longman.
Cronemyr, P. (2000) ‘Towards a learning organization for product development’, Licentiate thesis, Division of Quality Technology and Management, Department of Mechanical Engineering, Linköping University, Linköping, Sweden.
Goldstein, M.D. (2001) ‘Six Sigma programme success factors’, Six Sigma Forum Magazine,Vol. 1, pp.36–45.
Gremyr, I. (2003) ‘Design for Six Sigma – from the perspective of robust design methodology’, Quality Management and Organisational Development (QMOD 2003), Paris, France.
Henderson, K.M. and Evans, J.R. (2000) ‘Successful implementation of Six Sigma: benchmarking general electric company’, Benchmarking: An International Journal, Vol. 7, pp.260–281.
Lönnqvist, Å. (2006) ‘Design for Six Sigma roadmaps’, Quality Management and Organisational Development International Conference, Liverpool, 9–11 August.
Magnusson, K., Kroslid, D. and Bergman, B. (2003) Six Sigma. The Pragmatic Approach, 2nd ed., Studentlitteratur, Lund.
Pande, P.S., Neuman, R.P. and Cavanagh, R.R. (2000) The Six Sigma Way: How GE, Motorola and Other Top Companies are Honing their Performance, New York, NY: McGraw-Hill Professional.
Phadke, M. (1989) Quality Engineering Using Robust Design, Englewood Cliffs, NJ: Prentice Hall PTR.
Pugh, S. (1991) Total Design. Integrated Methods for Successful Product Engineering, New Jersey: Pearson Higher Education.
Rath and Strong (2002) Six Sigma Pocket Guide, Lexington, MA: Rath and Strong.
Sandholm, L. and Sörqvist, L. (2002) ‘12 requirements for Six Sigma success’, Six Sigma Forum Magazine, Vol. 2, pp.17–22.
Schön, K. (2006) ‘Implementing Six Sigma in a non-American culture’, Int. J. Six Sigma and Competitive Advantage, Vol. 2, No. 4, pp.404–428.
Shewhart, W.A. (1931) ‘Economic control of quality and manufactured product’, Republished ed., 50th Anniversary Commemorative Reissue by the American Society for Quality Control, Milwaukee.
Snee, R.D. and Hoerl, R.W. (2002) Leading Six Sigma: A Step-by-Step Guide Based on Experience with GE and Other Six Sigma Companies, Financial Times Prentice Hall.

DMAIC and DMADV – differences, similarities and synergies 209
Taguchi, G. (1986) Introduction to Quality Engineering – Designing Quality into Products and Processes, Tokyo: Asian Productivity Organization.
Treichler, D. and Carmichael, R. (2002) ‘Design for Six Sigma: 15 lessons learned’, QualityProgress, Vol. 35, No. 1, pp.33–42.
Watson, G.H. (2005) Design for Six Sigma. Innovation for Enhanced Competitiveness, Salem, NH: GOAL/QPC Publishing.
Wheeler, D. (2000) Understanding Variation – The Key to Managing Chaos, 2nd ed., Knoxville: SPC Press.

Appendix E Title Knowledge Overlapping
Seminars – KOS
Paper title Knowledge Overlapping Seminars – KOS. Design and Applications
Authors Peter Cronemyr and Christina Mauléon
Publication Submitted for publication (2007)

Knowledge Overlapping Seminars – KOS – Design and Applications. Cronemyr and Mauléon (2007)
E-1
Knowledge Overlapping Seminars – KOS Design and Applications
By
Peter Cronemyr*+ and Christina Mauléon* *Quality Sciences, Chalmers. +Siemens Industrial Turbomachinery AB, Finspong.
2007
Abstract
Misunderstandings often arise in organisational projects among people who do not share the same organisational context. C. I. Lewis argued for the importance of common concepts to avoid misunderstandings which inspired Shewhart and Deming to emphasise the need for operational definitions. Without these, misunderstandings arise. There is a need for a methodology that will assist in revealing hidden misunderstandings in communication among people who are talking and working together. The present study proposes a methodological ‘tool’ for this purpose, knowledge overlapping seminars, KOS, designed as a type of seminar in which the various members of a team have an opportunity to guide one another in different domains of knowledge. The design of KOS aims to avoid obstacles to effective overlap of knowledge domains that can arise in other types of meetings, with special emphasis on avoiding prestige. KOS has been shown to be especially suited to Six Sigma projects. KOS is a promising methodology for application in projects with a view to achieving common concepts, fewer misunderstandings, better quality, and, ultimately, more satisfied customers.
Contents
1. Introduction ........................................................................................................................2
2. Literature review and conceptual framework.....................................................................3 2.1. Overlap among knowledge domains .......................................................................................3 2.2. Facilitating knowledge overlap ...............................................................................................3 2.3. Knowledge overlapping seminars (KOS)................................................................................5
3. Applications of KOS ..........................................................................................................8 3.1. Research methodology ............................................................................................................8 3.2. Context of applications............................................................................................................8 3.3. Application of KOS in a product-development project...........................................................8 3.4. Application of KOS in a Six Sigma project ..........................................................................11
4. Discussion ........................................................................................................................17
5. Conclusions ......................................................................................................................18
6. References ........................................................................................................................19

Knowledge Overlapping Seminars – KOS – Design and Applications. Cronemyr and Mauléon (2007)
E-2
1. Introduction Misunderstandings in organisational projects often arise from simple mishaps in communication among people who do not share the same organisational context (Naess, 1968) and/or the specialised language of a particular knowledge domain (Argyris et. al., 1985; Naess, 1968). One of the main sources of inspiration for the founders of the quality movement was the conceptualistic pragmatist C. I. Lewis who argued for the importance of common concepts to avoid misunderstandings (Lewis, 1929). More than three quarters of a century later, the need for common concepts has not decreased. On the contrary, the purpose of modern quality management initiatives like e.g. Six Sigma and Design for Six Sigma is to find root causes to quality problems, such as failing to meet customer expectations on delivery and functionality of products and services. Even though these failures normally are defined in a technical manner, the underlying root causes can often be traced back to misunderstandings between people.
In the field of quality management, effective communication has been inhibited by the hazy and ambiguous concepts that characterise the discipline (Dean & Bowen, 1994; Giroux, 2006) and the fact that there is little consensus on the terminology and definitions used in the field (Reed et al., 1996). Although pioneers in quality management, such as Deming (1986, 1993), emphasised so-called ‘operational definitions’ in originating the quality movement, contemporary quality management seems to be increasingly in need of an agreed conceptual terminology to facilitate communication. Moreover, there is a corresponding need for more precision in the tools and methodologies of quality management, which are often based on measurements of process characteristics. As Kroslid has observed: “Over the last two decades there has been little development in the content of, and tools associated with, improvement methodologies within the field of quality management.” (Kroslid, 2004, p. 18)
It is thus apparent that there is a need for a methodology that will assist in revealing hidden misunderstandings in communication among people who are talking and working together in the field of quality management. The present study proposes a methodological ‘tool’ for this purpose. The development of the proposed methodology, which is known as ‘knowledge overlapping seminars’ (KOS), has been influenced by many research domains—including organisational science, knowledge management, process management, project management, product development, and organisational learning. All of these have addressed the problem of communication misunderstandings in various ways and to varying extents. The main purpose of KOS is thus to identify and eliminate misunderstandings in cross-functional teams of cooperating people within organisations. In addition to describing the theory and practice of KOS, the present study applies the proposed methodology in two different applications at a major company that develops and delivers gas turbines. The results suggest that KOS is an effective tool for creating common concepts and identifying misunderstandings in organisational projects.

Knowledge Overlapping Seminars – KOS – Design and Applications. Cronemyr and Mauléon (2007)
E-3
2. Literature review and conceptual framework
2.1. Overlap among knowledge domains
As a pioneer of the quality movement, Shewhart (Shewhart, 1939) drew upon the writings of Lewis (1929) in arguing for an appreciation of the importance of shared concepts in facilitating cooperation. In a similar vein, other authors have noted that a lack of common understanding of key concepts is a significant cause of misunderstanding (Naess, 1968; von Wright, 1957, 1971: Pålshaugen, 2001). Such misunderstanding in organisations can become a substantial problem when working together in projects. Mauléon et al. (2003) provided empirical evidence that unnoticed misunderstandings in projects can have significant adverse financial effects; moreover, these authors found that misunderstandings were often grounded in so called ‘taken-for-granted communication’, whereby people presumed that everyone else had the same understanding of certain key concepts in the projects being undertaken. In an attempt to address the problem, Mauléon et al. (2003) argued for an increased awareness of the different terminology used for common concepts within organisations; however they did not suggest a specific methodology for enhancing such awareness. The methodology of KOS proposed in the present study addresses this deficiency.
The statement ‘common concepts for common action’ was made by C.I. Lewis in 1929. The way Lewis explains the difference in definitions of concepts is that we as individuals have our unique personal ‘a priori’ which is built up by our personal idiosyncratic way of interpreting and understanding experience. In the contemporary management literature, the plethora of mental models, schemata, and paradigms (Senge, 1990; Hellgren & Löwstedt, 1997, 2001) reflects the reality that different people have their distinctive interpretations of experience (Lewis, 1929; Hellgren & Löwstedt, 1997). Language, as an expression of these varying interpretations, has a most significant role in reaching a common meaning and understanding of experience, and thus facilitating cooperation. However, actions and words take on particular meanings within a given community of practice, and the competence required for understanding these meanings is acquired with membership of the actual community (Argyris et al., 1985). This means that what a person means to communicate in one community can be perceived in a completely different way in another community. In these circumstances, misunderstandings and misconceptions can arise without the person being aware of the fact.
Such misunderstandings are relatively infrequent among people in a confined group because their use of language is well understood and determined within the group’s knowledge domain (Naess, 1968). However, in most projects, the variety of tasks and goals involved mean that a mix of people from different knowledge domains are often represented, and this is one of the main causes of misunderstandings arising in projects.
2.2. Facilitating knowledge overlap
Davenport and Prusak (1998) examine the work by Allen (1977) and Nonaka (1994) and conclude: “Giving people who work together at the same location opportunities to talk to one another does not by itself solve the problem of transferring knowledge [...] We also need to consider more formal and intentional ways of sharing knowledge within organizations”
Knowledge Overlapping Seminars – KOS – Design and Applications. Cronemyr and Mauléon (2007)
E-4
(Davenport and Prusak, 1998, p.95). As we can see, Davenport and Prusak define ‘to transfer knowledge’ as ‘to share knowledge within organisations’. We use the term ‘knowledge overlapping’ in the meaning of creating a ‘shared language’ between knowledge domains, i.e. ‘common concepts’ which make it possible to discover previously unknown misunderstandings.
But what prevents knowledge overlapping in ‘ordinary’ meetings and seminars? Allen (1977) identifies prestige as the major obstacle. “An engineer’s prestige among his colleagues is founded to a great degree upon an almost mystical characteristic called ‘technical competence’. To admit a lack of technical competence, especially in an area central to the engineer’s technological specialty, is to pay a terrible price in terms of lost prestige.” (Allen, 1977, p.193). This could suggest that for a method to be successful in facilitating knowledge overlapping the design of the method needs to consider prestige as a possible obstacle.
The notion of common concepts was, as stated earlier, developed into operational definitions by Shewhart in the thirties. Operational definitions are later on described by Deming (1986) as something people can agree on. It puts communicable meaning into a concept. Misunderstandings is according to Deming often the result of failure to describe beforehand and in meaningful terms, the specifications of a common concept. Thus the challenge organisations face is that we most of the time are not aware of the possibility that we put different meanings into concepts, that we define them differently (Naess, 1968) and as a result behave and react differently (Lewis, 1929). What is needed is an increased awareness and understanding of this phenomenon and one way to achieve this is to stimulate self-reflection (Lewis, 1929) amongst the employees of the organisation and to strife for an understanding of the necessity of a collective mind (Weick and Roberts, 1993) which we here argue can be supported by KOS.
Although it is not feasible to create common concepts in all situations in any organisation, it is possible to create an awareness among organisational members that they are prone to interpret experiences differently and that they therefore have a tendency to put different meanings on what they presume are common concepts—with the consequence that they respond differently to shared experiences and create misunderstandings in projects (Mauléon et al. 2003).
As a means of facilitating overlap among knowledge domains and thus creating common concepts within an organisation, Allen (1977) and Nonaka (1994) both argued for the strategic rotation of personnel among various departments. However, the disadvantages of this approach are that it takes time and that too much rotation can prevent people becoming skilled in particular tasks. It is apparent that there is a need for an approach that facilitates prompt overlap of knowledge among project team members from different knowledge domains while avoiding frequent redefinitions of their tasks. The present study proposes a meeting or seminar in which the various members of a team have an opportunity to guide one another in different domains of knowledge. The aim is for team members to learn enough about other knowledge domains and thus to recognise when their own actions are creating (or might create) problems in other areas. In this regard, Allen (1977, p. 200) has suggested that managers should organise seminars that include people from various functional areas and that these seminars should be “… organized around topics so that all participants … appear as equals”.
Knowledge Overlapping Seminars – KOS – Design and Applications. Cronemyr and Mauléon (2007)
E-5
2.3. Knowledge overlapping seminars (KOS)
2.3.1. Objectives of KOS
In view of the above discussion, the technique of ‘knowledge overlapping seminars’ (KOS) (Cronemyr, 2000) is proposed as a useful methodology for facilitating overlap among knowledge domains.
KOS has three objectives: (i) to stimulate people within a project team to talk about domain-specific knowledge with a view to identifying how their own domain knowledge is related to the tasks of the whole team; (ii) to enable team members to learn something about the concepts used in other knowledge domains; and (iii) to enhance awareness of differences in the definitions of common concepts within the organisation.
2.3.2. Design of KOS
The design of KOS aims to avoid obstacles to effective overlap of knowledge domains that can arise in other types of meetings.
The following people are involved:
• a guide;
• a facilitator; and
• participants.
The guide talks about his or her domain-specific knowledge in relation to the project goal. It is important that the guide is the only person present from his or her domain because this ensures that: (i) the discussion does not include technical domain-specific details that are beyond the comprehension or interest of the participants; and (ii) the guide does not have to justify his or her description of the job to a person within the same domain who might have different views (thus avoiding issues of intra-domain ‘prestige’).
The role of the facilitator is to provide direction and assistance to the seminar by asking apparently simplistic questions (such as: ‘Why is this done?’) rather than functional/technical questions (such as: ‘What is the best way to do it?’ or ‘Who should do it?’). The facilitator thus steers the conversation towards ‘why’ questions and ensures that all participants understand what the guide is describing. If the facilitator senses that participants do not understand what is being said, he or she can assist by asking the guide to repeat or clarify what has been said. The facilitator should be trained in conducting KOS. He or she can be an internal or external consultant, but should not be a manager of the guide or the participants.
The participants should all be from the same knowledge domain so they can relate to each other’s questions through a shared language and common concepts; however, their shared knowledge domain must be different from that of the guide (as noted above). Although they are from different domains, the guide and the participants should have previous experience of working together and should share a current task related to a common project goal. This
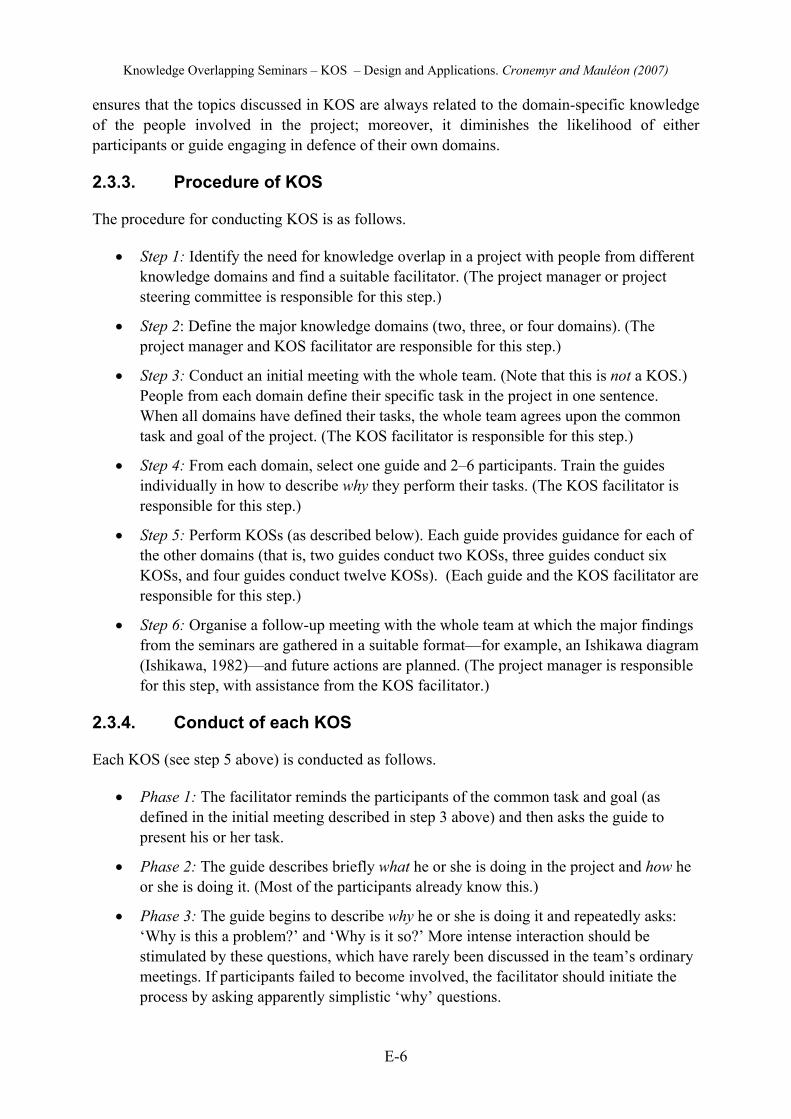
Knowledge Overlapping Seminars – KOS – Design and Applications. Cronemyr and Mauléon (2007)
E-6
ensures that the topics discussed in KOS are always related to the domain-specific knowledge of the people involved in the project; moreover, it diminishes the likelihood of either participants or guide engaging in defence of their own domains.
2.3.3. Procedure of KOS
The procedure for conducting KOS is as follows.
• Step 1: Identify the need for knowledge overlap in a project with people from different knowledge domains and find a suitable facilitator. (The project manager or project steering committee is responsible for this step.)
• Step 2: Define the major knowledge domains (two, three, or four domains). (The project manager and KOS facilitator are responsible for this step.)
• Step 3: Conduct an initial meeting with the whole team. (Note that this is not a KOS.) People from each domain define their specific task in the project in one sentence. When all domains have defined their tasks, the whole team agrees upon the common task and goal of the project. (The KOS facilitator is responsible for this step.)
• Step 4: From each domain, select one guide and 2–6 participants. Train the guides individually in how to describe why they perform their tasks. (The KOS facilitator is responsible for this step.)
• Step 5: Perform KOSs (as described below). Each guide provides guidance for each of the other domains (that is, two guides conduct two KOSs, three guides conduct six KOSs, and four guides conduct twelve KOSs). (Each guide and the KOS facilitator are responsible for this step.)
• Step 6: Organise a follow-up meeting with the whole team at which the major findings from the seminars are gathered in a suitable format—for example, an Ishikawa diagram (Ishikawa, 1982)—and future actions are planned. (The project manager is responsible for this step, with assistance from the KOS facilitator.)
2.3.4. Conduct of each KOS
Each KOS (see step 5 above) is conducted as follows.
• Phase 1: The facilitator reminds the participants of the common task and goal (as defined in the initial meeting described in step 3 above) and then asks the guide to present his or her task.
• Phase 2: The guide describes briefly what he or she is doing in the project and how he or she is doing it. (Most of the participants already know this.)
• Phase 3: The guide begins to describe why he or she is doing it and repeatedly asks: ‘Why is this a problem?’ and ‘Why is it so?’ More intense interaction should be stimulated by these questions, which have rarely been discussed in the team’s ordinary meetings. If participants failed to become involved, the facilitator should initiate the process by asking apparently simplistic ‘why’ questions.

Knowledge Overlapping Seminars – KOS – Design and Applications. Cronemyr and Mauléon (2007)
E-7
• Phase 4: The seminar should then evolve in accordance with the questions and comments of the participants. There might be questions about matters that the guide considers to be self-evident, but these questions should be dealt with on their merits to encourage awareness among participants that it is safe in a KOS to ask such simplistic questions; indeed, this might be the participants’ first opportunity to ask these questions in a non-judgmental environment.
• Phase 5: Some misunderstandings might be identified in the course of the seminar. It is important that the facilitator prevents any suggestions of blame or judgment. The goal should be to identify misunderstandings and eliminate them—not apportion blame for their occurrence. Possible actions from these findings should be discussed in the final feedback meeting (see step 6 above).
• Phase 6: The seminar should last no more than 3–4 hours (including a refreshment break). These seminars can be quite challenging because most people are not accustomed to this form of analytical reasoning.

Knowledge Overlapping Seminars – KOS – Design and Applications. Cronemyr and Mauléon (2007)
E-8
3. Applications of KOS
3.1. Research methodology
The conceptual framework of KOS presented above, and the applications of the technique described below, were developed in accordance with the methodology of ‘collaborative action inquiry’ (Lewin, 1946; Westlander 1999). According to this methodology, the researcher has a close identification with the activities and direction of change of the object being studied. In this case, the first author of the present paper has been employed by the company under investigation for eleven years and has actively influenced the changes that have taken place in the organisation. The second author has conducted research on the origins of the quality movement and especially the influences from the philosophy of the conceptualist pragmatist C.I. Lewis where the original ideas concerning common concepts for common action was identified. The combined experiences of the two authors made it possible to draw conclusions and to realise the findings of this paper.
Evaluation of the technique of KOS (as outlined above) was conducted in two applications (a product-development project and a Six Sigma project) using: (i) questionnaires; and (ii) semi-structured interviews.
With respect to the questionnaires, all participants answered questions immediately before the KOS, immediately after the KOS, and (in the first application) approximately one month after the KOS. Because the number of surveyed participants was necessarily limited, the analysis was mainly qualitative.
In addition, semi-structured individual interviews were conducted with all participants one month after the KOS. Each interview lasted for one hour. The interviews in the first application (the product-development project) were documented in handwritten notes by the researcher, whereas the interviews in the second application (the Six Sigma project) were audio-recorded and transcribed. All data were then coded, grouped, and compared.
3.2. Context of applications
Siemens Industrial Turbomachinery AB in Finspong (Sweden), which employs approximately 2200 people belongs to the Siemens Group, which has approximately 460,000 employees in 190 countries. The Finspong company develops, sells, manufactures, and maintains turbines—which involves several highly specialised knowledge domains. These domains come together in different settings, including product development and process development. Since 2001 the firm has utilised the Six Sigma method for process development and improvement.
3.3. Application of KOS in a product-development project
3.3.1. Setting of first application
Most engineering activities within large organisations are conducted within traditional engineering disciplines that have developed their own language on the basis of domain-
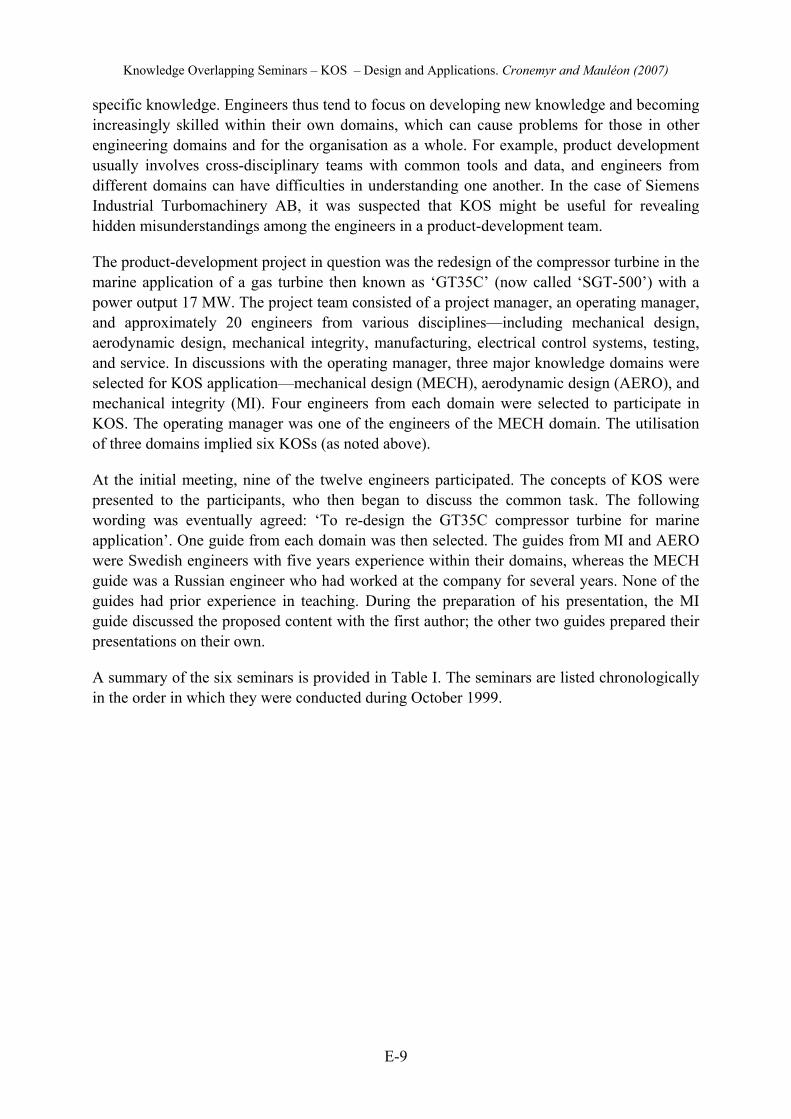
Knowledge Overlapping Seminars – KOS – Design and Applications. Cronemyr and Mauléon (2007)
E-9
specific knowledge. Engineers thus tend to focus on developing new knowledge and becoming increasingly skilled within their own domains, which can cause problems for those in other engineering domains and for the organisation as a whole. For example, product development usually involves cross-disciplinary teams with common tools and data, and engineers from different domains can have difficulties in understanding one another. In the case of Siemens Industrial Turbomachinery AB, it was suspected that KOS might be useful for revealing hidden misunderstandings among the engineers in a product-development team.
The product-development project in question was the redesign of the compressor turbine in the marine application of a gas turbine then known as ‘GT35C’ (now called ‘SGT-500’) with a power output 17 MW. The project team consisted of a project manager, an operating manager, and approximately 20 engineers from various disciplines—including mechanical design, aerodynamic design, mechanical integrity, manufacturing, electrical control systems, testing, and service. In discussions with the operating manager, three major knowledge domains were selected for KOS application—mechanical design (MECH), aerodynamic design (AERO), and mechanical integrity (MI). Four engineers from each domain were selected to participate in KOS. The operating manager was one of the engineers of the MECH domain. The utilisation of three domains implied six KOSs (as noted above).
At the initial meeting, nine of the twelve engineers participated. The concepts of KOS were presented to the participants, who then began to discuss the common task. The following wording was eventually agreed: ‘To re-design the GT35C compressor turbine for marine application’. One guide from each domain was then selected. The guides from MI and AERO were Swedish engineers with five years experience within their domains, whereas the MECH guide was a Russian engineer who had worked at the company for several years. None of the guides had prior experience in teaching. During the preparation of his presentation, the MI guide discussed the proposed content with the first author; the other two guides prepared their presentations on their own.
A summary of the six seminars is provided in Table I. The seminars are listed chronologically in the order in which they were conducted during October 1999.

Knowledge Overlapping Seminars – KOS – Design and Applications. Cronemyr and Mauléon (2007)
E-10
Table I. Summary of six KOSs in a gas turbine development project (Cronemyr, 2000)
KOS Guide Participants Topics Major Results Rating by participants
MECH > M.I.
From the Mechanical Design domain
Four from the Mechanical Integrity domain
Specifications; Displacements; Tolerances; Mass of components ‘in reality’ vs. ‘in the drawing’;
Awareness of how ‘nominal’ analysis models differ from manufactured components with tolerances.
Directly after: mostly very positive. After one month: most thought it was not deep enough (too superficial).
AERO > MECH
From the Aerodynamic Design domain
Three from the Mechanical Design domain
Transients; Cooling/sealing; Boundary layers; CFD; LES; Euler and potential theory; Compressors vs. turbines.
A major misunderstanding about guide vanes became obvious. Resulted in immediate actions.
The mechanical engineers did not mind listening to the equations of thermodynamics even though it was very deep.
AERO > M.I.
From the Aerodynamic Design domain
Four from the Mechanical Integrity domain
Transients; Cooling/sealing; Boundary layers; Quality of alpha calculations; Compressors vs. turbines
Awareness of uncertainties in boundary layers and heat transfer coefficients (alpha), used in stress calculations.
Directly after: some thought it was too deep. After one month: most were more positive. This seminar was more profound.
M.I. > AERO
From the Mechanical Integrity domain
Three from the Aerodynamic Design domain
LCF; HCF; Creep; Material models; Stress concentrations; Plasticity; Fracture mechanics; Fatigue; Haigh; Campbell; Neuber
An understanding of crack, strain, high and low cycle fatigue, and blade dynamics. The complexity in material data was thoroughly explained.
Very well structured. Comments: “Why have we not done this before?”, and “It can only become better if we use this way of working”.
M.I. > MECH
From the Mechanical Integrity domain
Four from the Mechanical Design domain
LCF; HCF; Creep; Stress concentrations; Plasticity; Fracture mechanics; Fatigue; Haigh; Campbell; Neuber
A discussion about crack initialisation and how the team should arrange inspections of blades.
First uninspired pupils but then the atmosphere improved. “Now I know that computers do not do the job on their own”
MECH > AERO
From the Mechanical Design domain
Four from the Aerodynamic Design domain
Specifications; Axial/radial displacements; Cold/warm geometry; Sealing edge thickness; Airfoil position
The seminar was very successful. New insights on cold/warm geometry and bearings/fittings.
“It is extremely useful to talk to people and discover the necessary things you thought you knew but obviously did not”.
3.3.2. Major results
The participants became aware of several misunderstandings that had been unrecognised before KOS was conducted. In particular, one major misunderstanding was revealed before it

Knowledge Overlapping Seminars – KOS – Design and Applications. Cronemyr and Mauléon (2007)
E-11
could become a major (and expensive) problem later in the project—perhaps when hardware had been manufactured and tested or, even worse, perhaps during the customer’s operation of the machine. Compared with the potential costs of this major misunderstanding, the cost in terms of man-hours spent on KOS was negligible.
Analysis of the responses to questionnaires before and directly after KOS revealed that 45% of the participants described their knowledge of the other domain as ‘deeper’ after KOS than before. Moreover, 69% of the participants said that they had ‘increased’ their breadth of knowledge. Taken together, 86% of the participants had gained new knowledge and/or deepened their knowledge about other domains. A typical comment was: “I thought I had deep knowledge about the other domain. Now I know that it was superficial.”
Directly after KOS, all participants felt that the knowledge gained at these KOSs would be of benefit to them in their work. Almost half (45%) were ‘sure’ of this opinion. One month after KOS, the proportion who were ‘sure’ had increased to 64%.
Semi-structured interviews were carried out approximately one month after the six seminars. Each person was interviewed for approximately half an hour. After the interviews, similar answers were grouped together. The most common opinions were as follows.
• The formulation of the common task in the initial meeting had improved the integration of the team. This was further improved by the six seminars.
• The opportunity to ask questions was appreciated. Questions were not asked in ordinary meetings because: (i) there was no time; (ii) there was a reluctance to ask questions that might be perceived as simplistic; and (iii) people did not know what to ask. In KOS, these obstacles were not present.
3.4. Application of KOS in a Six Sigma project
3.4.1. Setting of second application
The process-improvement methodology known as ‘Six Sigma’ was introduced by Motorola in the 1980s and made famous as a result of its utilisation by General Electric in the 1990s. Since then it has spread widely, and it is now used by many companies around the world. Six Sigma is a structured way of solving problems in an existing process by analysing real process data (that is, facts). It is often referred to as ‘DMAIC’, which is an acronym for the successive phases of the Six Sigma process—‘define, measure, analyse, improve, and control’.
Various statistical tools are used in the ‘analyse’ phase (so-called ‘data door’ analysis) to find the root causes of poor process performance. If problems are identified but there are insufficient data for analysis, an alternative approach called the ‘process door’ is adopted. In the first step of this ‘process door’ approach, members of the Six Sigma team from different parts of the organisation meet to discuss the process and to create a detailed process map. The purpose is to identify weak points in the process leading to delays, scrap, and rework. This method can be quite slow and it sometimes difficult to achieve a common view of the process
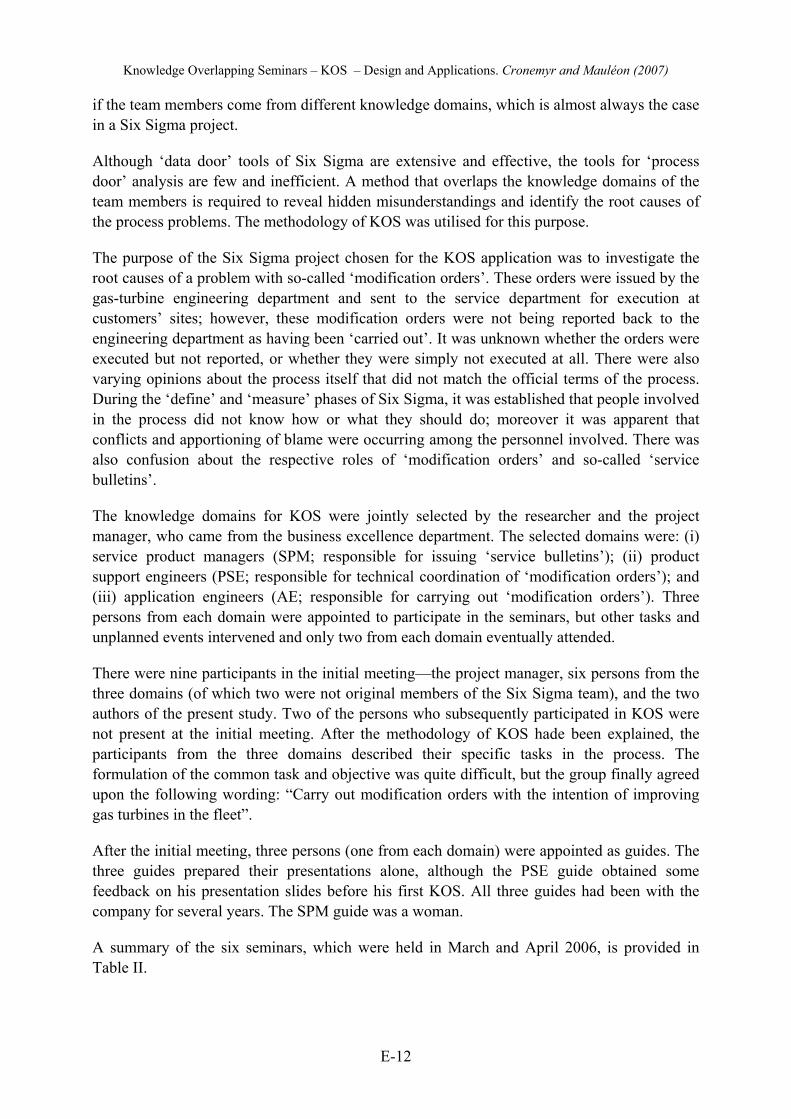
Knowledge Overlapping Seminars – KOS – Design and Applications. Cronemyr and Mauléon (2007)
E-12
if the team members come from different knowledge domains, which is almost always the case in a Six Sigma project.
Although ‘data door’ tools of Six Sigma are extensive and effective, the tools for ‘process door’ analysis are few and inefficient. A method that overlaps the knowledge domains of the team members is required to reveal hidden misunderstandings and identify the root causes of the process problems. The methodology of KOS was utilised for this purpose.
The purpose of the Six Sigma project chosen for the KOS application was to investigate the root causes of a problem with so-called ‘modification orders’. These orders were issued by the gas-turbine engineering department and sent to the service department for execution at customers’ sites; however, these modification orders were not being reported back to the engineering department as having been ‘carried out’. It was unknown whether the orders were executed but not reported, or whether they were simply not executed at all. There were also varying opinions about the process itself that did not match the official terms of the process. During the ‘define’ and ‘measure’ phases of Six Sigma, it was established that people involved in the process did not know how or what they should do; moreover it was apparent that conflicts and apportioning of blame were occurring among the personnel involved. There was also confusion about the respective roles of ‘modification orders’ and so-called ‘service bulletins’.
The knowledge domains for KOS were jointly selected by the researcher and the project manager, who came from the business excellence department. The selected domains were: (i) service product managers (SPM; responsible for issuing ‘service bulletins’); (ii) product support engineers (PSE; responsible for technical coordination of ‘modification orders’); and (iii) application engineers (AE; responsible for carrying out ‘modification orders’). Three persons from each domain were appointed to participate in the seminars, but other tasks and unplanned events intervened and only two from each domain eventually attended.
There were nine participants in the initial meeting—the project manager, six persons from the three domains (of which two were not original members of the Six Sigma team), and the two authors of the present study. Two of the persons who subsequently participated in KOS were not present at the initial meeting. After the methodology of KOS hade been explained, the participants from the three domains described their specific tasks in the process. The formulation of the common task and objective was quite difficult, but the group finally agreed upon the following wording: “Carry out modification orders with the intention of improving gas turbines in the fleet”.
After the initial meeting, three persons (one from each domain) were appointed as guides. The three guides prepared their presentations alone, although the PSE guide obtained some feedback on his presentation slides before his first KOS. All three guides had been with the company for several years. The SPM guide was a woman.
A summary of the six seminars, which were held in March and April 2006, is provided in Table II.

Knowledge Overlapping Seminars – KOS – Design and Applications. Cronemyr and Mauléon (2007)
E-13
Table II. Summary of six KOSs in a Six Sigma project (Table continues on next page)
KOS Guide Participants Topics Major Results Rating by participants
SPM > PSE From the Service Product Manager domain
Two from the Product Support Engineer domain and the Black Belt
MO process; Generic faults > Service bulletins; Specific faults > MO; Maintenance programs; Pricing philosophy; Databases
Awareness of the different processes for MO and Service Bulletins; Problems with pricing.
The guide was very dissatisfied with one participant who took over the guide role (see comment below). The participants somewhat satisfied.
PSE > SPM From the Product Support Engineer domain
Two from the Service Product Manager domain and the Black Belt
MO process; Product performance targets; Maintenance programs; MO admin.; MO status; Design reviews
Awareness of the need for MO coordination; Service bulletins are not followed up
Even though one participant was not present at the start-up meeting the participants were satisfied with the good discussions which gave new knowledge.
SPM > AE From the Service Product Manager domain
Two from the Application Engineer domain and the Black Belt
MO is a service product; Fault reports; Change control board; Databases; Meetings of SPM and AE; Pricing of service bulletins
MO may be introduced before Service Bulletin is available; Relations between databases; Poor quality of MO:s; Managers do not know MO process; Lack of coordination; Why not only use service bulletins?; Who pays for unconditional MO:s?
Very good rating and very good discussions. The facilitator did not need to steer the discussion. Participants became aware of several misunderstandings.
PSE > AE From the Product Support Engineer domain
Two from the Application Engineer domain and the Black Belt
Product performance targets; Databases; Coordination of MO executions; Analyses of executed MO:s; Change control board; Reporting of executed MO:s; Product Support: “Things that got lost”;
AE did not know they should involve PSE when they contacted Gas Turbine Engineering; The two different processes for MO/SB were identified; Material registrations in PLM “Pulse” and ERP “R3” systems not connected;
Even though the guide did not use his own slides this KOS got the highest rating of all. The AE realised that they could get more help from PSE and that PSE needed the feedback on MO:s from AE.
AE > SPM From the Application Engineer domain
Two from the Service Product Manager domain and the Black Belt
What I do with MO:s; Selling or giving away MO:s; Technical requests; Relations between AE, SPM, and Field Service
What is the cost of developing an MO?; Not everything is reported back from site; AE did not get any messages on new service bulletins (wrong address or do not know what to do)
Lowest rating of KOS. SPM participants did not think they got a lot of new knowledge even though they realised that AE did not know what to do with service bulletins that SPM produce.
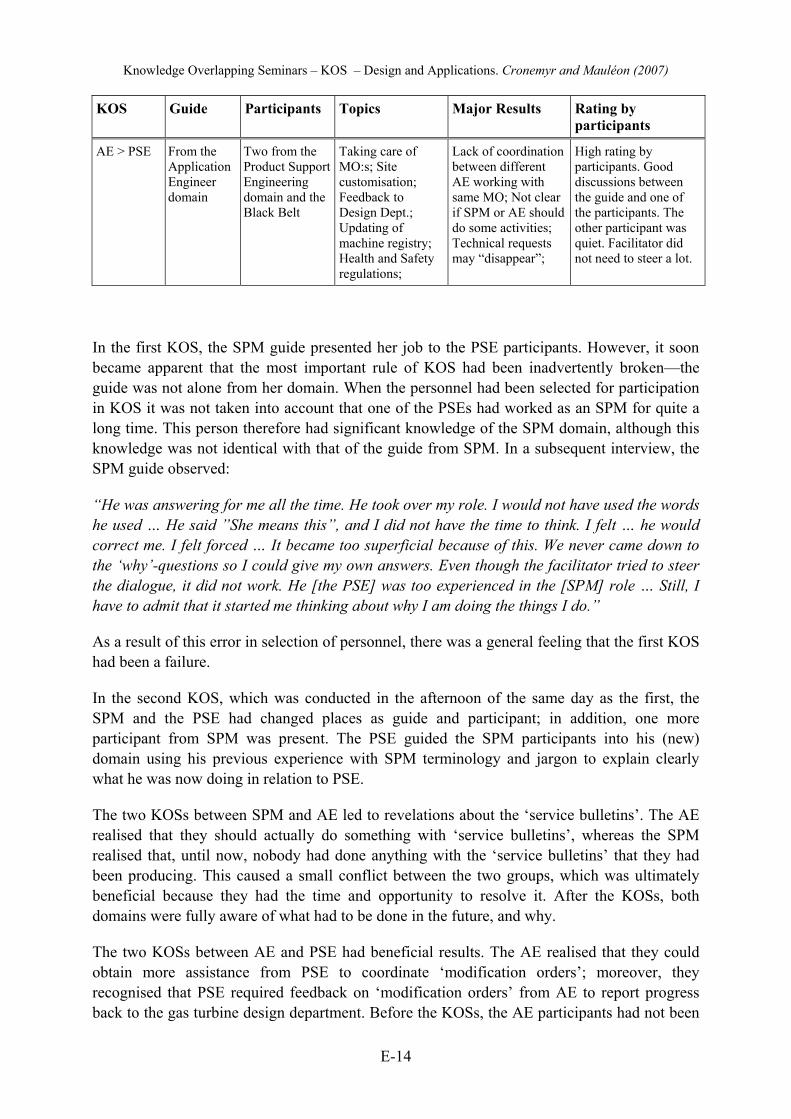
Knowledge Overlapping Seminars – KOS – Design and Applications. Cronemyr and Mauléon (2007)
E-14
KOS Guide Participants Topics Major Results Rating by participants
AE > PSE From the Application Engineer domain
Two from the Product Support Engineering domain and the Black Belt
Taking care of MO:s; Site customisation; Feedback to Design Dept.; Updating of machine registry; Health and Safety regulations;
Lack of coordination between different AE working with same MO; Not clear if SPM or AE should do some activities; Technical requests may “disappear”;
High rating by participants. Good discussions between the guide and one of the participants. The other participant was quiet. Facilitator did not need to steer a lot.
In the first KOS, the SPM guide presented her job to the PSE participants. However, it soon became apparent that the most important rule of KOS had been inadvertently broken—the guide was not alone from her domain. When the personnel had been selected for participation in KOS it was not taken into account that one of the PSEs had worked as an SPM for quite a long time. This person therefore had significant knowledge of the SPM domain, although this knowledge was not identical with that of the guide from SPM. In a subsequent interview, the SPM guide observed:
“He was answering for me all the time. He took over my role. I would not have used the words he used … He said ”She means this”, and I did not have the time to think. I felt … he would correct me. I felt forced … It became too superficial because of this. We never came down to the ‘why’-questions so I could give my own answers. Even though the facilitator tried to steer the dialogue, it did not work. He [the PSE] was too experienced in the [SPM] role … Still, I have to admit that it started me thinking about why I am doing the things I do.”
As a result of this error in selection of personnel, there was a general feeling that the first KOS had been a failure.
In the second KOS, which was conducted in the afternoon of the same day as the first, the SPM and the PSE had changed places as guide and participant; in addition, one more participant from SPM was present. The PSE guided the SPM participants into his (new) domain using his previous experience with SPM terminology and jargon to explain clearly what he was now doing in relation to PSE.
The two KOSs between SPM and AE led to revelations about the ‘service bulletins’. The AE realised that they should actually do something with ‘service bulletins’, whereas the SPM realised that, until now, nobody had done anything with the ‘service bulletins’ that they had been producing. This caused a small conflict between the two groups, which was ultimately beneficial because they had the time and opportunity to resolve it. After the KOSs, both domains were fully aware of what had to be done in the future, and why.
The two KOSs between AE and PSE had beneficial results. The AE realised that they could obtain more assistance from PSE to coordinate ‘modification orders’; moreover, they recognised that PSE required feedback on ‘modification orders’ from AE to report progress back to the gas turbine design department. Before the KOSs, the AE participants had not been

Knowledge Overlapping Seminars – KOS – Design and Applications. Cronemyr and Mauléon (2007)
E-15
aware of the role of PSE and had spoken directly with the gas turbine design department. In subsequent interviews this was explained as being due to the fact that the PSE department had existed for “less than a year”.
3.4.2. Major results
The root causes known before the six KOSs were gathered in a cause-and-effect diagram. It consisted of 12 small branches. After the seminars, the Six Sigma team gathered again and extended the cause-and-effect diagram with new findings. The number of small braches increased from 12 to 40. The most important root causes were clustered into five topics.
Table III shows when the root causes were found—before, in, or after KOS—as judged by the Six Sigma project manager. Many of the main findings were suspected before KOS, but these were investigated thoroughly and verified in the seminars. Nothing was found after KOS that was not found already in the seminars.
Table III. Root causes of problems in Six Sigma project (found before, in, and after KOS)
Root Cause Found before KOS Found in KOS Found after KOS
Current MO process is not communicated in Service Teams
25% 75% 0%
Separate processes for MO vs. Service Bulletins.
25% 75% 0%
Separate processes for MO and other service activities
50% 50% 0%
Service Teams are not trained in MO process
100% 0% 0%
Multiple preparations in different teams cause MO implementations to differ both in time and execution at different sites
25% 75% 0%
Each KOS was rated by the participants in a survey. As shown in Table II, four of the six seminars were rated as ‘good’, but two received ‘poor’ ratings. The first of the seminars with a ‘poor’ rating was the SPM-to-PSE seminar, in which the first rule of KOS was broken. Both the PSE who usurped the SPM guide role and his PSE colleague said that they did obtain some (but not much) new knowledge from the seminar. In the subsequent interviews, the guide and the participants said that the seminar was too superficial and that participants never began to address ‘why’ questions. The second of the seminars to be rated poorly was the AE-to-SPM seminar. One participant said that she did glean some new knowledge, but another said that she had not received any new knowledge. However, a comparison of the ratings with the interviews revealed that both of these respondents did obtain new knowledge, but that this new

Knowledge Overlapping Seminars – KOS – Design and Applications. Cronemyr and Mauléon (2007)
E-16
knowledge had frustrated and annoyed them. As a result of this finding, it is apparent that the survey results should be interpreted as reflecting the true state of mind, rather than the ‘objective rating’ of gained knowledge.
Semi-structured interviews were conducted approximately one month after the six seminars. Each person was interviewed for approximately half an hour. Recorded interviews were transcribed and similar answers were grouped together. The most common opinions were as follows.
• Most participants said that they were sceptical of KOS before the seminars. One respondent described KOS as “… yet another three-letter abbreviation”.
• Formulating the common goal in the initial meeting was described as “difficult”, but “useful”. This process would have been facilitated by the presence of all KOS participants at the initial meeting.
• Misunderstandings had been revealed, and this meant that root causes to problems had been identified on a more profound level than previously.
• Participants had an enhanced realisation of what others expected of them. They had also formed greater respect for others.
• Managers should not be present because their presence would inhibit questions that might be perceived as simplistic. Moreover, managers do not know the details of the domain to the extent that others do.
Knowledge Overlapping Seminars – KOS – Design and Applications. Cronemyr and Mauléon (2007)
E-17
4. Discussion The participants in both applications thought that KOS was a new way of communicating with colleagues that helped to reveal hidden misunderstandings. The participants also expressed the belief that KOS should be used in other projects and groups in the organisation.
Despite these generally positive views of KOS, as expressed in both applications, some differences between the applications were also apparent. The first difference is that the misunderstandings in the first application were more technical and theoretical, whereas the misunderstandings in the second application were more concerned with personnel and processes. The most likely explanation for this difference is that the knowledge domains involved in gas-turbine development (the subject of the first application) are inherently more technical than the knowledge domains involved in service execution (the subject of the second application). Another explanation could be that people involved in gas-turbine development are more likely to have a product-oriented perspective on problem-solving whereas people in the service department are more likely to have a process-oriented perspective on problem-solving (Cronemyr and Witell, 2007).
Another difference between the two applications was that KOS in the second application was conducted at a specific phase of the designated Six Sigma DMAIC procedure (in the so-called ‘process door’ of the analyse phase), whereas the KOS in the first application was conducted at a non-specific time in a relatively unstructured process. This meant that the Six Sigma team was better prepared for KOS and that the results could be better utilised than was the case in the gas-turbine development project. This is not to say that the KOS results were of no account in the first application; in fact, the results did contribute to success in achieving an improved gas-turbine design. However, the KOS results were not documented in a structured manner in the first application, as was the case in the second application (as exemplified in the expansion of the cause-and-effect diagram that was later utilised by the full Six Sigma team).

Knowledge Overlapping Seminars – KOS – Design and Applications. Cronemyr and Mauléon (2007)
E-18
5. Conclusions The present study has addressed the need for a methodology that helps to reveal hidden misunderstandings between knowledge domains, thus facilitating exchange of information and enhanced project success. In this regard, the study has explained the technique of knowledge overlapping seminars’ (KOS) and has demonstrated that KOS can be applied to at least two types of projects. It is likely that the technique is also applicable to a wider variety of projects; however, as shown in the present study, KOS is especially suited to Six Sigma projects characterised by limited data for analysis, which is often the case. The study concludes that KOS should be included as a standard ‘tool’ in the Six Sigma toolbox and that KOS should be taught in Six Sigma training programs.
The study has also demonstrated that successful implementation of KOS is likely to be enhanced by:
• obtaining the support of the management team;
• training a facilitator;
• identifying projects with participants from several domains;
• beginning with one project; and
• distributing the results to managers and the wider organisation.
Common excuses for not implementing KOS include the following:
• ‘No time, no available resources’;
• ‘Not invented here; hence does not work here’; and
• ‘Managers must be present in all meetings.’
These inadequate excuses should not be allowed to prevent KOS being implemented with success.
Although KOS has been successfully applied to two quite different types of projects in the present study, it is acknowledged that the applications that have been investigated are limited and that the results must be considered in context. More applications in other settings would be valuable in providing more generalisable results. Nevertheless, despite the inherent limitations of generalising the findings of any qualitative study of this type, the present paper has shown that KOS is a most promising methodology for application in projects with a view to achieving common concepts, fewer misunderstandings, better quality, and, ultimately, more satisfied customers.
Knowledge Overlapping Seminars – KOS – Design and Applications. Cronemyr and Mauléon (2007)
E-19
6. References Allen, T. (1977) Managing the Flow of Technology: Technology Transfer and the Dissemination of Technological Information within the R&D Organization. MIT Press, Cambridge, MA.
Argyris, C., Putnam, R., Smith McLain, D. (1985) Action Science. San Francisco: Jossey-Bass Publishers.
Cronemyr, P. (2000) Towards a Learning Organization for Product Development. Licentiate Thesis, Division of Quality Technology and Management, Department of Mechanical Engineering, Linköping University, Linköping, Sweden.
Cronemyr, P. and Witell, L. (2007): Changing from a product to a process perspective for Service Improvements in Manufacturing Companies. Submitted for publication.
Davenport, T. H. and Prusak, L. (1998) Working knowledge: how organizations manage what they know. Harvard Business School Press.
Dean and Bowen (1994) Management Theory and total quality: Improving research and practice through theory development. Academy of Management Review, vol 19, No 3, 302-418
Deming, W. E. (1986) Out of the crisis. Massachusetts Institute of Technology, Center for Advanced Engineering Study, Cambridge MA.
Deming, W. E. (1993) The New Economics for Industry, Government, Education Massachusetts. Institute of Technology, Centre for Advanced Engineering Study, Cambridge, MA.
Giroux (2006) It was such a handy term: Management Fashions and Pragmatic Ambiguity. Journal of Management Studies 43: 6 September
Hellgren, B. and Löwstedt, J. (1997) Tankens företag: kognitiva kartor och meningsskapande processer i organisationer. Stockholm: Nerenius & Santérus.
Hellgren, B. and Löwstedt, J. (eds.) (2001) Management in the Thought-Full enterprise - European Ideas on Organizing. Bergen: Fagbokforlaget.
Ishikawa, K. (1982) Guide to Quality Control. Asian Productivity Press, Tokyo
Kroslid, D. (2004) Exploring Improvement Methodologies - within Quality Management. In the proceedings from the 3rd Sino-Korea Bilateral Symposium on Quality. July 16-18, 2004. Shanghai, P. R. China.
Lewin, K. (1946) Action Research and Minority Problems, Journal of Social Issues, vol. 2, no. 4, 34-46.
Knowledge Overlapping Seminars – KOS – Design and Applications. Cronemyr and Mauléon (2007)
E-20
Lewis, C. I. (1929) Mind and the world-order : outline of a theory of knowledge. New York: Dover Publications.
Magnusson, K., Kroslid, D., and Bergman, B. (2003) Six Sigma. The Pragmatic Approach. Second edition. Studentlitteratur, Lund.
Mauléon, C., Bergman, B. and Alänge, S. (2003) Common concepts for common action - sensemaking or senseless making in organisations. In the proceedings from the International Conference of European Group for Organizational Studies (EGOS), Copenhagen, Denmark, July 2003.
Mauléon, C. and Bergman, B. (2002) On the Theory of Knowledge in the Quality Movement - C.I. Lewis’ Contribution to Quality Pioneers. In the proceedings from the 8th Annual Research Seminar, Fordham University, New York. Feb. 2002, pp. 156-164
Nonaka, I., (1994) A Dynamic Theory of Organizational Knowledge Creation. Organization Science, vol. 5, no. 1, pp. 14-37.
Naess, A. (1968) Empirisk semantik. Stockholm: Läromedelsförlagen Kungliga boktryckeriet.
Pålshaugen, Ö. (2001) The use of Words: Improving Enterprises by Improving their Conversations. In: Reason and Bradbury (eds.) Handbook of action research: Participative inquiry and practice. Sage.
Reed, R., Lemak, D., and Montgomery, J. (1996) Beyond Process: TQM content and firm performance. Academy of Management Review, Vol. 21, No 1, 173-202.
Senge, P. M. (1990) The Fifth Discipline: The Art and Practice of the Learning Organization. New York: Currency/Doubleday.
Shewhart, W. A. (1939) Statistical method from the viewpoint of quality control. (Reprinted 1986) New York: Dover.
Westlander, G. (1999) Forskarroller i varianter av aktionsforskning. Research report TRITA 1999:24. Royal Institute of Technology. Stockholm.
Weick, K and Roberts, K. (1993) Collective mind in Organizations: Heedful Interrelating on Flight Docks. Administrative Science Quarterly, Sep 1993; 38, 3. pp. 357-381.
von Wright, G. H. (1957) Logik, Filosofi och språk. (re-printed in 1993). Lund: Nya Doxa.
von Wright, G. H. (1971) Explanation and understanding. N.Y: Cornell University Press.
Appendix F Title Process improvement
simulations
Paper title A Decision Support Tool for Predicting the Impact of Development Process Improvements
Authors Peter Cronemyr, Anna Öhrwall-Rönnbäck, and Steven Eppinger
Publication Journal of Engineering Design, Vol. 12, No. 3, pp. 177-199 (2001)

A decision support tool for predicting the impact of developmentprocess improvements
PETER CRONEMYR†*, ANNA ÖHRWALL RÖNNBÄCK ‡
and STEVEN D. EPPINGER§
This paper presents a method for simulating the impact of improvements to theengineering design process. The method can be used by managers and teams toprioritize the most valuable process improvements among several suggested ones,before they actually take place. The method is based on the design structurematrix (DSM) developed by Steward (1981), and an extension of DSM called thework transformation model developed by Smith and Eppinger (1997). We intro-duce two new concepts, total process time and simulated to-be/as-is ratio. Twoapplications are presented. The �rst, a gas turbine blade development process,illustrates the estimated gain of a process improvement, and evaluates the actualimplementation. The second application, a buyer-supplier product developmentproject, shows how the method could be used as a decision support tool in aninter-organizational context. Input to the process simulation comes from processdescriptions and estimates of anticipated effects of process change at the activitylevel. Output shows the effect of such a change on a total process level.
1. Introduction
1.1. Iterative development processThe development process is often described as a sequence of project phases from
conceptual design to production ramp up (see, for example, Andreasen and Hein1987, Wheelwright and Clark 1992, or Ulrich and Eppinger 1995). While there havebeen quite extensive efforts to shift from sequential to parallel or concurrent tasks,the problem of iteration between coupled tasks is seldom addressed. Iteration withinand between project phases is common in modern product development. Iterativedevelopment processes are discussed by Eppinger et al. (1994), Smith and Eppinger(1997), and MacCormack (1998).
Iteration is a somewhat negative word since it implies re-doing work. Hence thecomment ‘We have to get rid of iterations by doing it right the �rst time’ is, or atleast used to be, quite common in development process re-design. In developmentof high-tech products, where specialists from several domains have to be involvedat the same time, iteration is not a negative word. Some iterations are of great value
J. ENG. DESIGN, 2001, VOL. 12, NO. 3, 177–199
Revision received March 2001.† ALSTOM Power, SE-612 82 Finspong, Sweden‡ Department of Management and Economics, Linköping Universitet, Institute of Tech-nology, SE-581 83 Linköping, Sweden§ Sloan School of Management, Massachusetts Institute of Technology, Cambridge, MA02139, USA* To whom correspondence should be addressed. e-mail: [email protected]
Journal of Engineering DesignISSN 0954-4828 print/ISSN 1466–1387 online © 2001 Taylor & Francis Ltd
http://www.tandf.co.uk/journalsDOI: 10.1080/0954482011005554 7

and even necessary. The problem is that iterations often take a long time toconverge. Furthermore, the convergence criteria may change, or there may not beconvergence criteria at all. To shorten the development time for a developmentproject with iterations, Ulrich and Eppinger (1995) suggest two approaches.
(i) De-couple tasks to avoid iterations: If there is a well-understood interfacebetween two interacting components of the product, it may be possible tode-couple development tasks to avoid iterations. This may be achieved byspecifying the interface in advance.
(ii) Perform faster iterations: Many of the concurrent engineering tools avail-able today may be used to perform coupled tasks more quickly, i.e. toperform more iterations quickly.
This paper presents a method for simulating the impact on development time ofsuggested process improvements such as avoiding or speeding up iterations. Fastiterations are required for fast developers, i.e. companies that are �exible andcapable of rapidly adapting to new markets or technology conditions. Being a fastdeveloper is the key to successful product development in many industries (Wheel-wright and Clark 1992, Smith and Reinertsen 1998).
2. Modelling development processes and simulating process improvementsWhile much literature discusses the product development process on a highly
aggregated level, consisting mainly of product development phases, the processmaps that are used in this method are at a more detailed activity level.
2.1. Flow chartsFlow chart techniques, e.g. Gantt and PERT charts (Hillier and Liebermann
1986), are implemented in popular project management software such as MSProject. Planning of the activities is commonly carried out with the critical pathmethod (CPM) where the sequence of activities taking the longest time determinesthe total project time. A problem, well known to PERT/CPM users, is that coupled-task iterations cannot be modelled. Instead, the time for iteration loops is estimated.In a Gantt or PERT �ow chart, the iterations are therefore kept inside ‘black boxes’of grouped activities. Such �ow charts are not very useful for mapping iterativeprocesses since the iterations are invisible, and consequently uncontrolled. Figure 1illustrates sequential, parallel, and coupled activities. Figure 2 shows an example ofan iterative process.
2.2. Design structure matrixThe design structure matrix (DSM), as developed by Steward (1981) and extended
by Eppinger et al. (1994), is a technique based on representing the relation betweenany two activities as a binary (to, from) representation in the matrix cell. Each activityis represented by a row of input relations and a column of output relations. By parti-tioning the matrix, i.e. re-arranging the rows and columns in such a way that theactivity relations are transferred to the lower triangle of the matrix, it is possible to�nd sequential, parallel and coupled activities (or activity blocks) in the matrix.1
178 P. Cronemyr et al.
1 In this application of DSM, no partitioning is necessary. For more information onpartitioning algorithms, see the DSM web site (http://web.mit.edu/dsm).
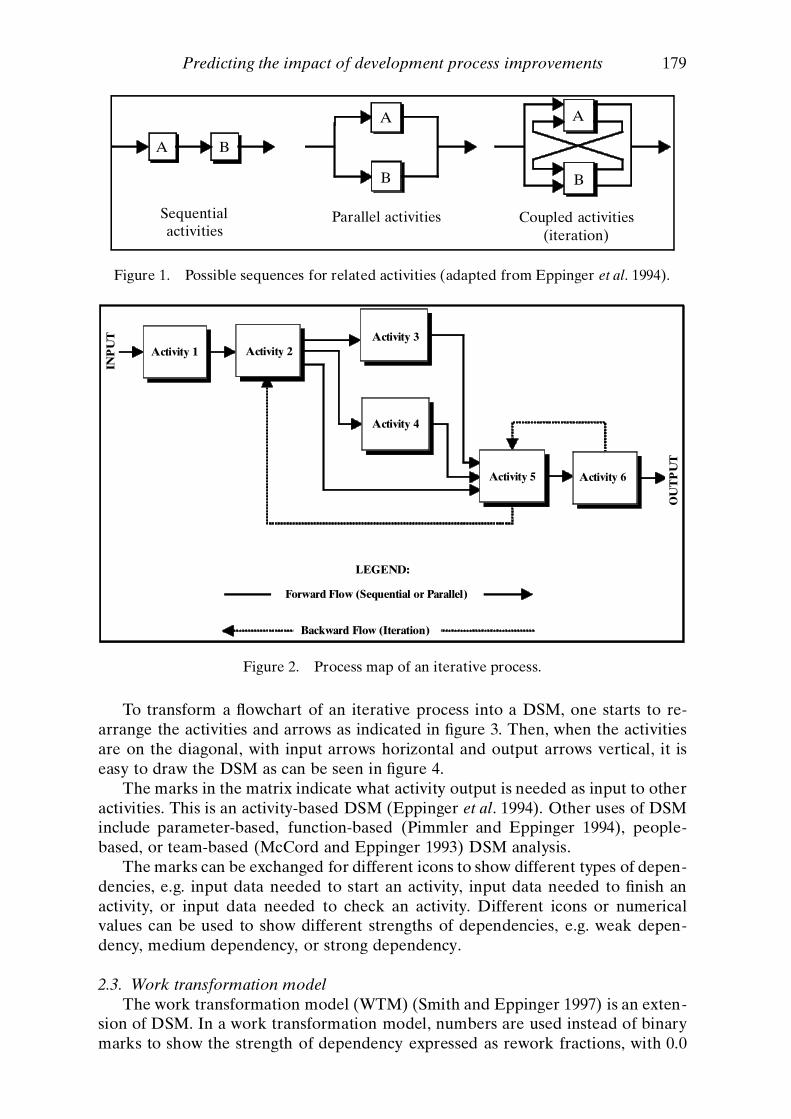
To transform a �owchart of an iterative process into a DSM, one starts to re-arrange the activities and arrows as indicated in �gure 3. Then, when the activitiesare on the diagonal, with input arrows horizontal and output arrows vertical, it iseasy to draw the DSM as can be seen in �gure 4.
The marks in the matrix indicate what activity output is needed as input to otheractivities. This is an activity-based DSM (Eppinger et al. 1994). Other uses of DSMinclude parameter-based, function-based (Pimmler and Eppinger 1994), people-based, or team-based (McCord and Eppinger 1993) DSM analysis.
The marks can be exchanged for different icons to show different types of depen-dencies, e.g. input data needed to start an activity, input data needed to �nish anactivity, or input data needed to check an activity. Different icons or numericalvalues can be used to show different strengths of dependencies, e.g. weak depen-dency, medium dependency, or strong dependency.
2.3. Work transformation modelThe work transformation model (WTM) (Smith and Eppinger 1997) is an exten-
sion of DSM. In a work transformation model, numbers are used instead of binarymarks to show the strength of dependency expressed as rework fractions, with 0.0
Predicting the impact of development process improvements 179
Sequentialactivities
Parallel activities Coupled activities(iteration)
A B
A
B
A
B
Figure 1. Possible sequences for related activities (adapted from Eppinger et al. 1994).
:
INP
UT
OU
TP
UT
Activity 1 Activity 2Activity 3
Activity 4
Activity 5 Activity 6
LEGEND:
Forward Flow (Sequential or Parallel)
Backward Flow (Iteration)
Figure 2. Process map of an iterative process.
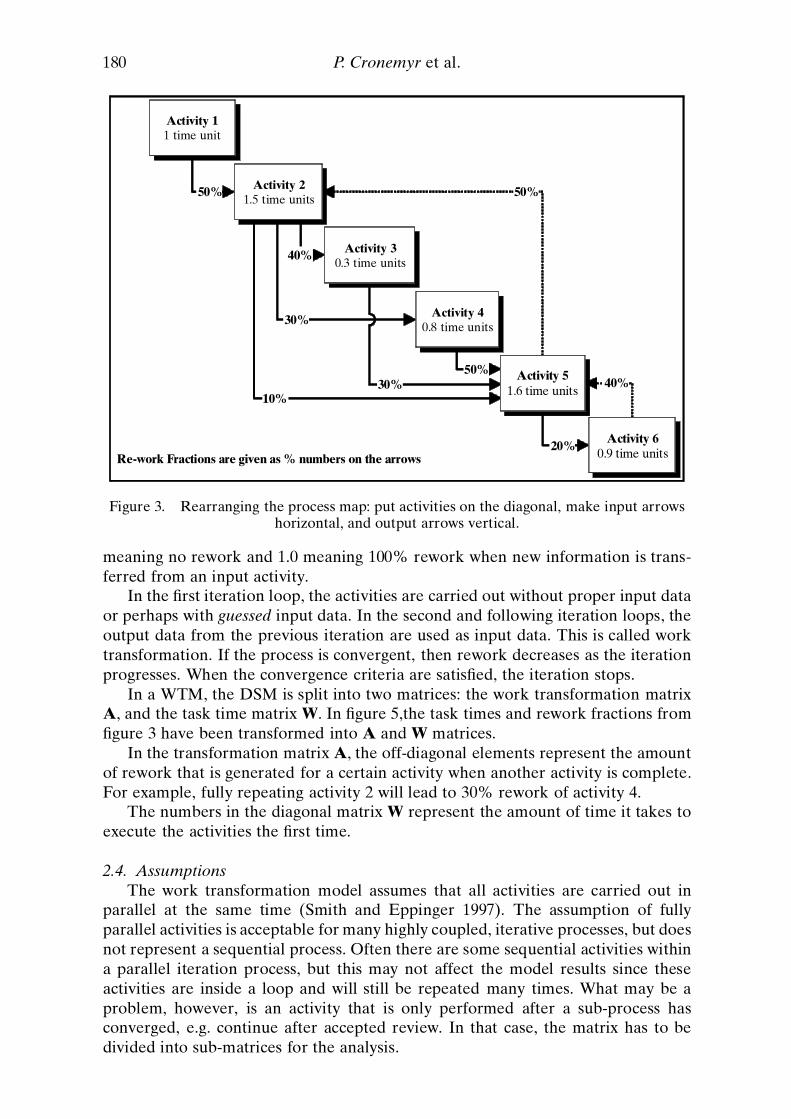
meaning no rework and 1.0 meaning 100% rework when new information is trans-ferred from an input activity.
In the �rst iteration loop, the activities are carried out without proper input dataor perhaps with guessed input data. In the second and following iteration loops, theoutput data from the previous iteration are used as input data. This is called worktransformation. If the process is convergent, then rework decreases as the iterationprogresses. When the convergence criteria are satis�ed, the iteration stops.
In a WTM, the DSM is split into two matrices: the work transformation matrixA, and the task time matrix W. In �gure 5,the task times and rework fractions from�gure 3 have been transformed into A and W matrices.
In the transformation matrix A, the off-diagonal elements represent the amountof rework that is generated for a certain activity when another activity is complete.For example, fully repeating activity 2 will lead to 30% rework of activity 4.
The numbers in the diagonal matrix W represent the amount of time it takes toexecute the activities the �rst time.
2.4. AssumptionsThe work transformation model assumes that all activities are carried out in
parallel at the same time (Smith and Eppinger 1997). The assumption of fullyparallel activities is acceptable for many highly coupled, iterative processes, but doesnot represent a sequential process. Often there are some sequential activities withina parallel iteration process, but this may not affect the model results since theseactivities are inside a loop and will still be repeated many times. What may be aproblem, however, is an activity that is only performed after a sub-process hasconverged, e.g. continue after accepted review. In that case, the matrix has to bedivided into sub-matrices for the analysis.
180 P. Cronemyr et al.
Activity 11 time unit
Activity 21.5 time units
Activity 30.3 time units
Activity 40.8 time units
Activity 51.6 time units
Activity 60.9 time units
50%
40%
30%
10%30%
50%
50%
40%
20%Re-work Fractions are given as % numbers on the arrows
Figure 3. Rearranging the process map: put activities on the diagonal, make input arrowshorizontal, and output arrows vertical.

The parallel assumption may look severe but, as was found in practical appli-cations, it has a small in�uence on the �nal results given as total process time (TPT)and simulated to-be/as-is ratio (STAR). If one sub-iteration is converging quicklyand another sub-iteration is converging slowly, the process does not converge untilthe slow iteration has converged. Then the activities in the fast sub-iteration havebeen executed several times with ‘close-to-zero’ rework. That may look strange butdoes not change the �nal result expressed as TPT and STAR.
Another assumption is that the matrix A is static and linear. It does not changewith time and there are no conditional relations. In a changing process, these aresomewhat heavy assumptions and the WTM may not be reliable. To analyse sequen-tial iterations, conditional relations, and non-linear timing characteristics, moregeneral modelling techniques, such as signal �ow graphs, may be used (see, forexample, Eppinger et al. 1997, Andersson et al. 1998).
Another fundamental assumption is that there is no noise, i.e. no stochastic vari-ation, in the process. Another approach has to be used to deal with this, e.g. robustprocess design (Phadke 1989, Bergman 1992, Bergman and Klefsjö 1994).
Predicting the impact of development process improvements 181
Design Structure Matrix
Marks indicate informationdirection (output from activity 2 is
required as input to activity 4)
Activity relations:Activities 1 and 2 are sequential.
Activities 3 and 4 are parallel.Activities 5 and 6 are coupled (iteration).
1 2 3 4 5 6
1
2
3
4
5
6
1
2
3
4
5
6
Figure 4. The design structure matrix (DSM).

182 P. Cronemyr et al.
1
2
3
4
5
6
1 2 3 4 5 6
Rework Fractions
A: transformation matrix
Act
ivity
Activity
0.5
0.4
0.3
0.1
0.2
0.3 0.5 0.4
0.5
Task Times (time units)
W: task time matrix
1
2
3
4
5
6
1 2 3 4 5 6
1
1.5
0.3
0.8
1.6
0.9
Act
ivity
Activity
Figure 5. The two matrices of the work transformation model (WTM).
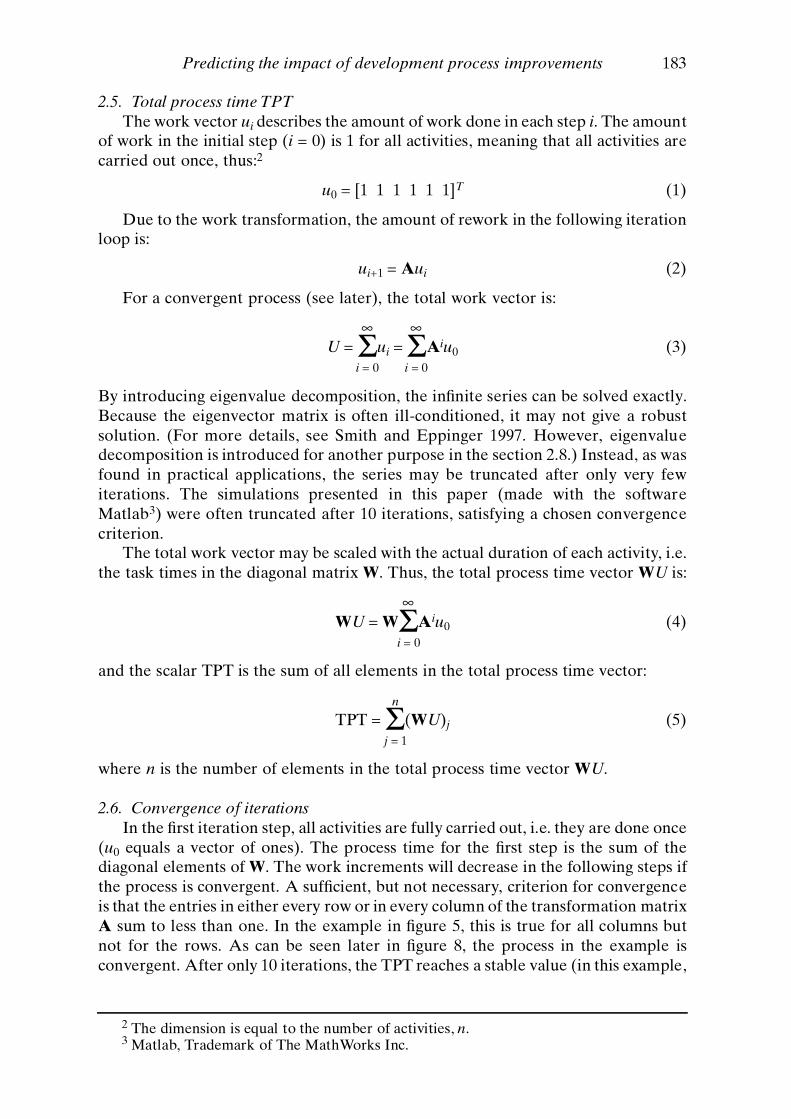
2.5. Total process time TPTThe work vector ui describes the amount of work done in each step i. The amount
of work in the initial step (i = 0) is 1 for all activities, meaning that all activities arecarried out once, thus:2
u0 = [1 1 1 1 1 1]T (1)
Due to the work transformation, the amount of rework in the following iterationloop is:
ui+1 = Aui (2)
For a convergent process (see later), the total work vector is:
¥ ¥U = Sui = SAiu0 (3)
i = 0 i = 0
By introducing eigenvalue decomposition, the in�nite series can be solved exactly.Because the eigenvector matrix is often ill-conditioned, it may not give a robustsolution. (For more details, see Smith and Eppinger 1997. However, eigenvaluedecomposition is introduced for another purpose in the section 2.8.) Instead, as wasfound in practical applications, the series may be truncated after only very fewiterations. The simulations presented in this paper (made with the softwareMatlab3) were often truncated after 10 iterations, satisfying a chosen convergencecriterion.
The total work vector may be scaled with the actual duration of each activity, i.e.the task times in the diagonal matrix W. Thus, the total process time vector WU is:
¥WU = WSAiu0 (4)
i = 0
and the scalar TPT is the sum of all elements in the total process time vector:
n
TPT = S(WU)j (5)j = 1
where n is the number of elements in the total process time vector WU.
2.6. Convergence of iterationsIn the �rst iteration step, all activities are fully carried out, i.e. they are done once
(u0 equals a vector of ones). The process time for the �rst step is the sum of thediagonal elements of W. The work increments will decrease in the following steps ifthe process is convergent. A suf�cient, but not necessary, criterion for convergenceis that the entries in either every row or in every column of the transformation matrixA sum to less than one. In the example in �gure 5, this is true for all columns butnot for the rows. As can be seen later in �gure 8, the process in the example isconvergent. After only 10 iterations, the TPT reaches a stable value (in this example,
Predicting the impact of development process improvements 183
2 The dimension is equal to the number of activities, n.3 Matlab, Trademark of The MathWorks Inc.
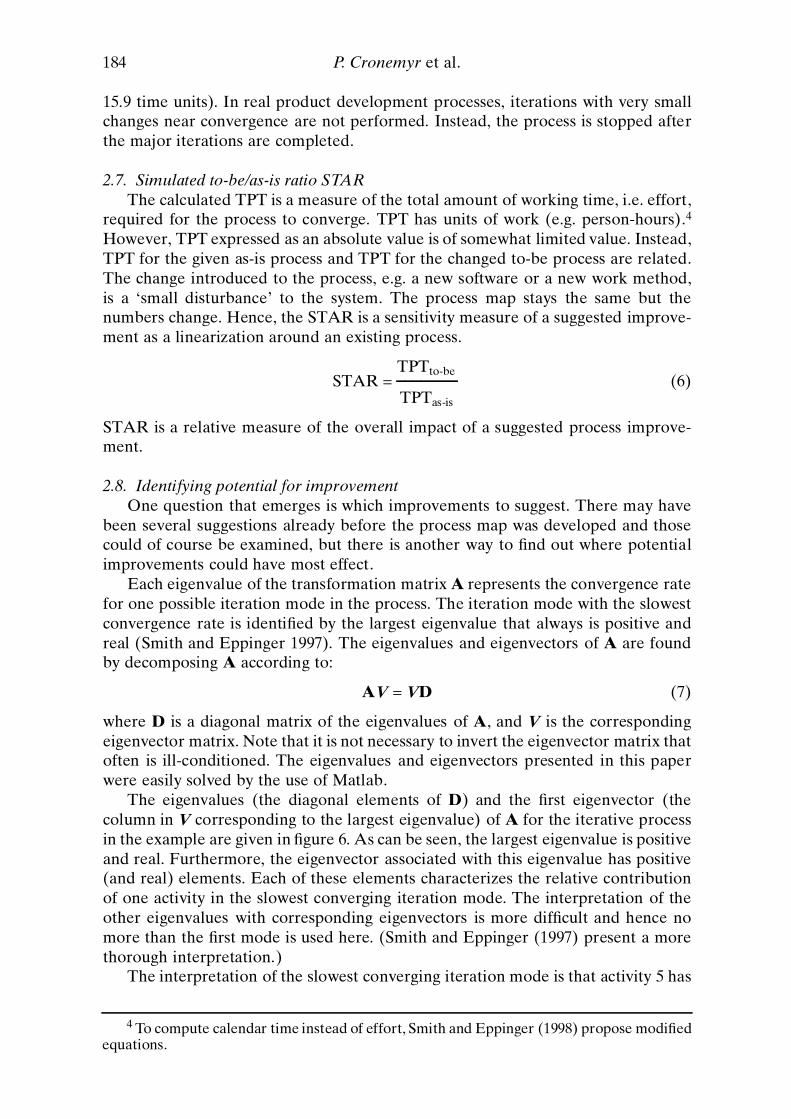
15.9 time units). In real product development processes, iterations with very smallchanges near convergence are not performed. Instead, the process is stopped afterthe major iterations are completed.
2.7. Simulated to-be/as-is ratio STARThe calculated TPT is a measure of the total amount of working time, i.e. effort,
required for the process to converge. TPT has units of work (e.g. person-hours).4
However, TPT expressed as an absolute value is of somewhat limited value. Instead,TPT for the given as-is process and TPT for the changed to-be process are related.The change introduced to the process, e.g. a new software or a new work method,is a ‘small disturbance’ to the system. The process map stays the same but thenumbers change. Hence, the STAR is a sensitivity measure of a suggested improve-ment as a linearization around an existing process.
TPTto-beSTAR = . (6)
TPTas-is
STAR is a relative measure of the overall impact of a suggested process improve-ment.
2.8. Identifying potential for improvementOne question that emerges is which improvements to suggest. There may have
been several suggestions already before the process map was developed and thosecould of course be examined, but there is another way to �nd out where potentialimprovements could have most effect.
Each eigenvalue of the transformation matrix A represents the convergence ratefor one possible iteration mode in the process. The iteration mode with the slowestconvergence rate is identi�ed by the largest eigenvalue that always is positive andreal (Smith and Eppinger 1997). The eigenvalues and eigenvectors of A are foundby decomposing A according to:
AV = VD (7)
where D is a diagonal matrix of the eigenvalues of A, and V is the correspondingeigenvector matrix. Note that it is not necessary to invert the eigenvector matrix thatoften is ill-conditioned. The eigenvalues and eigenvectors presented in this paperwere easily solved by the use of Matlab.
The eigenvalues (the diagonal elements of D) and the �rst eigenvector (thecolumn in V corresponding to the largest eigenvalue) of A for the iterative processin the example are given in �gure 6. As can be seen, the largest eigenvalue is positiveand real. Furthermore, the eigenvector associated with this eigenvalue has positive(and real) elements. Each of these elements characterizes the relative contributionof one activity in the slowest converging iteration mode. The interpretation of theother eigenvalues with corresponding eigenvectors is more dif�cult and hence nomore than the �rst mode is used here. (Smith and Eppinger (1997) present a morethorough interpretation.)
The interpretation of the slowest converging iteration mode is that activity 5 has
184 P. Cronemyr et al.
4 To compute calendar time instead of effort, Smith and Eppinger (1998) propose modi�edequations.

the largest contribution. Also, by looking at the task time matrix in W (�gure 5) wesee that activity 5 has the longest task time. It is evident that, to reduce the totalprocess time and hence get a lower STAR, we should concentrate on activity 5, itstask times and its rework fractions.
2.9. Comparison of suggested improvementsTwo different improvements in activity 5 are suggested (�gure 7). Improvement
#1 is a make-less-iterations improvement, e.g. better interface to activity 5. Allrework fractions in row 5 and in column 5 of the A matrix have been divided by two.Improvement #2 is a work-faster improvement, e.g. faster tools for activity 5, hencethe task time for activity 5 in the W matrix has been divided by two.
In �gure 8, the TPT, the U vector (total work vector) and the WU vector (totalprocess time vector) after 10 iterations are given.
In the left part of the �gure, the TPT, U and WU are given for the as-is processand for a suggested improvement #1. In the right part, the as-is process is comparedwith suggested improvement #2.
For the make-less-iterations improvement, the work as well as the amount oftime decrease considerably for activities 2 and 5, and some also for 3, 4, and 6. TheTPT after 10 iterations is 10.1 time units and, hence, the STAR is 10.1 / 15.9 = 0.64.
For the work-faster improvement the U vector stays unchanged but the TPTdecreases because the total time required by activity 5 decreases, giving TPT = 12.9time units and STAR = 12.9 / 15.9 = 0.81.
One of the most interesting things to notice is that improvement #1, in additionto giving a lower STAR, also gives a much faster convergence than the as-is processand improvement #2. Look especially at the time/iteration curves (lower curves) in
Predicting the impact of development process improvements 185
Eigenvalues of A First Eigenvector of A
Rea
l par
ts
Rea
l par
ts
Eigenvalue number Activity number
imag
inar
y pa
rts
imag
inar
y pa
rts
Eigenvalue number Activity number
1
0. 5
0
-0. 5
-1
1
0. 5
0
-0. 5
-1
1
0. 5
0
-0. 5
-1
1
0. 5
0
-0. 5
-11 2 3 4 5 6
1 2 3 4 5 6 1 2 3 4 5 6
1 2 3 4 5 6
Figure 6. Eigenvalues and �rst eigenvector of A.

�gure 8. The number of necessary iterations decrease by half. In reality, the mostsuccessful improvements are combinations of fewer iterations and working faster.A combination of the two improvements in this example, i.e. to use both the new Amatrix and the new W matrix, would shorten the TPT even more, giving a STAR =0.54, i.e. a total time reduction of 46%.
186 P. Cronemyr et al.
0.1 0.3 0.5
0.5
0.2
0.4
1.6
Suggested Improvement #1“Less iterations”
(Better interface to activity 5)
A: updated transformation matrix
Act
ivity
1 2 3 4 5 6
1
2
3
4
5
6
Activity
0.5
0.4
0.3
0.05 0.15 0.25
0.10
0.20
0.25
Suggested Improvement #2“Work faster”
(Faster tools for activity 5)
W: updated task time matrix
1
2
3
4
5
6
1 2 3 4 5 6
1
1.5
0.3
0.8
0.80
0.9
Act
ivity
Activity
Figure 7. Two different improvement suggestions.

3. Application to gas turbine blade developmentIn this section, we describe an application of this method to a gas turbine blade
development process at ABB STAL.5 Among the most critical components of a gasturbine are the blades. Due to the extreme technical demands on gas turbine blades,the development of the blades is a very complicated, coupled process. It includesseveral specialists from several technical domains. In an effort to achieve increasedintegration, a project was launched at ABB STAL with the mission of mapping the
Predicting the impact of development process improvements 187
Figure 8. Simulation results from two different suggested process improvements (as-is,dark bars at back; improvements, lighter bars in front).
5 Since 1999, ABB STAL has become a part of ALSTOM Power (www.se.alstom.com).
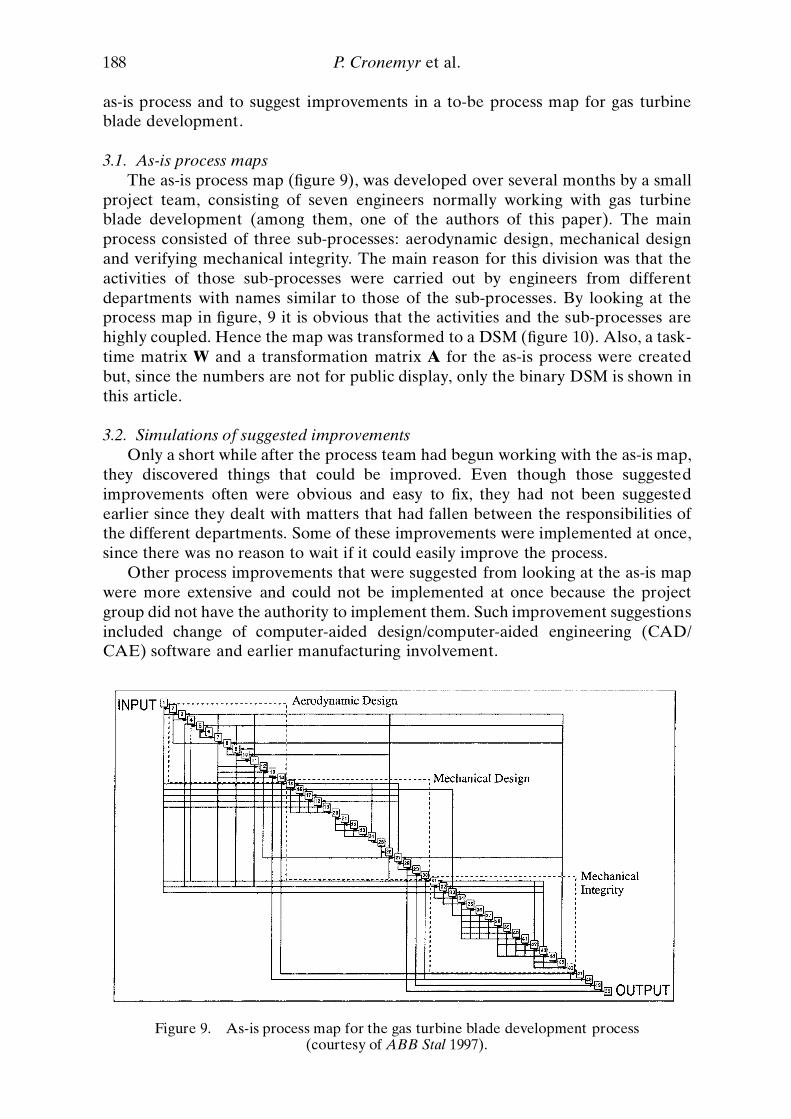
as-is process and to suggest improvements in a to-be process map for gas turbineblade development.
3.1. As-is process mapsThe as-is process map (�gure 9), was developed over several months by a small
project team, consisting of seven engineers normally working with gas turbineblade development (among them, one of the authors of this paper). The mainprocess consisted of three sub-processes: aerodynamic design, mechanical designand verifying mechanical integrity. The main reason for this division was that theactivities of those sub-processes were carried out by engineers from differentdepartments with names similar to those of the sub-processes. By looking at theprocess map in �gure, 9 it is obvious that the activities and the sub-processes arehighly coupled. Hence the map was transformed to a DSM (�gure 10). Also, a task-time matrix W and a transformation matrix A for the as-is process were createdbut, since the numbers are not for public display, only the binary DSM is shown inthis article.
3.2. Simulations of suggested improvementsOnly a short while after the process team had begun working with the as-is map,
they discovered things that could be improved. Even though those suggestedimprovements often were obvious and easy to �x, they had not been suggestedearlier since they dealt with matters that had fallen between the responsibilities ofthe different departments. Some of these improvements were implemented at once,since there was no reason to wait if it could easily improve the process.
Other process improvements that were suggested from looking at the as-is mapwere more extensive and could not be implemented at once because the projectgroup did not have the authority to implement them. Such improvement suggestionsincluded change of computer-aided design/computer-aided engineering (CAD/CAE) software and earlier manufacturing involvement.
188 P. Cronemyr et al.
Figure 9. As-is process map for the gas turbine blade development process(courtesy of ABB Stal 1997).

The discussion on choice of a common CAD/CAE software had been going onfor a while. The stress engineers claimed that, if the mechanical designers and thestress engineers used a common CAD/CAE software utilizing parameterizedgeometry (the one that the stress engineers already used for �nite element pre- andpost-processing), it would shorten the development time considerably. People inother departments thought other aspects of the choice of CAD/CAE software weremore important and did not really think that the stress engineers should haveopinions on the tools within mechanical design.
Analysis of the highest eigenvalue and the corresponding eigenvector of the Amatrix showed that the slowest converging iteration mode consisted of activities,with a lot of rework in each iteration, mainly within mechanical integrity (see �gure11). It also consisted of some activities, but without a lot of rework, within mechan-ical design. This meant that the stress engineers had to re-do a lot of work everytime a changed geometry was delivered from the mechanical designers. Thissupported the suggestion of a common CAD/CAE software for these two domains.Therefore, a study was made with the purpose of measuring the task times andrework fractions for �nite element modelling for different CAD/CAE softwarecombinations at the departments.
The results from the study, presented in table 1, were implemented in the A andW matrices (see �gure 12) and used for TPT calculations. Results from simulationsshowed that the simulated to-be process, compared with the as-is process, has STAR= 0.83 (see table 2). The overall development time for the gas turbine blades woulddecrease by 17% by switching the CAD/CAE software of the mechanical designdepartment. By inspecting the total work vectors in �gure 13, we notice that the
Predicting the impact of development process improvements 189
Figure 10. DSM for the blade development process. Numbers in A and W matrices areindicated by marks (not for public display).

amount of work decreases considerably for the stress engineers within the mechan-ical integrity process (activities 31–45) but not that much within the other two sub-processes. There were also opinions that the new software was a better CADsoftware, and hence the total work in the mechanical design process would decrease.Furthermore, the use of common geometry models would increase the cross-disciplinary cooperation, but none of those matters have been taken into account in
190 P. Cronemyr et al.
Figure 11. Eigenvalues and �rst eigenvector of A for the blade development process.
Modelling time for Create �rst �nite Updating bladedifferent processes element model geometry Ratio
As-is processDifferent CAD/CAE software 80 56 0.70(not parameterized geometry) (time units) (time units)
To-be processCommon CAD/CAE software 20 1 0.05(not parameterized geometry) (time units) (time unit)
Table 1. Results from study of blade modelling times.
Suggested improvement TPTto-be TPTas-is(time units) (time units) STAR
Common CAD/CAE software 193 231 0.83
Table 2. STAR for suggested improvement: common CAD/CAE software.

the present paper. Only new task times and rework fractions for �nite elementmodelling have been included in the simulation. Still, 17% of the total person-hoursfor such a development project is a lot of money, hence the company decided tomake the suggested investment.
Installing the common CAD/CAE software for the gas turbine developmentteam led to many problems, as one could expect. To change the team software, theyalso had to adapt the process. After some months, the people had adapted to thenew software and the simulated improvements were realized. The stress engineerscon�rmed the to-be �nite element modelling times from the study and the engineersin the team thought that the iterations had become faster.
It is not quantitatively proven that the faster iterations were actually making theprocess time shorter. Since the engineers are in the middle of the process, there is noway for them to measure the new total process time. Qualitatively, however, the engi-neers and project managers expressed in discussions that ‘things got �nished faster’.
4. Application to buyer–supplier cooperation in aircraft developmentIn the military aircraft industry, high complexity of products combined with
shrinking national defence budgets (Augustine 1983) have forced companies tocooperate in product development. The tradition to keep the supplier at an arm’slength distance, both for cost reduction and security reasons, is now rapidly changing
Predicting the impact of development process improvements 191
5 10 15 20 2 5 30 35 40 4 5 50
5
10
15
2 0
25
3 0
35
4 0
45
5 0
= =
A and W matrices for the to-be process:Aerodynamic Design
Mechanical Design
Mechanical Integrity
Act
ivit
y
Activity
New Task Time New Rework Fraction
Figure 12. Improvement suggestion: common CAD/CAE software.
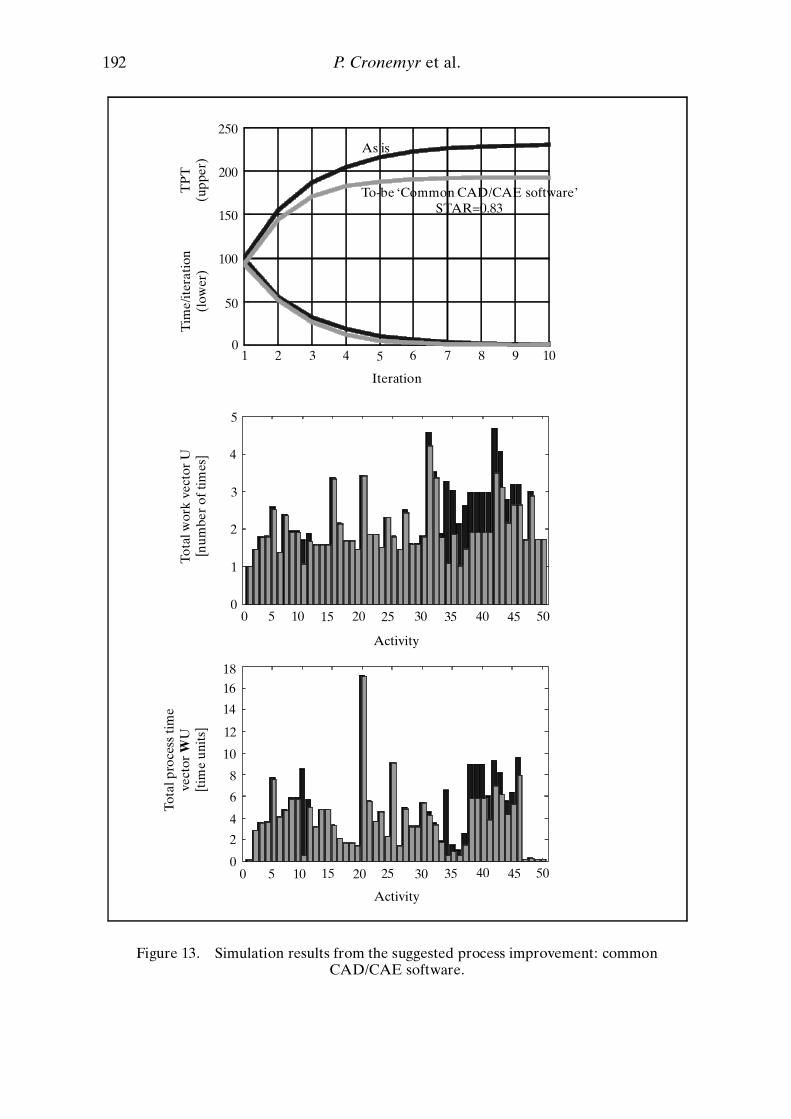
192 P. Cronemyr et al.
250
200
150
100
50
01 2 3 4 5 6 7 8 9 10
5
4
3
2
1
00 5 10 15 20 25 30 35 40 45 50
0 5 10 15 20 25 30 35 40 45 50
18
16
14
12
10
8
6
4
2
0
TP
T(u
pper
)T
ime/
iter
atio
n(l
ower
)
As is
To-be ‘Common CAD/CAE software’STAR=0.83
Iteration
Tota
l wor
k ve
ctor
U[n
umbe
r of
tim
es]
Activity
Activity
Tota
l pro
cess
tim
eve
ctor
WU
[tim
e un
its]
Figure 13. Simulation results from the suggested process improvement: commonCAD/CAE software.
towards a partnership behaviour built on trust between the parties. Such collabor-ation between organizations and over national borders requires ef�cient communi-cation. This is emphasized in collaborative product development, especially in theearly phases where the uncertainties are considerable about technology choice,product characteristics, or teamwork cooperation methods, and contracts cannotspecify all details of the forthcoming product (Helper 1996).
In studies carried out in the aerospace industry during 1997–1999,6 it was found thatengineers needed better communication support, and saw the bene�ts of a web-basedcommunication platform as a complement to telephone, fax, e-mail communication,and physical meetings. However, although prototypes had been constructed, a full-scale tool had not, at the time of the study, been successfully implemented. One import-ant reason was a hesitation to further invest in information technology tools since thereturn on investment in information technology (IT) during the 1990s had been dif�-cult to measure. Therefore, both managers and product development engineers askedfor better decision support tools to estimate expected effects of IT investments.
4.1. Process map according to planThe process map of �gure 14 shows the collaborative product development activi-
ties between a systems integrator and its major supplier. It is generalized mainly fromthe studied development cases.7 The cases are described from both the buyer and thesupplier perspective, where project activities (boxes 1–28) are conducted by integratedproduct development teams (IPTs), one in the supplier company and one in thesystems integrator company. The arrows show the dependencies between activities.
It was found that development was carried out at the partner companies separ-ately, with some common activities where the parties meet. The common activitiesare shown in the middle, together with some of the most important documents thatare exchanged, such as the Request for Information and the Request for Quotationin the beginning, the Contract and the Requirement Speci�cation, and the FinalCerti�cate at the end of the project. To give an overview of the process activities,they are grouped into three main phases: the concept phase (activities 1–9), thedesign phase (10–21), and the test and integration phase (22–28). In the DSM (see�gure 15), the dependencies between the activities in the three phases are shown.
4.2. Simulations of suggested improvementsThe suggested improvements8 presented in this paper are based on the idea that
a common project web site for communication between the systems integrator andthe major supplier could be used in all steps of the design phase, after the contract
Predicting the impact of development process improvements 193
6 This included approximately 50 interviews and meetings with engineers and projectmanagers of three aerospace companies in Sweden, US and France, where the collaborativeproduct development activities for subsystems of Swedish JAS 39 Gripen were mapped (seeSundstrand 1993, Saab 1998, Microturbo 1998), time consumption on activity level wasestimated, and process improvements were discussed. These studies were complemented withstudies of web application development and implementation at Saab AB and at BoeingCommercial Aircraft Group. Some additional data come from Linnarsson and Molin (1998).Refer to Öhrwall Rönnbäck (1999) for a complete review.
7 The IPTs included between 30 and 70 engineers at each company.8 Estimated task times and rework fractions derive from meetings and discussions with
product development managers and engineers (see Öhrwall Rönnbäck (1999) for a completelist of estimations).

is signed, i.e. after the concept development phase. The interviewed engineerssuggested the functions stated in table 3 of a common web-based platform.
Of these, the first five are quite easily implemented in a web-based communi-cation platform,9 while exchange of product data is more complex, requiring
194 P. Cronemyr et al.
Figure 14. Process map for the collaborative system development .
Figure 15. DSM for the collaborative development process.
9 Prototypes containing this functionality had already been produced during the time of thestudy in the research project LARP (www.liu.se/org/imie/larp), for M.Sc. courses at the universitydepartment (www.eki.liu.se), and in the com-onweb™ project (www.com-onweb.com).

common standard formats and an inter-organizational product data managementsystem. At the time of the study, commercial full-scale tools supporting this werenot found in use, and therefore the simulation was carried out for functions(1)–(5).
The to-be process is called the ‘common project web’ in �gure 16, where thesimulated changes from the as-is to the to-be process are shown. The followingassumptions in the to-be process were made. At each company, one or two persons(‘web masters’) were added with the task of helping project leaders and teams tomanage project information and to teach them how to use the project web. Infor-mation published on the project web makes it quickly available for the person whoneeds it, enabling time reductions of product development activities, with largergains at the supplier. The common project web gave no time reduction for reviewmeetings. Today, misunderstandings in the later phases often derive from lack ofcommunication in the early phases. In the to-be process, more iterations (largerdependencies between activities) were estimated in the early phases of the develop-ment process, but fewer in the late phases, since increased information sharingbetween the IPTs enhances early conceptual discussions.
The results (see table 4) show that the total process time of 224 time units withthe current communication tools could be reduced to 150 if a common project webis used, although the number of persons is increased by three to four personsthroughout the project. As a decision support tool, this method can provideguidance on questions such as:
� If the resources are limited, which tools, or part of a tool, should be imple-mented?
Predicting the impact of development process improvements 195
Number Function Description
(1) Project data Contact lists and photos of people involved in the project,action lists, schedule, documents (such as projectspeci�cations, minutes of meetings, etc.), budget and resourceplanning, project history, and national speci�cs, such as acalendar where holidays are marked
(2) Update alert and Access levels and �ltering, in order to direct information�ltering to the right person and avoid problems of information
over�ow
(3) Informal Electronic notice boards, sorted on different discussioncommunication themes, equipped with text search enginesforums
(4) Work process Project management methods, work process descriptions, etc.and rules
(5) Links Interactive links to common information sources, such asstandardization organizations, common suppliers, customersites, universities, etc.
(6) Product data Requirement speci�cations, change requests, engineeringdata, such as early product models, CAD data, simulationdigital prototyping, integration and test results,con�gurations, production planning, and cost estimations
Table 3. Functions of a common web-based platform as suggested by interviewedengineers.
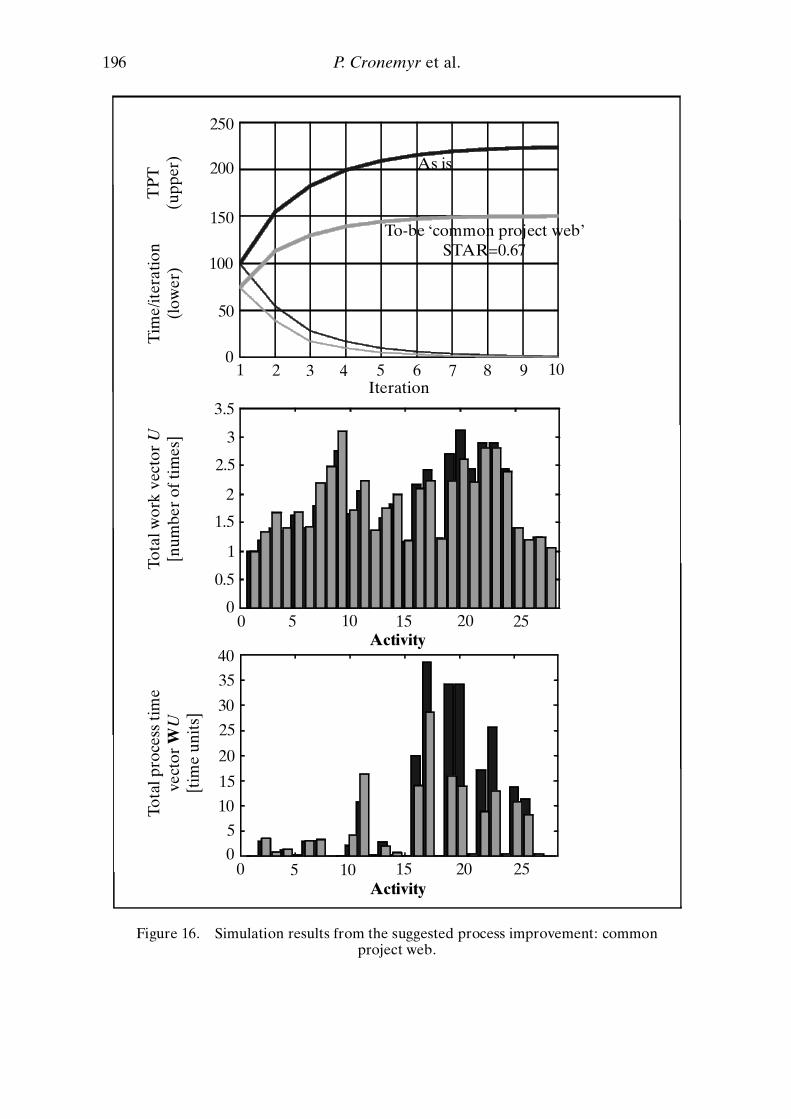
196 P. Cronemyr et al.
As is
To-be ‘common project web’STAR=0.67
250
200
150
100
50
01 2 3 4 5 6 7 8 9 10
3.5
3
2.5
2
1.5
1
0.5
0
40
35
30
25
20
15
10
50
0 5 10 15 20 25
Activity
Activity
TP
T(u
pper
)T
ime/
iter
atio
n(l
ower
)
Iteration
Tota
l wor
k ve
ctor
U[n
umbe
r of
tim
es]
Tota
l pro
cess
tim
eve
ctor
WU
[tim
e un
its]
0 5 10 15 20 25
Figure 16. Simulation results from the suggested process improvement: commonproject web.
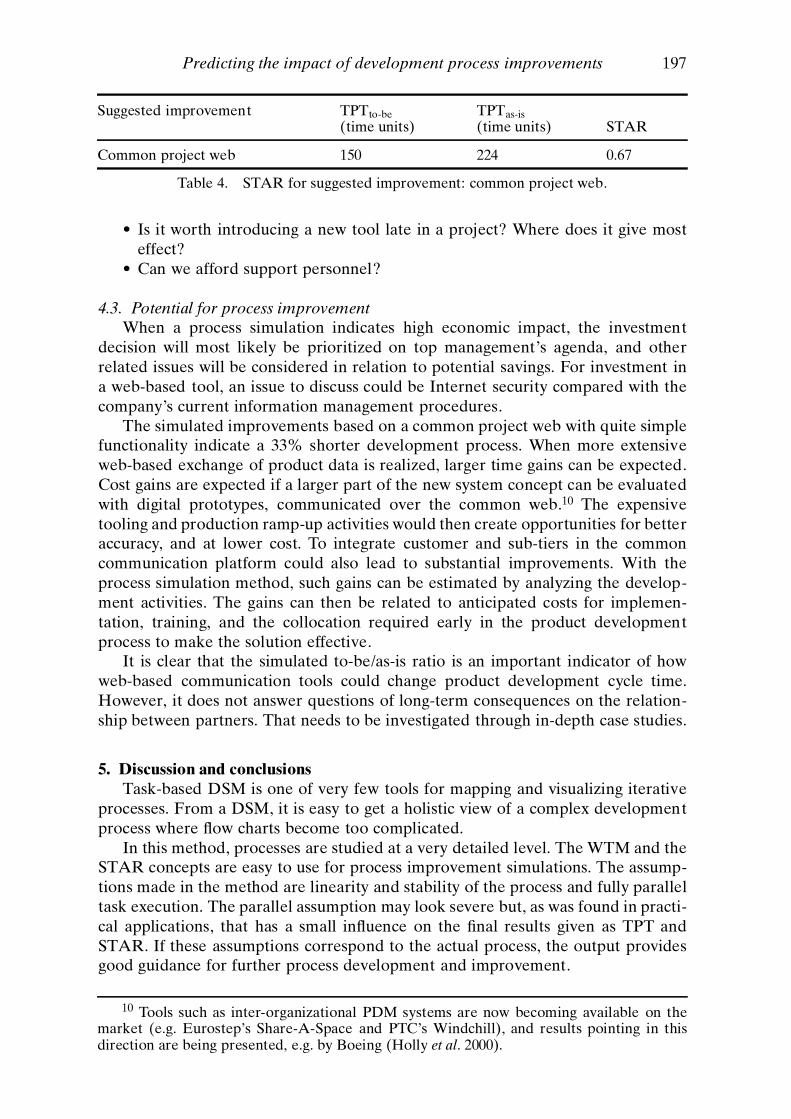
� Is it worth introducing a new tool late in a project? Where does it give mosteffect?
� Can we afford support personnel?
4.3. Potential for process improvementWhen a process simulation indicates high economic impact, the investment
decision will most likely be prioritized on top management’s agenda, and otherrelated issues will be considered in relation to potential savings. For investment ina web-based tool, an issue to discuss could be Internet security compared with thecompany’s current information management procedures.
The simulated improvements based on a common project web with quite simplefunctionality indicate a 33% shorter development process. When more extensiveweb-based exchange of product data is realized, larger time gains can be expected.Cost gains are expected if a larger part of the new system concept can be evaluatedwith digital prototypes, communicated over the common web.10 The expensivetooling and production ramp-up activities would then create opportunities for betteraccuracy, and at lower cost. To integrate customer and sub-tiers in the commoncommunication platform could also lead to substantial improvements. With theprocess simulation method, such gains can be estimated by analyzing the develop-ment activities. The gains can then be related to anticipated costs for implemen-tation, training, and the collocation required early in the product developmentprocess to make the solution effective.
It is clear that the simulated to-be/as-is ratio is an important indicator of howweb-based communication tools could change product development cycle time.However, it does not answer questions of long-term consequences on the relation-ship between partners. That needs to be investigated through in-depth case studies.
5. Discussion and conclusionsTask-based DSM is one of very few tools for mapping and visualizing iterative
processes. From a DSM, it is easy to get a holistic view of a complex developmentprocess where �ow charts become too complicated.
In this method, processes are studied at a very detailed level. The WTM and theSTAR concepts are easy to use for process improvement simulations. The assump-tions made in the method are linearity and stability of the process and fully paralleltask execution. The parallel assumption may look severe but, as was found in practi-cal applications, that has a small in�uence on the �nal results given as TPT andSTAR. If these assumptions correspond to the actual process, the output providesgood guidance for further process development and improvement.
Predicting the impact of development process improvements 197
Suggested improvement TPTto-be TPTas-is(time units) (time units) STAR
Common project web 150 224 0.67
Table 4. STAR for suggested improvement: common project web.
10 Tools such as inter-organizational PDM systems are now becoming available on themarket (e.g. Eurostep’s Share-A-Space and PTC’s Windchill), and results pointing in thisdirection are being presented, e.g. by Boeing (Holly et al. 2000).

Of course, the method demands a detailed process map. One could argue thatthe main process improvements come from the knowledge gained from the processmapping itself, i.e. once the map exists, the suggestions for improvements becomeobvious.
On the contrary, it is the authors’ experience from process development that itis dif�cult to get the authority to implement major changes in an organization if itcannot provide an estimate of the payback on the investment. The STAR is such anestimate, since it quanti�es the impact from a suggested improvement on the overallprocess performance, expressed as reduction of total process time. Hence, it is agood tool for speeding up improvements.
AcknowledgementsThe authors would like to thank the sponsors and tutors at ENDREA (The
Swedish Engineering Design Research and Education Agenda) and IMIE (Inter-national Graduate School of Management and Industrial Engineering). They wouldalso like to thank cooperation partners ALSTOM Power (formerly ABB STAL),SAAB AB, Sundstrand Power Systems, and Microturbo SA.
The main research work for this paper was carried out during 1997–1998. Someof the material in this paper has previously been presented in Cronemyr et al. (1999),Cronemyr (2000) and Öhrwall Rönnbäck (1999). Peter Cronemyr contributed to theextension of the theory of WTM and the ABB application. Anna Öhrwall Rönnbäckcontributed to the Saab application. Steven D. Eppinger introduced DSM and WTMin an ENDREA doctoral student course and has guided this research work.
ReferencesABB STAL, 1997, The blade development process, Report, November.ANDERSSON, J.,POHL, J. and EPPINGER, S. D., 1998, A design process modelling approach incor-
porating non-linear elements. Procedings of the ASME Design Theory and Methodol-ogy Conference, 13–16 September, Atlanta, GA.
ANDREASEN, M. M. and HEIN, L., 1987, Integrated Product Development (London: IFS Publi-cation Ltd).
AUGUSTINE, N. R., 1983, Augustine’s Laws, and Major System Development Programs(Reston, VA: American Institute of Aeronautics and Astronautics).
BERGMAN, B., 1992, Industriell Försöksplanering och Robust Konstruktion (Industrial Designof Experiments and Robust Design) (Lund: Studentlitteratur) (in Swedish).
BERGMAN, B. and KLEFSJÖ, B., 1994, Quality from Customer Needs to Customer Satisfaction(Lund: Studentlitteratur).
CRONEMYR, P., 2000, Towards a learning organization for product development. LicentiateThesis, Division of Quality Technology and Management, Department of MechanicalEngineering, Linköping University, Linköping, Sweden
CRONEMYR, P., ÖHRWALL RÖNNBÄCK, A. and EPPINGER, S. D., 1999, Process improvementsimulations using the work transformation model. Proceedings of ICED99, 12th Inter-national Conference on Engineering Design, 24–26 August, Munich, Germany.
EPPINGER, S. D.,WHITNEY, D. E., SMITH, R. P. and GEBALA, D.A., 1994, A model-based methodfor organizing tasks in product development, Research in Engineering Design, 6(1),1–13.
EPPINGER, S. D., NUKALA, M. V. and WHITNEY, D. E., 1997, Generalized models of design iter-ation using signal �ow graphs, Research in Engineering Design, 9(2), 112–123.
HELPER, S., 1996, Incentives for supplier participation in product development. In ManagingProduct Development, edited by T. Nishiguchi (New York: Oxford University Press).
HILLIER, F. S. and LIEBERMANN, G. J., 1986, Introduction to Operations Research, 4th edition(Oakland, CA: Holden-Day).
198 P. Cronemyr et al.
HOLLY, M., COYLE, J. and KOSHIBA, D. A., 2000, The virtual product environment. Proceed-ings of the Global Product Devlopment, 6th Conference on Product Models, 6–7November, Linköping, Sweden.
LINNARSSON, A. and MOLIN, K.-Å., 1998, Prerequisites and enabling factors for successfulbuyer–supplier partnership. Master’s Thesis 1998: 23, Department of Management andEconomics, Logistics and Transport Systems, Linköping University, Sweden.
MACCORMACK, A., 1998, Towards a contingent model of product development: a compara-tive study of development practices. Proceedings of the 5th International ProductDevelopment Management Conference, 25–26 May, Como, Italy.
MCCORD, K. R. and EPPINGER, S. D., 1993, Managing the integration problem in concurrentengineering. MIT Sloan School of Management, Cambridge, MA, Working Paper,No. 3594.
MICROTURBO, 1998, Diagramme type d’initialisation d’un programme (P.A.Q. 5–8-A-51,Indice A), and Etapes et jalonnement du devéloppement produit (P.A.Q. 5–8-A-55,I.A.Q. 0–1-D-53).
ÖHRWALL RÖNNBÄCK, A., 1999, Collaborative product development and IT communicationinfrastructures — a study in the Swedish aerospace industry. Dissertation No. 33, Licen-tiate Thesis, International Graduate School of Management and Industrial Engineer-ing, Linköping University, Sweden.
PHADKE, M., 1989, Quality Engineering Using Robust Design (Englewood Cliffs, NJ: PrenticeHall).
PIMMLER, T. U. and EPPINGER, S. D., 1994, Integration analysis of product decompositions.Procedings of the ASME Conference on Design Theory and Methodology, Minneapo-lis, MN, pp. 343–351.
SAAB, 1998, Product development process, Draft 98.09.21, 21 September.SMITH, R. P. and EPPINGER, S. D., 1997, Identifying controlling features of engineering design
iteration, Management Science, 43(3), 276–293.SMITH, R. P. and EPPINGER, S. D., 1998, Deciding between sequential and concurrent tasks in
engineering design, Concurrent Engineering: Research and Applications, 6(1), 15–25.SMITH, P. G. and REINERTSEN, D. G., 1998, Developing Products in Half the Time, 2nd edition
(New York: John Wiley & Sons).STEWARD, D. V., 1981, The design structure system: a method for managing the design of
complex systems, IEEE Transactions of Engineering Management, EM-28(3), 71–74.SUNDSTRAND, 1993, MIL-STD-881B, Military Standard. Work Breakdown Structures for
Defense Material Items, AMSC F6914.ULRICH, K. T., and EPPINGER, S. D., 1995, Product Design and Development (New York:
McGraw-Hill).WHEELWRIGHT, S. C. and CLARK, K. B., 1992, Revolutionizing Product Development. Quantum
Leaps in Speed, Ef�ciency, and Quality (New York, NY: The Free Press).
Predicting the impact of development process improvements 199
