site-specific nutrient management - …...... of site-specific nutrient management. the primary goal...
TRANSCRIPT

Site-Specific Nutrient Management
For Nutrient Management Planning To Improve Crop
Production, Environmental Quality, and Economic Return
Written By:
Agustin Pagani, Post-Doctoral Fellow
John E. Sawyer, Professor
Antonio P. Mallarino, Professor
Department of Agronomy, Iowa State University
Developed in cooperation with:
Lara Moody, The Fertilizer Institute (TFI)
John Davis, Natural Resources Conservation Service
(USDA-NRCS)
Steve Phillips, International Plant Nutrition Institute (IPNI)
Funding provided by the USDA-NRCS and TFI.
… and justice for all
The U.S. Department of Agriculture (USDA) prohibits discrimination against its customers, employees, and
applicants for employment on the bases of race, color, national origin, age, disability, sex, gender identity,
religion, reprisal, and where applicable, political beliefs, marital status, familial or parental status, sexual
orientation, or all or part of an individual's income is derived from any public assistance program, or protected
genetic information in employment or in any program or activity conducted or funded by the Department.
(Not all prohibited bases will apply to all programs and/or employment activities.)
NRCS 001 May 2013

Introduction
Consistent use of nutrient management planning has been identified by USDA/NRCS as lacking on many
farms in the USA (Conservation Effects Assessment Project (CEAP), Assessment of the Effects of
Conservation Practices on Cultivated Cropland in the Upper Mississippi River Basin). It has also been
shown that all resource concerns are rarely achieved with a single conservation practice. Implementation
of site specific nutrient management planning to minimize nutrient loss, conservation practices to control
runoff, and practices to trap materials leaving the field should be utilized as a combination of efforts. In
combination, these practices have the ability to reduce agricultural non-point source pollution and to
enhance economically sustainable crop production. However, increased nutrient management practice
implementation requires increased producer awareness and well informed crop advisers.
A team of cooperating organizations and agencies that consists of The Fertilizer Institute (TFI), United
States Department of Agriculture Natural Resources Conservation Service (USDA/NRCS), International
Plant Nutrition Institute (IPNI), and Iowa State University (ISU) worked together to bring expertise and
coordinated outreach in an effort to help producers increase implementation of site-specific nutrient
management. The primary goal of this effort was to increase awareness of site-specific nutrient
management and concurrent benefits to crop production, environmental quality, and economic return.
With such understanding, the number of production acres implementing site specific nutrient management
planning is expected to increase the effective and efficient use of nutrients for crop production.
The specific objectives were to: 1) develop an education program, that when implemented, will provide
service providers (NRCS employees, Certified Crop Advisers (CCAs), Third Party Service Providers
(TSPs), retail fertilizer personnel) and producers with enhanced knowledge about site specific nutrient
management planning; 2) develop a set of educational materials to support nutrient management
education programs; and 3) develop educational materials for service providers to support producer
education programs.

Introduction|2
An essential component of the effort was to provide this overview document that outlines the components
of soil fertility and nutrient best management. Topics include the 4R nutrient stewardship; soil fertility
and plant nutrition overview; nutrient management, including nitrogen, phosphorus, potassium, sulfur,
calcium and magnesium, micronutrients; soil pH and liming; soil sampling; and integrated economic and
environmental nutrient management.
Having worked together as a cooperating group, the hope is that developed education materials and
training curricula will serve as a multiplier of efforts and enhance the variety of groups and number
of individuals reached to ultimately increase the number of production acres implementing site
specific nutrient management planning. The end result, through increased understanding and
implementation of site specific nutrient management planning, will be a benefit to water and air quality as
well as production sustainability.

Chapter 1: Overview of soil fertility, plant nutrition, and nutrient management
Agustin Pagani, John E. Sawyer, and Antonio P. Mallarino / Department of Agronomy, Iowa State University Developed in cooperation with Lara Moody, TFI; John Davis, NRCS; and Steve Phillips, IPNI.
Funding provided by the USDA Natural Resources Conservation Service (USDA-NRCS) and the Fertilizer Institute (TFI).
Introduction
Understanding the principles of soil fertility is vital to efficient nutrient management, crop production, as
well as environmental protection. There are 17 chemical elements known to be essential for plant growth,
and 14 of these elements come from the soil (Table 1). Each essential plant nutrient is needed in different
amounts by the plant, varies in mobility within the plant, and varies in concentration in harvested crop
components. It is useful to know the relative amount of each nutrient that is needed by a crop and the
relationship to amounts removed with crop harvest.
Table 1. Essential plant elements, source, roles, and relative quantities in plant.
Element Source Role in Plant Concentration
Carbon (C ) Air Constituent of carbohydrates; necessary for photosynthesis
45%
Oxygen (O) Air/Water Constituent of carbohydrates; necessary for respiration
45%
Hydrogen (H) Water Maintains osmotic balance; important in many biochemical reactions; constituent of carbohydrates
6%
Nitrogen (N) Air/Soil Constituent of amino acids, proteins, chlorophyll, and nucleic acids;
1-5%
Potassium (K) Soil involved with photosynthesis, carbohydrates translocation, protein synthesis
0.5-1%
Phosphorous (P) Soil
Constituent of proteins, coenzymes, nucleic acids, and metabolic substrates; important in energy transfer
0.1-0.5%

Chapter1:Overviewofsoilfertility,plantnutrition,andnutrientmanagement|2
Element Source Role in Plant Concentration
Magnesium (Mg) Soil Enzyme activator; component of chlorophyll 0.1-0.4%
Sulfur (S) Soil Component of certain amino acids and plant proteins
0.1-0.4%
Chlorine (Cl) Soil Involved with oxygen production and photosynthesis
0.01-0.1%
Iron (Fe) Soil Involved with chlorophyll synthesis and in enzyme electron transfer
50-250ppm
Manganese (Mn) Soil Controls several oxidation-reduction systems and photosynthesis
20-200ppm
Boron (B) Soil Important in sugar translocation and carbohydrates metabolism
6-60ppm
Zinc (Zn) Soil Involved with enzymes that regulate various metabolic activities
25-150ppm
Copper (Cu) Soil Catalyst for respiration; component of various enzymes
5-20ppm
Molybdenum (Mo)
Soil
Involved with nitrogen fixation and transforming nitrate to ammonium
0.05-0.2ppm
Nickel (Ni)
Soil
Necessary for proper functioning of urease and seed germination
0.1-1ppm
To be classified as essential, the element needs to meet the following criteria:
1. The plant cannot complete its life cycle (seed to new seed) without it.
2. The element’s function cannot be replaced by another element.
3. The element is directly involved in the plant’s growth and reproduction.
Non-mineral nutrients
Three elements, carbon (C), hydrogen (H), and oxygen (O), are non-mineral nutrients because they are
derived from air and water, rather than from soil. Although they represent approximately 95% of plant
biomass, they are generally given little attention in plant nutrition because they are always in sufficient
supply. However, other factors such as soil management and the environment can influence the
availability and crop growth response.
Mineral nutrients
The 14 mineral nutrients are classified as either macronutrients or micronutrients based on their plant
requirements and relative fertilization need. There are six macronutrients: nitrogen (N), phosphorus (P),

Chapter1:Overviewofsoilfertility,plantnutrition,andnutrientmanagement|3
potassium (K), calcium (Ca), magnesium (Mg), and sulfur (S). The macronutrients, N, P, and K, are often
classified as ‘primary’ macronutrients, because deficiencies of N, P, and K are more common than the
‘secondary’ macronutrients, Ca, Mg, and S. The micronutrients include boron (B), chlorine (Cl), copper
(Cu), iron (Fe), manganese (Mn), molybdenum (Mo), nickel (Ni), and zinc (Zn). Most of the
macronutrients represent 0.1 - 5%, or 100-5000 parts per million (ppm), of dry plant tissue, whereas the
micronutrients generally comprise less than 0.025%, or 250 ppm, of dry plant tissue (Table 1).
Plant uptake of nutrients
Each nutrient cannot be taken up by plants in its elemental form, but instead is taken up in an ‘ionic’ or
charged form, with the exception of B as boric acid which is uncharged (Table 2). Most fertilizers are
made up of combinations of these available nutrient forms, so when the fertilizer dissolves, the nutrients
can be immediately available for uptake. Knowing what form of a nutrient the plant absorbs helps us to
better focus on what controls the cycling and movement of that nutrient in soil. In addition, understanding
nutrient functions and mobility within the plant are useful in diagnosing nutrient deficiencies.
Table 2. Nutrient forms taken up by plants.
Element Form
Nitrogen (N) NO3- (nitrate), NH4
+ (ammonium)
Potassium (K) K+
Phosphorous (P) H2PO4-, HPO4
-2 (phosphate)
Calcium (Ca) Ca+2
Magnesium (Mg) Mg+2
Sulfur (S) SO4-2 (sulfate)
Chlorine (Cl) Cl- (chloride)
Iron (Fe) Fe+2 (ferrous), Fe+3 (ferric)
Manganese (Mn) Mn+2
Boron (B) H3BO3 (boric acid), H2BO3- (borate)
Zinc (Zn) Zn+2
Copper (Cu) Cu+2
Molybdenum (Mo) MoO4-2 (molybdate)
Nickel (Ni) Ni+2

Chapter1:Overviewofsoilfertility,plantnutrition,andnutrientmanagement|4
Nutrient uptake by roots is dependent on the activity of the root, ability to absorb nutrients, and the
nutrient concentration at the surface of the root. Roots come directly in contact with some nutrients
(called ‘root interception’) as they grow; however, this only accounts for a very low percentage of the
total amount of nutrients taken up by plants. Therefore, other mechanisms must cause the movement of
nutrients to the plant.
Water moves toward and into the root as the plant uses water, or transpires. This process, called ‘mass
flow’, accounts for a substantial amount of nutrient movement toward the plant root, especially for the
mobile nutrients such as NO3-. Specifically, mass flow has been found to account for about 80% of N
movement into the root system of a plant, yet only 5% of the more immobile P. It has been found that
‘diffusion’ accounts for the remainder of the nutrient movement.
Diffusion is the process where chemicals move from an area of high concentration to an area of low
concentration. By fertilizing near the plant root, the plant is less dependent on exchange processes and
diffusion to uptake nutrients, especially P. The nutrients that are most dependent on diffusion to move
them toward a plant root are relatively immobile, have relatively low solution concentrations, and yet are
needed in large amounts by the plant, such as P and K. The secondary macronutrients (Ca, Mg, S) often
do not depend on diffusion because their solution concentrations are fairly high in soil relative to plant
requirements.
Nutrient mobility within the plant
All nutrients move relatively easily from the root to the growing portion of the plant. Interestingly, some
nutrients can also move from older tissue to newer tissue if there is a deficiency of that nutrient. Knowing
which nutrients are ‘mobile’ (i.e., more able to move) is very useful in diagnosing plant nutrient
deficiencies because if only the lower leaves are affected, then a mobile nutrient is most likely the cause.
Conversely, if only the upper leaves show the deficiency, then the plant is likely deficient in an 'immobile'
(i.e., less able to move) nutrient, because that nutrient cannot move from older to newer tissue (leaves).
Table 3 lists the six mobile and eight immobile mineral nutrients. Sulfur is one element that lies between
mobile and immobile elements depending on the degree of deficiency.
Table 3. Mobile and immobile nutrients in plants.
Mobile nutrients Immobile nutrients
Nitrogen (N) Sulfur (S)
Phosphorous (P) Calcium (Ca)
Potassium (K) Iron (Fe)

Chapter1:Overviewofsoilfertility,plantnutrition,andnutrientmanagement|5
Mobile nutrients Immobile nutrients
Chloride (Cl) Zinc (Zn)
Magnesium (Mg) Manganese (Mn)
Molybdenum (Mo) Boron (B)
Copper (Cu)
Nickel (Ni)
Timing of nutrient uptake
Nutrient uptake does not necessarily match plant growth or the most critical need. For example, when
corn growth represents 50% of its total mature biomass, it has accumulated approximately 100% of its
mature K, 60% of its N, and 55% of its P (Figure 1). Phosphorus, for example, is critical for early cell
division and multiplication when the amount absorbed is very small. Therefore, supplying sufficient K
early in a crop’s growing season is likely more important than during the middle of the growing season.
However, late in the growing season, nutrients accumulate in the grain rather than in the leaves or stalk.
Therefore, mid-season nutrient application may increase both quality and grain yield if other plant
requirements are met, such as water. For example, N topdressed at tillering has been found to increase
both yield and protein of winter wheat, especially at low soil N levels. Therefore, it is important to
understand nutrient needs and timing of nutrient uptake for each crop that you’re working with.
Days after emergence
Rel
ativ
e A
ccu
mu
lati
on
(%
)
0
20
40
60
80
100
PotassiumNitrogenPhosphorusDry Matter
Figure 1. Schematic accumulation patterns of K, N, P, and dry mater in corn.

Chapter1:Overviewofsoilfertility,plantnutrition,andnutrientmanagement|6
Nutrient response function
In Figure 2, yield is severely affected when a plant nutrient is deficient, and when the nutrient deficiency
is corrected, yield increases rapidly (Zone A) until the critical range of plant nutrient concentration is
reached and yield is maximized. Nutrient sufficiency occurs over a wide concentration range, where yield
is unaffected (Zone C). Increases in nutrient concentrations (by fertilizer application) above the critical
range indicate that the plant is absorbing nutrients above that needed for maximum yield, commonly
called luxury consumption. Elements absorbed in excessive quantities can reduce plant yield directly
through toxicity or indirectly by reducing concentrations of other nutrients below their critical ranges
(Zone D). The minimum amount of fertilizer required to maximize crop yield is called the optimum
physical rate or agronomic optimum rate (AOR) and it is located within Zone C. Even though the exact
relationship between crop yield and nutrient rate will vary, the general shape of this relationship is
relatively consistent for many crops and nutrients.
Nutrient Rate (lb/acre)
Cro
p Y
ield
(b
u/a
cre)
Zone A
Zone D
Zone C
Maximum efficiency
Zone B
Figure 2. Relationship between crop yield and essential nutrient application rate.
Adequate nutrient supply, from the soil or applied nutrient, is vital to soil fertility and crop production. A
limited supply of one of the essential nutrients can limit crop yield, although other factors such as another
nutrient, light, heat, or water can also limit yield. The concept that a certain sufficiency level of a nutrient
will limit plant growth or yield to a certain level independently of levels of other nutrients or growth
factors is known as the ‘law of the minimum’. Nitrogen and water are known as closely following this
principle. On the other hand, insufficient supply of other nutrients (such as P and K, for example) tend to

Chapter1:Overviewofsoilfertility,plantnutrition,andnutrientmanagement|7
limit growth or yield to a certain proportion of the potential maximum depending on sufficiency levels of
other growth factors. Therefore, how different nutrients behave according to these principles generally
influence the degree and type of interactions between nutrients and with other growth factors. Although N
is usually the first limiting nutrient for non-legume crops, without adequate supply of other nutrients, N
use efficiency (NUE) suffers. For example, increased N uptake and utilization with adequate K means
improved NUE and higher yields. Figure 3 shows how corn yield and NUE were increased by fertilizer K
application to a deficient soil, resulting in improved economic and environmental benefits.
N Rate (lb/acre)
Co
rn Y
ield
(b
u/a
cre)
HighMediumLow
K Availability
Figure 3. Potassium improves yield response to N fertilizer and N use efficiency.
Nutrient diagnostic methods: correlation, calibration, and interpretation
Nutrient diagnostic methods are tools for determining plant nutrient needs. They can include soil testing,
plant analysis, crop sensor readings, etc. The development of a diagnostic method for a given nutrient has
historically involved three steps: 1) selecting a soil/plant extractant or methodology to measure any crop
characteristic related to plant nutrition, 2) correlation of the value of any of these methods with the
amount of nutrient taken up by plants, and 3) calibrating the value in terms of its effect on some desirable
crop characteristic, usually yield of marketable product. Fertilizer recommendations are then based on
interpretation of calibration data and fertilizer response curve (Figure 2).
No matter how good a chemical method of analysis, a soil/plant test value is meaningless unless it can be
related to the nutrient status of the soil and sufficiency for a specific crop in order to apply a corrective
soil amendment or fertilizer treatment. A single numerical value reported by a soil test (say 11 ppm for P)
has no meaning unless information is gathered to evaluate (1) what tat value means concerning growth

Chapter1:Overviewofsoilfertility,plantnutrition,andnutrientmanagement|8
and/or yield level in relation to the amount needed to maximize growth or yield, (2) whether crop growth
or yield will be greater when the nutrient is added to the soil and how much greater , and (3) the amount
of nutrient needed for the crop to attain better growth or yield in different soils and for different crops at
different test levels.
A combination of correlation and calibration research is necessary to gather information needed to answer
these questions. Correlation is a relationship between the amount of nutrient extracted from soil by a
laboratory test and nutrient uptake by plants and/or crop yield in the greenhouse or field. If such a
relationship cannot be established, the analytical procedure has little or no usefulness. Sometimes the
relationship can be established for only one nutrient and one crop, and on a particular group of soils. This
is a limitation that the producer must know and recognize, and the soil test should only be used for those
specific conditions. For example, useful correlations have been established between the Bray-1 P test and
percent of maximum yield for different crops in many states. These correlations help determine when soil
test P is adequate for maximum yields—when no response from additional fertilizer is expected. Different
crops such as wheat, corn, and soybean vary in their response to the amount of P in the soil (Figure 4).
Yields of both corn and soybean change rapidly with small differences in soil test P. Winter wheat
requires higher levels of soil P to attain maximum yields. Because of crop differences, soil test correlation
research must be conducted with a large number of crops.
Soil P Availability (ppm)
Rel
ativ
e Y
ield
20
40
60
80
100
WheatCornSoybean
Figure 4. Different crop responses from different soil Bray-1 P levels.

Chapter1:Overviewofsoilfertility,plantnutrition,andnutrientmanagement|9
Calibration establishes the relationship between a given soil/plant test value and the yield response from
an addition of the fertilizer nutrient to the soil. Figure 5 represents a general example of this relationship.
From crop yield responses, one can determine the amount of fertilizer needed over a range of test levels
for many soils where a given crop is grown.
Soil Nutrient Availability
Cro
p R
esp
on
se t
o
a G
iven
Nu
trie
nt
Low application rateHigh application rate
Figure 5. Crop yield response to a low and high rate of a given
nutrient as related to the original soil nutrient level.
After field correlation-calibration experiments have been conducted, soil test levels of a given nutrient
can be placed into categories related to the magnitude and probability of yield response. These categories
give quick insight to fertilizer decisions. Their general meaning is given in Table 4 in terms of the
probability of a yield increase due to fertilizer application. This explanation illustrates much of the basic
science behind using correlation-calibration to develop fertilizer recommendations, especially for
nutrients considered immobile in the soil (such as P and K).

Chapter1:Overviewofsoilfertility,plantnutrition,andnutrientmanagement|10
Table 4. Probability of a crop yield increase due to nutrient fertilizer application.
Nutrient Index Level Meaning of Index Level for Crops
Very low
Applying the nutrient will be beneficial over 80% of the time.
Low
Applying the nutrient will be beneficial 65% of the time.
Optimum
Applying the nutrient has about 5% chance of being beneficial in growth or yield.
High Applying the nutrient will be beneficial less than <1% of the time.
Nutrient Management
Nutrient management involves managing all crop fertility inputs and other production practices to achieve
efficient crop growth and water quality protection. Nutrient management plans for site-specific situations
should minimize undesired environmental effects while optimizing whole-farm profits and production.
The term "nutrient management" is most often associated with animal manure management, but applies to
all crop fertility inputs whether manure, organic by-products, amendments, or commercial fertilizers.
What is Nutrient Management Planning?
Nutrient management planning principles are basic, and like sound fundamentals necessary for any good
business management. They involve:
• Knowing what you have
• Knowing what you need
• Managing properly
• Documenting practices and outcomes
Nutrient management plans must be site-specific, tailored to the soils, landscapes, and management
objectives of the farm. In effect, nutrient management planning is much like developing a cash-flow
analysis, but using nutrients instead of dollars, although dollars and environmental impacts also should
be considered.

Chapter1:Overviewofsoilfertility,plantnutrition,andnutrientmanagement|11
Steps in Nutrient Management Planning
1. Obtain accurate soil information for each field or management unit. This could be use of existing NRCS soil maps or require a new farm soil map. Soil samples should be obtained and analyzed according to recognized soil fertility sampling and analytical procedures.
2. Estimate crop yield potential based on soil productivity and intended management. It is impossible to foretell growing seasons, but average yields over last four to six years should provide a reasonable estimate. It is important to be realistic.
3. Calculate plant nutrient applications required. Nutrient recommendations and harvest removal information for common crops are available from the NRCS, local Extension offices, and University soil fertility publications and web sites. It is important to distinguish between nutrient recommendations for specific situations, crop uptake or use by the growing crop, and crop removal which is the physical removal of nutrients from the field with harvesting.
4. Determine the plant-available nutrients in any livestock manure or other by-product amendments that are available for application.
5. Estimate any applicable residual nutrient contributions from fertilizer or manures applied in previous seasons.
6. Determine need for purchase of off-farm nutrients, such as fertilizer or manure.
7. If necessary, use an applicable environmental risk assessment tool, for example the Phosphorus Index (PI), to determine the potential for offsite movement of nutrients on a field-by-field basis. The PI, for example, incorporates several site specific soil conditions and conservation practices; soil test phosphorus level, soil permeability, field slope, manure and fertilizer applications, distance to surface water, and other factors are used to determine the probability of phosphorus movement in the landscape.
8. Apply animal manures and commercial fertilizers to supply nutrients when needed using practices that ensure high use efficiency, such as right source, rate, timing, and placement.
9. Keep records of nutrient sources, application dates, rates, and methods.
Nutrient Management Planning Summary
• Know the soils and fields of your farm
• Be realistic about crop production goals
• Determine nutrient levels and application needs
• Determine all farm-level nutrient resources available
• Assess environmental risks from nutrient applications
• Apply nutrients using sound nutrient management and cropping practices
• Keep field records

Chapter1:Overviewofsoilfertility,plantnutrition,andnutrientmanagement|12
Summary
Managing crop nutrients goes beyond soil fertility basics and decisions for single nutrients or application
needs for single fields. Nutrient management should encompass the entire production enterprise, which
can be comprised of crops and livestock, and should include recognition of all nutrient inputs and outputs
from the farming enterprise. Flows of nutrients to, within, and from the enterprise should be identified to
provide best management in regard to economic and environmental concerns. Such flows can include
fertilizer purchases, manure production, manure purchases, crop harvest and sales, and crop harvest and
feeding on farm. While nutrient balance is not a necessity, avoiding nutrient deficiency or excesses helps
provide greatest economic return. Coupled with soil management practices, enterprise nutrient
management also helps provide longevity of soil productivity and environmental stewardship; both of
which are important for future generations use of land and water. With the continual changing of
production practices and increasing needs from crop production (such as biomass for feed, bedding, and
energy), continual monitoring and adaption is needed to maintain nutrient management stewardship.
Chapter 2: Nitrogen Management
Agustin Pagani, John E. Sawyer, and Antonio P. Mallarino / Department of Agronomy, Iowa State University Developed in cooperation with Lara Moody, TFI; John Davis, NRCS; and Steve Phillips, IPNI. Funding provided by the USDA Natural Resources Conservation Service (USDA-NRCS) and the Fertilizer Institute (TFI).
Introduction
Nitrogen (N) is essential for plant growth and is part of every living cell. It plays many roles in plants and
is a component of chlorophyll, which is necessary for photosynthesis. Symptoms of N deficiency in plants
generally include chlorosis or yellowing. Nitrogen is typically taken up in larger amounts than other
nutrients and is the most common, and most important, limiting nutrient for non-legume agricultural
crops. Not only does N nutrition affect yield, but it also affects the quality (protein or sugar content) of
crops such as grain and sugar beets, for example. In addition, N also has interaction implications with
efficient use of other nutrients. To understand how N management (cropping systems, N fertilizer forms,
application rates, and timing of N fertilization) affects crop yield and quality, it is important to first
understand the various processes that N undergoes in the soil-plant system.
Basic nitrogen processes in the soil-plant system
Nitrogen, present or added to the soil, is subject to several changes (transformations) and gain/loss
mechanisms that dictate the availability of N to plants and influence potential N-related environmental
issues. These processes are listed and briefly described in Table 1. As is demonstrated by the extensive
list, N cycling in the soil-plant system is complex, which increases the difficulty for N management.
Chapter2:NitrogenManagement|2
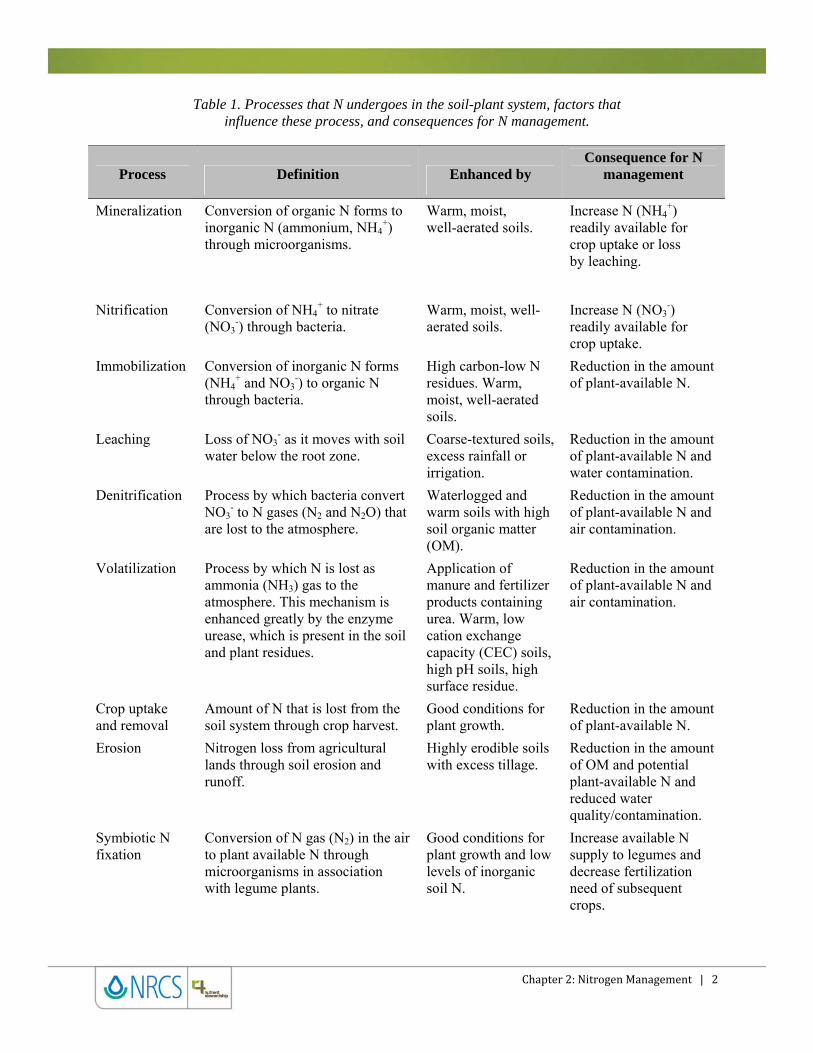
Table 1. Processes that N undergoes in the soil-plant system, factors that influence these process, and consequences for N management.
Process Definition Enhanced by Consequence for N
management
Mineralization Conversion of organic N forms to inorganic N (ammonium, NH4
+) through microorganisms.
Warm, moist, well-aerated soils.
Increase N (NH4+)
readily available for crop uptake or loss by leaching.
Nitrification Conversion of NH4+ to nitrate
(NO3-) through bacteria.
Warm, moist, well-aerated soils.
Increase N (NO3-)
readily available for crop uptake.
Immobilization Conversion of inorganic N forms (NH4
+ and NO3-) to organic N
through bacteria.
High carbon-low N residues. Warm, moist, well-aerated soils.
Reduction in the amount of plant-available N.
Leaching Loss of NO3- as it moves with soil
water below the root zone. Coarse-textured soils, excess rainfall or irrigation.
Reduction in the amount of plant-available N and water contamination.
Denitrification Process by which bacteria convert NO3
- to N gases (N2 and N2O) that are lost to the atmosphere.
Waterlogged and warm soils with high soil organic matter (OM).
Reduction in the amount of plant-available N and air contamination.
Volatilization Process by which N is lost as ammonia (NH3) gas to the atmosphere. This mechanism is enhanced greatly by the enzyme urease, which is present in the soil and plant residues.
Application of manure and fertilizer products containing urea. Warm, low cation exchange capacity (CEC) soils, high pH soils, high surface residue.
Reduction in the amount of plant-available N and air contamination.
Crop uptake and removal
Amount of N that is lost from the soil system through crop harvest.
Good conditions for plant growth.
Reduction in the amount of plant-available N.
Erosion Nitrogen loss from agricultural lands through soil erosion and runoff.
Highly erodible soils with excess tillage.
Reduction in the amount of OM and potential plant-available N and reduced water quality/contamination.
Symbiotic N fixation
Conversion of N gas (N2) in the air to plant available N through microorganisms in association with legume plants.
Good conditions for plant growth and low levels of inorganic soil N.
Increase available N supply to legumes and decrease fertilization need of subsequent crops.

Chapter2:NitrogenManagement|3
A good knowledge of these processes and their interactions helps with understanding the underlying
principles for optimal N management practices, from both the production and environmental perspectives.
Many years of research and experience by crop producers and advisers have resulted in valuable tools to
aid in determining when, how, where, and how much N to apply to crops. For example, tools include
fertilization rate guidelines, analysis of soils and plant tissues, chlorophyll meter (CM) and crop canopy
sensing for plant N stress, site-specific technologies, and economic evaluation of N management practices
and fertilization recommendations.
Rate determination and economic response
Nitrogen fertilization rate is the most important N management decision regarding potential to achieve
optimum crop yield, influence nitrate loss to water systems, and return maximum economic profitability.
Nitrogen fertilizer price volatility has increased in recent years, and continues to be one of the most
expensive variable production costs. For cereal crops, N fertilization is required to achieve acceptable
production levels. Several terms or acronyms are important to be understood in relation to yield response
to N and economic returns. The term “Agronomic Optimum N Rate” or AONR defines the N rate that
will produce maximum grain yield, regardless of cost. The term “Economic Optimum N Rate” or EONR
defines the N rate that will result in the maximum economic return to N, the point where the last
increment of N just pays for the applied N. The recently developed recommendation approach “Maximum
Return to N” or MRTN is similar to EONR and defines the maximum response rate and an N rate range
within a set economic return level from the maximum return (within $1/acre). The MRTN is derived
directly from a population or database of N response research trials. The EONR, and MRTN rates are less
than the AONR, will decrease as N prices increase relative to crop price, increase as grain prices increase
relative to N price, and remain the same if the ratio between N and grain prices remains the same even
though prices change. These economic rate determination approaches require yield response data from
numerous field trials documenting yield responses to N fertilizer rates across different soil types, growing
seasons, crop rotations, genotypes, tillage systems, etc.
Figure 1 depicts a low corn grain yield when no N is applied, and a large increase in yield with N
application. The challenge is to identify application rates that allow for maximum economic net return
without over- or under-fertilization for different conditions. In Figure 1, the blue points indicate the
EONR. Due to the need to pay for the fertilizer input, recommended rates are less than the rate to produce
maximum yield (indicated by the vertical lines). They are close to the rates that result in the maximum
yield, however, and in the example the yield for the EONR is 98% of agronomic maximum yield. One
can also see the influence of the prior crop on crop response to N and yield. For example, the EONR is

Chapter2:NitrogenManagement|4
170 lb N/acre for corn following corn (CC) and 123 lb N/acre for corn following soybean (SC), with an
approximate 15% higher yield for the rotated corn.
N Rate (lb/acre)
0 50 100 150 200 250
Co
rn Y
ield
(b
u/a
cre)
0
50
100
150
200
Corn Following CornCorn Following Soybean
Figure 1. Nitrogen rate response of corn following corn and corn following soybean in Iowa. The vertical lines indicate the agronomic optimum N rate (AONR)
and the blue points the economic optimum N rate (EONR). J.E. Sawyer, Iowa State University.
Applying “more than enough N” is no longer a safe and cheap “insurance”; certainly not as it once was
due to the increased cost of N fertilizers. Also, applying “more than enough N” is not environmentally
friendly and, therefore, must be avoided. High N fertilizer costs, uncertainty about crop process, and
environmental impacts should encourage growers to critically determine N application rates. Figure 2
shows how nitrate-N loss increases as N rate increases beyond the optimum N. This concept applies for
all crops fertilized with N and most production scenarios, which highlights the importance of accurately
determining the optimum N rate to maximize profitability and minimize environmental impacts within
specific crops and production systems. In spite of much research, this is much easier to say than actually
achieved in production fields due to the numerous and unpredictable factors that affect the optimum N
rate and the crop response to applied N.

Chapter2:NitrogenManagement|5
N Rate (lb/acre)
0 50 100 150 200 250
Net
Ret
urn
to
N (
$/ac
re)
0
50
100
150
200
250
Nit
rate
-N (
mg
/L)
0
5
10
15
20
25
Net Return to NNitrate-N
Economic Optimum N Rate
Figure 2. Importance of using optimum N rates for greatest profit and minimizing nitrate-N loss (via subsurface tile drainage).
The common N rate recommendation system used in cereal crops for many years in the Midwest USA
and other regions was a yield-goal based factor. This approach uses expected crop yield as the criterion
for determining N rates; the higher the expected crop yield the greater is the N requirement, and
presumably the recommended N rate. For example, N recommendations for wheat in Ohio have been
based on this rate equation: 40 + [1.75 x (yield potential - 50)] (mineral soils, with 1 to 5% organic matter
and adequate drainage). The equation indicates that a realistic yield goal should be the first place in which
to consider rate adjustment. For example, if the yield goal has been targeted at 100 bu/acre but yield has
actually been 80 bu/acre, then the crop has received 35 lb/acre each year that were not needed for grain
yield production and therefore prone to be lost.
This yield-goal recommendation approach is still the recommendation system in some regions and some
crops (for example, irrigated corn in Nebraska). In the Midwest USA, however, research for corn and
other grain crops has identified a poor correlation between individual site-year crop yield and EONR, and
that the EONR for a specific soil do not necessarily change with yield level. Figure 3 shows an example
of this issue for corn in Iowa, but similar results can be found for other regions and crops. At issue is the
concern of too high or low calculated N recommendations when based on yield goals. Therefore, some
university N recommendation systems have moved away from yield-based systems to N response data-
driven recommendations that are sensitive to N and grain prices. In the Midwest USA this approach is

Chapter2:NitrogenManagement|6
called MRTN, Maximum Return To N. Economic-based approaches are not new; however, this particular
approach links documented yield responses to N rate from recent research trials directly with the relative
economics of grain price and N cost.
N Rate (lb/acre)
0 50 100 150 200 250 300
Gra
in Y
ield
(b
u/a
cre)
0
50
100
150
200
250
300
Figure 3. Relationship between net return to N and applied N rate for corn after soybean in Iowa. J.E. Sawyer, Iowa State University.
An important aspect of the data-driven approach is the need for current N response trials. This is an issue
with all recommendation systems, that is, keeping current with changing cropping practices and
environmental conditions. It is also important to utilize rate recommendations derived from research in
representative geographic areas and cropping systems as needed fertilization rates vary based on soils,
climatic conditions, and crops grown.
Soil testing and rate adjustment
Soil testing for relatively “immobile” nutrients, like phosphorus and potassium, is commonplace in most
production systems. With the importance of N fertilization, and the difficulty in rate prediction, one
would assume that soil testing would be as widely used for N management as is for other nutrients.
However, soil sampling and testing for N is less used, and often works best only in certain geographic
regions and crops. The reason for limited use is due to the many and rapid processes that influence N in
soil, such as change in inorganic N forms and levels, especially in humid regions, variation in net N
mineralization rate and prediction of that rate, and nitrate losses after measurement. The limited use of

Chapter2:NitrogenManagement|7
soil N testing is also related to the time required for sampling/analysis and the desire for rapid results, for
example when adjusting sidedress N applications. There are two general soil N test sampling approaches
used, with both based on soil nitrate. One is post-harvest/preplant sampling and the other is in-season
sampling.
Preplant soil sampling
Post-harvest or preplant soil sampling is based on determination of the profile (rooting zone) soil nitrate-
N amount. This is either determined directly by sampling the rooting depth or by sampling a shallower
depth and then predicting the amount for a deeper profile. Usually only nitrate-N is measured, and not
ammonium-N as ammonium is converted quickly to nitrate and the measurement is attempting to find
residual inorganic N from mineralization or unused fertilizer which would be predominately nitrate. In
humid regions (like the Midwest, Eastern, and Southern USA), leaching and denitrification typically
cause soil profile nitrate levels to change rapidly and therefore be unreliable as an adjustment to
application rates for subsequent crops. Profile nitrate sampling/testing is more reliable and useful in dry
climates (for example the northern Great Plains area) and areas where soils remain frozen for much of the
time between fall harvest and spring planting (for example the upper Midwest).
Preplant profile sampling systems account for the amount of nitrate-N. The amount of nitrate-N is
subtracted from the general recommended rate to arrive at the amount of fertilizer N to apply. This is
illustrated in Figure 4. In some systems a baseline amount of nitrate is assumed, so the amount measured
is adjusted downward for that baseline before determining the fertilizer rate to apply.

Chapter2:NitrogenManagement|8
Preplant Nitrate-N
N r
ate
to A
pp
ly
Figure 4. General relationship between N fertilization rate and preplant soil nitrate-N content.
The depth of soil sample and the depth increments separated for nitrate analysis are determined by local
research and cropping system needs. Fall profile sampling may be to the rooting depth, up to four or five
feet, or more shallow for spring preplant profile sampling (often 2- to 3-ft sample). In Montana, for
example, fertilizer guidelines for spring wheat consider the total of amount of nitrate-N (2-ft soil depth) in
the spring and a general estimate of fertilizer N needed. Then specific fertilizer rates for a field are
calculated by subtracting the measured nitrate-N from the recommendation. For example, if the spring
wheat yield potential is 50 bu/acre (the recommended total N is 165 lb N/acre for that yield), and if the
preplant 2-ft depth soil nitrate-N measured is 40 lb N/acre, then the fertilizer rate to apply is 165 – 40 =
125 lb N/acre.
In-season soil sampling
The objective of in-season sampling is not to quantify the total inorganic N present in the soil rooting
profile, but to develop an index of N availability that integrates residual inorganic-N and springtime
mineralized N up to the sampling time. Soil samples are collected prior to the maximum crop N uptake
period, and allowing for time to make needed N applications. For example, the nitrate-N concentration
determined in soil samples collected in corn at V6 (when plants are 6 to 12 inches tall) or in winter cereals
at tillering has been related through research with crop yields and EONR. This type of test goes by
different names depending on the region and intent. A test for corn, for example, in some regions is

Chapter2:NitrogenManagement|9
known as the pre-sidedress nitrate test (PSNT) while in other states is referred to as the late-spring nitrate
test (LSNT). For both, the soil is sampled to a one-foot depth and analyzed for nitrate-N concentration
when corn is 6 to 12 inches tall. The test is calibrated for a specific sample time, crop, and region. That is,
the nitrate concentration (index) is evaluated against relative yield and fertilization rate requirement for
specific situations (general example in Figure 5).
Pre Sidedress N Test
N r
ate
to A
pp
ly
Figure 5. Generic relationship between economic optimum N rate and in-season soil N, i.e. PSNT in corn or soil N at late tillering in small grain cereals.
Use of locally developed critical values is important as the soil, environment, and crop influence the
relationship between soil nitrate concentration and crop response to N application. Also, states may have
specific adjustments for test interpretation based on situations such as previous legume crop, manure
application, and springtime rainfall amount. For the PSNT or LSNT in corn, for example, is
approximately 20 to 25 ppm nitrate-N. There may be some states or regions that include ammonium-N in
addition to nitrate-N in specific situations, such as soils amended with organic wastes (manure, sewage
sludge, etc.), where ammonium plus nitrate analysis may improve prediction of in-season N responses
compared to nitrate alone.
The N-fertilizer need is calculated by subtracting the measured concentration of soil-test nitrate-N from
the previously determined critical concentration and then multiplying the result by a factor, or using a
table where the N rate recommendation is reduced as the test concentration increases. In Iowa, for
example, the difference between the test result and the critical value for the LSNT is multiplied by 8

Chapter2:NitrogenManagement|10
because studies have shown that it generally takes 8 lb N/acre to increase the soil-test nitrate-N by 1 ppm.
For example, if a soil tests 15 ppm and the critical concentration is 25 ppm, then the fertilizer
recommendation would be 80 lb N/acre [(25 ppm – 15 ppm) x 8 = 80 lb N/acre.
Chlorophyll/Canopy Sensing and Plant Sampling
Plant N sufficiency/stress sensing offers a relative new approach to determine crop N status and manage
in-season fertilizer applications. The concept is to have the plant assess the supply of plant-available soil
N, and show potential deficiency through reduced plant growth and coloration. Instead of a soil test, the
plant is the used as the integrator of soil N supply with plant need. Adequate crop growth is needed in
order for the plant to have significant N uptake and have potential to show N deficiencies; and then time
is needed to make N rate decisions, apply N, and have the crop respond to that N. Cereal crops take up N
rapidly beginning at specific growth stages (V6-V8 in corn and late tillering in small grains for example).
Since the objective is to detect and correct N deficiency in time for adequate yield recovery, N stress
sensing may begin at those growth stages. If there is no expression of N deficiency, then the sensing
either misses later season development of deficiency or none exists in the field.
Plant sampling with N analysis is infrequently used to derive rate recommendations in many crops. This
has been due to difficulty in determining specific critical values and correlation to rate need, practicality
for sampling, cost, and other issues similar to those with plant sensing. Plant sampling of specific plant
parts has been useful in certain crops, especially for monitoring and to determine N adequacy/deficiency,
for example, petiole nitrate analysis in potato and cotton, and total N in winter wheat at tillering. With
corn, in-season plant tissue sampling/analysis has been difficult to find strong relationships with N
fertilization need, and therefore research efforts have been directed to plant and canopy sensing to
determine N need and rate determination. In corn the concentration of nitrate-N in the lower stalk near
plant maturity has been useful to determine situations of excess N availability. It has not, however, been
calibrated to specific rate adjustment, and of course is specific to adjusting N in future years, not the
current year.
Chlorophyll meter (CM) and canopy sensor readings are unit-less values and by themself do not
adequately determine N sufficiency/stress. When readings are compared (normalized) with readings from
an adequately N fertilized reference area (non-N stressed), then the crop N status relative to the greenest
and/or greatest vegetation crop area in the field is evaluated. It is critical that each field has reference
strips or areas to reduce the confounding effects of other variables on growth and coloration such as
hybrid/varieties, other nutrient deficiencies, soils, or environmental conditions. Reference strips or areas
Chapter2:NitrogenManagement|11
can be created by applying extra N (approximately 50 percent more than typically required for the
rotation) at preplant or early sidedress growth stages. Other reference concepts include using a “virtual
reference”, where the best (greenest and greatest growth) crop in the field is used as the reference and no
pre-set references are created with extra applied N. Normalization is made by taking the average reading
of the crop in the area of interest and dividing this number by the average reading of the closest reference
area. Enough reference areas are needed to characterize differing field areas.
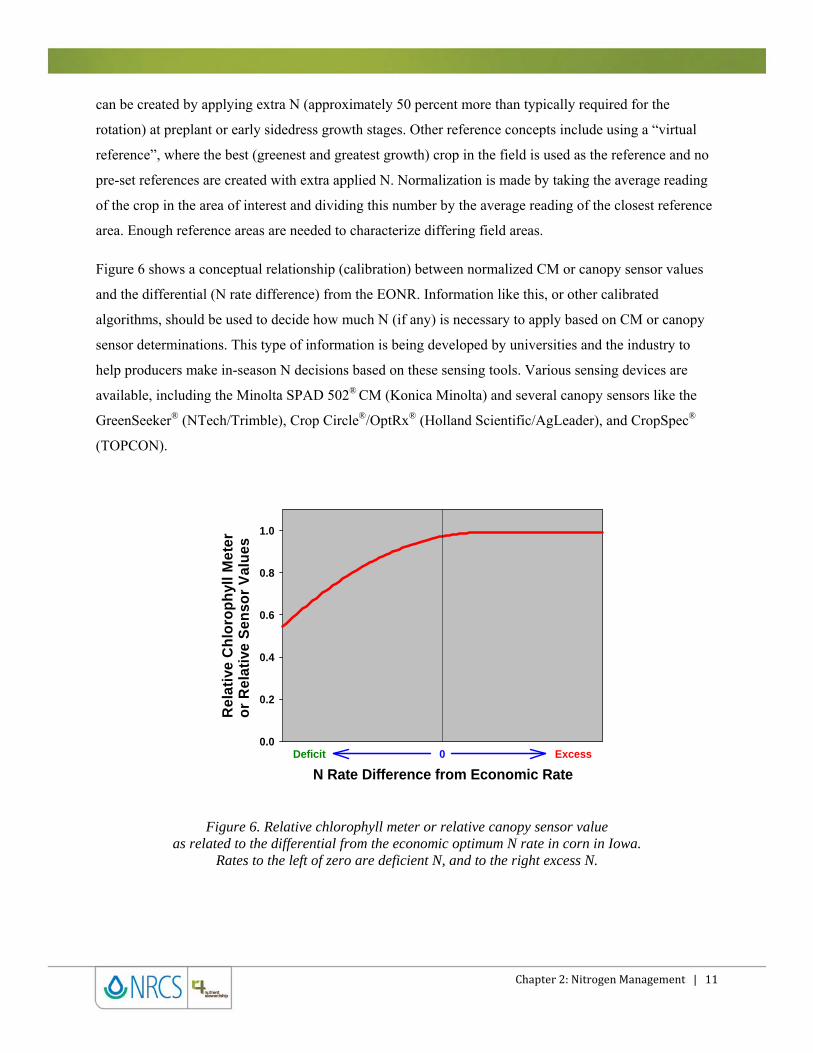
Figure 6 shows a conceptual relationship (calibration) between normalized CM or canopy sensor values
and the differential (N rate difference) from the EONR. Information like this, or other calibrated
algorithms, should be used to decide how much N (if any) is necessary to apply based on CM or canopy
sensor determinations. This type of information is being developed by universities and the industry to
help producers make in-season N decisions based on these sensing tools. Various sensing devices are
available, including the Minolta SPAD 502® CM (Konica Minolta) and several canopy sensors like the
GreenSeeker® (NTech/Trimble), Crop Circle®/OptRx® (Holland Scientific/AgLeader), and CropSpec®
(TOPCON).
N Rate Difference from Economic Rate
Rel
ativ
e C
hlo
rop
hyl
l M
ete
ro
r R
elat
ive
Sen
sor
Val
ues
0.0
0.2
0.4
0.6
0.8
1.0
0 ExcessDeficit
Figure 6. Relative chlorophyll meter or relative canopy sensor value as related to the differential from the economic optimum N rate in corn in Iowa.
Rates to the left of zero are deficient N, and to the right excess N.

Chapter2:NitrogenManagement|12
Chlorophyll Meter
The Minolta SPAD 502 CM is a handheld device that measures the greenness of crop leaves as reflected
by the chlorophyll content and N status. The relationship between leaf greenness and N sufficiency is well
documented for various crops. Plants will reach a maximum greenness with adequate N and when N
stressed, the plants will be less green. The CM is highly portable and provides an instantaneous non-
destructive reading of the crop N status. It is important to sample the plant part (same leaf at the same
spot on the leaf) and growth stage that has been used for the CM sensing calibration. For corn, this is
halfway down the leaf from the tip to the base and halfway from the leaf edge to the midrib, and the
uppermost leaf that is fully collared (leaf collar fully visible around the stalk) at mid-vegetative growth
stages. For cereal crops, sampling may be at or after late tillering. Readings should be collected from
many plants to account for sampling errors and natural color variation across leaves and between plants.
The example for Iowa research of the CM method for corn in Figure 6 shows that relative CM values
decline below optimal N, and as the relative values become smaller, the N deficiency and needed N
application rate increases. However, relative CM values are similar with slight deficient N, adequate N,
and excess N. This makes it difficult to determine in-season N need when N deficiency is slight. Research
has shown that in-season N applications may be suggested by relative CM values when the N deficiency
appears slight, but yield response indicates the in-season N is not always needed. At a given relative CM
value, the N rate is derived from the calibration curve. For example, at a relative value of 0.93, the
suggested N rate would be 60 lb N/acre. Either an equation can be used for determining application rates,
or a table can be created that gives N rates for ranges in relative CM values.
In the same way, in-season N recommendations for wheat (Kentucky) are based on CM readings at
Feekes 5 growth stage (late tillering): N rate (lb N/acre) = 6 + (7 x (CM reference area – CM field)). For
example, if the CM value of the reference area at late tillering is 52 and the CM value of the rest of the
field is 45 the recommendation would be 6 + (7 x 7) = 55 lb. N/acre. When using a CM to determine N
stress and N application need, it is important to follow locally suggested sensing timing, crop stage, plant
part, and calibrated application rates.
Active Canopy Sensors
Active canopy sensors, which are positioned above the crop canopy, have been developed as a tool to
determine plant N stress deficiency and provide an on-the-go decision for implementing variable rate N
application. This is a relatively new method of remote sensing. It is similar to that of natural light
reflectance with passive (reflected sunlight) sensing technologies. However, active canopy sensors utilize

Chapter2:NitrogenManagement|13
their own light source and measure light reflectance in real-time at the canopy level. Initial research with
the GreenSeeker active canopy sensor in Oklahoma documented that active sensors are a viable method to
improve N use efficiency in winter wheat, and when compared to uniform N rate application based on
traditional yield goal, N use efficiency was improved 15%. In corn, research with active sensors has
investigated issues such as growth stage for sensing, need for normalization of sensor readings to non-
limiting N field areas, and calibration of sensor indices to N fertilization requirements. Also, use of active
sensors to direct variable rate N must include an understanding of situations where other factors are
limiting growth, such as poor stand, excess water, or other nutrient deficiency.
Many canopy indices can be calculated from the visible (VIS) and near-infrared (NIR) light reflectance
variables typically collected with active sensors. Examples being implemented are normalized difference
vegetative index (NDVI) and chlorophyll index (Chl). Indices emphasize different plant characteristics
important for determining N stress, such as plant canopy biomass or plant coloration. The various indices
have different strengths and weaknesses. Most important is to know the sensor and especially the index
being utilized, and the specific calibration of the index for the crop being sensed. As with the CM, there
needs to be a calibration between the relative index, N stress level, and recommended N rate to apply.
Nitrogen application rates based on canopy sensors should be calculated using locally developed
algorithms and recommendation systems.
An important consideration for active canopy sensing is the crop stage to sense. For corn, this is still a
subject of research. It appears that the early to mid-vegetative growth stage may allow for adequate
expression of N stress, if it is to occur, and if N deficiency is found then time for corn to respond to
applied N. Of issue, as with the CM, is the rate of N applied preplant, at planting, or early sidedress. The
greater that N rate, the less chance for significant N stress to develop by the time of sensing, especially for
early growth stages. The lower that rate (or no application), then the greater the chance for N stress
development that can be measured, but also the greater chance for too much N stress and loss of crop
yield potential. As with the CM, the difference between slight N deficiency and adequate to excess N is
difficult to differentiate with active canopy sensors.
Two general approaches could be implemented with active sensors. One is to plan on conducting canopy
sensing each year, with a reduced N rate applied preplant, at planting, or early sidedress and then sensing
conducted at mid-vegetative growth to determine additional application need. A second approach is to
conduct sensing only if conditions result in N loss from the primary N application, or other factors change
expected crop requirements. Both approaches could address variable N fertilization and seasonal
circumstances. The second approach allows producers to use normal preplant or early sidedress N

Chapter2:NitrogenManagement|14
management. However, there could be instances where less than normally recommended N rates would
produce optimal yield, and those situations would be missed with that approach. Also, as with CM
sensing, canopy sensing may miss season-long N deficiency if the preplant rate is adequate to meet plant
needs through the time of sensing.
Variable Rate Technologies
Recognition of within-field variability in soil properties, crop yield, crop nutrient need, and nutrient
supply by site-specific nutrient management is gaining popularity as technology advances. Applying
different amounts of N fertilizer in different parts of the field according to soil conditions and crop need
seems intuitively obvious. Crop producers are interested in variable rate N management due to the
popularity of site-specific phosphorus, potassium, and lime application. Producers know soils differ
within fields, and often those differences can result in significant yield variation. During the growing
season, crops may express differences in leaf color if N or other nutrients are low in supply and
deficiencies result. Crop and soil computer simulation models also suggest there can be substantial
differences in soil N supply or crop N demand within a field.
Whole fields are divided into management units where the fertilizer application may differ using some
form of field diagnostic, such as intensive soil sampling, soil and crop remote sensing, aerial images,
yield mapping. Consistently poor crop performance in one part of the field may indicate (although not
always) greater potential for N loss if N is applied uniformly across the field. Variation in soil organic
matter and soil texture can be important influences on N management. Soil maps, bare soil images, grid
soil sampling and/or mapping of electrical conductivity may indicate this type of variation. For example,
a field divided into knolls, mid-slope and depressions areas may have a small N demand in the
depressions, moderate on the mid-slope, and high on the knolls. However, producers know that while the
fertility level may be low on the knoll, so can be water supply and yield potential. Field history can also
be zoned to account for old barnyard sites, past manure management and sections of the field which may
have been broken from natural grassland later than other areas. Together, this information can be used to
develop zone specific nutrient application strategies. However, the magnitude of the variation or lack of
predictability or repeatability in N rate need may not justify varying N rates. Aerial imagery is useful once
the crop canopy is sufficiently developed and soil reflectance no longer dominates the image. These tools
are particularly suited for surveying large areas, such as when wet weather creates potential for N loss.
Aerial photos or calculated sufficiency indices potentially can be calibrated to predict likely yield gain
from applying additional N.

Chapter2:NitrogenManagement|15
A recent, and potentially the most promising approach for making variable rate N applications, is the use
of the previously mentioned active canopy sensors. The sensor is mounted on a field applicator capable of
varying the N rate on-the-go. In instances where field variability of N is large, this type of application
prevents the over-application characteristic of fixed field rates in those areas where the soil N supply is
sufficient. Potential drawbacks of chlorophyll or canopy sensors were discussed before and apply to their
use for variable-rate application. For example, the leaf area needs to be sufficiently developed to reflect
enough light to reliably indicate N fertilization need. This increases risk as wet weather may delay or
prevent sidedress application. To approach in-season N management in tall crops, i.e. corn or sorghum,
high clearance equipment is likely needed to apply sensor-based N. In-season variable rate N application
may be useful and very practical for fertigation because of rapid advances in the technology to sense N
deficiency and vary N application rates through center-pivot systems. The specific knowledge and
recommendations for variable-rate N application at this time vary greatly across states due to the different
set of issues across regions and different pace of research.
Application Timing, Product and Placement
Timing
The demand for N by a growing crop is not constant through the growing season, with the highest uptake
associated with the period of most rapid growth. Timing N fertilizer applications so that they provide a
plant-available supply of nutrients when the crop needs them is the desired goal. Plants subject to
deficiency during a high demand period may not recover to achieve full yield potential even with high N
rates applied too late. Because N fertilizers are subject to transformation in the soil, application timing can
play a critical role in optimizing crop response and high use efficiency.
Producers in certain geographic areas, such as the upper Midwest (colder winter season) and Great Plains
(drier winter season) prefer to apply N fertilizer for corn as anhydrous ammonia in the fall when there is
more time for application, the N price may be lower, and the soil is more likely to be in good condition
for application. The disadvantage of fall application is increased risk of loss before crop N uptake the next
summer. Nitrification of ammonium N will be slow if the soil temperature is low after application, with a
suggested practice to not apply ammonia in the fall until soils cool to 50○F and continue to get colder.
Fall-applied N may be nitrified before the crop is planted due to application when soil temperatures are
relatively high, unexpected warming of the soil after application, periodic warming during the winter, and
early warming of the soil in spring. This nitrate will be subject to leaching and denitrification with spring
rains and waterlogged soils that occur before and after the crop is established. Anhydrous ammonia is
slower to convert to nitrate than ammonium from other fertilizers and is the only N source that should be

Chapter2:NitrogenManagement|16
considered for fall application in most areas. Use of a nitrification inhibitor (such as N-Serve®, Dow
AgroSciences) with fall-applied ammonia can improve the effectiveness by slowing nitrification. Many
studies show, however, that spring applied N is more effective than inhibitor-treated fall ammonia when
conditions favoring N loss develop.
Despite the advantages of anhydrous ammonia and potential slowing of nitrification with an inhibitor,
geographic areas with warm winters and high rainfall do not utilize fall applied ammonia due to the high
risk of nitrate loss. Fall application is only suggested for regions where winters have frozen soils, rainfall
is low, and soils have good but not excessive internal drainage – that is, are not coarse textured with
excess leaching or poorly drained and subject to excessive wetness. Nitrogen use efficiency with fall
application typically averages 10-15 percent lower than spring application, and reduced yield will cancel
other benefits of fall application.
Benefits from delayed, sidedress, and split N applications are greatest where there is a high risk of N loss
between planting and crop N use. These typically are with sandy soils that have high leaching, poorly
drained soils that increase chance of saturated soils and denitrification, and regions with early high spring
rainfall. In these cases, N use efficiency and crop yield can be increased and nitrate leaching reduced by
applying a major part of the N in-season, at or near the time when crop N demand is high. Sidedress
application also allows for use of in-season soil tests and plant N stress sensing to adjust N rates. Many
producers are reluctant to apply N in-season as they may be busy with other operations, concerned about
yield loss due to early N stress, or concerned that wet weather will prevent application. Delay in sidedress
applications can reduce yield, but this can be avoided or minimized by applying a portion of the needed N
before or at planting as a split application.
Applying N through irrigation systems (fertigation) is an important form of in-season N management in
irrigated regions. Fertigation can be very efficient, especially in sandy soils with high leaching potential,
but must be practiced with appropriate safeguards such as backflow contamination and avoiding over
watering which can result in leaching. In most cases, N application through irrigation systems is
completed by the end of vegetative growth.

Chapter2:NitrogenManagement|17
Product
Several organic and inorganic N sources can supply N required for optimum crop growth. Efficient
management of all N products requires an understanding of N cycling, soil transformations, and crop
demand. Product management that minimizes losses and maximize the quantity of applied N recovered by
the crop will increase production efficiency and reduce potential impacts on the environment.
Manure
Manure sources have characteristics that make nutrient management different and sometimes more
complicated than fertilizer. These characteristics include a mix of organic and inorganic N forms,
variation in N concentration and forms, handling as a liquid or solid, and relatively low nutrient
concentration requiring large application volumes. Since manure N composition can vary
significantly, sampling and laboratory analysis are always needed. As with fertilizers, significant
amounts of plant usable manure nutrients can be lost and became unavailable to crops after
application. For example, inorganic N in manure or derived from manure through mineralization can
be lost through processes such as volatilization, leaching, or denitrification. Also, inorganic N can be
converted for short or long periods of time into forms not usable by plants through processes such as
immobilization to organic materials. Conversely, with high carbon containing manure sources,
significant time may be needed to provide plant available inorganic N.
Anhydrous ammonia (NH3) (82 percent N)
Anhydrous ammonia is widely used for direct application because of its relative low cost and high N
concentration. Many safety features must be considered when transporting and applying anhydrous
ammonia, and strict safety procedures must be followed during handling. It can be applied preplant or
sidedressed in row crops. Soil moisture content should not be too dry or too wet when anhydrous
ammonia is applied in order to avoid volatile losses due to poor soil sealing or coverage of the
injection track. Shallow placement may result in early season crop seedling or root damage from free
ammonia. Proper depth and injection in good soil conditions helps avoid such problems. Also,
injection between future corn rows, using GPS and auto guidance, can avoid future corn rows. In
corn, application can be made between every other row. For small grains, knife spacing needs to be
close enough to avoid streaking of poor plant growth between injection tracks. Addition of a
nitrification inhibitor with late fall application may be beneficial to slow nitrification in the fall and
early spring.

Chapter2:NitrogenManagement|18
Urea (CO(NH2)2) (46 percent N)
Dry urea is widely used as a broadcast N product for many crops. It converts quickly to ammonium (a
process called hydrolysis), especially in warm-moist soils. That conversion is increased rapidly due to
the urease enzyme, found in soil and plant residue. In no-till situations, ammonia volatilization from
surface application is a concern, especially if there is high crop residue, soils are warm and moist, soil
has high pH, and there is not a significant (> 0.25 inch) rainfall for many days after application.
Incorporation soon after application (within 2 days), or injection, places urea into the soil and avoids
loss of ammonia. If surface application with no incorporation is planned, then urea can be treated with
a urease inhibitor (Agrotain®, Agrotain International) to slow urea conversion to ammonium and give
more time for rain to move urea into the soil. The best management, however, is to incorporate
broadcast urea. Because of urea hydrolysis and production of ammonia, urea should not be placed in
furrow with seed placement.
Coated urea and slow release products
Coating urea with various impermeable substances (such as elemental sulfur, polyurethane, semi-
permeable polymers, etc.) allows the urea to be protected from conversion to ammonium and
subsequently to nitrate when applied to soils. This technology allows production of urea based
fertilizers that have controlled release characteristics. That means the timing of urea conversion
(release) to plant available inorganic ammonium and nitrate can be controlled to match the unique
uptake pattern of specific crops. For crops like wheat, this would be an early spring release. For corn,
it would be release in late spring before rapid vegetative growth. The reason for having such products
is to have urea in a form that is not be affected by wet weather, and thus avoids times where excess
rainfall and wet soils would cause nitrate loss. Many such products have been developed. Most are
targeted and most useful in specialty crops and turf. More recently, products have been developed for
agronomic crops, such as corn. An example is ESN® (Agrium, Inc.). That product, for example,
controls release based on soil temperature. Product cost is higher due to the need for adding the
coating. While a controlled release product has advantages to help control N loss, there is also the
option for using traditional products and changing the timing to more closely match crop uptake. A
similar strategy is used with products that have varying chemical structures that slow the conversion
to plant available inorganic N. There are many of these products, with greatest use in specialty crops
and turf. Timing of N release has been an issue with agronomic crops due to rapid crop N uptake
patterns and too slow of release to plant available N. If the N remains in the original fertilizer form as
when applied, then it will not be in a plant available form and not be taken up by the intended crop.

Chapter2:NitrogenManagement|19
Urea-ammonium nitrate solution (UAN) (28-32 percent N)
Urea-ammonium nitrate solution is widely used as a broadcast and injected product for many crops.
It is approximately one-half urea and one-half ammonium nitrate. Therefore, the product contains 50
percent of the N as urea, 25 percent as ammonium, and 25 percent as nitrate. UAN is popular because
of the versatility as a liquid, as well as widespread availability and applicability. The nitrate portion is
immediately subject to leaching and denitrification upon application. The urea portion is subject to
ammonia formation, and therefore the same loss and plant injury mechanisms as dry urea. UAN can
also be banded on the soil surface by dribbling, which reduces the interaction with crop residue and
potential for volatile ammonia loss. As with dry urea, a urease inhibitor can be added to UAN for
planned surface applications that will not be incorporated. Potential effectiveness of a urease inhibitor
is similar to that with dry urea, but overall the potential gain is less with UAN as only half of the N is
in the urea form.
Ammonium nitrate (NH4-NO3-) (34 percent N)
In recent years, use of dry ammonium nitrate as a fertilizer has decreased due to regulations and
safety issues. Both the ammonium and nitrate portions (50 percent each) are immediately available
for plant uptake. The nitrate portion is immediately subject to leaching and denitrification upon
application. There is no volatile loss potential from surface application on most soils, with some on
calcareous (high pH) soils. This characteristic has made ammonium nitrate popular as a broadcast
material in grass crops, small grains, and no-till production systems.
Placement
An important part of optimizing crop response to fertilization is ensuring that N is placed in a location
where crop root interception or dissolved nutrient movement to roots is in time for optimum growth.
Maximizing crop N uptake also reduces the potential for nutrient loss, and placement can be a powerful
management tool to help minimize N losses. Under ideal conditions, the goal is to have applied N so that
it is in a plant-available form and in close proximity to roots when plants require the N. Since nitrate is
rapidly produced from all applied fertilizers, and it moves easily in soil with water, N placement is not as
critical as for nutrients that have limited movement. Nitrogen fertilizers can be applied by several
methods depending on the N source, equipment availability, and time of application. In some cases, the
fertilizer product characteristic dictates the placement method, such as anhydrous ammonia.
Chapter2:NitrogenManagement|20
Injected or banded
Injecting N fertilizers and manure may be required due to the product, to avoid volatile losses and
odors, to match crop row spacing, to avoid crop injury that may occur with broadcast application, or
may simply be of convenience. Anhydrous ammonia must be injected into the soil as if it were
surface applied the majority would simply go into the air. Urea and UAN solutions can be surface
applied, but injection avoids potential volatile losses. Applying in a concentrated band within the root
zone can ensure N placement where roots can access the N, which can be especially important in dry
conditions. Surface banding liquids, like UAN, can increase product contact with soil and reduce
volatile loss. In small grains, surface banding UAN instead of broadcasting can help avoid plant
foliage injury. Banding N beside and below the seed placement at planting is a viable approach to
have a high N starter available for early growth – something shown to be effective in no-till corn
production and especially when sidedressing the major N application. Due to seed safety issues,
placing N with seeds limits the application rate. This application may be helpful for very early
growth, but cannot be used as a replacement to meet early season crop demands. In addition, urea
should not be placed with seeds due to ammonia injury potential.
Broadcast
Broadcast applications uniformly distribute N across the soil and are often applied preplant or prior to
emergence. In conjunction with incorporation, applied N is mixed uniformly within the upper rooting
zone. This can be particularly important for solid seeded or close row spaced crops when banding is
not viable. As mentioned before, surface broadcast applications of urea-based fertilizers and high
ammonium containing manure sources should be incorporated to minimize volatile losses. Broadcast
fertilizer application after crop emergence should be carefully evaluated due to potential for crop
injury. Application when plants are small or use of low application rates will help minimize potential
injury. Product use also has a large effect on potential foliar injury, with dry materials like urea
having much less injury potential than UAN solutions.
Fertigation Irrigation systems, especially pivot systems, can be fitted with equipment to apply N solutions with
the irrigation water. This method has the advantage of avoiding a separate field operation to apply N
and allows for multiple applications throughout the season to “spoon feed” the crop. This is especially
useful on coarse textured soils with high leaching loss potential. Nitrogen fertigation has the
disadvantage that timely rains may reduce or eliminate the need for irrigation, thus limiting N
application opportunities.

Chapter2:NitrogenManagement|21
Case Study
There are many different nitrogen (N) management strategies for crop production that are used by
producers across the U.S. It is impossible to give one example representative for all geographic areas,
crops, current management systems, and options for improved N use. These would vary by producer
philosophy, crop, rotation, climate, available fertilizer or manure, and application equipment. The
following example describes a N management system being used for a specific farm in the U.S. Corn
Belt, and possible practices the producer could consider to improve crop N use efficiency, economic
return from N application, and reduce nitrate loss to surface waters.
Example Scenario
A 1,500 acre farm in North Central Iowa.
Soils are prairie-derived, glacial till parent material silt loam and silty clay loam, with variability between fields in soils from well drained (not excessively drained) to poorly drained with subsurface tiles for improved drainage.
The farm has fields with continuous corn and corn rotated with soybean.
Each year some fields have solid chicken layer manure applied as a nutrient input.
The producer always applies chicken manure early in the fall for the next corn crop, and fertilizer N in the late fall (after soils cool below 50○F) as anhydrous ammonia. No N is applied in the spring or after planting.
The N fertilizer application does not account for any N supply from the applied chicken manure, with the manure solely viewed as a P and K nutrient source.
The anhydrous ammonia rates are based on a yield goal system (corn yield times 1.2 minus a soybean credit), with historical yields of 190 bu/acre in continuous corn and 210 bu/acre in corn following soybean in good production years. However, yields are considerably lower in years with excessive rainfall. The N rates are not adjusted by field, are based on the years with best yields, and average 220 lb N/acre for corn following corn and 200 lb N/acre for corn following soybean. The rates are not adjusted for corn price or N cost, and no in-season N diagnostic tools are used to adjust rates.
In wet years, and especially in the fields with poorly drained soils, the producer has noticed yellow corn
late in the growing season, indicating N loss via leaching and/or denitrification. This has occurred despite
improved drainage with tile.
This example scenario is not uncommon in many areas of the U.S. Corn belt, and emphasizes the
potential benefits from development of an improved N management plan.

Chapter2:NitrogenManagement|22
Following are management options to consider. These are listed in order of greatest potential to improve
N use and provide tools to adjust N rate in season for varying climatic conditions.
Practice One
The rate of N application has a large impact on corn yield and nitrate loss to water systems. Therefore, the
rate decision process should change from the old and no longer recommended yield goal times a yield
factor system to the current system used across the Corn Belt that is based on current N response trials, N
and corn prices (Maximum Return To N, MRTN), and results from the Corn N Rate Calculator for the
specific state and production system. The N rate recommended will change depending on the current N
and corn prices. For example in Iowa, at a price for anhydrous ammonia of $800/ton ($0.49/lb N) and a
corn price at $6.00/bu, the recommended rate for corn following soybean is 140 lb N/acre (MRTN rate),
with a profitable range of 129 to 151 lb N/acre. For corn following corn, the MRTN rate is 199 lb N/acre
with a profitable range of 185 to 209 lb N/acre. The rate change from the current practice for corn rotated
with soybean would be 60 lb N/acre lower and for continuous corn would be 20 lb N/acre lower. Both
rates would improve economic return (less N cost and unlikely impact on yield) and have less impact on
N loss via tile flow or leaching to groundwater. The largest impact on reducing nitrate loss to water
systems would come from the rate change in the corn-soybean rotation. That system has the highest corn
yield and N removal, but research has also shown it to have much lower N fertilization need than derived
from yield based recommendations.
Practice Two
For the fields receiving fall poultry manure applications, a priority would be to account for the crop
available N in the manure application. In addition, the N component of the poultry manure should be
accounted for in the total crop available N application. According to Iowa research and recommendations,
50 to 60% of the total poultry manure N applied is crop available in the year of application and 10% is
available in the second year. Subtract appropriate manure N supply amounts from the corn N
recommendations. Accounting for available N from the poultry manure should be done in conjunction
with the switch to the MRTN rates, and then apply the remaining N need as fertilizer. Try to schedule
applications for late fall or spring to help reduce conversion of N to nitrate. In addition, if possible
incorporate the manure to reduce volatile ammonia-N loss on fields where fall tillage will not increase
chance of soil erosion.
Chapter2:NitrogenManagement|23
Practice Three
With the reduced MRTN-based N rate recommendations for both cropping systems, N application
management should be improved to help reduce nitrate losses in spring and early summer and therefore
avoid potential yield issues. Instead of a fall application of anhydrous ammonia to all fields, fall
application should be targeted only to fields with well drained soils and also should consider use of a
nitrification inhibitor along with a late fall application. For fields with more poorly drained soils, N
application should be switched to spring or post-emergence sidedress application. The producer can
continue to use anhydrous ammonia for either timing. If spring application is preferred, then anhydrous
ammonia would be a preferred source. Another option could be use of a coated urea product to slow
release of N. If sidedressing is preferred, either anhydrous ammonia or N solutions could be used. When
sidedressing, use of a split application (some preplant or at planting and the largest amount at sidedress)
would ensure adequate N for the corn until sidedressing – which would be especially important for late
sidedress applications (V5 or later) in corn following corn. These N options spread out the N application
workload, and still allow use of a least cost N source such as anhydrous ammonia, but may not always
result in significant further reduction of nitrate loss in addition to practices outlined in option 1 and 2.
Practice Four
In fields that have poultry manure applied, and where sidedress fertilizer N application will be practiced,
in-season diagnostic tools can be used to adjust corn N fertilizer inputs. One tool is the soil nitrate test
(called LSNT in Iowa, PSNT in other areas). This test can help to better account for available N from the
poultry manure, including in the second corn year following manure application, and adjust for seasonal
effects on soil and manure N supply. For this test, soil is sampled in late spring to a one foot depth when
corn is 6 to 12 inches tall. The sidedress fertilizer rate is then adjusted based on the results of the test. Use
of this nitrate test does not mean that no preplant N should be applied, especially in continuous corn.
An alternate in-season diagnostic tool is the emerging use of active canopy sensors at the mid-vegetative
corn growth stage to determine potential N shortages by sensing the plant N status and vegetative growth.
In years with excess wetness, this practice may allow for application of additional N if shortages occur
during the early season. This practice could be especially helpful when there is no soil nitrate testing and
where it is difficult to collect representative soil samples (due to N banding) for a soil nitrate test. Canopy
sensing can be used in addition to previously suggested N-rate reduction practices, in fields with manure
application, or where N was applied well in advance of plant need such as late fall ammonia. Use of this
canopy sensing technology requires well fertilized reference areas across fields (known non-N deficient
reference) to compare against, so additional planning is required for implementing these references. In

Chapter2:NitrogenManagement|24
addition, the sensing is conducted after corn has reached a height that will likely not allow use of
traditional sidedress application equipment, and instead will require high clearance applicators that can
dribble or coulter inject N solutions, or broadcast dry fertilizer such as urea. Use of this tool does not
mean that no preplant N should be applied, especially in continuous corn. Trial use of this technology
could be targeted to fields with known history of N loss and crop N shortages when climatic and field
conditions are conducive to N loss.

Chapter 3: Phosphorus Management
Agustin Pagani, Antonio P. Mallarino, and John E. Sawyer / Department of Agronomy, Iowa State University
Developed in cooperation with Lara Moody, TFI; John Davis, NRCS; and Steve Phillips, IPNI.
Funding provided by the USDA Natural Resources Conservation Service (USDA-NRCS) and the Fertilizer
Institute (TFI).
Introduction
Phosphorus (P) is an essential nutrient for crop production since it is required for many plant functions,
including energy transfer and protein synthesis. Phosphorus is included in adenosine phosphates (ADP
and ATP) that play a crucial role as “energy currency” within plants. It is also a component of
deoxyribonucleic acid (DNA) and ribonucleic acid (RNA), which contain the genetic code of the plant.
Adequate P supply is associated with increased cell multiplication, stem and root growth, stem strength,
nitrogen (N) fixation capacity of legumes, and grain yield. The most common visual symptoms of P
deficiency in plants include overall stunting and, in with extreme deficiency, dark green/purple coloration
of leaves.
Phosphorus uptake and removal from fields with harvest are highly dependent on yield and to a lesser
extent the tissue P concentration, although amounts typically are much less than for N or potassium (K).
Table 1 shows, as an example, the Iowa guidelines concerning P concentration per unit of yield for
several crops. Commercial P fertilizer analysis has historically been expressed as the oxide form (P2O5)
rather than the elemental form (P), therefore P uptake and removal values usually are expressed as P2O5
per unit of yield. Using the ratio of their molecular weights, %P2O5 can be converted to %P by
multiplying by 0.44 (%P = %P2O5 x 0.44). To more accurately estimate P2O5 uptake or removal for a
specific situation, one can have P analyzed in the plant tissue that is removed from the field, and multiply
the result by the dry matter yield removed. The estimate of P that is being removed by the crop can help
in determining P fertilization recommendations to maintain desirable soil-test P levels.

Chapter 3: Phosphorus Management | 2
Table 1. Phosphorus amounts in harvested portions for selected agricultural crops.
Crop Unit of Yield Pounds P2O5 per unit of yield
Corn bu 0.37
Corn silage bu grain equivalent 0.55
Soybean bu 0.80
Oat and Straw bu 0.40
Wheat bu 0.60
Sunflower 100 lb 0.80
Alfalfa ton 12.5
Tall fescue ton 12.0
Source: Iowa State University Extension publication PM 1688.
In some regions with short histories of grain-crop production and little application of animal manures,
soil-test P levels are low and crop response to P application is very likely. In most regions of the U.S.,
however, the natural amount of crop-available P in soils has been increased due to long-term application
of P fertilizer or animal manure. When soil P levels become excessive, the danger of freshwater
eutrophication increases, which is now one of the most common water quality impairments in the humid
regions of the U.S. and many developed countries. Recent outbreaks of harmful algal blooms (e.g.,
cyanobacteria and P. fiesteria) have increased society’s awareness of eutrophication and the need for
solutions. The concentration of specialized farming systems has led to a P transfer from grain- to animal
producing areas. This transfer has created regional surpluses of P inputs as fertilizer and feed, increases of
soil P in excess of crop needs, and increased risk of P loss from land to surface waters. The overall goal of
efforts to reduce P loss to water should be to balance P inputs and outputs at farm and watershed levels,
while managing soil and P in ways that maintain or increase productivity. Management strategies that
minimize P loss to surface water may involve optimizing P use efficiency by using soil testing and proper
P application recommendations, variable-rate application, transport of manure from areas with surplus to
areas with P deficit, and implementation of soil conservation practices to reduce erosion and runoff.
In order to improve P management in agricultural systems, however, it is important to first understand the
main P processes that occur in the soil-plant system.

Chapter 3: Phosphorus Management | 3
Basic Phosphorus Processes in the Soil-Plant System
Phosphorus in Soils
Phosphorus exists in the soil as dissolved orthophosphate in solution (mainly HPO4-2
or H2PO4-depending
on soil pH), sorbed P on the surface of organic or inorganic compounds, or as part of organic P
compounds or P minerals. The dissolved phosphate ion is the only form that plants can take up, yet in the
surface layer of most agricultural soils there is less than 1 mg/L (1 ppm) of dissolved phosphate in the soil
solution (soil water), except in recently fertilized soils. On the other hand, the total soil P concentration
can vary from about 200 to 2,000 ppm depending greatly on soil parent material and histories of cropping
and fertilizer or manure application. Organic P normally represents about 25 to 65% of total P in surface
soils, depending mainly on soil organic matter content. Organic P usually decreases abruptly with soil
depth, paralleling decreases in organic matter. The processes that control the amount of plant available P
in the soil are plant uptake, sorption/desorption, mineralization/immobilization, precipitation/dissolution,
runoff, and leaching. Because of the usually very small concentration of P in the soil solution, an
understanding of these processes is important for implementing good P management.
Phosphorus retention in soils
Inorganic P dynamics in soils are dominated by processes of sorption/desorption and
precipitation/dissolution. Sorption refers to the binding of P to the surface of soil particles. Phosphorus
sorption/desorption reactions are strongly influenced by soil pH, texture, and mineralogy of fine soil
particles. For example, orthophosphate reacts strongly with aluminum (Al) and iron (Fe) oxides and
hydroxides, especially at low pH, and also with carbonates in high-pH soils. Fine textured soils generally
can sorb more P because they have higher clay concentration and greater surface area. Dissolved organic
compounds from recent organic matter additions can increase P availability by blocking sites or coating
Fe/Al oxides. Phosphorus desorption generally increases as solution P decreases due to plant uptake or
leaching, and also under flooded or waterlogged conditions due to changes of Fe hydroxides and oxides to
more soluble forms. When high P fertilizer rates are applied, P sorption sites can become partially
saturated, which increases the recovery of added P but can also increase dissolved P loss through the soil
profile or surface runoff.
Precipitation/dissolution reactions occur at the same time as sorption/desorption, although not necessarily
in the same volume of soil. Precipitation takes place mainly when a water-soluble P source increases the
concentration of phosphate in the soil solution, and it forms compounds with cations added with the P
source or already present in the soil solution. Dissolution occurs mainly when added, recently formed, or

Chapter 3: Phosphorus Management | 4
native P compounds dissolve as a result of decreases in the concentration of soluble phosphate in solution.
The P precipitation/dissolution reactions are largely dominated by a variety of calcium phosphates (Ca-P)
in neutral to high-pH soils and by Al and Fe phosphates (Al-P and Fe-P) at pH levels below about 6.5.
Reactions of ammonium phosphates or potassium phosphates temporarily can dominate, however, when
fertilizers containing these compounds are added to the soil.
When a water-soluble P fertilizer is added to moist soil, a solution with a very high phosphate ion
concentration develops at the application point (granule or band), and in the immediate vicinity an acid or
alkaline condition depending on the fertilizer material. This solution is very acid (pH 1 to 2) for
superphosphate fertilizers (mono-calcium phosphates), moderately acid (about pH 4) for mono-
ammonium phosphate (MAP) fertilizer, and alkaline (about pH 8) for di-ammonium phosphate fertilizer
(DAP). This concentration of phosphate diffuses away from the application point, and intense reactions
occur with soil constituents. The phosphate concentration in the soil solution decreases over time, the
original soil pH at the application point is restored, and much of the added P becomes retained by the soil
particles (sorbed or precipitated) but still has high plant-availability. Therefore, added P does not have a
long-term effect on soil pH. Large application rates of MAP or DAP can acidify soil, however, because of
the nitrification of ammonium contained in these fertilizers.
Over a few weeks or months (depending on soil chemical and mineralogical properties) some of the
applied P may become strongly retained and therefore less available for crops. Soils with high levels of
calcium carbonate may strongly retain a higher proportion of added soluble P due to more adsorption to
carbonate surfaces and transformation of initially soluble Ca phosphates to less soluble forms. Soils with
high levels of Fe-oxides (soil can be strongly or moderately acid) may strongly retain a higher proportion
of added soluble P due to high adsorption to oxides surfaces and transformation of initially soluble Al or
Fe phosphates to less soluble forms. Therefore, in general and under otherwise similar conditions, P is
most readily available between pH 6 and 7 (Figure 1). In many soils and outside that pH range, however,
the retention is reversible. As soluble P is taken up by plants, retained P replenishes the low concentration
of soluble P and, therefore, acts as a reservoir for plant available P supply.
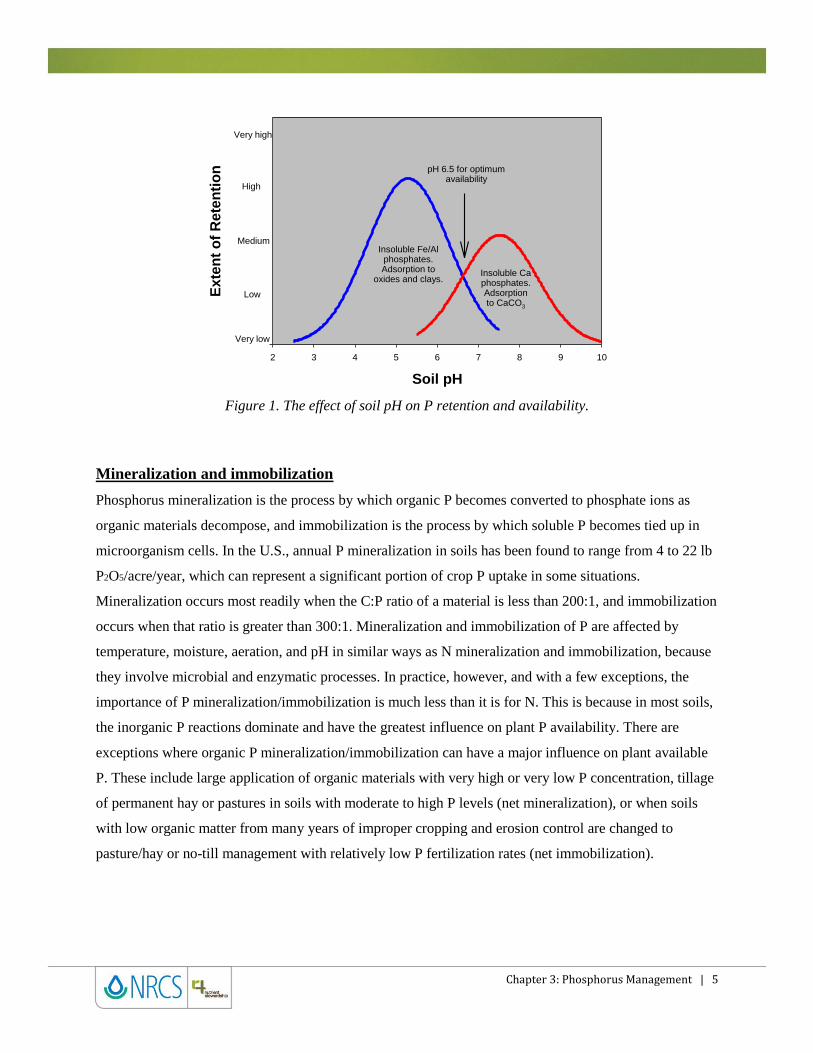
Chapter 3: Phosphorus Management | 5
Soil pH
2 3 4 5 6 7 8 9 10
Exte
nt
of
Rete
nti
on
Very low
Very high
Low
High
MediumInsoluble Fe/Al
phosphates.Adsorption to
oxides and clays.Insoluble Caphosphates.Adsorptionto CaCO3
pH 6.5 for optimumavailability
Figure 1. The effect of soil pH on P retention and availability.
Mineralization and immobilization
Phosphorus mineralization is the process by which organic P becomes converted to phosphate ions as
organic materials decompose, and immobilization is the process by which soluble P becomes tied up in
microorganism cells. In the U.S., annual P mineralization in soils has been found to range from 4 to 22 lb
P2O5/acre/year, which can represent a significant portion of crop P uptake in some situations.
Mineralization occurs most readily when the C:P ratio of a material is less than 200:1, and immobilization
occurs when that ratio is greater than 300:1. Mineralization and immobilization of P are affected by
temperature, moisture, aeration, and pH in similar ways as N mineralization and immobilization, because
they involve microbial and enzymatic processes. In practice, however, and with a few exceptions, the
importance of P mineralization/immobilization is much less than it is for N. This is because in most soils,
the inorganic P reactions dominate and have the greatest influence on plant P availability. There are
exceptions where organic P mineralization/immobilization can have a major influence on plant available
P. These include large application of organic materials with very high or very low P concentration, tillage
of permanent hay or pastures in soils with moderate to high P levels (net mineralization), or when soils
with low organic matter from many years of improper cropping and erosion control are changed to
pasture/hay or no-till management with relatively low P fertilization rates (net immobilization).

Chapter 3: Phosphorus Management | 6
Phosphorus: A Relatively Immobile Nutrient
As a result of the P reactions and processes in soils, P moves slowly and only short distances. The amount
of P that reaches the root surface with water mass flow is not sufficient to supply plant needs, and
phosphate ion diffusion through the soil solution is the main mechanism of plant P uptake. This
characteristic has several important consequences. From a plant uptake perspective, factors that limit the
rate of P diffusion and both the rate of root growth and the size of the root system can limit P uptake.
These include cold temperature and low moisture (which limit diffusion and root growth), soil physical
properties that inhibit root growth, and diseases or pests that impair root function. Therefore, induced P
deficiency may occur even with adequate soil-test levels. In these situations, or when there is strong soil P
retention, placement that puts applied P near young plant roots (starter, banding) may increase plant
growth and yield compared with broadcast application.
The typical retention of P by soil also makes soil erosion the most important P loss pathway from fields,
and this can occur from water or wind erosion. For example, assuming a total soil P concentration of 500
ppm, soil erosion at 5 ton/acre would represent about 10 lb P2O5/acre, a substantial loss in the overall P
budget. Some eroded soil from upwind or upstream may be deposited to replace a portion of that lost,
although rarely is the redistribution of eroded soil uniform within fields or at field borders. Dissolved P
loss with surface runoff water can represent another loss of P from agricultural fields. However, the
concentration of dissolved P in runoff is generally quite low due to the high level of P sorption and
precipitation. One exception would be for runoff events immediately or shortly after applying P fertilizers
or runoff from animal feedlots. Some factors contributing to soil erosion and surface runoff include long
slopes in fields farmed without conservation structures, tillage or crop rows up and down moderate or
steep slopes, inadequate canopy or crop residue cover, lack of windbreaks, intensive tillage, and over-
irrigation.
The amount of P loss with leaching through the soil profile is much less than P loss with erosion and
surface runoff in most soils and landscapes. In coarse-textured soils or in moderately textured soils with
sustained P application in excess of crop removal (very high soil test P), fertilizer or manure applications
can increase subsoil P concentrations and leaching to groundwater or surface waters through subsurface
tile drainage. Also, P leaching can be a concern on coarse-textured soils that are frequently flood-irrigated
or regions with high rainfall. Therefore, P leaching can result in water quality impairment in some
situations.

Chapter 3: Phosphorus Management | 7
Phosphorus Soil Testing
Soil testing is a very useful tool to assess P requirements for crops. Several test methods are used in
different regions of the country because some adapt better to different soils. The most widely used tests
are Bray-1, Mehlich-1 (in the southeast), Mehlich-3, Morgan (in the northeast), and Olsen (mainly in the
northern Great Plains and western states). Most of these tests are well adapted to acid to neutral soils, but
the Olsen is better suited for high-pH, calcareous soils. Soil samples are generally collected from the
upper 6 to 8 inches of soil because P from fertilizers and manure will stay in this upper layer, most crop
rooting and uptake occurs in this soil layer, and this sampling depth usually better predicts P fertilization
needs. All soil-test methods need to be correlated and calibrated with crop yield response in order to give
a meaning to the test result in terms of crop sufficiency. Different methods and sampling depths result in
different test results, and even the same method may have a different calibration in soils with contrasting
mineralogy and chemical properties.
Research has been and continues to be conducted in different regions to correlate and calibrate soil test
methods. Figure 2 shows the general relationship between soil-test P levels and crop yield. Soil test levels
are generally distributed into interpretation categories referred to as very low, low, medium (or optimum),
high, and very high (or excessive). The "critical" level or range separates soil-test values for which there
is a high probability of large to moderate crop response to fertilization from values for which there are
small and infrequent responses. The critical level can vary with the test method, crop, soils, and climate;
and sometimes even with the philosophy of researchers that establish interpretations and
recommendations. For example, the Bray-1 P level considered adequate for crops, and at which no
fertilization is recommended, vary from about 12 to 30 ppm for forages or grain crops across the U.S. In
addition, because nutrient and crop prices influence the profitability of nutrient application and crop
production, economic considerations together with producers' management and business philosophies
further influence the optimum soil-test levels for crops. The optimal soil-test P level from an economic
perspective will depend largely on the nutrient and fertilizer price ratios, producer management, and other
enterprise decisions.

Chapter 3: Phosphorus Management | 8
Soil P Availability (ppm)
Rela
tive
Yie
ld
P l
os
s
Very low Very highLow HighMedium
Criticalvalue
foryield
Increasedrisk of P loss
Figure 2. Schematic representation of the relationship between relative crop yield and P loss.
Interpretation of soil-test P values for water quality issues must be different than for crop production.
There is general agreement that soil-test levels higher than adequate for crops may significantly increase
the risk of P loss and water quality impairment. As an example, Figure 2 also provides a schematic
representation of the relevance of soil-test P values for crop yield and risk of P loss. There is no
agreement on what this threshold should be for different regions or production systems. Also, most
scientists agree that the soil-test P level is only one of several factors that affect P loss and transport form
agricultural fields. Therefore, risk of loss should be considered in a comprehensive P risk assessment tool,
such as the P index.
Phosphorus Interpretation and Recommendations Concepts
Soil test laboratories, universities, and crop consultants provide guidelines for application rates based on
soil P test results. Interpretation of test results and the recommended fertilization rates vary greatly across
regions due to different crop, soil, or economic relationships related to crop response to nutrient
application but also concepts and assumptions concerning nutrient management. The concepts of
sufficiency level and buildup/maintenance for P and other immobile nutrients have been discussed in soil
fertility circles for several decades.
According to a strict sufficiency level concept, the nutrient application rate for any given soil test P level
should be the one that results in maximum yield or maximum economic yield. The amount of nutrient to

Chapter 3: Phosphorus Management | 9
apply is determined from many field trials on different soils over many years. This approach emphasizes
short-term profitability from fertilization; high returns per pound of fertilizer applied, and reduced risk of
fertilizer over-application by accepting a moderate risk of yield loss. It requires frequent use of soil-
testing and a research data base that adequately predicts a crop response under good or normal conditions.
A strict build-up and maintenance concept emphasizes increasing soil-test levels to an optimum level in a
short period of time by applying rates higher than those for a one-year rate needed to achieve maximum
yield or maximum economic yield. This approach reduces the risk of yield loss due to insufficient nutrient
levels, emphasizes long-term profitability from fertilization, and supports the maintenance of optimum or
slightly higher than optimum soil-test levels. It may not require frequent soil testing, but requires
knowledge of fertilizer rates needed to maintain soil-test values over time, which usually is based on
calculated P removal with crop harvest. A yield response or profit to maintenance fertilization usually is
not expected.
The interpretation and fertilizer recommendations systems used across the U.S. seldom strictly follow
these two concepts, and actually combine both to different degrees. For example, recommendations by the
University of Illinois are closer to the buildup/maintenance concept, those in Minnesota are closer to the
sufficiency level concept, and those in Iowa are intermediate. Kansas, however, provides interpretations
for both concepts. The main reason for use of the buildup and maintenance approach is that many soils
retain applied P but do not necessarily “fix” much P in forms unavailable for crops, and this allows for
both buildup and drawdown as management options within the cropping system. For example, Figure 3
provides an example of long-term soil-test P trends over time for various fertilization rates in a typical
Iowa soil with a corn-soybean rotation. Data in this figure also demonstrates two important characteristics
of soil-test P and fertilization relationships observed in many soils of the U.S. (but not necessarily all).
One is that with prevailing crop and fertilizer prices, moderate soil-test P buildup happens even with
economically optimum rates applied to low-testing soils. This is explained by only partial plant P uptake
of applied fertilizer, P recycling to the soil with crop residues, and soil properties that keep applied P
mostly in crop-available forms over time. The other important characteristic is that it usually takes higher
P application rates to maintain a high soil-test P level than low or medium levels. This occurs because of
increased P concentration of harvested products with increasing soil-test P (luxury P accumulation) and
increased P loss through erosion, surface runoff, or leaching through the soil profile.
The keys for developing sound soil-test P interpretation and nutrient application guidelines includes
information on crop response to fertilization and calibration of soil-test methods; profitability of
fertilization for different soil-test interpretation categories; long-term soil-test P trends as affected by

Chapter 3: Phosphorus Management | 10
fertilization, yield levels, removal, and plant-tissue P concentrations; and impacts of soil-test P levels on
water quality. Additional consideration of management philosophies, land tenure, and attitudes toward
risk (related to yield loss or gain, short-term or long-term profitability, and environmental impacts) can
influence development of soil-test P interpretations and P fertilization practices suitable to a large variety
of soils, production conditions, and producer management philosophies.
0 3 6 9 12 15 18 21 24 27 0 3 6 9 12 15 18 21 24 27
So
il-T
est P
(p
pm
)
0 3 6 9 12 15 18 21 24 270
10
20
30
40
50
60
70
80
= 69
= 46
= 23
= 0
lb P2O5/acre/year
Years of Cropping, Corn-Soybean Rotation
INITIAL P 18 ppm INITIAL P 40 ppm INITIAL P 63 ppm
Annual P
stopped
Annual P
stopped
Annual P
stopped
Figure 3. Change in soil-test P (Bray-1) over time with different initial soil-test levels and annual P
fertilizer rates in a corn-soybean rotation. Adapted from Mallarino, A.P. 2009. Long term phosphorus
studies and how they affect recommendation philosophies. p. 6-12. In North-Central Extension-Industry
Soil Fertility Conf. Proceedings. Nov. 14-15. Vol. 25. Des Moines, IA.
Phosphorus Fertilizer and Manure Management
Proper management of P applications is a key for optimizing yield, profitability, and water quality. There
are some considerations regarding P source, timing, placement, and rate that producers should consider in
order to maximize P use efficiency.
Phosphorus sources
The two most commonly used commercial P fertilizers in the U.S. are MAP (monoammonium phosphate)
and DAP (diammonium phosphate). There is no strong research data indicating different efficacy for
these products as long as the total P and N rates applied, and the application method and timing are the

Chapter 3: Phosphorus Management | 11
same. The slightly different manufacturing processes and different temporary pH when applied to the soil
do not result in clear P efficiency differences. Nitrification of ammonium in both fertilizers may result in
more acidic pH when using DAP, but this difference is negligible for normal P application rates and given
the much higher impact of the comparatively higher N fertilization for cereals.
Use of triple superphosphate (sometimes referred to as concentrated superphosphate) in the U.S. has
decreased greatly during the last two decades, and is difficult to find in many regions. This excellent P
source, and also simple superphosphate (which contains sulfur), are very important P sources in other
parts of the world, however. Use of ammonium polyphosphate and other polyphosphates in fluid
fertilizers is very common in the U.S. (such as in 10-34-0 and other mixtures). This P source hydrolyzes
rapidly in soil to phosphate after application (even partially during long storage) and, therefore, undergoes
similar sorption and precipitation reactions described for other P sources. Rock phosphate, which is
comprised of apatite and fluorapatite, is used only infrequently in the U.S. due to the low solubility of
these two minerals, especially at high pH. Organic producers frequently use this form of raw, unprocessed
P mineral as a nutrient source, but at very high rates and pulverized into fine particles due to its low
solubility and low available P concentration. Rock phosphates that are most suitable for direct application
are used extensively in other parts of the world, however, mainly for forages and pastures in acidic soils.
Applying manure to cropland sometimes presents different management issues and options from those
discussed above for P fertilizers. If manure is applied to meet crop N needs, more P may be applied than
is necessary to meet crop P needs. However, this varies greatly with the animal species and both feeding
and manure handling systems due to large impacts on the N:P concentration ratio in manure and the plant
availability of the manure N. Therefore, long-term manure applications may increase soil test P levels
well above critical levels, especially when applied to continuously to cereal crops to meet N fertilization
requirements. The crop-availability of manure P varies less than N, is less prone to large losses and the
significant transformations typical with manure N. However, plant P availability is affected by the animal
species and diet. Suggested manure P crop-availability values vary greatly across the U.S. Iowa research
has shown, for example, that the crop-availability of manure P compared with inorganic fertilizer ranges
from 60 to 100 % for beef or dairy manure and 90 to 100% for poultry or swine manure.
Manure management has become more of an issue the last few decades as crop and animal operations
have become concentrated in various regions of the country and because of public and government
concerns about manure management impacts on water quality. Environmental concerns related to
confined animal feeding operations (CAFOs) have become an issue in the humid regions of the U.S.
Phosphorus from animal manure should be managed as carefully as P fertilizer, with practices including:
Chapter 3: Phosphorus Management | 12
representative manure samples analyzed to determine nutrient concentrations; choose the manure
application rate according to crop nutrient requirements and for the crop availability of all manure
nutrients (not just for P); for manure P application rates consider the nutrient needs of crop rotations
rather than just individual crops; allocate manure to fields or within-field areas based on soil tests and
crops to be grown; consider the risk of P loss for the field or within-field areas by using a P risk
assessment tool (such as the P Index); and do not apply manure to snow-covered, frozen, or water-
saturated sloping ground when runoff risk is high.
Application Rate and Placement Method
Applying P fertilizer at rates higher than crop production requirements according to soil-test calibrations
and concepts discussed before is unwise from both environmental and economic viewpoints. There is no
agronomic justification for building P soil test levels higher than crop sufficiency levels. Phosphorus
losses in surface runoff have been shown to increase with increased P application rates. Therefore, once
the crop sufficiency levels have been reached, P applications should be made only as dictated by soil
testing and crop removal.
Phosphorus banding is recommended over broadcast and incorporated applications in soils that strongly
retain or transform applied P into forms that have low crop availability. Because banding reduces the
interaction of applied P with soil, P plant availability is enhanced and may increase use efficiency. Most
of the soils of the U.S. Corn Belt and eastern U.S. do not retain P so strongly, however, and research has
shown no large or consistent differences among P application methods (surface broadcast, broadcast and
incorporated, banded) with tillage or no-till management, except for soils with small acreage and for
starter fertilizer under some conditions. Even in these regions, however, banded P near the root zone
almost always enhances early crop growth, and tends to be more efficient at extremely low soil-test P
levels and with sub-optimal P application rates. In other regions or under special situations, banding is a
more efficient practice and provides benefits that more than offset the additional application cost. These
situations include soils with very high soil retention capacity, low rainfall regions, crops with a taproot
type of root system, or when root growth is limited. Figure 4 shows a generalized schematic
representation of the different types of outcomes for broadcast and band P application. Reasons for the
differences in response relate mainly to soil properties, but also the crop and management practices. Local
research should be used to help guide decisions for best P placement and application methods for different
soils and crops.

Chapter 3: Phosphorus Management | 13
CR
OP
YIE
LD
BAND
BROADCAST
P OR K FERTILIZER RATE
BAND
BROADCAST
BAND
BROADCAST
BAND
BROADCAST
Common result Common result
Less common Less common
Figure 4. Idealized possible differences between broadcast and band
P placement methods depending on crops and soil properties.
Adapted from Black, C.A. 1992. Soil fertility evaluation and control. Lewis Publishers.
Phosphorus placement may have important implications for risk of P loss with soil erosion and surface
runoff. The main concern with surface application of P is the increase in soil test P at the soil surface; at
the soil-runoff water mixing zone and where water or wind erosion occurs. The surface soil P buildup
may result in short-term (after a large runoff event shortly after application) or sustained long-term
contribution to risk of P loss. The main concern with P incorporation by tillage is the risk of increasing
the rate of soil erosion in sloping lands. Subsurface P application, without reducing P use efficacy by
crops, increasing soil or water loss, or an inordinate increase in application costs, would be an ideal
management practice for P.
Total runoff P loss may or may not be reduced with incorporation or subsurface injection of manure or
fertilizer P compared with surface application because loss also depends on the slope, soil hydrology, P
rate, and impacts of incorporation or injection on erosion and surface runoff. Generally, dissolved P in
runoff is higher with surface P application if the runoff event occurs shortly after application. However,
the increased risk with surface application decreases in the days and weeks following application.
Figure 5 demonstrates the effects of P rate, incorporation into the soil, and days after P application on the
risk of P loss with surface runoff. Reduced P loss occurs with lower P rates, a delay in runoff events after

Chapter 3: Phosphorus Management | 14
application due to time for retention by soil constituents, and incorporation into the soil. Similar results
were observed for inorganic fertilizer and poultry manure. The P loss can be greatly reduced by
incorporation of large P amounts into the soil when the tillage operation does not significantly increase
erosion and surface runoff mainly with runoff events shortly after application.
Figure 5. Effect of liquid swine manure P application rate, incorporation, and time (days after P
application) of simulated rainfall on runoff P loads (NS indicates no interaction between P rate and
incorporation). Adapted from Allen, B.L., and A.P. Mallarino (2008). J. Environ. Qual. 37:125-137.
Time of Application
From a nutrient use efficiency perspective in humid regions, the time of P application before the crop
planting date generally is a much less important factor than the time of N application. With the exception
of regions that have soils with very high P retention capacity, the timing of P application before planting
has little or no impact on P use efficiency by crops. This fact justifies, for example, widespread fall P
application for summer crops in the Corn Belt and the Great Plains and also application every other year
for some rotations. In soils that retain or transform applied P into forms of low crop availability, however,

Chapter 3: Phosphorus Management | 15
application well in advance of crop growth may reduce P use efficiency and there are often large
differences due to placement method (less efficiency with broadcast and incorporated application, for
example). On the other hand, in-season P application is not recommended, except for forages crops and
pastures, which is in clear contrast to N sidedress application. Many years of research has shown that an
adequate P supply is important early in plant growth, to stimulate development of photosynthetic leaf area
and increase grain sink size to maximize yield and P use efficiency.
The time of P application to the soil surface or of tillage to incorporate broadcast P may have a significant
impact on runoff P loss shortly after application. As was shown in Figure 5, P loss with surface runoff
from surface P application decreases significantly with a delay in the runoff event. A few days are needed
so that soluble P reacts with the soil and the phosphate concentration in solution decreases. Therefore, the
importance of incorporation and the P loss are higher when the P is applied during periods of high
probability of rainfall and surface runoff or with significant snow cover. The probability of large runoff
events typically is greatest in the spring due to snowmelt in northern areas and frequent high-intensity
rainfall in most humid regions of the U.S.
Variable rate P application
Dense soil sampling from many fields has shown very large within-field spatial variability of soil-test P
and crop yields. Precision agriculture technologies available to producers or custom applicators facilitate
application of fertilizer and manure at rates adequate for different parts of a field based on soil-test P and
estimated P removal. Iowa research has shown that grid or zone soil sampling methods combined with
variable rate application of fertilizer or manure P may not always increase crop yield or increase profits
compared with traditional application methods because the average effects on yield and amount of P
applied depends on the overall level and distribution of soil-test P values. Also, soil testing seldom is
performed on an annual basis, there is always a certain degree of sampling error (especially in fields with
high small-scale variability), and research has shown that relationships between P removal and soil-test P
are good over several years but not necessarily from year to year. Therefore, even with annual variable-
rate application, use of this technology is not perfect. However, on-farm research has shown that variable-
rate application of P fertilizer or P-based manure almost always minimizes or avoids P application to
high-testing areas, reduces soil test P variability within fields, and, as a consequence improves P use
efficiency and reduces risk of P loss by minimizing P application to high-testing field areas. Figure 6
shows, as an example, that use of variable-rate technology is an effective tool to manage P better. The
change in soil-test P was measured after applying P-based liquid swine manure for corn after three corn-
soybean rotation cycles. Similar results were observed with fertilizer application. In addition, variable-

Chapter 3: Phosphorus Management | 16
rate P application can be practically implemented on the basis of P-index ratings for field zones, not just
based on soil test P or estimates of P removal. Variable rate application of fertilizer P is common in the
Great Plains and the Corn Belt, and custom manure applicators also are beginning to apply manure at
variable rates. S
oil
-Tes
t P
Chan
ge
(ppm
)
-3
-2
-1
0
1
2
3
4
5
6
7
8
9
Very LowInitial Soil P
OptimumInitial Soil P
Low InitialSoil P
High InitialSoil P
Variable rate
Uniform rate
No P
Figure 6. Effect of uniform application and soil-test phosphorus (STP) based variable-rate
application of liquid swine manure on STP change within a field for various initial STP interpretation
classes. Adapted from Mallarino, A.P., and J.S. Schepers. 2005. Role of precision farming in phosphorus
management practices. p. 881-908. In T. Sims et al. (eds). Phosphorus: Agriculture and the Environment.
Agronomy Series 46. ASA, CSSA, SSSAJ, Madison, WI.
Summary
Proper P management is essential for many reasons: to maximize the profitability of crop production,
maximize efficiency of a non-renewable resource, reduce impacts of P use in crop production on surface
water quality, and avoid increased regulation. Phosphorus management is somewhat simpler than for N in
humid regions, due to differences in chemical transformations, no gaseous phase or volatilization, and
less influence of environmental factors on processes that control crop-available forms and losses. Also,
although the vast majority of P in soils is unavailable to plants because it is bound in insoluble P minerals
or sorbed strongly to soil particles, soil sampling and testing is more reliable and useful than testing for N
and other nutrients. The goal of sound P management in most regions of the U.S. should be to keep the

Chapter 3: Phosphorus Management | 17
soil-test P level at optimal ranges for maximum economic crop yield and utilize application methods and
timing that optimize P use efficiency and economic profitability, and minimize water quality impairment.
Substantial within-field variability of P soil-test levels and P removal with harvest in most agricultural
areas justifies the use of appropriate soil sampling, soil testing, application methods, and variable-rate
application technology to increase P use efficiency and reduce the risk of P loss to water resources. The
large variation across the U.S., and even within states, due to many factors means that best P management
will also vary. Therefore, any list of best P management practices always will need to be tailored to a
specific area, and likely will be incomplete in regard to meeting all potential P management issues.
Following is a list that encompasses the most important concepts underlying P management strategies.
Management Practices for P Fertilization:
1. Sample soil as frequently and as densely within fields as economically possible and use
appropriately calibrated soil-test methods based on research for each state or region.
2. Consider yield levels and crop P removal across and within fields to help maintain optimum soil-
test P levels in conjunction with soil testing.
3. Fertilize P deficient soils using environmentally and economically sound agronomic guidelines.
In general, soils testing ‘high’ or “very high” will not respond economically to additional P and
should not receive fertilizer except for starter in certain known and specific conditions.
4. Divide large, non-uniform fields into smaller fertility management units based upon yield
potential, soil tests, and relevant soil properties.
5. Credit all available P from manures and other organic sources when deciding the P application
requirements for crop.
6. Refer to local research and guidelines concerning P placement methods to optimize P use
efficiency, the profitability of nutrient application, and water quality protection.
7. Incorporate or inject high rates of inorganic or organic P sources into the soil where the risk of
surface runoff or soil erosion is high.
8. Use manure nutrient analysis and a P risk assessment tool such as the P Index in order to utilize
as much manure nutrients as much as possible without increasing the risk of P loss and water
quality impairment.

Chapter 3: Phosphorus Management | 18
Case Study
There are many different P management strategies for crop production that are used by producers across
the U.S. It is impossible to give one example representative for all geographic areas, crops, and current
management systems concerning options for improved P management. These would vary with soil type,
crop, rotation, climate, available fertilizer or manure, application equipment, and producer management
philosophy. The following example describes a P management system being used for a specific farm in
the U.S. Corn Belt, and includes possible practices the producer could consider to improve crop use
efficiency and economic return from P application while minimizing losses from fields that could impair
water resources.
Example scenario
A 1,000 acre farm in Western Iowa.
Soils are prairie-derived, well drained, and formed in loess on convex slopes and ridges. In
general topsoil texture is silty clay loam and slopes range from 0 to 15 percent.
The farm has fields with continuous corn and corn rotated with soybean.
The producer uses chisel-plow and disk tillage in about half of the fields and no-till in the other
half, and he has not built terraces.
The farmer has a large confined swine production operation. Liquid swine manure is broadcast in
the fall after crop harvest and before soils freeze or are covered with snow. The manure is applied
based on the manure N concentration and the corn N fertilization needs assuming 90% manure N
availability as suggested by Iowa State University manure nutrients management guidelines (220
lb total N for continuous corn and 165 lb total N/acre for corn after soybean).
The only P or K fertilizer applied in the farm is a small rate of N-P-K starter always applied for
corn.
Soil testing for P and K seldom is used.
Potassium deficiency is not likely in this farm and in most of the western Iowa region because
soils have naturally high soil-test K levels.
Chapter 3: Phosphorus Management | 19
In wet years, and especially in the fields with steeper slopes, the producer has noticed high
surface runoff after rainfall events. He has implemented no-till management in the fields with the
steepest slopes, but erosion can be observed in several fields.
This example scenario is not uncommon where nutrient management with manure is a challenge due to
multiple nutrients and emphasizes the potential benefits from development of an improved P management
plan. Following are some management options to consider. This set of agronomic practices is an example
of a properly designed nutrient management plan and would contribute to increased crop production by
enhancing P use efficiency and minimize environmental problems related to P losses.
It is important from the agronomic and environmental perspectives to have an estimation of
available soil P and K. This is crucial to adjust nutrient application rates in order to meet crop
requirements and/or prevent water contamination issues. In this specific case, the producer should
adopt a soil sampling and testing strategy because application of N-based manure for corn after
soybean may apply sufficient P for the corn crop, but may supply insufficient P for the soybean
crop or supply excessive amounts for the rotation. Or, if enough manure is not available to treat
all fields, the low starter rate will not supply adequate P and K for high yielding crops.
Application of an insufficient amount of manure nutrients will limit profitability and application
of an excessive amount will increase soil P beyond optimum levels and will therefore increase the
risk of P loss. With continuous corn, application of N-based manure each year undoubtedly will
increase soil P to unacceptable levels concerning risk of P loss and water quality impairment. Soil
sampling and testing strategies should be implemented based on either a zone sampling approach
considering topography, soil map units, yield level, or other field information; or on a grid
sampling approach, which in Iowa is based mostly on cells 2.5 acres in size. This information
would allow the farmer to know what parts of the farm or fields do not require additional P
application, where additional P is needed, or where soil P test levels are so high that there is a risk
to water quality. The frequency of soil sampling should be not less than 4 years; ideally every 2
years for the corn-soybean rotation and also the same frequency for continuous corn given the
high P loads with annual manure application.
Once soil P tests results are available, the next step is to plan manure application priorities in
order to improve as much as possible use of the manure P resource for crop production
profitability, and minimize chance of soil P buildup to levels above optimum for crops.
According to Iowa State University swine manure P has 90 to 100% availability for crops.

Chapter 3: Phosphorus Management | 20
Therefore, the producer should continue applying manure in fields or field areas with optimum or
lower P levels, which most likely will be for some of the fields managed with a corn-soybean
rotation. This allocation may also require manure be hauled to fields that historically have less
frequent manure application. Because N-based manure rates applied to corn almost always supply
sufficient P for the corn crop, complementary inorganic P fertilizer may be needed for the
soybean crop. The producer also should avoid or reduce manure applications in areas with
already high P tests, and apply additional inorganic N fertilizer for corn as needed. If there is
large within-field variation in soil-test P levels, the producer could use variable-rate manure and
fertilizer application equipment to improve nutrient management within fields.
The risk of P loss with runoff can be also reduced, and the manure-N use efficiency can
significantly be increased, by injecting the manure instead of broadcast applying in fields with
no-till management. Also, the producer could use low soil disturbance coulters and knives, which
are becoming more available and affordable, to further minimize soil erosion and P loss. And, any
P fertilizer needed for soybean in low-testing no-till areas could be applied in subsurface bands,
either with planter starter attachment or deep-banding before planting. Iowa research shows that P
banding seldom increases crop yield compared with a broadcast application in no-till, but this
practice can reduce the risk of P loss with surface runoff.
If the producer still wants to apply manure in areas testing above optimum, he should use the
Iowa P Index to determine if applying additional P to those areas increases the risk of P loss to
unacceptable levels. Using the P Index will indicate if additional P can be applied, and if it can be
applied, it will suggest the most effective soil or P management practices to assure the risk of P
loss does not increase. Given the conditions for this farm (sloping ground), controlling erosion
and surface runoff should be the most effective way of decreasing P loss. The adoption of
terraces, contour cropping, and/or no-till in additional fields with surface runoff would reduce
erosion and P loss, and also will increase the agronomic efficiency of the production system and
over time perhaps the profitability of the system as well.
The producer should also evaluate the possibility of eliminating the application of starter P in
areas with high P soil tests, especially with the corn-soybean rotation, because the low probability
of grain yield increases from starter P in those conditions.
Chapter 4: Potassium Management
Agustin Pagani, Antonio P. Mallarino, and John E. Sawyer / Department of Agronomy, Iowa State University Developed in cooperation with Lara Moody, TFI; John Davis, NRCS; and Steve Phillips, IPNI. Funding provided by the USDA Natural Resources Conservation Service (USDA-NRCS) and the Fertilizer Institute (TFI).
Introduction
Potassium (K) is abundant in most soils, but the vast majority is unavailable to plants. Plants require K for
photosynthesis; synthesis of ATP (an energy exchange compound), many carbohydrates, and proteins;
translocation of sugars, and nitrogen (N) fixation in legumes. Adequate K supply strengthens plant stalks
and stems, thus helping reduce lodging, and also increases resistance to several diseases through a variety
of mechanisms. Typical K-deficiency symptoms develop first in the older leaves and may consist of
yellow or white spots on the leaf edges (as in alfalfa, for example), chlorosis and necrosis of the leaf
edges (as in corn and soybean), or chlorosis of leaf tips (as in wheat).
When compared with other macronutrients, K total plant uptake is generally second only to N, and in
some crops such as sugar beets and potatoes K uptake exceeds N uptake. Annual K removal from fields
depends greatly on the plant part harvested, crop, and yield level; and ranges from 50 to 500 lb K2O/acre.
Table 1 shows an example of guidelines concerning K concentration per unit of yield for several crops.
Commercial K fertilizer analysis has historically been expressed as the oxide form (K2O) rather than the
elemental form (K). Therefore K uptake and removal values are usually expressed as K2O per unit of
yield. Using the ratio of their molecular weights, the amount of K2O can be converted to K by dividing by
1.2. To estimate K2O uptake, multiply the yield by the amount in the table per unit of crop yield
harvested.
In contrast to phosphorus (P), the K concentration and removal with grain harvest of cereals is a much
smaller proportion of the total plant uptake. Most grain crops reach the maximum K uptake before
physiological maturity, and the total K contained in aboveground plant parts can even decrease by grain
maturity. Figure 1 shows, as an example, the total K uptake by wheat and its distribution among plant
parts during the growing season. Therefore, if most of the plant material is removed at harvest (such as for

Chapter4:PotassiumManagement|2
corn silage or biomass for bioenergy), K removal can result in a severe depletion of soil available K.
Also, because the absorbed K ions are not incorporated into plant organic compounds and are soluble in
water, leakage of K from vegetative plant tissue or crop residues is an efficient recycling mechanism to
the soil.
Table 1. Potassium amounts in harvested portions for selected agricultural crops.
Crop Unit of Yield Pounds K2O per unit of yield
Corn bu 0.3 Corn silage bu grain equivalent 1.3
Soybean bu 1.5 Oat and Straw bu 1.0 Wheat bu 0.3
Sunflower 100lb 0.7 Alfalfa ton 40
Tall fescue ton 66
Source: Iowa State University Extension publication PM 1688.
Plant uptake can also influence the recycling of available K from deep in the soil. Deep-rooted plants can
act as nutrient pumps by transferring K from the subsoil to the surface layers. This process makes
previously inaccessible K available for shallow rooted crops.
Figure 1. Potassium accumulation during growing season for hard red spring wheat. Adapted from Jabosen et al. (1992). Montana AgResearch 9:23-26.

Chapter4:PotassiumManagement|3
Potassium application and management does not result in water quality concerns as with N and P. An
understanding of K reactions in soils, cycling, and availability for crop is important to improve K use
efficiency, to meet crop K needs in a profitable way, and to help with K management decisions.
Potassium Processes in the Soil-Plant System
Forms of Soil Potassium
The vast majority of soil K is contained in unweathered primary minerals such as feldspars and micas
(muscovite, biotite, and others). The top layer of most soils contains thousands of ppm of mineral K, but
the K in the crystal structure of these minerals is released very slowly over dozens or hundreds of years
and has no relevance for crop nutrition. Other soil K pools include dissolved K+ ions (solution K),
exchangeable K, and slowly exchangeable K (often referred to as nonexchangable K in textbooks).
Readily plant-available K includes the solution and exchangeable K fractions, and there is a fast
equilibrium between these two fractions in response to K additions and plant uptake or leaching. The
exchangeable K fraction contains hydrated K+ ions weakly sorbed to the negatively charged surfaces of
mineral soil particles and organic matter, and can rapidly replenish the solution K pool as K is taken up by
plants. Plants can only directly use K from the soil solution, yet solution K concentrations range from
only 1 to 10 ppm except shortly after fertilization, and the exchangeable K fraction in U.S. soils may
range from about 20 to 1,000 ppm. The slowly exchangeable K is held within clay layers by stronger
bonds and is not readily exchangeable or available to plants in the short term (days or weeks). In soils of
the U.S., the amount of K held in this fraction varies greatly, and may range from about 100 up to 2,000
ppm.
Potassium Exchange and Reactions in Soils
When solution K is depleted due to plant uptake or leaching, K desorbs from the soil particles and enters
the solution. When the amount of solution K is increased by fertilization or K leaching from crop
residues, added K will also be held on the soil exchange capacity (CEC) sites. Fine-textured soils with
high CEC generally have large exchangeable K concentrations and a strong capacity to maintain a
sufficient K supply to the soil solution and for plant uptake throughout the growing season. Low CEC
soils often lack the capacity to sorb sufficient K reserves to satisfy crop requirements over a growing
season.
Exchange reactions involving the slowly exchangeable K fraction are important in the long term (weeks
to years), and can dominate processes affecting the long-term crop availability of K mainly in soils with

Chapter4:PotassiumManagement|4
predominant mica (illite) or vermiculite clay types. A portion of the K in this fraction may become plant
available during the growing season and over the years; conversely, some added K may become strongly
retained and nonexchangeable. Both processes are highly influenced by the opening (peeling apart) and
closing of sheet-like clay crystal structures near fracture borders in response to drying-wetting, freezing-
thawing, changes in soil aeration, or long-term weathering (Figure 2).
Figure 2. The opening and closing of layered clay minerals releases K into solution and also can retain K in a form that may be unavailable to plants. Adapted from McLean (1978), Potassium in Soils and Crops.
Potassium retention and release by clay, and its availability to plants can be affected by soil pH. As the
pH increases (i.e., with increased lime application, for example) in very acid soils having exchangeable
aluminum (Al), which are common in the southern and southeast regions of the U.S., the soil capacity to
retain K (and added calcium) in an exchangeable form increases mainly because the liming transforms
exchangeable Al into insoluble forms. In acid soils without exchangeable Al, the effect of a pH increase is
less clear concerning availability to plants. As the pH increases due to liming, the soil CEC is increased
and H+ ions are removed from cation exchange sites, and more exchange sites are available for holding K+
and calcium ions (Ca2+) in an exchangeable form. However, high amounts of Ca2+ can reduce crop uptake
of K, and the pH increase can cause the collapse of expanded clay layers and trapping of K ions in the
non-exchangeable form.
Soils with high K-fixing capacity typically show a smaller soil-test K (STK) response to fertilizer
application than other soils because a portion of the supplied K can quickly bind to clays in a
nonexchangeable form. A soil with high K-retention capacity will generally be capable of sustaining
available K levels to a crop over many years of production, thereby buffering the crop removal of K. This
property has been called the ‘K supplying power’ of a soil. A sandy soil and a clay loam soil may have

Chapter4:PotassiumManagement|5
the same initial exchangeable K levels, but their response to crop uptake and removal of K will be
different because sands have low CEC and, therefore, a lower K supplying power than clay loams
(Figure 3).
Figure 3. Soils with the same initial K level may have very different abilities to supply K to crops over time. Adapted from Hoeft et al. (2000), Modern Corn and Soybean Production.
Potassium: A Relatively Immobile Nutrient
As a result of K exchange reactions and retention in soils, K moves only short distances through soil and
only slightly more than P. The amount of K that reaches the root surface with water mass flow is not
sufficient to supply plant needs, and K ion diffusion through the soil solution is the main mechanism of
plant K uptake. This characteristic has several important consequences. Factors that limit the rate of K
diffusion and both the rate of root growth and the size of the root system can limit K uptake. These
include cold temperature and low moisture (which limit diffusion and root growth), soil physical
properties that inhibit root growth, and diseases or pests that impair root function. Therefore, induced K
deficiency may occur even with presumably adequate soil-test K levels. In these situations, placement that
puts applied K near young plant roots may increase plant growth and yield compared with broadcast
application.
The amount of K loss with leaching through the soil profile is much less than K loss with erosion and
surface runoff in most soils and landscapes. In coarse-textured soils or in moderately textured soils with
sustained high K applications, K can move through the profile and increase subsoil K concentrations or
leach to groundwater or surface waters through subsurface tile drainage. Therefore, although K does
constitute a water quality problem, minimizing soil erosion and excess application to coarse textured soils
will help maximize K utilization by crops.

Chapter4:PotassiumManagement|6
Potassium Soil Testing
The primary goal of soil testing for K is to estimate the supply of K available to a crop. Solution and
exchangeable K are the most important forms for plant growth, but the estimate of exchangeable K is far
more important than the solution K fraction. The STK methods used in the U.S. measure solution K and
most of the exchangeable K. The most widely used methods extract K with the ammonium acetate and the
Mehlich-3 methods, but a few states use the Bray-P1, Morgan, or Mehlich-1. In contrast to P, the
measurement of extracted K can be done by various laboratory procedures that give the same result Only
the top six to eight inches of soil is generally tested for K because the surface soil is the most significant
source of K for most plants, although in a few states a shallower sampling depth is recommended for
pastures and no-till. The relationship between STK and relative yield response in the U.S. has been a
subject of significant research (Figure 4). Soil test levels are categorized into low, medium (or optimum),
or high, and sometimes also into ‘very low’ and ‘very high’ (or excessive) categories. At STK levels
below the ‘critical level or range’ (usually medium or optimum) the probability that a yield increase will
result from fertilizer addition is high. Above the critical level, small or no yield responses to K
fertilization would generally be expected.
Soil K Availability (ppm)
Rel
ativ
e Y
ield
20
40
60
80
100
Very low Very highLow HighMedium
Figure 4. Relationship between soil-test K level and crop yield.
The STK and exchangeable K levels can change significantly during the year due to effects of crop
uptake, soil moisture and rainfall, and different rates of recycling of K in crop residues. This happens also
for other nutrients, but is especially the case for K. As an example, Figure 5 shows how STK changes due

Chapter4:PotassiumManagement|7
to crop uptake and also soil moisture. Figure 6 shows how the rapid recycling of K from crop residues,
which is faster and of greater magnitude than with P. Soil STK levels are usually highest and more stable
a few weeks or months after crop harvest and with normal moisture, and before plant uptake becomes
substantial. Over the growing season, K is removed from solution and exchange sites by plants, so STK
will be lowest from mid-season to crop physiological maturity. Therefore, the time of year that soils are
sampled is critical for effective K management and must be consistent over time in order to monitor the K
fertility of a site over time. Different states may have different sampling date recommendations as soils,
climate, and crops vary greatly across the U.S.
MONTH OF THE YEAR
J J A S O N D J F M A M J J A S O N D J F M A M J J A S O N D J F M A
SO
IL T
ES
T K
(p
pm
)
60
70
80
90
100
110
120
130
140
150
160
170
SO
IL M
OIS
TU
RE
(%)
0
10
20
30
40
501994 199719961995
Figure 5. Relationship between soil moisture and soil-test K levels in an Illinois soil (Dixon Springs Agricultural Center). Soil-test K data adapted from S.A. Ebelhar and E.C. Varsa. 1999. Tillage and
potassium placement effects on potassium use efficiency in a corn-soybean rotation. Illinois Fertilizer Conference Proceedings. January 25-27, 1999. University of Illinois, Urbana-Champaign. Moisture data
adapted from T. R. Peck (University of Illinois, unpublished).

Chapter4:PotassiumManagement|8
Sep Oct Nov Dec Jan Feb Mar Apr May
Tis
sue
K C
once
ntra
tion
(%)
0.0
0.5
1.0
1.5
2.0
Sep Oct Nov Dec Jan Feb Mar Apr May
Tis
sue
K C
onte
nt (
lb K
2O/a
cre)
0
20
40
60
80
100
120
140
160
Vegetative tissue atgrain harvest time
Crop residues
Vegetative tissue atphysiological maturity
Vegetative tissue atgrain harvest time
Crop residues
Vegetative tissue atphysiological maturity
K180K0
K180K0
Figure 6. Concentration and amount of potassium in soybean plant tissue (except grain) from
physiological maturity until grain harvest and in residue until the following spring for two K application
rates. Adapted from R.R. Oltmans and A.P. Mallarino (2011). Identification of reasons for high temporal
soil-test potassium variation. p. 65-73 In North-Central Extension-Industry Soil Fertility Conf.
Proceedings. Nov. 16-17. Vol. 27. Des Moines, IA.
Potassium Fertilizer Recommendation Concepts
The interpretation of soil-test results in terms of sufficiency for crops and the amount of nutrient to apply
are determined from many field trials on different soils over many years. Interpretations of STK results
concerning fertilization rates vary greatly across regions due to different crops, soils, or economic issues
related to crop response to nutrient application. Also, interpretations differ due to different concepts and
assumptions concerning nutrient management in relation to the crop production system. The concepts of
sufficiency level and buildup/maintenance for P, K, and other immobile nutrients have been widely
discussed in soil fertility circles.
According to a strict sufficiency level concept, the soil nutrient availability should be determined by soil
testing and the nutrient application rate for a given STK level should be the one that results in maximum
yield or maximum economic yield. This approach emphasizes short-term profitability from fertilization,
high return per pound of fertilizer applied, and reduced risk of fertilizer over-application by accepting a
moderate risk of yield loss. It requires frequent use of soil-testing and a research data base that accurately
predicts the nutrient need for different soil-test values. A strict build-up and maintenance concept
emphasizes increasing soil-test levels to a desirable level in a short period of time by applying rates
higher than those needed to achieve maximum yield or maximum economic yield. This approach reduces

Chapter4:PotassiumManagement|9
the risk of yield loss due to insufficient nutrient levels and emphasizes long-term productivity and
profitability from fertilization. It may not require frequent soil testing or accurate soil-test calibration, but
requires knowledge of fertilizer rates needed to maintain soil-test values over time, which usually is based
on measured or estimated K removal with crop harvest. A short-term yield response or profit to
maintenance fertilization usually is not expected.
The soil test interpretation and fertilizer recommendation systems used across the U.S. seldom strictly
follow these two concepts. For example, recommendations by the University of Illinois are closer to the
buildup/maintenance concept, those in Minnesota are closer to the sufficiency level concept, and those in
Kansas provide recommendations for both concepts. The main reason that allows the use of the buildup
and maintenance approach for K is that many soils retain applied K but do not “fix” it in forms
unavailable for crops, and this allows for both buildup and drawdown as management options within the
cropping system. For example, Figure 7 provides an example of long-term relationships between K
removed with harvest and STK for several typical Iowa soils managed with corn-soybean rotation. Data
in this figure shows high temporal variability of STK (much more than for P), but shows a linear
relationship between K removal and STK over the long term.
The keys for developing sound STK interpretation and K application guidelines includes appropriate
information for crop response to fertilization, calibration of soil-test methods, and profitability of
fertilization for different soil-test interpretation categories; long-term STK trends as affected by
fertilization, yield levels (because of removal), and K concentration of harvested plant parts. Additional
consideration of management philosophies, land tenure, and attitudes toward risk (related to yield loss or
gain, short-term or long-term profitability, and environmental impacts) can influence utilized STK
interpretations and K fertilization practices suitable to a large variety of soils, production conditions, and
producers. Applying K fertilizer at rates higher than crop requirements or to soil testing higher than
recommended is unwise from economic and resource conservation perspectives. There is no agronomic or
economic justification for building STK levels higher than sufficient for crop needs.

Chapter4:PotassiumManagement|10
Gra
in K
Rem
oval
(lb
K2O
/acr
e)
-400
-300
-200
-100
0
125
175
225
275
-500
-400
-300
-200
-100
0
80
100
120
140
160
-400
-300
-200
-100
0
100
125
150
175
200
-500
-400
-300
-200
-100
0 Soil-T
est K (ppm
)100
120
140
160
1994 1996 1998 2000 2003-500
-400
-300
-200
-100
0
150
175
200
225
250
NERF NIRF
NWRF SERF
SWRF
1994 1996 1998 2000 2003-500
-400
-300
-200
-100
0
120
140
160
180
200AVG
STKSTK
CornCornSoybean Soybean
STK
STK
STK
STK
Figure 7. Soil-test K and cumulative K removal long-term trends for five Iowa sites and the average.
From Mallarino et al. (2011). Factors determining high temporal soil-test potassium variation and soil
sampling and testing alternatives. In Proceedings, North Central Region Soil and Plant Analyst
Workshop. Feb. 23-24, 2011. Bettendorf, IA. Available at http://ncera-13.missouri.edu/publications.htm.
Fertilizer and Manure Potassium Management
Potassium Sources
Potassium fertilizer is available commercially mainly as potassium chloride (KCl, 0-0-60), potassium
sulfate (K2SO4, 0-0-50), and potassium nitrate (KNO3, 13-0-44). The potassium is all water soluble for
these sources. These sources (especially potassium nitrate) have the potential for inhibiting plant growth
due to salt effects (the plant cannot get enough water from the soil) if applied in excess and close
proximity or with the seed. Potassium chloride accounts for over 95% of all K fertilizer sold in the U.S.
because it is mined from raw KCl deposits, and minimal processing and transportation make this the most
economic K source. Potassium sulfate is primarily used where Cl toxicity or sulfur (S) deficiency is a
problem. Potassium nitrate also is a source of N, but is expensive and is widely used only for foliar sprays
of K application to fruits and vegetables.
Chapter4:PotassiumManagement|11
Potassium in organic sources, manures and sewage sludge, occurs predominantly as soluble inorganic K+
and is readily available for crop uptake. In animal manures, the K concentration ranges between 0.2 and
2% of dry matter, so large application rates are required to meet crop needs.
Placement Method and Timing
There are many ways of applying K to crops and most considerations, except potential salt effects, are
similar to those for P fertilizers. Band applications concentrate nutrients at or near the root zone, which is
important for young plants with limited root systems, particularly in cold and/or compacted soils. The
"starter" effect from K is much less than for N and P, however, and too much K fertilizer close to the seed
can reduce seed germination and injure roots due to high salt concentrations. Band K should be placed
beside and below the seed level to reduce potential damage or by using very low rates if it is applied to
the seed furrow. Band K applications can be more effective than broadcast application in soils with a
strong capacity to retain added K in forms of low plant availability. This may be the case in soils with
very high clay content or soils with significant levels of vermiculate in the clay fraction. Otherwise, and
in most regions, broadcasting K fertilizer before planting is a convenient and low-cost way for applying
high amounts of K fertilizer. Research with corn, mainly in Iowa and Minnesota, has shown that deep
banding of K can be more effective than other placement methods, especially for ridge-till and sometimes
for no-tillage and strip-tillage. The research demonstrated that the cause of increased efficiency of this
method does not necessarily relate only to STK stratification typical for these systems, and that is
explained by water availability deeper in the soil profile when the top few inches of soil are dry.
With the exception of regions that have soils with very high K retention capacity, the timing of K
application before planting has little or no impact on K use efficiency by crops. This fact justifies, for
example, widespread K application in the fall for summer crops in the Corn Belt and the Great Plains, and
also application every other year for some rotations. In soils that retain or transform a significant
proportion of applied K into forms of low crop availability, however, application long in advance of crop
growth may reduce K use efficiency and often there are large differences between placement methods
(less efficiency with broadcast and incorporated application, for example).
Variable Rate Potassium Application
Dense soil sampling in many fields has shown very large within-field spatial variability of STK, crop
yield levels, and crop response to K fertilization. Figure 8 shows an example of the variation in corn yield
response to K fertilization for field areas 10 to 25 acres in size that had different STK values. Precision

Chapter4:PotassiumManagement|12
agriculture technologies available to producers or custom fertilizer applicators facilitate application of
fertilizer and manure at rates adequate for different parts of a field based on STK and estimated K
removal. Grid or zone soil sampling methods, combined with variable rate application of fertilizer or
manure K, may not always increase crop yield or increase profits compared with traditional uniform rate
application, because the average fertilization effect on yield and amount of K applied depends on the
overall level and distribution of STK values. Also, soil testing seldom is performed on an annual basis,
there is always a certain degree of sampling error (especially in fields with high small-scale variability),
and research has shown that short-term relationships between K removal and STK are very variable.
Therefore, even with annual soil sampling and variable-rate application, use of this technology faces
challenges for K management. However, variable-rate application of K fertilizer minimizes or avoids K
application to high-testing areas within fields, reduces STK variability, and as a consequence, improves K
use efficiency. Variable rate application of K fertilizer is now common in the Great Plains and Corn Belt.
Co
rn Y
ield
In
cre
as
e (
bu
/ac
re)
0
10
20
30
40
50
60
70
80
OH
L
O
VL
L
O
VL
OH
Field 4 Field 6
Field 3
Field 5Field 2
O
H
Field 1
LO
VL
L
Field 7 Field 8
VLVL
VL
VL
L
L
LL
H HO
L = 91 to 130O = 131 to 170H = 171 to 200
VL < 90 ppm
Soil K Classes
Figure 8. Within-field soil-test K variability and yield response variability from eight representative strip
trials conducted in Iowa (field identifiers are arbitrary codes). From A.P. Mallarino and D.J. Wittry
(2006). Variable-rate application for phosphorus and potassium: impacts on yield and nutrient
management. p.219-224. In The Integrated Crop Management Conf. Proceedings. Nov. 29-30, 2006.
Iowa State Univ. Extension. Available at
http://www.agronext.iastate.edu/soilfertility/info/mallarino_Variable-PK%202.pdf

Chapter4:PotassiumManagement|13
Summary
Effective K management requires not only a thorough understanding of K reactions in the soil, but also an
awareness of how climate, aeration, and moisture can affect the capacity of a plant to access the large
reserves of soil K. Potassium exists in large, albeit finite amounts in soils, but the readily available forms
can be depleted during short period of high crop demand or over long-term crop production.
Proper management of K is essential to maximize the profitability of crop production as well as maximize
the efficiency of a non-renewable resource. Potassium management, as well as P management, is
somewhat simpler than for N in humid regions due to relatively easier to predict chemical transformations
and no gaseous phase or volatilization problems. Also, although there is more temporal variability of STK
and uncertainty with soil testing than for P, soil sampling and testing for K is still a useful diagnostic tool.
The goal of sound K management in most regions of the U.S. should be to keep the STK level at optimal
ranges for maximum economic crop yield and utilize application methods that optimize K use efficiency
and profitability. Substantial within-field variability of STK and K removal with harvest in most
agricultural areas justifies the use of appropriate soil sampling methods and variable-rate application
technology to increase K use efficiency.
Best Management Practices for K Fertilization:
Any list of best K management practices will need to be tailored to a specific region because of large
variation in crops, soils, and production systems; and likely will be incomplete in regard to addressing all
potential issues. However, the following list includes the most important concepts underlying K
management strategies.
1. Sample soil as frequently and densely as possible, and use appropriately calibrated soil-test
methods based on research for each state or region.
2. Consider yield levels and crop removal between and within fields to help maintain optimum soil-
test K levels in conjunction with soil testing.
3. Fertilize K deficient soils using economically sound agronomic guidelines. In general, soils
testing ‘high’ or “very high” will not respond economically to additional K and should not
receive fertilizer except for a small amount of starter fertilizer in certain specific conditions.

Chapter4:PotassiumManagement|14
4. Divide large, non-uniform fields into smaller fertility management units based upon yield
potential, soil tests, and relevant soil properties.
5. Account for crop available K applied with manures and other organic sources when deciding on
K application requirements.
6. Refer to local research and guidelines concerning K placement methods to optimize K use
efficiency and the profitability of nutrient application.
Case Study
Several K management strategies and philosophies are used by producers across the U.S. One example
representative for all geographic areas, crops, and current management systems is not possible. Therefore,
the following situation and suggested options for improved management apply to a specific farm in the
U.S. Corn Belt. However, many issues and possible practices the producer could consider to improve crop
K use efficiency and economic return from K application apply to other regions.
Example scenario
• An 800-acre dairy farm in northeastern Iowa.
• Soils are well drained, moderately permeable, are of loam, silt loam, or silty clay loam texture,
and slopes range from 2 to 12 percent.
• The farm has fields with continuous corn and others in a rotation consisting of three years of
alfalfa, two year of corn, and then soybean one year. About one-half of the corn is used for silage that is
fed to dairy cattle.
• The producer uses chisel plow in approximately one-half of the fields and no-till in the other half.
• Some corn fields receive high rates of dairy manure, including for corn after the last alfalfa
production year. Large quantities of manure are produced in the overall farm operation, which is applied
without using manure nutrient analyses or soil testing.

Chapter4:PotassiumManagement|15
• For many years the farmer has assumed that sufficient amounts of nutrients are applied with the
dairy manure, including K, so only occasional fertilizer application is used. This fertilizer is mainly N for
the continuous corn and some broadcasts K fertilizer (as potassium chloride) to some fields with alfalfa.
• The dairy manure is broadcast and incorporated by chisel plowing and disking in fields managed
with tillage (all with continuous corn), but is not incorporated or injected in fields managed with no-
tillage.
• In recent years, especially after harvesting some high yielding corn silage, the farmer has noticed
older corn leaves on the lower part of plants with yellow or brown edges in spots, and also wonders about
apparently increasing within-field variation of yields of both corn and alfalfa.
The farmer's recent observations are consistent with likely K deficiency given the crop and nutrient
practices that he has been using. This scenario could be a frequent situation in geographic areas with
crops that remove large amounts of K when manure and soil analysis are not used as it should, and the
manure is not managed appropriately. With the high nutrient removal with alfalfa and corn silage harvest,
it is likely that the amount of K applied is not adequate to maintain soil test K at optimum levels. This,
together with uneven or not careful manure application, will lead to extreme variation in soil tests across
and within fields, and limited crop yields at least in some areas.
Following are some new management options to consider:
• It is very important from the agronomic and economic point of view to monitor soil nutrient
levels routinely. This is crucial in order to adjust nutrient application rates to meet crop requirements,
maximize profitability, and avoid potentially high risk of water quality impairment due to excess N and P
loss from fields. In this specific case, it is very likely that the spotty K deficiency symptoms in corn, and
large within-field crop yield variability, is due to continued uneven application of dairy manure without
consideration of K being applied and varying yields. For example, corn silage harvest removes almost
four times more K than grain only harvest. Harvest of a high yielding alfalfa crop can result in even more
K removal than a high yielding corn silage crop. While soybean is a minor crop in the rotations, soybean
grain harvest will remove more K than corn grain harvest. Therefore, the producer should adopt a soil
sampling strategy for monitoring soil test levels, K in particular, and within-field soil test variability. An
ideal sampling strategy would be a 2.5 acre grid sampling on all fields, or a less dense zone sampling
Chapter4:PotassiumManagement|16
approach that considers at least soil map units and topography. Some measurement of within-field yield
variation would be very useful, although this is easy and of relatively low cost only for grain yield with
yield monitors and GPS. The soil sampling frequency should reflect the crop rotation. For example,
sampling before each new alfalfa seeding and before the first-year corn after alfalfa, and every two to
three years in the continuous corn. The soil test information would allow the farmer to know what fields
and field areas require supplemental K fertilizer application, and if excess manure P is being applied to
some fields or field areas.
• The farmer should have a regular manure sampling and analysis program so the amount of
nutrients applied can be appropriately determined. In fact, regular soil and manure analyses are beginning
to be required by many NRCS programs and state agencies in charge of preserving environmental quality.
Once a K soil test map of the farm is carefully studied, the next step would be to target dairy manure or K
fertilizer application in field areas with lower K levels and avoid/reduce applications in areas with high K
levels and/or excessive soil-test P levels (if they exist). Consideration should be made for the needed N, P,
and K. For example, if soil test P is very high, and K soil test is low, then fertilizer K should be applied
instead of manure. If the field is rotating from alfalfa to first year corn, then manure application should be
avoided, or only a low rate should be applied, since first-year corn after alfalfa crop requires little or no
additional N. Application of manure or fertilizer can be accomplished by using conventional
manure/fertilizer application practices, or variable rate application equipment depending on the degree
and scale of P and K spatial variability and the availability of variable-rate technology equipment.
• The dairy manure should be injected when it is applied to fields managed with no-tillage. This
will increase manure N use efficiency (by reducing ammonia volatilization) and will reduce the risk of P
loss with surface runoff. Known crop availability of N, P, and K in dairy manure, and the diversity of
cropping and harvest systems being used in this dairy farm (and in most farms that include animal
production), present a serious challenge concerning maximum use of the manure resource while attending
to crop nutrient needs and risk of water quality impairment due to excess N and P application.
• In order to properly maintain adequate K supply for all crops and minimize the risk of excessive
N and P loss, the farmer has to appropriately consider manure and inorganic fertilizer application rates,
avoid application of N at rates much higher than needed by each corn crop, and use an environmental P
risk assessment tool (such as the P Index). Use of the P Index helps to determine what fields or field areas
testing high in P can have application of manure to supply N and K, and will not result in excessive risk
of P loss and water quality impairment.

Chapter 5: Sulfur Management
Agustin Pagani, John E. Sawyer, and Antonio P. Mallarino / Department of Agronomy, Iowa State University Developed in cooperation with Lara Moody, TFI; John Davis, NRCS; and Steve Phillips, IPNI. Funding provided by the USDA Natural Resources Conservation Service (USDA-NRCS) and the Fertilizer Institute (TFI).
Introduction
Sulfur (S) is often classified as a “secondary” plant essential element, mainly due to a smaller plant
requirement but also because it is less frequently applied as a fertilizer and in smaller amounts compared
to other nutrients like the “macronutrients” nitrogen (N), phosphorus (P), and potassium (K). However, if
deficient, S can have a dramatic effect on plant growth and crop productivity – more than the
classification “secondary” would imply.
Sulfur is a constituent of three amino acids which are essential to protein synthesis and represent
approximately 90% of the S content in plants. Sulfur is also necessary in the formation of chlorophyll,
vitamins, enzymes, and aromatic oils. As a constituent of amino acids, sufficient S is essential for high
protein content in forages. Research has shown that S plays an important role in crop quality such as
wheat grain for making bread and protein content of forages and grains. Breadmaking varieties of wheat
have approximately 10% more S in grain than non-breadmaking varieties, although total plant S uptake is
similar. Two important factors related to breadmaking are loaf volume and dough extensibility. Both of
these factors are directly related to S concentration in grain, which in turn is dependent upon available S
in the soil.
Sulfur deficiencies are on the rise in the U. S. and throughout the world. Three global trends are
responsible for increasing S deficiencies:
1) The shift in modern fertilizers to more concentrated, higher-analysis products containing little to
no S (historically S was a co-product of the manufacturing process);
2) The reduction of sulfur dioxide (SO2) emissions from burning coal and oil, which decreases
atmospheric S additions; and

Chapter5:SulfurManagement|2
3) The steady increase in crop S uptake and removal due to high-yielding varieties and more
productive management.
Plants require significant S, with uptake varying considerably between crops. For example, alfalfa is a
greater S demanding crop than corn. Also, the plant component harvested affects S removal. Harvesting
all above ground material will result in more S removal. For example corn grain versus corn silage, stover
removal or grazing, and multiple forage crop harvest. Table 1 lists the S removal per unit of yield, and can
be used for estimating S removal. Crops take up S in the sulfate (SO42-) form. They do not take up
elemental S. Sulfate-S usually represents less than 10% of total S in the upper soil profile, with most S
contained in the soil organic matter.
Sulfur deposition from the atmosphere can represent a significant S input, especially in locations down-
wind from sources, such as coal-burning facilities, metal smelters, geo-thermal areas, and urban areas.
Atmospheric sulfate-S deposition ranges significantly, but usually is between 3 to 11 lb S/acre. In
addition, plants can absorb sulfur dioxide directly from the air. Figure 1 shows a recent U.S map with
sulfate wet deposition mainly due to industrial activity. Also, irrigation water can be a significant source
of plant available S.
Figure 1. Sulfate wet deposition for the U.S. in 2009. Source: National Atmospheric Deposition Program/National Trends Network. http://nadp.sws.uiuc.edu.

Chapter5:SulfurManagement|3
Table 1. Sulfur amounts required by common agricultural crops.
Crop Unit of Yield Pounds of S per
unit of yield Corn bu 0.07
Corn silage ton 0.58 Soybean bu 0.10
Oat and Straw ton 4.50 Wheat bu 0.08 Barley bu 0.08 Alfalfa ton 5.00 Clover ton 3.00
Adapted from Modern Corn and Soybean Production. 2000. MCPS Publications.
Sulfur deficiency looks similar to N deficiency (yellowing and interveinal chlorosis), but because S is not
very mobile in the plant, the younger leaves tend to show the deficiency first versus the older leaves as in
N deficiency. With severe deficiency, the entire plant will have yellowing and reduced growth or spindly
stems. Efficient N utilization requires adequate S because both are needed to form proteins in the plant.
Sulfur is also needed for N fixation by legumes. Effective management of S requires an understanding of
the processes that determine its availability to crops and the methods to manage soils with inadequate S
levels.
Basic Sulfur Processes in the Soil-Plant System
Mineralization and Immobilization
Organic S compounds held in plant and microbial residues collect in the soil organic matter (OM) and
represent the largest S pool in many soils. Over 90% of the total S in these soils exists in the organic
form, except in soils where accumulations of gypsum (CaSO4, calcium sulfate) are significant.
Microorganisms decompose the OM and release plant available S through the process of mineralization,
similar to that with N cycling. About 1 to 3% of organic S is mineralized each year, contributing 4-13
lb/acre of inorganic sulfate-S annually. The amount of S made available to plants annually via
mineralization depends on the soil OM content and conditions suitable for mineralization. Therefore,
practices to maintain or increase soil OM can help with plant available S supply.
Immobilization is the microbial process of converting inorganic sulfate-S to organic materials, and is
essentially the reverse of mineralization. Microorganisms use available S from the soil and convert it into

Chapter5:SulfurManagement|4
proteins and other organic compounds. Although this process removes S from the available pool, the S is
still in a reserve pool that could eventually become available to plants via mineralization.
Since mineralization and immobilization are primarily biological processes, factors affecting microbial
growth will influence these S transformations. Important factors include soil temperature, soil moisture,
pH, C:S ratio, aeration, and residue composition. The highest mineralization rates will occur under
aerated, warm, and moist conditions with near neutral pH levels because these conditions are optimal for
microbial activity. Conversely, cold-dry soils will have slow mineralization and low production of
sulfate-S.
The N:S ratio is relatively stable in soil OM, remaining near 8:1; however the C:S ratio is more variable
and strongly affects relative mineralization and immobilization. If residues and organic matter lack
sufficient amounts of S, microbes will pull the needed available S from the soil and thus reduce plant
available S.
Sorption and Precipitation
Inorganic S occurs in solid phases in the soil as sorbed S or S-containing minerals. Sorption of sulfate
increases as anion exchange capacity (AEC) and clay content of soils increase. Highly weathered and acid
soils dominated by positively charged Fe/Al oxide will have a high AEC and therefore sorb significant
sulfate. Also, because sulfate interacts with soil clays, soils will retain sulfate, including sulfate
accumulation in the subsoil where clay content is high in many soils.
Inorganic S-containing minerals represent an important S pool in some soils. Sulfur is also present in
numerous primary and secondary minerals, which release either sulfate or sulfide (S-2) as they weather.
Gypsum, for example, is widely distributed in arid and semi-arid soils where precipitation is too low to
leach the mineral out of the profile. In moderately humid regions, gypsum accumulates in the subsoil,
forming a S-rich layer often in close proximity to calcium carbonate (CaCO3) layers. Although the surface
layers of soils may have low levels of plant available sulfate-S, sulfate in the lower soil profile maintains
an adequate supply of S within the rooting depth. Early in the growing season, subsoil S may not be
available to crops because it is out of reach of the growing roots. Later in the growing season, when plant
roots have grown deeper, adequate S can then be accessible to crops.

Chapter5:SulfurManagement|5
Sulfur Losses
Sulfur loss from moderately to well-drained soils, other than by crop removal, is through leaching of
sulfate. Sulfate is a negatively charged ion (SO4-2, an anion), and therefore not held on the cation
exchange complex. Leaching is the physical removal of sulfate by water moving through the profile, like
that with nitrate. Sulfate, however, is not subject to denitrification. The areas with the highest risk for
sulfate leaching are associated with high precipitation and coarse texture soils. Excessive irrigation
following fertilizer application can move sulfate through the soil profile and eventually out of reach of
plant roots. In semi-arid climates, sulfate often collects in the subsoil, as described earlier, because there
is insufficient water to move sulfate out of the profile.
Testing for Sulfur Sufficiency
Sampling soil, plant, and irrigation water are methods for determining S fertilization needs. Soil testing
the topsoil for plant-available S has been and continues to be debated because testing for extractable
sulfate-S or other S forms has a poor relationship with S sufficiency for crops, and is not reliable in soils
of many regions for predicting yield response to applied S. Other suggested soil tests for S include
measuring the organic S content and estimating mineralization during the growing season. For example, a
study from Iowa has shown no value of extractable soil sulfate-S (0-6 inch depth) for predicting corn
yield increase from S application (Figure 2), and several land-grant universities do not recommend sulfur
application based on soil testing. A low testing soil may still supply a crop with adequate S because of
ample S below the testing depth (i.e., subsoil sulfate or gypsum layer), significant organic S mineralized
during the growing season, or high S levels in shallow groundwater. At issue is that soil tests by
themselves cannot integrate all of the potential sources and variation in supply of plant-available S.

Chapter5:SulfurManagement|6
Figure 2. Corn grain yield response to S application as related to extractable soil sulfate-S concentration (0-6 inch soil depth) in the no-S control. Adapted from Sawyer, J.E., D.W. Barker, and G. Cummins.
2009. Dealing with sulfur deficiencies in crop production: the Iowa experience. p. 64-73.In North-Central Extension-Industry Soil Fertility Conf. Proceedings. Nov. 18-19. Vol. 25. Des Moines, IA.
Plant tissue testing can also be used to determine sufficiency of plant-available S. Samples are analyzed
for total S concentration or the N:S ratio. These plant tests for S have greater reliability than soil testing in
some crops. For example, the S concentration in the top six inches of alfalfa at early bud state (Figure 3).
In research with corn in the same area of Iowa, plant S concentration of ear leaves at silking could not
indicate a specific critical concentration.
In some crops and geographic areas, the plant N:S ratio has been successfully used as an indicator of S
status. For example, the critical ratio for wheat is about 16:1, so, assuming adequate N supply, ratios
greater than 16:1 would indicate a S deficiency in the plant (Figure 4). Unfortunately, deficiencies
indicated by tissue tests in some crops taken during the growing season cannot easily be corrected until
the following year. In other crops with multiple harvests per growing season, like alfalfa, deficiencies can
be corrected after any harvest.

Chapter5:SulfurManagement|7
Figure 3. Yield increase per cut from S fertilization relative to the alfalfa plant tissue S concentration (6-inch plant top) with no S applied. Adapted from Sawyer, J.E., D.W. Barker, and G. Cummins. 2009.
Dealing with sulfur deficiencies in crop production: the Iowa experience. p. 64-73.In North-Central Extension-Industry Soil Fertility Conf. Proceedings. Nov. 18-19. Vol. 25. Des Moines, IA.
Figure 4. Relationship between relative yield of wheat and plant tissue N:S ratio. Adapted from K. Spencer and J.R. Freney (1980). Agron. J. 72:469-472.
Chapter5:SulfurManagement|8
Basis for Sulfur Fertilizer Recommendations
Yield responses to S occur most commonly in crops with higher S requirements such as alfalfa, canola,
and corn; when most of the plant material is removed; in sandy or eroded soils; and soils low in organic
matter or with low or very low sulfate-S content in the profile. Unlike N-P-K, S fertilization guidelines do
not exist in many regions of the U. S. The existing S fertilization recommendations often are based on
plant testing (for specific crops when reliable) or local yield response trials, and suggestions often include
consideration of soil properties and other conditions commonly associated with response to S application.
This is explained by the great complexity of S cycling and factors affecting plant available S levels; no
single diagnostic method or recommendation system seems to be appropriate for all crops or regions.
Therefore, diverse S management strategies have been implemented in different production areas,
supporting the need to use locally developed information. Following are examples that represent some of
the various approaches that universities and other research institutions are recommending to manage S
fertilization.
The University of Wisconsin recommends the use of a S availability index (SAI) to determine relative
plant available S. This index is comprised of: (soil test SO4--S x 4) + Subsoil-S + precipitation-S + (%
OM x 2.8 lb/acre) + available manure-S. For the SAI, values greater than 40 are considered adequate with
no S application needed, and less than 30 considered low with application of 10-50 lb S/acre
recommended (with rate depending of the placement method and crop). If the SAI is between 30 and 40, a
tissue test is recommended to determine if additional S is needed. In other states, such as Alabama, S
recommendations are more conservative in terms of preventing S deficiencies and suggest that all crops
receive 10 lb S/acre per year except cotton which would receive 20 lb S/acre. In the Great Plains, a soil
test critical value has been determined for canola. Soils with less than 5 ppm sulfate-S should be fertilized
with 15 lb S/ac in an optimal N-P-K blend. In the same region, the critical soil test level for wheat and
other small grains such as barley and oats is only 3 ppm SO4-S and fertilizer recommendations for
deficient areas range between 10 and 15 lb S/acre.
Sulfur Fertilizer Application
Proper management of S applications is a key for optimizing yield and profitability. There are some
guidelines regarding S source, timing, placement, and rate that producers should consider in order to
maximize S use efficiency.
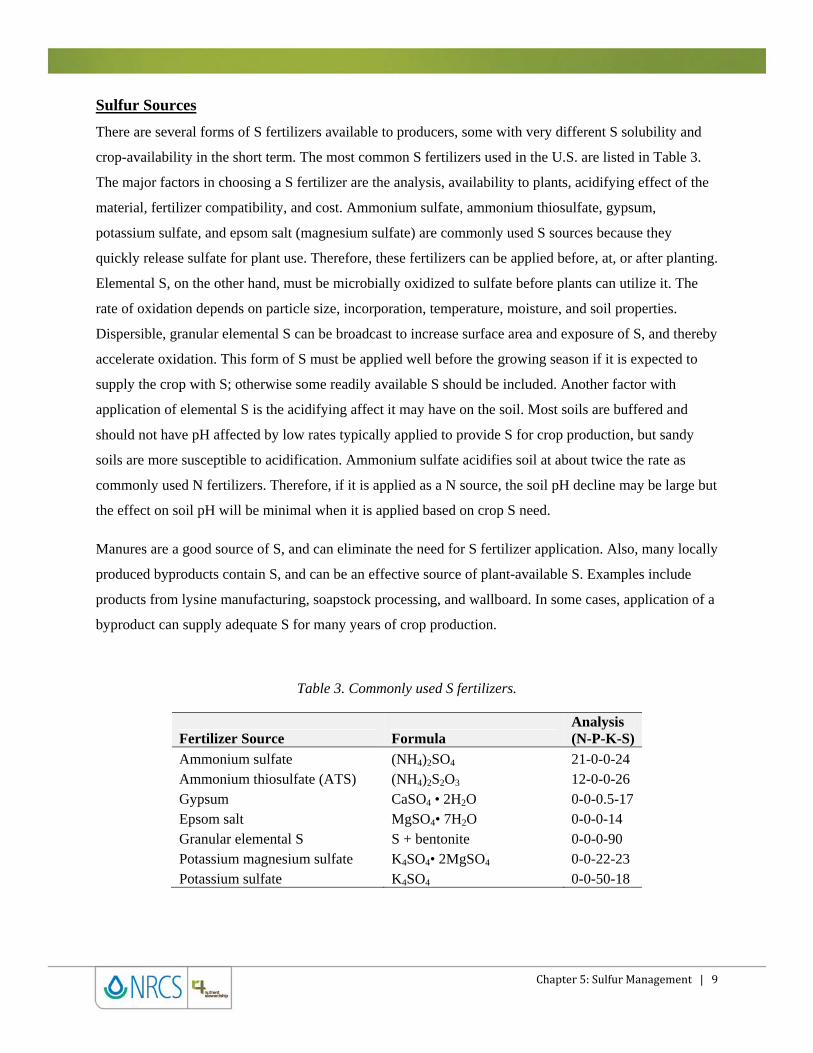
Chapter5:SulfurManagement|9
Sulfur Sources
There are several forms of S fertilizers available to producers, some with very different S solubility and
crop-availability in the short term. The most common S fertilizers used in the U.S. are listed in Table 3.
The major factors in choosing a S fertilizer are the analysis, availability to plants, acidifying effect of the
material, fertilizer compatibility, and cost. Ammonium sulfate, ammonium thiosulfate, gypsum,
potassium sulfate, and epsom salt (magnesium sulfate) are commonly used S sources because they
quickly release sulfate for plant use. Therefore, these fertilizers can be applied before, at, or after planting.
Elemental S, on the other hand, must be microbially oxidized to sulfate before plants can utilize it. The
rate of oxidation depends on particle size, incorporation, temperature, moisture, and soil properties.
Dispersible, granular elemental S can be broadcast to increase surface area and exposure of S, and thereby
accelerate oxidation. This form of S must be applied well before the growing season if it is expected to
supply the crop with S; otherwise some readily available S should be included. Another factor with
application of elemental S is the acidifying affect it may have on the soil. Most soils are buffered and
should not have pH affected by low rates typically applied to provide S for crop production, but sandy
soils are more susceptible to acidification. Ammonium sulfate acidifies soil at about twice the rate as
commonly used N fertilizers. Therefore, if it is applied as a N source, the soil pH decline may be large but
the effect on soil pH will be minimal when it is applied based on crop S need.
Manures are a good source of S, and can eliminate the need for S fertilizer application. Also, many locally
produced byproducts contain S, and can be an effective source of plant-available S. Examples include
products from lysine manufacturing, soapstock processing, and wallboard. In some cases, application of a
byproduct can supply adequate S for many years of crop production.
Table 3. Commonly used S fertilizers.
Fertilizer Source Formula Analysis (N-P-K-S)
Ammonium sulfate (NH4)2SO4 21-0-0-24 Ammonium thiosulfate (ATS) (NH4)2S2O3 12-0-0-26 Gypsum CaSO4 • 2H2O 0-0-0.5-17 Epsom salt MgSO4• 7H2O 0-0-0-14 Granular elemental S S + bentonite 0-0-0-90 Potassium magnesium sulfate K4SO4• 2MgSO4 0-0-22-23 Potassium sulfate K4SO4 0-0-50-18

Chapter5:SulfurManagement|10
Timing/Placement
The demand for S by a growing crop is not constant through the growing season, with the highest uptake
associated with the periods of rapid growth. Timing S fertilizer applications so that they provide a plant-
available supply when the crop needs it is the desired goal. Plants subject to deficiency during a high
demand period may not recover to achieve full yield potential even with high S rates applied too late or
when a form such as elemental S is not applied far enough ahead of crop need. Conversely, application of
a sulfate form (or one that changes quickly to sulfate such as thiosulfate) well in advance of crop uptake
can be subject to losses in soils with high leaching potential (coarse textured soils with excessive rainfall).
In those soils, application close to or at planting would be desirable. Sidedress applications can be
beneficial for correcting deficiencies, but should be a readily plant available form (such as sulfate or
thiosulfate) and applied before large plant uptake. For crops with multiple harvests, like forages, there are
multiple opportunities for application – at seeding or after any cutting. Applied S must be in the rooting
zone for plant uptake, therefore banding or incorporation into the soil is desirable. Surface applications
must be in a sulfate form so movement into the soil can take place with rainfall. Some S fertilizers may
cause seedling injury and should not be placed in furrow, with thiosulfate an example.
Application Rate
Sulfur fertilizer application rates should be based on expected optimal economic return. Those rates vary
among regions, crops, and years, so local research is important to determine economic response. For
example, in a set of S rate trials with corn in Iowa, the maximum response rate for 21 fine-textured soil
sites was 17 lb S/acre, with an economic optimum rate at 16 lb S/acre (Figure 5). However, for 7 coarse-
textured soil sites, the maximum response rate was higher at 25 lb S/acre, with an economic optimum rate
at 23 lb S/acre. The economic optimum S rate is near the maximum response because the fertilizer cost
(rate times price) is low compared to the yield return (yield increase times corn price).

Chapter5:SulfurManagement|11
Figure 5. Corn grain yield response to S application rate at responsive sites. Adapted from Sawyer, J.E., D.W. Barker, and G. Cummins. 2009. Dealing with sulfur deficiencies in crop production: the Iowa
experience. p. 64-73.In North-Central Extension-Industry Soil Fertility Conf. Proceedings. Nov. 18-19. Vol. 25. Des Moines, IA.
Another example of crop response to increasing rates of S application is presented in Figure 6 for research
in Alabama with cotton. In this case, cotton yield reached maximum values with S applications of 20-35
lb S/acre.
Figure 6. Cotton lint yields as affected by the rate of S on a Lucy loamy sand in Alabama. Adapted from Mullins, G.L. 1999. Cotton response to sulfur on a Coastal Plain soil. p. 64-73.In Better Crops. 83(4) 4-5.

Chapter5:SulfurManagement|12
Research to date has not fully documented the variability of S deficiency within fields or the potential for
variable-rate S application. Work with alfalfa in Iowa clearly showed differential response in poor and
good coloration/growth areas, indicating that it would not respond to S application across entire fields.
Similar expression of S deficiency and yield response within fields has been observed in corn. However,
until more is known about economically delineating S deficiencies or access to tools for determining
deficiency, it is likely most prudent to simply fertilize entire fields when deficiency exists rather than
attempt site-specific applications because of the relatively low cost of S fertilization. Site-specific
management is possible, but increases production costs and reliable methods are needed to “map” S
sufficiency across a field.
Summary
Effective S management requires not only a thorough understanding of S transformations in soil, but also
an awareness of how several factors can affect the plant availability of S and potential deficiency. These
include temperature, moisture, soil organic matter, erosion, tillage system, landscape position, soil
texture, rooting depth, subsoil sulfate, past S inputs, atmospheric deposition, and cropping system.
Although S deficiencies have been relatively infrequent in the past, the frequency of deficiencies is
increasing and the need for S fertilization is increasing. Sustained high crop yields, with few if any S
inputs, has resulted in greater chance of deficiency. Sulfur plays a major role in crop growth, yield, and
quality, and improves the effectiveness of other nutrient inputs like N, P, and K. Therefore, S needs to be
considered for developing successful nutrient management plans.

Chapter 6: Calcium and Magnesium Management
Agustin Pagani, John E. Sawyer, and Antonio P. Mallarino / Department of Agronomy, Iowa State University Developed in cooperation with Lara Moody, TFI; John Davis, NRCS; and Steve Phillips, IPNI. Funding provided by the USDA Natural Resources Conservation Service (USDA-NRCS) and the Fertilizer Institute (TFI).
Introduction
Calcium (Ca) and magnesium (Mg) are considered secondary macronutrients because they are less
commonly yield limiting than the macronutrients (N, P, and K), yet are required by crops in relatively
large amounts. Calcium and Mg occur in the soil as soluble ‘divalent’ (‘double-charged’) cations (Ca2+
and Mg2+), on cation exchange sites, and in primary minerals. The major processes in Ca and Mg cycling
are plant uptake, exchange, precipitation, weathering, and leaching. Calcium and Mg dynamics in the soil
are quite similar to K. Like K, plants absorb the soluble ionic forms from soil solution (Ca2+ and Mg2+),
which is then replenished from exchangeable and mineral Ca and Mg. The most notable difference
between the Ca and Mg nutrient cycles and K is the absence of clay fixation with Ca and Mg.
Calcium as an Essential Nutrient
Calcium is essential for plant growth, cell division, and cell enlargement. It is a component of cell
membranes and is important for developing the root system, shoot tips, and storage organs. Calcium aids
in pollen development and helps plants retain foliage. Calcium strengthens cell walls, helping to reduce
bruising and plant disease. An adequate supply of Ca produces food crops which are less susceptible to
handling damage and have a longer shelf life. Fruit and vegetables will also have a higher nutritional
value. Crops deficient in Ca can have growth disorders. Since Ca does not move readily within the plant,
Ca deficiencies appear in the younger tissues. Calcium deficiencies may result in the death of the plant’s
growing point. It may also cause blossoms and buds to drop prematurely. Calcium quantities in the
harvested portions of common agricultural crops are presented in Table 1.
Calcium is usually the dominant basic cation in soil cation exchange reactions, typically accounting for
more than 70% of base saturation. Base saturation represents the percentage of the cation exchange

Chapter6:CalciumandMagnesiumManagement|2
capacity (CEC) occupied by basic cations (Ca, Mg, K, and Na), and increases with increasing soil pH.
Exchangeable Ca exists in equilibrium with the soil solution, replenishing soluble Ca used by plant
uptake or lost by leaching. Leaching can be significant in coarse-textured soils where substantial water
moves through the profile. The formation of many calcareous soils occurred by Ca accumulation with
leaching from the topsoil, soil developed from calcium carbonate (CaCO3) parent material, or carbonates
deposited as water carrying dissolved carbonates accumulated in low landscape areas and then water
evaporated leaving the solid carbonaceous materials. These Ca-rich ‘calcic’ areas can be comprised
CaCO3 or gypsum (CaSO4). Calcium is made available to plants by dissolution of these minerals or in the
long term through weathering of primary minerals such as feldspars and micas.
A low exchangeable Ca content in soil often causes acidity problems due to low base saturation, before
actual Ca nutrient deficiency becomes an issue. Where soil acidity is a problem, liming soils with
limestone (CaCO3 and MgCO3) is a common practice and thus supplies plant available Ca. Soils with
neutral to basic pH are buffered at high pH levels by both Ca on the exchange complex (as the dominant
part of the base saturation) and Ca in bicarbonates and carbonates (free lime).
Because of its divalent (2+) charge, Ca acts as an ionic ‘glue’ (electrostatic attraction with negatively
charge clay particles), thus promoting aggregation of soil particles through a process called flocculation.
Soils with high levels of sodium (Na), referred to as sodic soils, promote dispersion which is the opposite
of flocculation. When the monovalent (single-charged) Na+ ions reach a high proportion of the cations on
clay negative exchange sites (the CEC), the weak (and single) positive charge of the Na+ ion is not strong
enough to overcome the negative charges of clay particles, which then repel each other. The result of
dispersion is a structureless soil with insufficient aeration, permeability, and water-holding capacity for
optimum plant growth. Additions of Ca in the form of gypsum are frequently used for reclaiming sodic
soils because it counters the effects of Na by adding Ca2+ ions, exchanging Ca2+ for Na+ on the soil
exchange site, allowing leaching of Na from the soil, and thus promoting aggregation critical for soil
productivity. Gypsum is used instead of lime as the Ca source as often soil pH does not need to be
increased, which does not occur with gypsum application.
Magnesium as an Essential Nutrient
Magnesium plays a critical role in nearly all parts of plant metabolism and protein synthesis, is an
activator of enzymes, and an essential constituent of chlorophyll. It also aids in the formation of sugars,
oils and fats. Deficiency in Mg leads to reduced photosynthesis, which limits crop yields. Plants require
less Mg than Ca, but deficiencies are more common because less Mg exists in the soil solution and on the

Chapter6:CalciumandMagnesiumManagement|3
soil exchange complex. Magnesium deficiency usually appears on older plant leaves first; the leaf tissue
between the veins turns yellow or reddish in color, while the veins remain green. Severe deficiencies will
cause leaf margins to curl. Magnesium quantities in the harvested portions of common agricultural crops
are presented in Table 1.
Mineral forms of Mg are relatively resistant to weathering and represent a large fraction of total soil Mg.
These include biotite, horneblende, olivene, and most 2:1 clay minerals. Magnesium can also be present
in calcareous surface and subsurface soils as magnesium carbonate (MgCO3), frequently along with
CaCO3. Although Ca and Mg share the same exchange processes, Mg sorbs less strongly than Ca to soil
colloids (still Mg sorbs much more strongly than monovalent cations) and therefore is more prone to
leaching, particularly in sandy soils. As a divalent cation, Mg2+ competes with Ca+2, K+, and NH4+ for
plant absorption and cation exchange sites. As with Ca, Mg helps with soil flocculation and soil structure,
but to a lesser extent. Magnesium deficiencies generally occur when the other cations dominate the soil
exchange complex along with low Mg concentrations. A common Mg deficiency problem in cattle is
called grass tetany, or hypomagnesaemia. This deficiency is due to insufficient Mg in forage fed to
livestock. Often feeds are supplemented with Mg salts to supply adequate Mg. In soils with low available
Mg, lime application to acidic soils (except with pure calcitic lime) often supplies adequate Mg (as the
MgCO3 component of lime along with CaCO3); or fertilizers are applied such as potassium-magnesium-
sulfate and epsom salt (MgSO4) if soil pH is already at adequate levels. Magnesium concentration in
forages can also be reduced when high rates of K are applied, increasing the chance of low forage Mg
levels and development of grass tetany.
Table 1. Calcium and magnesium quantities in harvested portions of common agricultural crops.
Crop Unit of Yield Pound of Ca per
unit of yield Pound of Mg per
unit of yield Corn bu 0.01 0.05
Soybean bu 0.18 0.18 Oat and Straw ton 4 4
Wheat bu 0.03 0.15 Barley bu 0.03 0.05 Alfalfa ton 28 5 Clover ton 28 7
Adapted from Modern Corn and Soybean Production. 2000. MCPS Publications.

Chapter6:CalciumandMagnesiumManagement|4
Calcium and Magnesium Soil Testing
An often used approach for determining if the soil supply of Ca and Mg is sufficient to meet crop needs is
to extract soil with ammonium acetate or Mehlich-3 (the same procedures used to determine soil test K)
and evaluate the amount measured against critical levels. Because most U.S. soils contain more than
adequate levels of Ca and Mg for most crops, no reliable or generally accepted critical level has been
established. Therefore, although an estimate of exchangeable Ca and Mg sometime is routinely measured,
many universities do not publish soil test Ca or Mg interpretations. There are exceptions, and an example
is Ca testing for potato production due to issues with tuber density. Another example would be soil testing
to help avoid development of grass tetany, where knowledge of soil test Mg and K would be useful when
high rates of K are needed. Also, soils typically have large available levels of both nutrients because Ca
and Mg are replenished by limestone application. If someone is interested in the soil CEC level, then
routine soil testing can be used to estimate CEC by summing the dominant exchangeable cations (Ca2+,
Mg2+, K+, H+, Na+).
The Ca:Mg ratio or the basic cation saturation ratio concepts (meq/100g charge concentration based ratio)
was developed many years ago as a means to identify an optimal level of these two nutrients or other
cations for crop production. However, numerous research studies have shown that the Ca:Mg ratio or
ratios of several cations is not a viable basis for fertilization with Ca, Mg, or other cations. Having
sufficient levels of exchangeable Ca and Mg (through soil testing) is the proper method of evaluation
where reliable field calibrations are available, rather than trying to manipulate ratios. Fortunately, in most
U.S. soils Ca and Mg levels are adequate and the ratio of these nutrients are not an issue for availability of
either nutrient as the parent material the soil developed from or local limestone sources supply both
nutrients in adequate proportions. Also, adequate levels of plant-available Ca and Mg are maintained
without need for fertilization either because the soil has a large inherent supply capacity or because of
liming to maintain adequate soil pH for crop production.
Calcium and Magnesium Sources and Application
Application of Ca and Mg occurs most commonly through liming practices. With limestones classified as
either calcitic or dolomitic, there is application of both Ca and Mg as these are contained in all limestones.
Therefore, as long as acidic pH problems are corrected through liming, Ca and Mg supply will be
maintained and at amounts more than removed with crop harvest. Once removal has occurred with years
of crop production, and with concurrent low soil pH, liming once again supplies needed Ca and Mg. Soils

Chapter6:CalciumandMagnesiumManagement|5
that have naturally high pH (neutral to basic pH), and those with free lime (calcareous), have more than
adequate levels of these nutrients.
Even though limestone is the main source of Ca and Mg for crops, there are several fertilizers or
amendments that contain these nutrients. Table 2 presents the most common sources of Ca and Mg.
Within this list, limestone requires a special consideration since it is never a pure material but a mixture
of Ca and Mg carbonates (with higher Ca concentration in the calcitic limestone and higher Mg
concentration in the dolomitic limestone). Therefore limestone, no matter the type, is a source of both Ca
and Mg.
Table 2. Most frequently used calcium and magnesium sources.
Source Formula Element
concentration) Calcium --- % --- Calcium chloride CaCl2 36 Calcitic limestone CaCO3 Approx. 32 Dolomitic limestone CaCO3 + MgCO3 21 to 30 Gypsum CaSO4•2H2O 50 Magnesium Dolomitic limestone CaCO3 + MgCO3 6 to 11 Magnesium sulfate MgSO4•H2O 17 Potassium magnesium sulfate K2SO4•2MgSO4 11
Summary
Secondary nutrients such as Ca and Mg are no less essential to plant growth than the primary nutrients.
However, the mineralogy and texture of many U.S. soils maintain high levels of available Ca and Mg. An
exception would be sandy soils in association with fertilization need of certain crops, for example potato,
or interaction with application of other nutrients like K. Because plants require relatively small amounts
of these nutrients and leaching is a minor loss, Ca and Mg deficiencies are rare but do occur in specific
soil conditions and crops. In addition, liming soils to neutralize acidity and increase soil pH also add plant
available Ca and Mg, thus reducing the probability of deficiency and need for fertilizer application.

Chapter 7: Micronutrient Management
Agustin Pagani, John E. Sawyer, and Antonio P. Mallarino / Department of Agronomy, Iowa State University Developed in cooperation with Lara Moody, TFI; John Davis, NRCS; and Steve Phillips, IPNI. Funding provided by the USDA Natural Resources Conservation Service (USDA-NRCS) and the Fertilizer Institute (TFI).
Introduction
Micronutrients are those essential elements required in small quantities for plant growth and reproduction.
The quantity needed varies with plant species and the specific element. Seven essential elements are
considered micronutrients, and include boron (B), copper (Cu), chlorine (Cl), iron (Fe), manganese (Mn),
molybdenum (Mo), and zinc (Zn). To better understand the relative amounts needed by plants, we can
look at the crop removal rate. For example, harvest of a 150 bu/acre corn grain crop will remove
approximately 135 pounds of N, 53 pounds of phosphorus (P2O5) and 40 pounds of potassium (K2O) per
acre. In comparison to these macronutrients, the removal amount for the micronutrients B, Cu, Fe, Mn
and Mo, and Zn are only 0.06, 0.06, 0.10, 0.09, 0.03 and 0.15 pound per acre, respectively. While the
needed micronutrient amounts are small, without them plants would not grow and reproduce.
Traditionally, the most important sources of micronutrients for crop growth have been those naturally
present in soil and amounts added as impurities in fertilizers and pesticides. Specific soil and related crop
situations, however, result in deficiency of one or more micronutrients and potentially serious limitation
to crop production. An example is iron deficiency chlorosis in soybean, which coincides with soils having
alkaline pH and free carbonates. In some areas, deficiencies of micronutrients have been diagnosed
frequently and producers are taking a closer look at their general availability. For high yields and positive
economic return to crop production, it is important to correctly recognize and correct micronutrient
deficiencies. When micronutrients become a limiting factor, other inputs such as seed, water, fertilizer,
etc. are less efficiently utilized and may be wasted. Table 1 lists the amount of each micronutrient (except
chlorine) taken up by several crops.

Chapter7:MicronutrientManagement|2
Table 1. Approximate per acre micronutrient uptake by corn, soybean and alfalfa.
Micronutrient Corn Soybean Alfalfa
150 bu 60 bu 6 ton
-------------------------- lb/acre --------------------------- B 0.16 0.1 0.3
Cu 0.1 0.1 0.06 Fe 1.9 1.7 1.8 Mn 0.3 0.6 0.6 Mo 0.008 0.01 0.02 Zn 0.27 0.2 0.24
Source: http://www.ces.purdue.edu/extmedia/AY/AY-239.html
A brief description of the importance of each micronutrient is presented below, along with the situations
in which micronutrient deficiencies are more likely to occur and a general description of fertilization
practices.
Boron
A primary function of B is related to cell wall formation, so B deficient plants may have stunted
growth. Since B is not readily translocated from older to actively growing tissues, when deficiency
occurs the terminal bud can stop growing and will die if the deficiency persists. Sugar transport in
plants, flower retention and pollen formation, and germination also are affected by B deficiency.
Boron deficiency symptoms first appear at the growing points. This results in a stunted or bushy
appearance near the top of the plant, yellowing of newer leaves, barren ears due to poor pollination,
hollow stems and fruit (hollow heart), and brittle, discolored leaves and loss of fruiting bodies.
Boron deficiencies are found mainly in sandy soils, in regions of highly weathered soils, low soil
organic matter, exposed subsoil, and pH above 7.0. Organic matter contains much of the B in soils.
Boron is present in the soil solution mainly as the undissociated boric acid form B(OH)3, or the
ionized form B(OH)4- at high pH values, and these are the predominant B forms taken up by plants.
The B forms are somewhat mobile in soil and can be leached from the root zone, but they move less
than other anions like nitrate or chloride. Sorption by clays and association with organic matter will
help retain B in soils and provide sources of available B for crops. Boron deficiencies are more
pronounced during drought periods when root activity is restricted in the upper profile where
available B is typically higher. Crops more sensitive to B deficiency include alfalfa.

Chapter7:MicronutrientManagement|3
Boron fertilizer application can correct deficiencies, but the application rate, method and crop should
be carefully considered because toxicity can easily occur. Band application in the seed furrow
generally is not recommended because high B concentration can be toxic to seedlings and also can
result injury to developing plants. Crops most sensitive to B deficiency include alfalfa, canola, and
sugar beet; and many crops are sensitive to B toxicity.
Copper
Copper is a component of enzymes that play a key role in photosynthesis, respiration, lignin
synthesis, and carbohydrate and N metabolism. Copper deficiency results in stunting of plants, and
since Cu is required for lignin synthesis, deficiency affects cell wall strength and prevention of
wilting. Copper deficiency symptoms include reduced nodulation and N fixation in legumes, delayed
flowering and maturity; pollen sterility; dieback of leaf tips, stems, and twigs; yellowing of leaves;
stunted growth; and pale green leaves that wither easily.
Copper deficiencies are mainly found on organic soils, sandy soils, and soil with pH above 7.5.
Copper uptake decreases as soil pH increases. Plants roots take up Cu as the Cu2+ ion. Copper uptake
by plants can be reduced by excessive P and Fe availability. Cool and wet conditions favor Cu
deficiency. Crops more sensitive to Cu deficiency include corn, wheat, and oat.
Broadcast application of Cu mixed with N, P, or K fertilizers is a common application method. Since
Cu is slowly converted to unavailable forms in most soils, an application can correct deficiencies for
several years with the exception being very sandy soils. Repeated application should be monitored
closely for total Cu application, however, and further application discontinued when suggested
maximum rates have been applied. If Cu is applied in bands, sprayed to foliage, or from a chelated
material, the application rates can be lower than with broadcast applications.
Iron
Iron is involved in the production of chlorophyll in plants; therefore, Fe deficiency (called iron
chlorosis) is easily recognized on sensitive crops by yellowing of leaves due to low levels of
chlorophyll. Iron also is a component of many enzymes associated with energy transfer, N reduction
and fixation, and lignin formation. Iron is associated with S containing compounds that catalyze
several other reactions. Leaf yellowing first appears on the younger upper leaves in interveinal
tissues. Severe Fe deficiencies cause leaves to turn completely yellow or almost white, and then
brown and tattered as leaf tissues die.

Chapter7:MicronutrientManagement|4
Iron deficiencies are found mainly on high pH soils (usually above pH 7.2 and with free carbonates)
due to low Fe solubility, in sandy soils, and in organic soils. Cool, wet soil conditions enhance Fe
deficiency, especially with marginal levels of available Fe. Poorly aerated or compacted soils also
reduce Fe uptake by plants. Uptake of Fe is adversely affected by very high levels of available P, Mn,
and Zn in soils; and in soybean Fe chlorosis is aggravated by high concentrations of soil nitrate.
Plants roots take up Fe as the Fe2+ (ferrous) and Fe3+ (ferric) ions, and as a component of organic
complexes of low molecular weight. Plant species vary significantly in their sensitivity to low Fe
supply. Sensitive crops include soybean and grain sorghum.
Due to soil interaction that greatly reduces Fe solubility and plant availability, foliar or planter-band
applications often are the most effective Fe fertilization methods. Research has shown that variety
selection is typically a more effective solution than Fe fertilization.
Manganese
Manganese is involved in enzyme activation for plant photosynthesis, N metabolism, and synthesis of
various compounds. Interveinal chlorosis is a characteristic Mn deficiency symptom in many plants,
and has similar appearance as Fe deficiency chlorosis. In severe deficiency situations, brown necrotic
spots appear on leaves and there is premature leaf drop. Delayed maturity is another deficiency
symptom in some species. White or gray spots on leaves of some cereal crops are typical signs of Mn
deficiency, such as “grey speck” in oat due to tissue breakdown.
Plant roots take up Mn mainly as the Mn2+ ion. Manganese deficiencies mainly occur on organic soils
with pH above 5.8, high pH mineral soils with free carbonates (calcareous), soils with poor drainage
and high organic matter levels, saturated conditions with poor aeration, sandy soils, and over-limed
soils having low cation exchange capacity. Crops sensitive to Mn deficiency include soybean, oat and
wheat.
Due to interaction with soil that greatly reduces Mn solubility and plant availability, foliar or band
applications often are the most effective Mn fertilization method. A common foliar treatment is
application of manganese sulfate, but use of chelates is becoming more common. Use of a chelated
Mn fertilizer for foliar or band application allows for lower application rates compared with broadcast
application. In marginally deficient soils, banding acid forming fertilizers with the planter can prevent
or alleviate Mn deficiency by solubilizing soil Mn compounds.

Chapter7:MicronutrientManagement|5
Molybdenum
Molybdenum is involved in enzyme systems related to symbiotic N fixation in legumes, N and S
metabolism, and protein synthesis. Molybdenum has a significant effect on pollen formation, so fruit
and grain formation are affected in Mo deficient plants. Because Mo requirements are very low, most
plant species do not exhibit Mo deficiency. Deficiency symptoms in legumes mimic N deficiency
because of the primary role of Mo in N fixation. Unlike most other micronutrients, Mo deficiency
symptoms are not confined to the youngest leaves because Mo is mobile in plants. The characteristic
Mo deficiency symptom in some crops is irregular leaf blade formation known as whiptail, but
interveinal mottling and marginal chlorosis of older leaves also have been observed.
Molybdenum deficiencies are found mainly on very acid, highly weathered, sandy soils in humid
regions. Plant roots take up Mo as the MoO42- ion. Molybdenum availability and uptake by plants
increases with increasing soil pH, which is the opposite of other micronutrients. Liming acidic soils is
the most practical and cost-effective way of correcting Mo deficiency and acidity problems at the
same time. However, if fertilization is needed, a low Mo rate usually is applied banded with the
planter or as a seed treatment.
Zinc
Zinc is an essential component of enzymes important for energy production, carbohydrate
metabolism, protein synthesis, and growth regulation. Zinc is not mobile in plants, so Zn deficiency
symptoms occur mainly in new growth early in the season. The most visible Zn deficiency symptoms
are short internodes, a decrease in leaf size, and a broad band of bleached tissue that goes across leaf
veins.
Zinc deficiencies are mainly found on sandy soils low in organic matter, eroded soils with exposed
high pH subsoil, soil pH above 7.3, severe root growth restrictions, and organic soils. Plant roots take
up Zn mainly as the Zn2+ ion. Crops sensitive to Zn deficiency include corn, grain sorghum, and
soybean. Zinc deficiencies occur more often during cold, wet spring weather, which is related to
reduced root growth and activity as well as less microbial activity and thus less Zn release from soil
organic matter. Uptake of zinc can also be adversely affected by application of high P fertilizer rates
when soil Zn availability is marginal.
Application to the soil is a common method of applying Zn fertilizers. There are many Zn fertilizers
available, with choice depending on the intended application method (broadcast or banded), rate
desired, and solubility of the fertilizer. Zinc oxide is the least soluble form and must be finely ground

Chapter7:MicronutrientManagement|6
for enhanced availability. Zinc sulfate, oxysulfate, and zinc-ammonia complex are inorganic sources
that provide varying degrees of available Zn. Zinc chelates enhance availability due to lower Zn2+ ion
interaction with the soil. In marginally deficient soils, banding acid forming fertilizers with the
planter can prevent or alleviate Zn deficiency in high-pH soil by solubilizing soil Zn compounds.
Chloride
The chlorine (Cl) elemental form is not found in soils or plants, and it is present as the chloride ion
form (Cl-). Plants take up the chloride ion. Because Cl- is a mobile anion within the plants, most of its
functions relate to osmotic effects (stomatal opening, for example) and electrical charge balance in
several physiological functions. Wilting and restricted, highly branched root systems, are the main Cl-
deficiency symptoms, which are found mainly in cereal crops. The role of Cl- in decreasing the
incidence of various diseases in small grains is perhaps more important than its nutritional role.
Most soils contain sufficient levels of Cl- for adequate plant nutrition. However, Cl- deficiencies have
been reported on sandy soils in humid regions or soils derived from low Cl- containing parent
materials. Crops sensitive to Cl- deficiency include wheat, potato, and barley, but a few crops
(tobacco, for example) are very sensitive to high Cl- levels. There are few regions with Cl- deficiency,
mainly because Cl- is applied to soils with KCl, the predominantly used K fertilizer. However, in
regions with naturally high available soil K (such as in the central and northern Great Plains), no Cl-
containing K fertilizer is normally applied so Cl- deficiency is more common.
Diagnosing Micronutrient Deficiencies
Diagnosing a micronutrient deficiency can be a difficult process because diagnostic tools, such as soil or
plant analysis, are less reliable than for the macronutrients (as explained below).
Soil sampling and testing
Soil tests aid in determining whether a particular nutrient is responsible for poor crop production and
provides the basis for deciding the type and amount of fertilizer needed to correct a nutrient deficiency.
Soil samples collected for laboratory analysis must consist of a number of cores and a number of samples
from the field. Various soil extractants are calibrated for use in different geographic areas and can extract
widely different amounts of micronutrients. Therefore, for proper interpretation of test results, one must
use the test calibrated for a particular region, soil, nutrient, and crop. The reliability of most micronutrient

Chapter7:MicronutrientManagement|7
soil tests, compared to other tests like P and K for example, is very low. Also, some soils with low
micronutrient levels in the surface layer may not respond to fertilization because they have higher levels
of the nutrient in the subsoil. Therefore, confirmation of a deficiency with trial nutrient application, tissue
testing, and visual symptoms is helpful to confirm deficiency.
Tissue sampling and testing
Plant tissue tests can aid in determining if a particular nutrient is responsible for poor crop growth. When
a deficiency is detected by tissue testing, a reduction in yield due to restricted crop growth has likely
already occurred. As with soil analysis, plant tissue tests must be calibrated with field fertilization trials.
Calibration of tissue tests is far more complex than for soil tests because measured nutrient concentrations
vary considerably with the stage of plant development and the portion of the plant sampled. Special care
is required in taking plant tissue samples, including soil contamination. Tissue test interpretation should
be based on calibrations with yield response for specific crops, plant part sampled, and stage of plant
growth. An appropriate number of samples should be collected to appropriately represent the field area of
interest. Fresh samples should be taken quickly to a lab or air-dried to remove excess moisture before they
are shipped to a lab. Collecting soil and plant tissue samples at the same time can aid in determining if a
micronutrient is deficient.
Micronutrient Fertilizer Sources
Micronutrient fertilizers are applied to the soil or foliage. Foliar or planter-band applications often are
more effective than broadcast applications to the soil because the nutrient is applied directly to the foliage
or for some micronutrients (not Cl-) banding minimizes reactions of soluble forms with the soil that
reduces crop availability. The decision regarding whether to use a foliar or soil application, and associated
product, will depend on the nutrient, production system, potential soil interaction, and cost of material and
application. In addition, because toxicity can occur easily for some micronutrients (such as B), the
fertilizer form, placement, and rate should be carefully considered and based on reliable local research
information.
Table 2 lists common micronutrient fertilizers and analyses. There are four main categories of
micronutrient fertilizers: inorganic, synthetic chelates, natural organic complexes, and fritted glass.
Common inorganic fertilizers include oxides, sulfates, and oxysulfates.

Chapter7:MicronutrientManagement|8
Sulfates, due to their high solubility and low cost, are the most common metallic micronutrient salts used
as fertilizers. Table 2 gives some examples. The sulfate fertilizer forms can be applied as a granular
material or dissolved in liquid fertilizers. Oxides, due to being relatively insoluble, must be finely ground
to be effective and more quickly converted to plant available forms when applied to soil. Application well
in advance of crop need also increases effectiveness. Oxysulfates are mixtures of oxides and partially
dissolved oxides, commonly dissolved with sulfuric acid. Solubility should be greater than 40% to be
effective agronomically.
Some micronutrient metals can be complexed with ammonia. The most common is Zn-ammonia
complex, which in the soil converts to plant available Zn2+. The Zn-ammonia complex mixes readily with
liquid fertilizers.
Chelates are formed by coordinate bonding between an organic chelating agent and the micronutrient
metal ion. Chelating agents can be synthetic organic compounds (manufactured) or natural (citric acid,
lignosulfonates, phenols, and polyflavinoids). Examples of synthetic chelating agents are EDTA,
HEDTA, EDDHA, and DTPA. Chelates generally have higher stability, provide less metal micronutrient
interaction with the soil, and are preferred for applications to soil. Chelated micronutrients also are
commonly used for foliar application. Due to the enhanced effectiveness, chelates are used at lower rates
than other micronutrient fertilizer forms.
Fritted glass micronutrients are specialty fertilizers not widely used, but can be useful for highly leachable
soils in areas with high rainfall. They are produced by combining the micronutrient with silicates and then
fired in a furnace. The fritted glass matrix controls the release of the micronutrient, and these fertilizers
can contain multiple micronutrients.
Manure contains all plant essential nutrients, and like macro- and secondary nutrients, is a valuable source
of micronutrients. Therefore, manured fields typically do not have micronutrient deficiencies nor require
micronutrient applications.
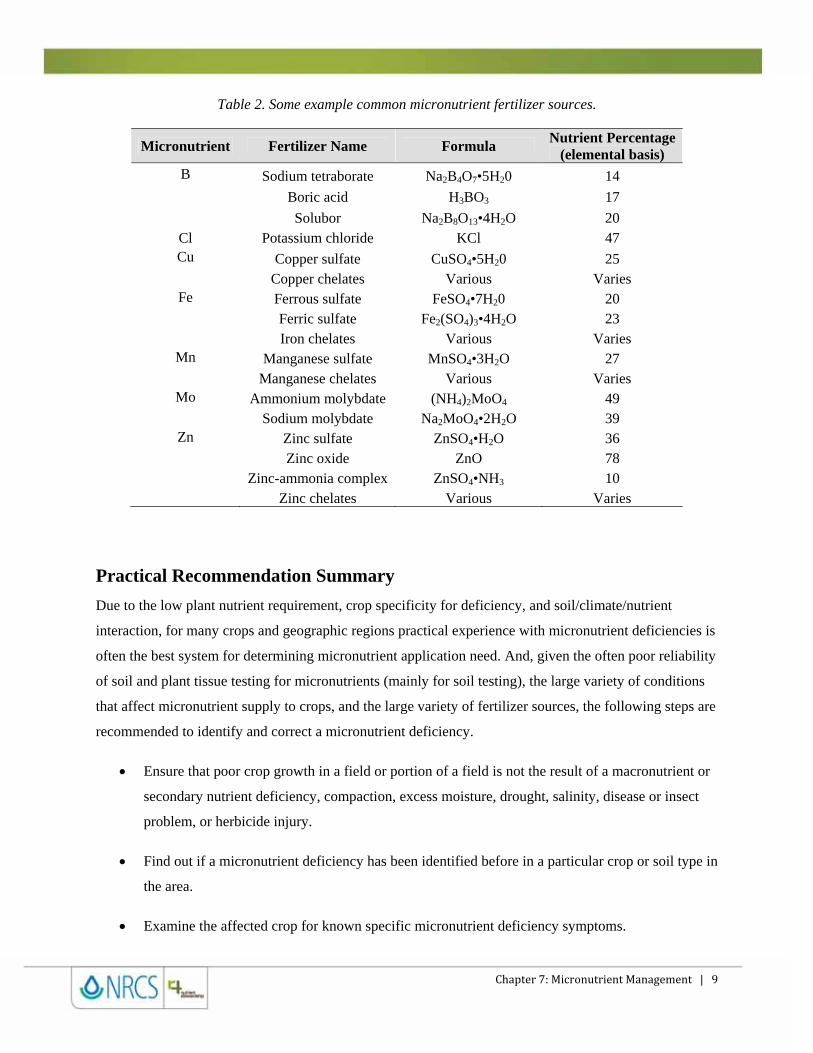
Chapter7:MicronutrientManagement|9
Table 2. Some example common micronutrient fertilizer sources.
Micronutrient Fertilizer Name Formula Nutrient Percentage
(elemental basis) B Sodium tetraborate Na2B4O7•5H20 14
Boric acid H3BO3 17
Solubor Na2B8O13•4H2O 20 Cl Potassium chloride KCl 47 Cu Copper sulfate CuSO4•5H20 25
Copper chelates Various Varies Fe Ferrous sulfate FeSO4•7H20 20
Ferric sulfate Fe2(SO4)3•4H2O 23 Iron chelates Various Varies
Mn Manganese sulfate MnSO4•3H2O 27 Manganese chelates Various Varies
Mo Ammonium molybdate (NH4)2MoO4 49 Sodium molybdate Na2MoO4•2H2O 39
Zn Zinc sulfate ZnSO4•H2O 36 Zinc oxide ZnO 78 Zinc-ammonia complex ZnSO4•NH3 10
Zinc chelates Various Varies
Practical Recommendation Summary
Due to the low plant nutrient requirement, crop specificity for deficiency, and soil/climate/nutrient
interaction, for many crops and geographic regions practical experience with micronutrient deficiencies is
often the best system for determining micronutrient application need. And, given the often poor reliability
of soil and plant tissue testing for micronutrients (mainly for soil testing), the large variety of conditions
that affect micronutrient supply to crops, and the large variety of fertilizer sources, the following steps are
recommended to identify and correct a micronutrient deficiency.
Ensure that poor crop growth in a field or portion of a field is not the result of a macronutrient or
secondary nutrient deficiency, compaction, excess moisture, drought, salinity, disease or insect
problem, or herbicide injury.
Find out if a micronutrient deficiency has been identified before in a particular crop or soil type in
the area.
Examine the affected crop for known specific micronutrient deficiency symptoms.

Chapter7:MicronutrientManagement|10
Take separate soil and plant tissue samples from affected and unaffected areas for complete
analysis, and analyze samples for other nutrients in additions to micronutrients.
If most indications point to a micronutrient deficiency, apply the micronutrient to a specific,
clearly marked, affected area in order to observe results and compare with non-treated areas.
In choosing a micronutrient fertilizer, consider the solubility, safety concerning damage to
seedlings or foliage, advantages and disadvantages for foliar or soil application such as potential
for interaction with soil, and cost.
Consider that other crop inputs such as pesticides, lime, or manure can supply micronutrients or
may affect the availability of micronutrients present in the soil. For example, liming acid soils is a
very cost effective way of increasing crop availability of Mo, but excess lime application to soil
that is slightly acid to neutral pH, or liming alkaline soils, can decrease the availability of Cu, Fe,
Mn, Zn and sometimes B.

Chapter 8: Soil pH and Lime Management
Agustin Pagani, John E. Sawyer, and Antonio P. Mallarino / Department of Agronomy, Iowa State University Developed in cooperation with Lara Moody, TFI; John Davis, NRCS; and Steve Phillips, IPNI. Funding provided by the USDA Natural Resources Conservation Service (USDA-NRCS) and the Fertilizer Institute (TFI).
Introduction
Soil pH is a measure of the soil solution’s (soil water) acidity and alkalinity. By definition, pH is the
negative logarithm of the hydrogen ion concentration [H+], i.e., pH = -log [H+]. Soils are referred to as
being acidic, neutral, or alkaline (basic), depending on their pH values on a scale from 0 to 14. A pH of 7
is neutral, less than 7 acidic and greater than 7 alkaline. Because pH is a logarithmic function, each unit
on the pH scale is ten times less acidic or basic than the unit above or below it. For example, a solution
with a pH of 6 has a 10 times greater concentration of H+ ions than a pH of 7, and 100 times higher
concentration than pH 8. Soil pH is influenced by both acidic- and basic-influencing ions in the soil.
Common acidic cations (positively charged ions) are hydrogen (H+), aluminum (Al3+), and iron (Fe2+ or
Fe3+); whereas common basic cations include calcium (Ca2+), magnesium (Mg2+), potassium (K+),
ammonium (NH4+), and sodium (Na+).
Many factors influence the pH of a soil or subsoil. These include parent material the soil was derived
from; length of weathering and soil formation; climate; organic matter mineralization; NH4+ fertilizer rate
and nitrification to NO3-; cropping system and crop harvest; and land use and management. Of the
management practices for crop production, application of fertilizers or organic sources that contain
ammonium (NH4+) or compounds that transform into NH4
+ once applied to the soil and the cropping
system will have the largest influence on increasing soil acidity. Nitrification of NH4+ to NO3
- from any
fertilizer or manure source, or mineralization of organic-N compounds such as from manure, produces H+
ions, thus lowering soil pH. Frequency of crops in a rotation that require N application, and frequency of
crops with high N fertilization requirement, will affect acidification rate. An example is continuous corn
versus corn-soybean rotation. Some manure sources contain liming materials, eggshells and limestone
with poultry manure as an example, and may offset acidity from nitrification or even increase soil pH.

Chapter8:SoilpHandLimeManagement|2
Most agricultural soils in dry climates have alkaline conditions with average pH values ranging from 7 to
8.5. This is primarily due to the presence of basic cations associated with carbonates and bicarbonates
found naturally in those soils and irrigation water. When sodium (Na) is abundant, which sometimes is
the case in dry climate areas, soil pH can be as high as pH 10. Due to relatively low precipitation, often
less than evapotranspiration, there is little leaching of basic cations resulting in a relatively high degree of
base saturation (percentage of the cation exchange complex occupied by basic cations) and pH values
greater than 7. In contrast, acidic conditions occur in soil derived from parent material high in elements
such as silica (rhyolite, granite, sandstone), high levels of sand with low buffering capacities (ability to
resist pH change), and in regions with high precipitation. High precipitation causes increased leaching of
basic cations, low base saturation and therefore low soil pH.
Soil pH affects plant growth directly and also indirectly by affecting availability of essential nutrients,
levels of phytotoxic elements, and microbial activity. Figure 1 shows relatively how nutrient availability
and microbial activity are affected by soil pH. The availability of Fe and zinc (Zn), for example, is
severely reduced in high-pH soils. Even though Fe is present in large quantities in soils, much greater
than Zn, its availability to plants (in a form plants can take up) is limited by reactions that form insoluble
compounds at high pH.
Most plants have a wide range of pH where they can grow and survive, but have optimal growth and
production in a fairly narrow range. For example, a legume crop like alfalfa can grow and survive in soil
pH’s ranging from 5.0 to 8.1, however, forage yield will be greatly reduced in low-pH soils (less than 6.0)
and is optimized with soil pH only slightly acidic to neutral. Other crops, like cranberries, for example,
are adapted to acidic soils and will not grow well in soils with a pH above 6.0. Soil pH modification,
therefore, must be tailored to the crop or cropping rotation. Optimum soil pH ranges, which depend on the
crop and geographic region, have been established for crops. Examples are given in Figure 1.

Chapter8:SoilpHandLimeManagement|3
Figure 1. Nutrient availability and microbial activity as affected by soil pH; the wider the band, the greater the relative availability or activity (Adapted from Brady, N.
The Nature and Properties of Soils, 10th ed. Macmillan Publ. Co., New York, 1990).
Negative Effect of Acidic Soils
Knowing the soil pH helps identify the kinds of chemical reactions that are likely to be taking place. In
general, the most important reactions from the standpoint of crop production are those dealing with
solubility of essential and non-essential elements. As indicated in Figure 1, the relative availability of
several essential nutrients is greatly reduced at low pH. Phosphorus (P) is an important example. Toxicity
from Al3+, Mn2+, and H+ is a major cause for crop failure in very acidic soils. Aluminum and Mn are a
problem in acidic soils because they are more soluble at low pH. There are always large quantities of Al
present in soils because it is a component of clays. When the soil pH is above 5.0 to 5.5, soluble Al3+ is
low and Al remains in a solid combination within clays and other elements, and therefore is not harmful
to plants. As the pH drops below those levels, Al containing materials began to dissolve and Al3+
increases in soil solution and on the soil cation exchange complex. Because of its nature as a cation

Chapter8:SoilpHandLimeManagement|4
(Al+3), the amount of dissolved aluminum is 1,000 times greater at pH 4.5 than at 5.5, for example. Toxic
levels of Al3+ harm the crop by negatively affecting root activity. As a result, plants are unable to absorb
water and nutrients normally and will appear stunted and exhibit nutrient deficiency symptoms, especially
such as those for P. Often the field also will appear to be under greater stress from pests, such as weeds,
because of the poor crop growth and inability to compete.
The relationship between pH and dissolved Mn2+ is similar to that just described for Al3+, except that
Mn+2 only increases 100 fold when the pH drops from 5.5 to 4.5, and levels are greatly affected by the
oxidation/reduction conditions of the soil. Toxic levels of Mn interfere with the normal growth processes
of the above ground plant parts, usually resulting in stunted, discolored growth, and poor yield.
Iron reactions are similar to that for Al and Mn where Fe solubility increases as soil pH decreases and is
very low at high soil pH (Figure 1). Iron toxicity, however, in low-pH soils is not a major problem for
most crops (as it is for Al and Mn toxicity), but can be for some crops (rice, for example). Iron deficiency
in high-pH soils is widespread for some Fe-sensitive crops (soybean, for example) and is therefore a
cause of concern in many agricultural systems.
Testing for Soil pH
Soil pH is best measured in soil-water slurries, with soil to water ratios of 1:1 (most common in most of
the U.S.), 1:2, or in a saturated soil paste. Soil pH values are measured with a pH electrode placed into
either the slurry or paste. This pH is designated as the water pH and is an indication of what is called the
active acidity or acidity in soil solution. Though most soil testing laboratories utilize water for pH
determination, some will use a dilute salt solution (such as KCl or CaCl2). The dilute salt is used to mask
the effects of naturally occurring soluble salts or recent fertilizer application on pH measurement. By
adding a slight concentration of salts, more exchangeable H+ ions are brought into solution from the
exchange complex, with the measured pH generally 0.5 to 1.0 units lower than measured using a water
slurry. Also, differing soil-water ratios produce slightly different pH values; a reading obtained from a 1:1
soil:water ratio is generally 0.15 to 0.25 pH units higher than that of a saturated paste extract, but lower
than a 1:2 ratio. Therefore, it is important to be aware of the soil pH test being used and to be consistent
between methods to ensure comparable data over time. Soil testing laboratories typically denote the pH
test method used on their soil test reports.

Chapter8:SoilpHandLimeManagement|5
Table 1. Range and suggested optimum soil pH values for optimum growth of selected crops
Crop Optimum Soil pH range Suggested optimum pH
Alfalfa 6.2-7.5 7.0 Barley 5.5-7.0 6.5 Corn 5.5-7.0 6.5
Soybean 5.5-7.0 6.5 Wheat 5.5-7.0 6.5
Source: Havlin et al., 2005. Soil fertility and fertilizers. Upper Saddle River, N.J: Prentice-Hall, Inc. 499 p.
Soil sampling: Methods, Timing, and Frequency
Collecting an appropriate soil sample for pH determination is the first and most critical step in
determining liming needs. Improper sample collection and handling can lead to incorrect
recommendations. It is generally suggested to collect at least 12 cores from the recommended depth
(this varies by region) at random locations across the area of interest and place them in a clean, plastic
container for shipment to the lab. Timely soil sampling is important because limestone requires time
to neutralize soil acidity. Sampling and limestone application should be completed several months in
advance of crop growth to provide time for pH adjustment. In addition, soil pH fluctuates during the
year, thus soil sampling should be conducted at the same time during the season.
The frequency of soil sampling to determine lime requirement will depend on soil properties, crop,
the source and amount of N applied, and the quality and type of liming material used. Under intense
cereal production using high rates of N fertilizer, sandy soils will rapidly increase in acidity. Finely
ground liming materials will result in a more rapid increase in pH, but also a more rapid decrease in
pH over time. Sampling at least every three to five years is recommended.
There is increased interest in within-field site-specific pH measurement and variable rate lime
application due to the often large variation in soil pH. This is especially true in fields with variable
soils, for example, fields where acidic soils are intermixed with carbonate containing (basic) soils.
Dense grid soil sampling approaches and variable rate technologies are being adopted at a rapid rate
by producers. Results from samples collected from producer’s fields and field-scale research have
shown very high pH variation within fields and even within soil map units. Figure 2 shows soil pH
spatial variability from a very dense grid sampling for a field having several soil types in central
Iowa. Taking into account the degree of the spatial variability for most agriculture soils in the U.S.
and cost of sampling, soil analysis, and limestone, the 2.5-acre soil sampling approach is the one most
frequently recommended for making prescription maps for variable rate liming. However, less dense

Chapter8:SoilpHandLimeManagement|6
grid sampling schemes or zone sampling, for example by soil type, are also used in areas where soil
property variation dominates soil pH spatial variability. Also, remote sensing sometimes can be used
to establish sampling zones for pH. For example, soybean iron deficiency chlorosis in high-pH,
calcareous soils can be used to verify the pH is calcareous and map calcareous areas within fields.
Figure 2. Example of soil pH spatial variability using a zone or grid soil sampling approach for a central Iowa field with several soil types. Adapted from Bianchini and Mallarino, 2002. Agron. J. 94: 1355-1366.
Managing Soil pH for Alkaline Soils
Alkaline soils have pH above 7.0, which means the exchange complex is saturated with basic cations. In
soils with pH 7.2 to 8.5, pH is controlled by dissolution of free lime (calcium and magnesium carbonates).
In soils with pH 8.5 to 10.5, pH is controlled by exchangeable Na and dissolution of sodium carbonate.
Therefore, decreasing pH of alkaline soils is difficult due to the need to neutralize free lime (carbonates)
or Na salts and reduce base saturation. In field situations, this is impractical (except perhaps for high-
value horticultural crops) due to the high cost for large application of acidifying amendments and
potential salt buildup from those applications. For example, a soil containing 1% lime (carbonates) in the
top 7 inches would require 68 ton/acre of concentrated sulfuric acid to neutralize the carbonates before
Chapter8:SoilpHandLimeManagement|7
alkalinity could be reduced. In most cropping situations, alkaline soil pH is not modified, but instead
crop, nutrient sources and production practice decisions are based on knowledge of field conditions.
Soil pH reduction can be achieved in localized (small areas); for example garden or landscape areas for
plants that require low pH. In such cases, a common amendment to acidify soil is elemental sulfur (S).
Elemental S is oxidized by microbes to sulfate (SO42-), with production of H+ ions which then neutralize
free lime or lower base saturation on the exchange complex. Ferrous sulfate (FeSO4) and aluminum
sulfate [Al2(SO4)3] can also be used to lower pH by contributing acidic cations. The amount of an
acidifying material required depends on the volume of soil to be treated, free lime content, soil cation
exchange capacity, desired pH and acidifying effect of the material applied. Salt issues can develop if the
amount of acidifying material applied is large, and element toxicity is possible when materials containing
Al are used.
Managing Soil pH for Acidic Soils
Soil acidification is one of the most common agronomic problems in humid and highly productive areas
of the U.S. In non-alkaline soils, application of N fertilizers and many manure sources continually causes
a steady increase in soil acidity. The most common method for neutralizing soil acidity and increasing
soil pH is to apply limestone. Liming materials are most often carbonate containing materials, such as
CaCO3, and MgCO3. Limestone (and other liming materials) react with carbon dioxide and water in the
soil to yield bicarbonate (HCO3-), which reacts with H+ and Al3+ to form either water (for H+) or insoluble
compounds (for Al3+). These reactions take acidic cations off the exchange complex and out of solution,
thereby increasing base saturation and raising soil pH.
The amount of limestone material to apply depends on the amount of reserve soil acidity to be neutralized
and the quality of the liming material. The quality of liming materials is determined by two factors. One
factor is the ability to neutralize acid (purity), called the calcium carbonate equivalent (CCE). As CCE
increases, the material purity increases and the acid neutralizing ability increases. The second factor is the
particle size analysis. Finer limestone particles react faster due to increased surface area. The combination
of these two factors is the effective neutralizing value (ENV). This quality factor has different names in
different states, but in all cases is providing the ability of liming materials to be effective in neutralizing
acidity and raising soil pH. In some states regulations require this quality measure to be supplied with the
product label.
Most agricultural limestones are ground Ca and Mg carbonates, and have a mix of particle sizes from
small to large. For example, in Iowa, the particle sizes effective in neutralizing soil acidity and used for

Chapter8:SoilpHandLimeManagement|8
the quality measure (effective calcium carbonate equivalent, ECCE) are 60, 8 and 4-mesh screen sizes
(mesh size is the number of screen wires per inch; the larger the number, the finer the screen opening).
The quality measure (ECCE as in Iowa) is then a combination of the fineness efficiency from the percent
of material passing each mesh size, the CCE and moisture content. The mix of particle sizes is important
so there are adequate fine materials (passing the 60 mesh) and coarser materials (passing 8- and 4-mesh)
to ensure rapid pH improvement and stabilization of pH for several years.
Rate of Limestone Application
The amount of limestone needed to adjust soil pH depends on the desired level for a particular crop,
the initial soil pH and the soil cation exchange capacity (the soil clay and organic matter content
which determine the soil buffer capacity or resistance to pH change). Although, soil pH is used to
determine whether or not soil acidity limits crop growth and liming is needed, it does not directly
estimate lime requirement (amount of lime to apply). Several analytical methods have been developed
to determine lime requirement. These methods include soil incubation, direct titration and use of
buffer solutions. Long-term soil incubations with CaCO3 have been used for research studies and to
calibrate other lime requirement methods, but are impractical for use by routine testing laboratories.
Direct titrations are laborious and may require days to complete, so they are not practical for use in
routine soil testing.
Buffer pH methods were developed to provide a faster assessment of lime requirement in a routine
lab setting. A buffer solution resists pH change when exposed to acidity, and provides a linear
decrease in pH when the soils potential acidity (acidity on the exchange complex) reacts with the
buffer. The decrease in pH of the buffer solution is what is measured after mixing the buffer with soil
and provides an estimate of the amount of lime required to neutralize the acidity of the soil in order to
reach a desired pH. There are several buffer pH solutions in use. In the Midwest U.S., the Shoemaker-
McLean-Pratt (SMP) buffer has been the method adopted in many states. However, that buffer
solution contains hazardous chemicals and needs special and expensive disposal by soil testing
laboratories. Therefore, new buffers, such as the Mehlich and Sikora buffers, were developed and are
currently being used because they do not contain hazardous chemicals and are more environmentally
friendly.
In some states, instead of using a buffer pH method, the lime requirement is calibrated from measured
soil pH and the soil cation exchange capacity (CEC can be determined by lab measurement or
knowledge of the soil’s textural class and color, both reflect the soil clay and organic matter content).

Chapter8:SoilpHandLimeManagement|9
The liming rate need is estimated from the measured water pH and relationship to lime rate for
various soil types.
In addition to these methods, some states (especially in the southeast U.S.) have developed fast direct
titrations methods that use a single addition of a strong base to determine lime requirement. These
methods are based on the assumption that the relationship between the addition of a liming material
and soil pH is linear between pH 4.5 and 6.5.
Timing of Limestone Application
Although limestone can be applied at any time, several factors should be considered when planning
an application. Most importantly is the length of time required for pH correction to take place. Crops
with more sensitivity to low pH, such as forage legumes, should have pH corrected well in advance of
seeding. Soil moisture is critical for the reaction of limestone with soil acidity, thus rainfall patterns
can also be used as a guide for application timing. Soils should be sufficiently firm to support heavy
equipment and minimize compaction. If subsoil pH is low, a long period will be required for the
limestone to effect a change in the soil pH with depth. Coarse limestone particles react more slowly
and may take several months to correct pH. Incorporation into the soil will provide faster reaction and
pH adjustment within the tillage zone. Surface application, for example in no-tillage, will have most
impact on pH near the soil surface. When a more rapid pH correction is needed, the use of finely
ground limestone or an agricultural ground limestone with good quality (considerable fine materials)
should be considered.
Liming Method
Dry bulk limestone is typically applied using fertilizer spreader trucks. The density of the
spreading pattern declines with increasing distance from the truck. In addition, minimizing dust
and achieving a uniform spreading pattern can be increasingly difficult with finely ground limestone
products. A moisture content of 7 to 10% in fine limestone helps minimize dust and achieve a
uniform spreading pattern.
Variable Rate
Application of lime using variable rate technology has grown in popularity over the last decade,
because it helps growers avoid applying liming products in field areas having lower-than-optimum
pH and reduces or avoids application in areas with high pH. This methodology increases liming
efficiency and therefore profitability.

Chapter8:SoilpHandLimeManagement|10
Liquid, fluid, or suspension lime is a combination of very fine limestone (100 mesh or smaller) in
water with 1 to 2% clay to form a suspension that is about 50 to 60% solids. Some drinking water
treatment byproducts are similar as they result from rapid throughput of water treated with finely
ground calcium oxides. These materials are typically spread using a tank truck equipped with a boom
and high-volume nozzles. With proper calibration, this enables very uniform product application with
no dust. Fluid lime does not react differently than finely ground dry limestone, but because of the
fineness of grind the rate of application should be adjusted to avoid over-liming and resulting too-
high pH.
Liming Materials
A variety of agricultural liming materials, most frequently calcitic and dolomitic limestone, are
readily available in the U.S. (Table 2). Agricultural liming materials are defined as follows:
1. Agricultural liming materials mean a product whose Ca and Mg compounds are capable of neutralizing soil acidity.
2. Limestone means a material consisting essentially of Ca carbonates or Ca and Mg carbonates capable of neutralizing soil acidity.
3. Dolomitic limestone means those materials of which sixteen percent or more of the neutralizing value expressed as Ca carbonate is derived from Mg carbonate.
Table 2. Typical acid neutralizing value, expressed as calcium carbonate equivalent (CCE), of liming materials and the quantity of each liming material necessary to achieve acid neutralization equivalent to
one ton (2,000 pounds) of pure pulverized calcium carbonate.
Liming Material CCE Equivalent to one ton
pure limestone
- % - ----- lb ----- Calcium carbonate 100 2000 Calcitic limestone 85-100 2350-2000
Dolomitic limestone 95-109 2100-1830 Burned lime 150-175 1330-1140
Hydrated lime 120-135 1670-1480 Basic Slag 50-70 4000-2900
Baked oyster shells 80-90 2500-2200

Chapter8:SoilpHandLimeManagement|11
There are other liming materials, such as CaO or Ca(OH)2, but they are not commonly used due to high reactivity and corrosiveness. Also, there are drinking water treatment by-products and other by-products that provide liming capability.
Summary
Soil pH is considered the single most important chemical property of soil because it affects plant growth and nutrient availability in many different and complex ways.
Limited solutions exist for reducing pH in high pH soils because they are impractical or uneconomical.
Soil acidity reduces plant nutrient availability and increases toxicity of some elements. Therefore, neutralization of soil acidity has positive effects on crop productivity.
Lime application is the most common way to neutralize acidity in soils and there are many lime sources that vary in type, neutralization capacity (purity) and particle size. Agricultural ground limestone is the most commonly used liming material.
Although several methods can be used to determine liming rates to achieve optimum pH for crop growth, buffer solutions, single titrations with a base and indexes that include soil characteristics such as soil pH and organic matter, clay, or CEC, are the most widely used approaches.
The large within-field spatial variability in soil pH and lime requirement commonly found in many U.S. regions greatly justifies dense soil sampling and variable rate technology for limestone application.

Chapter 9: Soil Sampling
Agustin Pagani, John E. Sawyer, and Antonio P. Mallarino / Department of Agronomy, Iowa State University Developed in cooperation with Lara Moody, TFI; John Davis, NRCS; and Steve Phillips, IPNI. Funding provided by the USDA Natural Resources Conservation Service (USDA-NRCS) and the Fertilizer Institute (TFI).
Introduction
Soil testing is one of the most useful and commonly used tools to estimate the crop availability of many
nutrients. Therefore, the accuracy of a nutrient recommendation depends on how well soil samples
represent a field or areas within a field. The amount of plant available nutrients can vary considerably
across and within fields due to natural variation of physical and chemical characteristics of the soils and
also due to variation in crop management practices that over time influence the amount of available
nutrients. Natural variation arises from different soil-forming processes (such as parent material and
weathering) or losses/deposition (erosion) that lead to accumulation or loss of nutrients or processes that
differently affect nutrient availability. Management factors that often influence nutrient availability
include tillage, crops grown, harvest system, fertilization and liming and irrigation among others. It is
typically necessary to collect multiple samples from a field to accurately assess the fertility status.
Recommended soil sampling procedures can vary significantly between geographic regions, for specific
nutrients and specific purposes. The information provided here relates to routine testing for soil pH and
immobile nutrients such as phosphorus (P) and potassium (K), but also is relevant for mobile nutrients
such as nitrate nitrogen (N). Specific sampling recommendations should be followed for each nutrient and
region. Sampling procedures have been published by most Land Grant universities and some regional
research and extension soil testing committees. Useful considerations relevant to soil sampling for P to
assess the risk of water quality impairment were prepared by the Organization to Minimize Phosphorus
Losses from Agriculture (SERA-17) and published in "Soil sampling methods for phosphorus" by
Mallarino, Beegle, and Joern (2007, www.sera17.ext.vt.edu) and "The importance of sampling depth
when testing soils for their potential to supply phosphorus to surface runoff" by Vadas, Mallarino, and
McFarland (2005, www.sera17.ext.vt.edu).

Chapter9:SoilSampling|2
Soil Sampling Strategies
Five main factors generally should be considered when taking soil samples:
1. Sampling depth.
2. Time of year when samples are collected.
3. Number of soil cores per composite sample.
4. Number and distribution of samples across a field.
5. Sampling frequency.
The nutrient of interest, the soils present and the crop rotation can influence the specific sampling practice
and importance of each of these factors. Proper consideration of each factor for each specific field or
region is needed to best estimate the nutrient availability in the soil and to develop reliable nutrient
application recommendations.
1. Sampling Depth
A major misconception among nutrient management planners and producers is that a soil sample should
be collected from the depth where the nutrient level is higher. For example, such a criterion would result
in very shallow sampling for P and K with no-till management since both nutrients are relatively
immobile in the soil and tend to accumulate near the soil surface. Instead, the most important criterion to
decide the appropriate sampling depth is the depth that best estimates plant sufficiency and best predicts
crop response to nutrient additions or best determines the risk that nutrients are transported offsite.
Sometimes the best sampling depth is the one where the nutrient accumulates, such as for nitrate, but for
other less mobile nutrients that often is not the case. This is one of the main reasons the soil sampling
depth is an important issue and that is specified in the calibration of soil test methods. Therefore, it is very
important that soil samples used for nutrient recommendations should be taken at the same depth that is
used in the research for soil-test calibration and interpretations to generate the nutrient recommendations.
For tests like pH, P, K, and many secondary and micronutrients, the depth is typically the surface 6 to 8
inches of soil. For nitrate, the sample depth may be the surface 12 inches (for tests like the Pre-Sidedress
Nitrate Test, PSNT) or the rooting zone depth for profile nitrate (3 to 5 feet). For soil pH, an exception
involves sampling in no-till or systems with very shallow tillage. For estimating lime requirements for no-
till management or pastures, a shallower surface sample (0-2 or 0-3 inches) often is recommended
because, except in sandy soils, it is too costly or impractical to apply lime to change pH of subsurface soil
layers. Use of a deeper sampling depth may result in lime application rates that cause excessively high pH

Chapter9:SoilSampling|3
of the surface soil layers which could affect, for example, herbicide activity and/or carry-over, the
availability of various macro- and micro-nutrients and crop disease or pests incidence. While not typically
cost effective for crop production, one could sample by depth increments (like every 2 to 3 inches) to
assess the degree of nutrient stratification and better assess nutrient availability. Due to economic and
practical reasons, however, soil-test interpretations and fertilization recommendations are not made from
this type of soil sampling.
2. Time of Year to Sample
In northern regions with frozen or snow-covered soils, soil sampling after crop harvest in the fall, or
before planting in the spring, are the most common sample timings. Sampling in the fall is most common,
however, because fertilizer or manure is often applied in the fall. In regions with mild winters and more
than one crop per year, the soil sampling usually is done before the most nutrient demanding or profitable
crop. With the exception of pastures and sampling for N for some crops, soil sampling while crops are
growing is seldom used because test results do not provide the best estimate of nutrient availability or
fertilizer cannot be applied due to practical reasons. The most common in-season sampling for N is the
test for soil nitrate to estimate sidedress N fertilization for corn and for N application for wheat at the
tillering stage. In addition, sampling some time before planned lime, fertilizer, or manure applications
allows sufficient time for the laboratory analyses to be completed and recommendations developed.
Suggestions regarding soil sampling for nitrate vary considerably, so local recommendations on specific
sampling and use of nitrate testing should be followed.
Because of seasonal variation in soil-test levels, soil sampling should occur at about the same time of the
year each time a particular field is sampled. Also, the sampling time should be the same that was used for
the soil test calibration. This is particularly important in humid or irrigated regions for the most mobile
nutrients nitrate, chloride (Cl), and sulfur (S), and sometimes also for K, manganese (Mn), iron (Fe), and
pH. Potassium recycling with crop residue, or grazing cattle, and the equilibrium between soil K pools of
different K availability are highly affected by rainfall and alternating freezing and thawing. Although Fe
and Mn are immobile nutrients in soils, changes in oxidation/reduction conditions due to moisture and
chemical or microbiological processes often result in large temporal variability. Soil pH can vary
significantly during the year depending on rainfall due to movement of soluble salts and microbial
processes such as nitrification of ammonium fertilizers.

Chapter9:SoilSampling|4
3. Number of Soil Cores per Composite Sample
A sufficient number of soil cores should be collected per composite sample to correctly represent the area
being sampled. Recommendations about numbers of cores per sample vary considerably, mainly because
of variation in small-scale nutrient variability across nutrients and fields, and range from about 8 to 20
cores per sample across regions and states. Non-uniform nutrient application, such as banding of fertilizer
or manure and grazing, often creates high small-scale nutrient variability. Samples taken from a recent
band can greatly overestimate the overall fertility level of a field or field area. Broadcast fertilizer or
manure application also can create high small-scale nutrient variability with improper equipment use and
careless spreading. The small scale variability can be very high, especially in no-till fields. Figure 1
shows an example of the soil-test variability of immobile nutrients that can be expected at various scales,
which was obtained from a study of soil-test P variation in several Iowa fields with long histories of
fertilizer or manure application. There was very high spatial variability at a very small scale (samples
taken every 6 inches) and at a moderate scale (10-core composite samples taken at 10-foot intervals) in
manured or high-testing fields. Often there was relatively high variability at moderately low soil-test
levels. For example, soil-test P results from single-core samples taken at 6-inch intervals often
encompassed two or three interpretation classes.

Chapter9:SoilSampling|5
0 100 200 300 400 5000 100 200 300 400 500
SO
IL-T
ES
T P
(p
pm
)
0
10
20
30
40
50
60
70
80
0 100 200 300 400 500DISTANCE (feet)
FIELD WITH LOW P FIELD WITH HIGH P FIELD WITH MANURE
VARIATION FOR 10-CORE COMPOSITE SAMPLES
0 5 10 15 20 250
10
20
30
40
50
60
70
80
SO
IL-T
ES
T P
(p
pm
)
FIELD WITH LOW P
0 5 10 15 20 25
FIELD WITH HIGH P
DISTANCE (feet)0 5 10 15 20 25
FIELD WITH MANURE
VARIATION FOR SINGLE SOIL CORES
Figure 1. Soil-test P variation for composite or single-core soil samples taken at different scales from three typical Iowa fields. Adapted from Mallarino, A.P. 1996. Spatial variability patterns of phosphorus
and potassium in no-tilled soils for two sampling scales. Soil Sci. Soc. Am. J. 60:1473-1481.
Even one or two soil cores with very high nutrient levels can significantly skew the average test result for
a composite sample value, and may result in too low nutrient application rates for a major portion of the
area sampled. Therefore, there is benefit from taking 15 to 20 soil cores per composite soil sample for
most nutrients and most field conditions. Research has shown that the accuracy of soil-test results
increase as the number of cores included in composite samples increases. The example in Fig. 2 shows
that collecting 20 cores would result in a difference of 15 to 20% from the true average value for the
sample area. Although the magnitude of the error varies greatly from field to field depending on the
small-scale variability, the error always decreases exponentially with increasing number of cores. This
exponential relationship means there is a large gain in accuracy when the numbers of cores are increased
from very few cores, but a small gain when many cores are already collected.
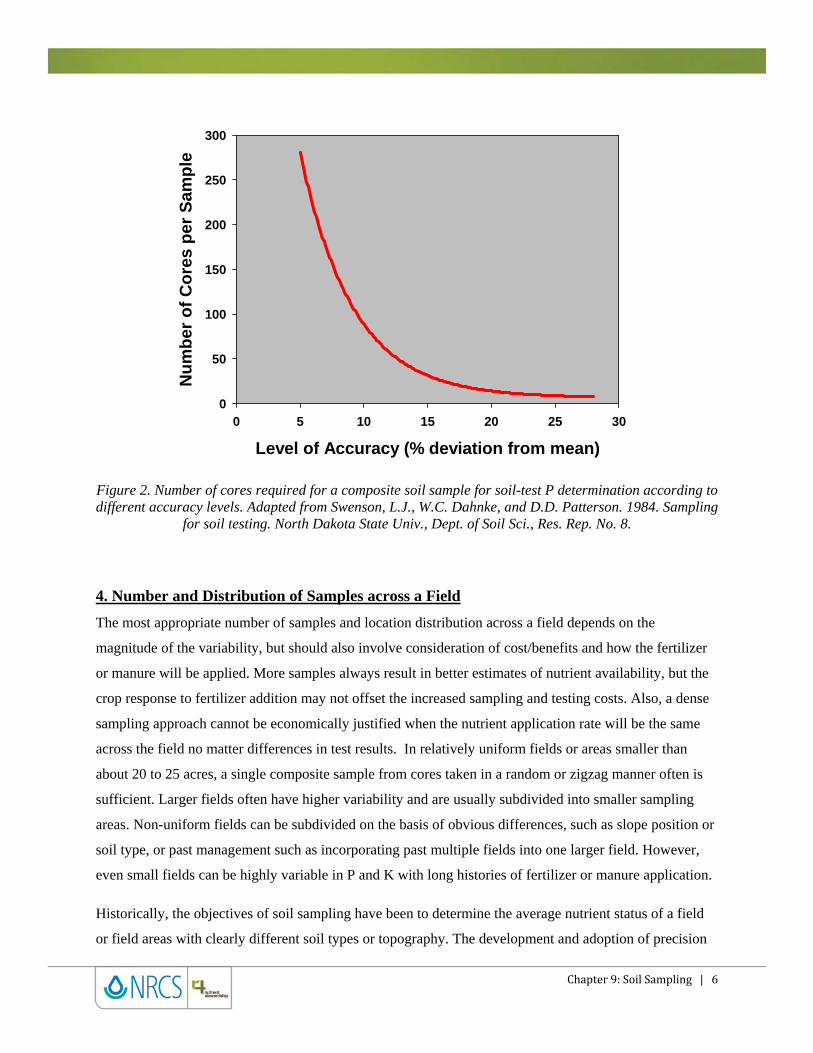
Chapter9:SoilSampling|6
Level of Accuracy (% deviation from mean)
0 5 10 15 20 25 30
Nu
mb
er o
f C
ore
s p
er S
amp
le
0
50
100
150
200
250
300
Figure 2. Number of cores required for a composite soil sample for soil-test P determination according to different accuracy levels. Adapted from Swenson, L.J., W.C. Dahnke, and D.D. Patterson. 1984. Sampling
for soil testing. North Dakota State Univ., Dept. of Soil Sci., Res. Rep. No. 8.
4. Number and Distribution of Samples across a Field
The most appropriate number of samples and location distribution across a field depends on the
magnitude of the variability, but should also involve consideration of cost/benefits and how the fertilizer
or manure will be applied. More samples always result in better estimates of nutrient availability, but the
crop response to fertilizer addition may not offset the increased sampling and testing costs. Also, a dense
sampling approach cannot be economically justified when the nutrient application rate will be the same
across the field no matter differences in test results. In relatively uniform fields or areas smaller than
about 20 to 25 acres, a single composite sample from cores taken in a random or zigzag manner often is
sufficient. Larger fields often have higher variability and are usually subdivided into smaller sampling
areas. Non-uniform fields can be subdivided on the basis of obvious differences, such as slope position or
soil type, or past management such as incorporating past multiple fields into one larger field. However,
even small fields can be highly variable in P and K with long histories of fertilizer or manure application.
Historically, the objectives of soil sampling have been to determine the average nutrient status of a field
or field areas with clearly different soil types or topography. The development and adoption of precision

Chapter9:SoilSampling|7
agriculture technologies have revolutionized soil sampling and nutrient application, however, by allowing
for better measurement and management of within-field nutrient variability. Technologies well adapted to
soil sampling [such as global positioning devices (GPS) and on the go measurement of apparent electrical
conductivity (EC)], estimating yield and nutrient removal with harvest (yield monitors), and nutrient
application (variable-rate technology) are widely used in many regions of the U.S. Instead of focusing on
an entire field, producers can now diagnose fertility levels and crop nutrient removal and manage areas
within fields. Knowledge of factors influencing soil nutrient level variation, such as soil type, topography,
cropping history, manure application, fertilizer application, yield levels, land leveling for irrigation, and
others will help determine the most effective sampling and nutrient application approaches.
Therefore, several soil sampling methods are available, each adapted better to different nutrients and
conditions, and having advantages or disadvantages. In general, there are three soil sampling approaches
that are being used or can be used: The traditional sampling "by soil map unit and topography", grid
sampling and zone sampling.
Sampling by soil map unit and topography
Most commonly referred to as "sampling by soil type", this is the approach most universities and soil
testing laboratories have recommended for decades. The approach recognizes the impact that soil
parent materials, topography, and other soil formation factors have on the level of crop available soil
nutrients. Therefore, soil survey map units, which always consider soil series and often both erosion
and slope phases, are used to delineate different sampling areas within fields. The approach includes
separating sampling areas based on different crop, soil and nutrient management practices, and also
considers the presence of old or current animal feeding locations, homesteads, or watering ponds that
could result in nutrient variation. Also, the approach sometimes recommends sampling separately two
or three areas of an apparently uniform soil map unit or field.
An example of this sampling approach is shown in Figure 3. This 80-acre field was originally farmed
as four, 20-acre fields that were managed differently. First, identify the areas that are odd or
dissimilar. Areas A and B probably have very high fertility levels. Area C would be expected to have
a higher soil pH than the remaining original fields. Areas D and E would be different soils and could
have vastly different soil pH, organic matter (OM), and fertility levels than the adjoining soils. Old
fence lines are to be avoided. The original fields should be sampled separately, unless a previous
comprehensive sampling has shown no fertility differences. Samples 1 and 2 are taken because the
soils differ, sample 3 would be sufficient for the original 20-acre field, samples 4 to 6 represent three
different soils, and samples 7 and 8 each represent about 10 acres of an apparently uniform area.

Chapter9:SoilSampling|8
Figure 3. Example of sampling map for an 80-acre tract, which is now farmed as one field. Numbers designate soil sample areas and letters designate areas either
not sampled or sampled separately. Adapted from Take a Good Soil Sample to Help Make Good Decisions, 2003, PM 287, Iowa State University.
The main assumption supporting this “soil type” approach are that soil factors indeed result in different
nutrient levels, nutrient removal, or nutrient use efficiency; and that the nutrient variation is lower within
these sampling units than across units. Obviously, these assumptions may, or may not, be true for all
fields. For example, differences in soil formation factors or previous management practices may not be
sufficiently different to result in relevant average differences between units. Also, long histories of
nutrient application and soil or crop management may have over-ridden any natural variation between
soils, or may have introduced very high variation within each soil unit. Research and surveys have shown
that today this is the case in many fields. This is the reason that alternative soil sampling approaches
began to be used and recommended since the mid-1990s.
Grid Sampling
Grid sampling uses a systematic approach that divides fields into squares or rectangles of equal size
(usually referred to as "cells"). The location of each grid cell usually is geo-referenced using GPS
devices. The cell size varies greatly depending on subjective factors, which among others include
sampling and testing costs. In the mid-1990s cell sizes were 4 to 10 acres, but recently a 2.5-acre size
is the most commonly used. Several studies have suggested that for grid sampling to be effective, the
cell size should be smaller than about 5 acres. Soil samples are collected from within each of these
grid cells following “grid point” or "grid cell" approaches. The grid point approach involves
collecting one composite sample made up of a number of soil cores (generally 5 to 15) from a small

Chapter9:SoilSampling|9
central area of each cell or from the intersection of the grid lines. This approach emphasizes a good
representation of a small area each time samples are taking over time over trying to represent well the
entire area of a cell. The size of the "point" sampled varies greatly, but usually ranges from 1,000 to
10,000 square feet, and research has suggested should not be larger so the method is distinct from the
"cell" approach. The grid cell approach involves collecting a set of cores randomly from the cell
trying to represent its entire area as much as possible. Neither approach is better across all conditions
but the grid point sampling usually is preferred because it is faster. The results of analyses of the soil
samples collected with either grid sampling approach may be used directly for fertilizer or lime
recommendations (in effect, treating each grid as a small field) or they may be entered into a
computer mapping program that uses different interpolation procedures to assign values to non-
sampled areas to produce a continuous map of soil test results and eventually a nutrient application
map. Sampling at high densities allows for more accurate, but more expensive soil-test and nutrient
application maps.
As a general rule, grid sampling should be considered if the previous management practices have
significantly altered soil nutrient levels across the field and nutrient variability no longer follows the
distribution of soil map units or topography. Figures 4 and 5 show the results of using a grid sampling
approach for several soil properties in an Iowa field with a long history of fertilizer application. The
field almost completely encompassed one dominant soil map unit (soil series, erosion and slope
phase), but dense grid sampling revealed very high variability for almost all properties sampled.

Chapter9:SoilSampling|10
Soil P Soil K Soil pH Soil Nitrate
Soil Ca Soil Mg Soil OM Soil Map Unit
2-28 ppm5.6-7.0111-302 ppm16-86 ppm
1300-3200 ppm 49-456 ppm 2.6-4.8 %
Within Mapping Unit Soil Test Variation
Figure 4. Example of a grid sampling for soil P, K, pH, nitrate-N, Ca, Mg, and OM (OM) in an Iowa field with mainly one dominant soil map unit.
Figure 5 is another example that shows how a tenfold range in sampling density at a research site near
Lincoln, Nebraska, resulted in significantly different patterns. In this case, the coarser sampling grid
missed a systematic variation pattern in soil nitrate, probably related to livestock fencing. The average
recommended N rate for the field at the higher grid density was 148 lb N/acre. The average
recommended N rate was 162 lb N/acre at the lower grid density; where 45 percent of the field
received a different N recommendation with the coarser grid. The coarse grid was denser than most
commercial grid sampling practiced by fertilizer dealers and crop consultants.

Chapter9:SoilSampling|11
Figure 5. Interpolated nitrate-N map from a field sampled with different grid sampling density. Adapted from Ferguson and Hergert (2009), “Soil Sampling for Precision Agriculture”
(EC154), University of Nebraska-Lincoln.
The very high within-field variability in these and many other fields (even within one soil map unit)
clearly justifies dense grid soil sampling for nutrient application using variable rate technology. In
other situations, however, accurate soil test maps can be generated at much lower sampling densities.
The issue is to know how densely a field should be sampled so that the increased accuracy and
precision of soil test results and crop response offsets increased costs. No general rule is possible,
however, because the optimum grid density obviously depends on the field, what soil properties are
being assessed, the costs of soil sampling, testing, and VRT application; and the nutrient/crop price
ratios. These issues, plus the increased availability and decreasing costs of several precision
agriculture technologies, have encouraged crop consultants and researchers to consider a third soil
sampling approach.
Zone Sampling
Zone sampling is the most recently suggested sampling approach, and attempts to improve the
traditional approach of sampling by soil map units while providing an alternative to the usually denser
and costly grid sampling approach. The basic assumption is that maps of soil or crop canopy
Chapter9:SoilSampling|12
characteristics provide additional useful information to delineate sampling zones that may differ in
nutrient availability. Soil cores are collected at random from within each zone and are bulked together
to provide one composite sample per zone and one soil-test value for each unit. Several information
"layers" can be used to delineate sampling zones. For example, aerial or satellite images could
distinguish between soils with different percentages of OM, crop canopy that reveal nutrient
deficiencies and even areas with different growth patterns. Yield monitor maps and apparent
electrical conductivity maps also may be helpful in identifying zones that could be sampled
separately. This approach assumes that the soil or crop characteristics used to delineate zones result in
relatively homogenous nutrient availability within each zone compared with the entire field area. A
downside to zone sampling may be that the management of the field over time for crop production,
such as crop harvest, fertilizer application, manure application and liming, may have over-ridden any
natural nutrient variation related to soil or crop canopy characteristics used to delineate zones. If the
variation within a zone is as large as between zones, then this sampling approach will not be effective.
For example, if soil map units and images of bare soil to reveal OM variation are part of the zone
delineation decision, but after many years of fertilization or liming, patterns of soil-test P, K, or pH
variation may not follow soil or OM variation.
5. Frequency of Sampling
Typically suggestions are to collect samples every three to four years for most nutrients, except the most
mobile ones. More frequent (every 2 years) or annual sampling is recommended in fields where rapid
changes in soil-test levels are expected (such as in sandy soils) or for high value crops. Sampling for
mobile nutrients, like nitrate, usually needs to be done yearly. To optimize nutrient use efficiency and
economic benefits from fertilization for the more immobile nutrients (P, K, and several secondary and
micronutrients), a more frequent sampling may be justified in low-testing soils than in soils where
nutrient levels are adequate and the main benefit of sampling and fertilization is to maintain soil test
levels over time. Regardless of the sampling frequency, records of changes in soil-test values over time
should be kept for each location sampled. This record may be required in nutrient management plans and
allows for comparison of test results over time, which helps understand effects of nutrient management
practices on soil-test levels. Also, frequent sampling will provide trends of soil test trends over time,
which together with records of nutrient application and yield can help when test results are odd or
unexpected. Decisions about the frequency of sampling also should consider the sampling approach in
relation to number of samples collected from each field, because of the cost/benefit of denser and more
frequent sampling. No general rule is possible to follow because the optimum frequency and density of

Chapter9:SoilSampling|13
sampling varies greatly with the nutrient, the within-field nutrient variability, temporal nutrient
variability, and crop/nutrient price ratio.
Sample Handling and Testing Procedures
After the sample has been collected, contamination must be avoided. Common sources of contamination
include dirty sampling tools, cross-contamination from containers or tools and storage containers.
Contamination for N, P, or K testing seldom is a serious problem because the obvious importance of
keeping tools or samples away from fertilizers usually is recognized. Contamination is more frequent and
serious for micronutrients, however, mainly for copper (Cu), iron (Fe), and Zn from galvanized or steel
buckets, probes and grinders. Even ash from cigarettes or sweat from hands can be a source of
contamination. Soils should be shipped to the testing laboratory only in suitable containers and the best is
to use plastic lined sample bags that often are provided at no charge by soil testing laboratories.
Collected cores should be mixed thoroughly to form a composite sample. Moist cores should be crushed
and mixed to provide a homogenous sample so error when subsampling in the laboratory is minimized. If
more cores are collected than can fit into the sample container, adequate mixing is essential so a
representative sample of one to two pounds is sent to the laboratory. If the samples are not shipped
immediately to the laboratory, they should be kept in a cool place or in a refrigerator if stored more than
2-3 days. This is not important for all nutrients, but is for nitrate and S, for example. If the mixed sample
is to be dried before delivery to the laboratory, the drying should be done at temperatures no greater than
104 degrees F (40 degrees C).
Several soil test methods are available to measure the availability of individual nutrients in collected soil
samples. Issues related to testing procedures are not addressed in this article. Different methods are often
recommended for different regions or states of the U.S. because different tests are more appropriate for
some soils than others and because of tradition or availability of research data. Producers and crop
advisers should always be certain that soil test interpretations used to develop fertilizer recommendations
are based on research using the same laboratory analysis procedures that are used to generate soil test
results. The specific procedures recommended for testing soils in each state or region are often described
in regional publications prepared by regional soil testing and plant analysis committees. For example,
these include the NCR Publication 221, “Recommended Chemical Soil Test Procedures for the North
Central Region” prepared by the North Central Research and Extension Committee on Soil Testing and
Plant Analysis (NCERA-13) and Bulletin 409 “Procedures Used by State Soil Testing Laboratories in the
Southern Region of the United States" prepared by the Southern Extension and Research Activities

Chapter9:SoilSampling|14
committee Methodology, Interpretation, and Implementation of Soil, Plant, Byproduct and Water
Analyses (SERA-6). Specific soil-test interpretations for several soil test methods and nutrient
recommendations for crops are prepared and published by most states.
Summary
The application of appropriate rates of fertilizer and manure nutrients for crop production with minimal
impact on the environment is highly dependent on the information derived from soil samples collected
and analyzed to estimate levels of crop-available nutrients in soils. Therefore, samples collected should
provide the best representation of the field or sub-field area sampled. Important issues to be considered
include the sampling depth, time of year when samples are taken, number of soil cores per composite
sample, number and distribution of samples across a field and sampling frequency. Seldom does one
single composite soil sample adequately represent an entire field and sampling approaches can be
implemented that are useful for precision nutrient management using precision agriculture technologies
such as variable-rate application. To guide more precise fertilizer applications to optimize the profitability
of nutrient management or to address environmental concerns, entire fields can be divided into smaller
areas and sampled accordingly. Regardless of the method used for collecting multiple samples or dividing
fields into smaller areas, a sufficient number of soil cores should be collected for each composite sample
so that the sample adequately represents the area sampled. Without representative samples,
recommendations based on test results will not be accurate.

Chapter 10: Economics of Nutrient Management and Environmental Issues
Agustin Pagani, John E. Sawyer, and Antonio P. Mallarino / Department of Agronomy, Iowa State University Developed in cooperation with Lara Moody, TFI; John Davis, NRCS; and Steve Phillips, IPNI. Funding provided by the USDA Natural Resources Conservation Service (USDA-NRCS) and the Fertilizer Institute (TFI).
Introduction
The objective of nutrient management is to apply the proper nutrients and rates, and place them correctly
and at the right time to best supply crop needs for profitable crop or animal production. Properly managed
nutrients can also help protect the environment. Nitrogen (N), phosphorus (P) and potassium (K) are
typically the largest fertilization expenses in crop production. The application of these nutrients is critical
because it can significantly improve crop yield in many crop rotations. However, unneeded application or
poor efficiency results in increased production cost and lost potential economic return. In addition, N and
P management has environmental importance since their losses from agricultural systems have been
identified as likely contributors to elevated surface or groundwater nitrate (NO3-) concentrations,
impairment of freshwater bodies, and also hypoxia of coastal waters (such as the Chesapeake Bay and the
Gulf of Mexico). Therefore, when choosing N and P applications, rate, timing, source and placement,
producers need to carefully consider options to achieve the most profitable economic return while
minimizing impacts on water quality.
Despite the progress that has been achieved in reducing water pollution from point and non-point sources,
assessments indicate that almost 40% of U.S. waters have not met water quality standards. When N or P
is present in lakes or rivers at a high concentration, a condition called "eutrophication" or biological
enrichment can occur. High N and P from the Mississippi River has been blamed for a low oxygen
hypoxic zone in the Gulf of Mexico. Excess algae growth occurs in response to the enriched nutrient
concentrations. When the algae die, their decomposition consumes dissolved oxygen that suffocates fish,
increases toxin-producing microorganisms, and reduces the aesthetic value of water. Also, excessive NO3-
in drinking water systems can present a health hazard to very young infants (methemoglobinemia) and
sometimes requires expensive treatment for nitrate removal. Sources of N and P contributing to
environmental problems include agricultural surface runoff, soil erosion (mainly for P), leaching to

Chapter10:EconomicsofNutrientManagementandEnvironmentalIssues|2
subsurface drainage tile lines and groundwater (mainly for NO3--N), sewage treatment plants, atmospheric
N and other sources.
Since N and P are very different in terms of their dynamic interactions in soil, fertilization practices and
management influence on potential losses, the economic and environmental aspects related to
management will be discussed separately.
Nitrogen Management Considerations for High Profitability and Low Environmental Risk
Proper N management for crop production involves the integration among adequate rate, source, timing
and placement. When managing N, interactions among these four factors are perhaps more important than
for any other nutrient. However, rate often has the greatest influence on leaching losses of NO3--N.
Nitrogen Rate
Crop response to applied N varies among crops. It is very important from the management point of view
to have an approximate idea of the shape of the yield-N fertilization response curve for each crop and
specific conditions affecting response to applied N before deciding an N rate to apply. Figure 1 shows the
quadratic-plateau shaped N response curve for yield response in a crop like corn, where over applying N
beyond the rate at which the maximum agronomic yield is reached (within a certain range) usually does
not cause a yield decrease or quality issues. For small grain crops, like wheat, barley and others, however,
over-application of N may cause yield decreases due to plant lodging and harvesting problems and in
some cases too high grain N or poor grain quality for end uses. Not only is fertilization rate important, but
also consideration of other N inputs that may result in too-high crop available N in the soil, such as carry-
over NO3-, residual manure N, and previous legume crops.

Chapter10:EconomicsofNutrientManagementandEnvironmentalIssues|3
N Rate
Gra
in Y
ield
CornWheat
Figure 1. Schematic representation of typical N response curves for corn and wheat. The vertical dashed lines indicate the N rate at which the maximum agronomic crop yield is reached.
From an economical point of view, rather than applying N to produce maximum yield, producers should
apply N rates that return the most profitable yield, where the yield gain from N application will more than
pay for the invested N. Applying N at rates that produces maximum yield always causes lower net return,
although the return loss can vary from small to large depending on crop/nutrient price ratios, crops and
the shape of the response curve for specific conditions. From an environmental point of view, applying N
to produce maximum yield will result in greater N loss (NO3--N) than application at the most profitable
rate. Therefore, both economic and environmental perspectives need to be considered together when
making N management decisions.
Applying more N than needed by crops to assure maximum yield is not considered an acceptable
management practice. The current N fertilizer cost situation is neither cheap production insurance nor
environmentally benign. High N fertilizer costs, uncertainty about crop prices and environmental effects
should encourage growers to critically consider application rates. Figure 2 shows how NO3--N loss via tile
lines increases rapidly as fertilizer N rate increases beyond the economic optimum N rate (EONR). This
concept applies for all crops fertilized with N and most production scenarios, which highlights the
importance of accurately determining the optimum N rate to maximize profitability and minimize
environmental impacts within specific crops and production systems. In spite of much research, this is

Chapter10:EconomicsofNutrientManagementandEnvironmentalIssues|4
much easier to say than actually achieved in production fields due to the numerous and unpredictable
factors that affect the optimum N rate and the crop response to applied N.
Since NO3--N in subsurface drainage increases with increasing N application rate, there is potential to
affect NO3--N losses through change in N rate. However, the level of change will be related to the rate
comparison and starting rate. In addition, and as mentioned above, the success relative to water quality
goals is not likely to be achieved solely through rate adjustment. For instance, at EONR for corn
production, NO3--N in tile flow typically exceeds the maximum contaminant level (MCL) of 10 mg N L-1
drinking water standard. Moreover, even if no N is applied, NO3--N will exceed the proposed EPA
nutrient criteria for total N in surface waters. There are also questions regarding costs associated with
reducing NO3- losses, and how those costs are to be paid. If N application rates being used are above the
EONR, then producers can gain economically by reducing rates to those levels. They will achieve a net
economic positive due to reduced N input and no associated loss in yield. However, if producers are
already applying N at the EONR, then reduction below those rates will impose an economic penalty
through yield loss.
Since yield response decreases with increasing N rate, the cost in yield penalty for reduced N input is less
near the EONR than at lower N rates. Therefore, cost per unit of NO3--N reduction in drainage water
becomes much larger as N rate declines below the EONR and approaches zero. This illustrates the
significant risk and economic constraints that producers face if they are asked to reduce N application to
rates below maximum net return.
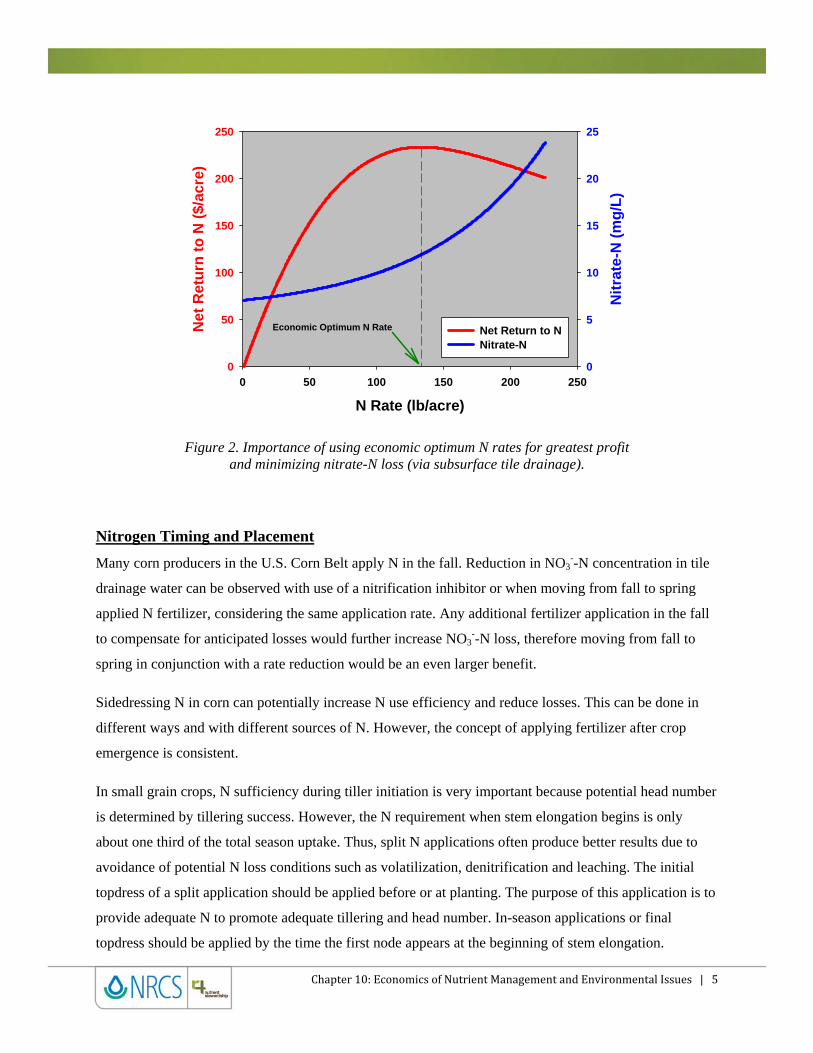
Chapter10:EconomicsofNutrientManagementandEnvironmentalIssues|5
N Rate (lb/acre)
0 50 100 150 200 250
Net
Ret
urn
to
N (
$/ac
re)
0
50
100
150
200
250
Nit
rate
-N (
mg
/L)
0
5
10
15
20
25
Net Return to NNitrate-N
Economic Optimum N Rate
Figure 2. Importance of using economic optimum N rates for greatest profit and minimizing nitrate-N loss (via subsurface tile drainage).
Nitrogen Timing and Placement
Many corn producers in the U.S. Corn Belt apply N in the fall. Reduction in NO3--N concentration in tile
drainage water can be observed with use of a nitrification inhibitor or when moving from fall to spring
applied N fertilizer, considering the same application rate. Any additional fertilizer application in the fall
to compensate for anticipated losses would further increase NO3--N loss, therefore moving from fall to
spring in conjunction with a rate reduction would be an even larger benefit.
Sidedressing N in corn can potentially increase N use efficiency and reduce losses. This can be done in
different ways and with different sources of N. However, the concept of applying fertilizer after crop
emergence is consistent.
In small grain crops, N sufficiency during tiller initiation is very important because potential head number
is determined by tillering success. However, the N requirement when stem elongation begins is only
about one third of the total season uptake. Thus, split N applications often produce better results due to
avoidance of potential N loss conditions such as volatilization, denitrification and leaching. The initial
topdress of a split application should be applied before or at planting. The purpose of this application is to
provide adequate N to promote adequate tillering and head number. In-season applications or final
topdress should be applied by the time the first node appears at the beginning of stem elongation.

Chapter10:EconomicsofNutrientManagementandEnvironmentalIssues|6
The thought behind this timing strategy includes applying N during plant uptake as well as timing to
reduce the risk of loss from early spring rainfall/leaching events. Research in general shows a reduction
in NO3--N concentration in tile drainage water when moving from fall to spring/split applied N fertilizer.
In season N applications also allows the N rate to be adjusted through either soil sampling or crop
canopy sensing.
Nitrogen Source
Research suggests there is little, if any, difference in NO3--N leaching or crop yield when using different
traditional sources of fertilizer or manure, provided similar plant available N application rates are used
and management is appropriate for the source. Using slow or controlled release fertilizer sources may
have an impact on improved crop efficiency and NO3--N leaching, similar as with sidedressing N, but
little water quality data is available to quantify this. Besides potential impact on NO3--N leaching, some
manure sources high in solids content may have a positive impact on soil organic carbon, soil structure
and surface runoff.
Other Practices
Several in-field and edge-of-field practices besides direct N management (rate, time, placement and
source) can significantly reduce NO3--N losses from production fields. These practices will likely need to
be utilized in addition to traditional in-field N management in order to meet NO3--N reduction and water
quality goals.
Cover crops have the potential to reduce NO3--N leaching in corn-soybean rotation by taking up water and
NO3--N during the time between corn and soybean maturity and planting the next crop. However, effect
on NO3--N leaching is greater in areas with potential for more fall and wintertime cover crop growth, and
less in northern climates where the period for cover crop growth is more limited.
Crop rotation changes can help in reducing NO3--N losses by including perennial crops or crops that
require minimal or no N fertilization. For example, perennial crops such as forage grasses, alfalfa, energy
crops, or annual crops less N fertilization demanding would decrease the needed rotation N application
and thus the amount of NO3--N loss. Even though this alternative does not seem possible at a large scale,
it may be an option for specific areas where N contamination of water sources is severe. In extreme cases,
land may need to be taken out of crop production, retired, or converted to permanent pastures in sensitive
areas. The establishment of buffers at the edge of the fields, wetlands, or bioreactors to treat tile-flow

Chapter10:EconomicsofNutrientManagementandEnvironmentalIssues|7
water could also be complementary strategies to help reduce NO3--N loss to surface waters and help with
Gulf hypoxia and local water quality concerns.
Phosphorus Management for High Profitability and Low Environmental Risk
Proper management of P applications is a key for optimizing yield, profitability and water quality. In
most regions, key P management issues for crops involve knowing the optimum soil-test P level, applying
fertilizer to avoid deficiencies and achieving the optimum soil-test level over time by using various
strategies considering fertilization rates and the frequency of application. Therefore, in the vast majority
of fields, the fertilizer P application rates being used are the rates that maintain desirable soil-test P values
based on removal or empirical information. In practice then, the historical P application rates and current
soil-test P level a farmer maintains is the most important and widespread issue for the economics of P
management and water quality. Nevertheless, in some conditions, the P rate, source, time of application
and placement method should be considered to maximize P use efficiency and profitability while
minimizing the risk of water quality impairment. The rate of P application is of great concern with
excessive application that often occurs mainly when manure is applied as a waste, when any manure is
applied at N-based rate to continuous grain crops and even when poultry manure (which often has a lower
N/P ratio) is applied at N-based rates for corn in rotation with soybean. Subsurface banding or injecting of
P could be a best management practice in soils with very high retention capacity that transforms applied P
to forms of low availability to crops or with high risk of erosion and surface runoff.
Soil-Test Phosphorus Level, Crop Yield, and Profitability
Figure 3 shows the general relationship between soil-test P level and crop yield. Soil test levels are
generally distributed into interpretation categories referred to as very low, low, medium (or optimum),
high and very high (or excessive). The critical level or range separates soil-test values for which there is a
high probability of large to moderate crop response to fertilization (very low and low) from values for
which there are small and infrequent responses (high and very high). The critical level will vary with the
test method, crop, soils, climate, and fertilizer/grain price ratio; and sometimes even with the philosophy
of researchers that establish interpretations and recommendations. For example, the Bray-1 P level
considered adequate for crops, and at which no fertilization is recommended, vary from about 12 to 30
ppm for forages or grain crops across the U.S.

Chapter10:EconomicsofNutrientManagementandEnvironmentalIssues|8
Soil P Availability (ppm)
Rel
ativ
e Y
ield
P l
oss
Very low Very highLow HighOptimum
Increasedrisk of P loss
Criticalvalue
foryield
Figure 3. Schematic representation of the general relationship between relative crop yield and P loss with runoff.
In addition, because nutrient and crop prices influence the profitability of nutrient application and crop
production, economic considerations together with producers' management and business philosophies
further influence the optimum soil-test levels for crops. The optimal soil-test P level from an economic
perspective will depend largely on the nutrient and fertilizer price ratios, producer management and
other enterprise decisions. Figure 4 shows, as an example, how different crop/fertilizer price ratios
influence the corn and soybean response to P fertilization and how prices may influence the optimum
soil test level to maintain.

Chapter10:EconomicsofNutrientManagementandEnvironmentalIssues|9
Ret
urn
s T
o 46
lb P
2O5
($/a
cre)
Soil-Test P (Bray-1, ppm)
0 10 20 30 40 50 60 700 10 20 30 40 50 60 70-100
-75
-50
-25
0
25
50
75
100
125
150
175 CORNSOYBEAN
CORNSOYBEAN
L O Soil-Test ClassesH VHVL L O H VHVL Soil-Test Classes
Figure 4. Net returns to P for different soil-test P levels and crop/fertilizer prices. Left graph: Corn and soybean grain at $2.00/bu and $5.50/bu, and P at $0.32/lb P2O5.
Right graph: Corn and soybean at $4.00/bu and $10.00/bu, and P at $0.40/lb. VL, very low; L, low, O, optimum; H, high; VH, very high (from Mallarino, A.P. 2009. Long term phosphorus studies and how
they affect recommendation philosophies. p. 6-12. North-Central Extension-Industry Soil Fertility Conf. Proceedings. Nov. 14-15. Vol. 25. Des Moines, IA).
Phosphorus Management and Water Quality
Phosphorus is lost from fields as dissolved forms in surface runoff or subsurface drainage and as P bound
to soil particles, which is usually referred to as particulate P. The dissolved P runoff fraction is readily
available to algae growth, while the particulate P fraction becomes available over time at a rate that
depends mainly on the chemistry and depth of the receiving waters. With few exceptions, such as in areas
with sandy soil or subsoil and level landscape, the particulate P loss is several times greater than the
dissolved P loss. Therefore, soil and water conservation practices are as important, and often more
important, than P management practices concerning P loss from fields. This is the reason that in most
states P risk assessment tools or P indices have been developed that consider all these factors to classify
fields or field areas according to risk of P loss. The P index or related risk assessment tools are being
required as part of the nutrient management planning process by regulatory federal or state agencies when
manure is applied or when any P source is applied within watersheds with impaired water quality.
Chapter10:EconomicsofNutrientManagementandEnvironmentalIssues|10
Different types of P indices have been developed regionally or by the states. No P index is a complete P
source and transport model, although some have been validated with water quality data. It is a practical
quantitative tool that provides reasonable estimates of P loss risk while they can be used by advanced
farmers, crop consultants and nutrient management planners. It uses an integrated approach to consider
soil and landscape features as well as soil conservation and P management practices in individual fields or
different areas within fields. These characteristics include P source factors such as soil test P, total soil P
and the rate, method and timing of P application using commercial fertilizer, manure and other organic
sources. Transport factors include precipitation, erosion and sediment delivery, surface runoff, distance
from the field to the nearest stream, a variety of soil conservation practices and subsurface drainage.
Components of all current P indices are erosion (particulate P lost with sediment loss) and surface runoff
(dissolved P loss). A subsurface drainage component (dissolved P loss) also is included in regions where
leaching through the soil profile or subsurface tile drainage are important. Most states have publications
in which each state P index is explained with detail. Understanding how the different factors influence the
risk of P loss helps agricultural producers, conservation planners and others by determining the causes of
high risk loss. This allows for the identification of the most effective P management practices and soil or
water conservation practices to reduce the P loss for different fields and conditions.
Phosphorus Management Practices
There are considerations regarding P source, timing, placement and rate that producers that
are included in P indices and should be considered in order to maximize P use efficiency and
minimize P loss from fields.
Phosphorus soil-test level: Interpretation of soil-test P values for water quality issues must be
different than for crop production. There is general agreement that soil-test levels higher than
adequate for crops may significantly increase the risk of P loss and water quality impairment, which
was indicated in Figure 3. The concept of soil-test calibration used for crop production also applies to
interpretations for risk of water quality impairment. The meaning of a certain soil-test value in terms
of nutrient loss and impact on algae growth may vary greatly across sampling depths, soil-test
methods, soil properties, soil and water transport to water resources and the properties of the
receiving water body. Although the hypothetical example in Figure 3 indicates an exponential
relationship between soil-test P level and P loss, the relationship found can be linear when values are
not extremely low or high. Sampling a shallow soil depth, which seldom improves the value of soil
testing for crops, greatly improves the relationship between soil-test P and P loss compared with the
common 6 or 8-inch sampling depth for all fields but mainly for no-till, hay, or pastures. In general,

Chapter10:EconomicsofNutrientManagementandEnvironmentalIssues|11
the increasing risk of P loss becomes consistent for soil-test values higher than about 30 to 50 ppm
(Bray-1 or Mehlich-3 tests, 6 to 8 inch sampling depth), which is at the optimum or slightly higher
levels for most crops. Therefore, the economics of crop production and environmental concerns
should discourage management strategies that increase soil-test P to levels much higher than optimum
levels for crops. Scientists agree that the soil-test P level is only one of several factors that affect P
loss and transport from agricultural fields, so the risk of loss from elevated soil-test P levels should be
considered in a comprehensive P risk assessment tool, such as a P index.
Phosphorus timing: In general, the P application timing does not have a significant effect on crop
yield where the soil properties do not result in extensive conversion of applied P to crop unavailable
forms. This means that in most soils of the U.S., P application can be made at varying times before
planting of crops However, the time of P application during the year and also the time between the
application and a runoff event can significantly influence P loss with surface runoff. For example,
research in Iowa and other states has indicated that total and dissolved P concentrations were over
60% less when a runoff event occurred after 10 to 15 days compared with events immediately after
surface application. As added P reacts with the soil, it enters the labile soil P pool and is less prone to
losses in runoff. Therefore, the risk of P runoff can be substantially reduced by applying P when
runoff events are unlikely for one to three weeks after P application. The probability of runoff P loss
in the Midwest is typically greatest in late winter and spring due to increased frequency and intensity
of rainfall for already wet soils, and in northern areas also due to snowmelt runoff events.
Phosphorus source: Research has shown reduced P losses with runoff with manure compared to
fertilizer, especially with runoff events soon after application. Manure P typically is less soluble in
water than fertilizer P due to organic P fractions, and that results in less dissolved P in runoff
occurring immediately after surface application. Also, manure application can result in reduced
erosion and surface runoff due to increased water infiltration when manure contains considerable
bedding, with reductions in sediment and runoff volume that can be greater than 2.5% per ton of
surface applied manure (dry matter basis) per acre. The effect of such manure application on runoff
and erosion can extend for multiple years after manure application.
Phosphorus placement: Research has shown little to no differential response to P placement
methods for most crops in soils with low P-fixing capacity and where initial soil-test P levels are not
very low. In severe P-deficient conditions, high clay soils and high fixing soils such as those with
high content of aluminum and iron oxides or reactive calcium carbonate, P banding is generally
recommended over broadcast application to increase plant availability of applied P and to obtain

Chapter10:EconomicsofNutrientManagementandEnvironmentalIssues|12
higher P use efficiency and economic return. From a water quality perspective, however, P banding or
injection always reduces particulate or dissolved P loss with erosion or surface runoff compared to
surface application unless the operation increases soil erosion significantly. This is because surface
application of P increases soil P levels at the soil surface (in the soil-runoff water mixing zone).
Runoff P loss may or may not be reduced with incorporation of manure or fertilizer with tillage
because of usually increased soil erosion rates. Precipitation, slope, infiltration rate, application rate,
distance to stream and many other factors influence the benefit of incorporating P with tillage at
reducing P loss with runoff. Dissolved P in runoff is generally higher with surface application if a
runoff event occurs shortly after application. The risk decreases with time after application before a
runoff event occurs and can decrease further when rainfall that do not cause runoff occurs before a
runoff event.
Variable rate phosphorus application: Dense within-field soil sampling has shown very large
spatial variability of soil test P. Precision agriculture technologies available to producers or custom
applicators facilitate application of fertilizer and manure at rates adequate for different parts of a field.
Research has shown that grid or zone soil sampling methods combined with variable rate application
based on soil-test P may not increase crop yield compared with traditional methods but always
reduces spatial variability by minimizing P application to high-testing areas within fields. Variable
rate application of fertilizer P is common, and some custom applicators are beginning to apply
manure using variable-rate technology. Therefore, dense soil sampling and this technology can be
implemented to addressing environmental as well as economic concerns.
Soil and Water Conservation Practices
The risk of runoff P loss is affected by many soil and water conservation practices that in spite of their
potential importance and effectiveness to reduce P loss form fields can only briefly addressed here. These
practices are especially effective in fields with grain crops, since soil and water losses are much less with
well managed permanent hay or pastures. The different practices typically reduce total P loss by affecting
differently the loss of particulate P and dissolved P.
Tillage and phosphorus incorporation into the soil: Tillage practices generally have an impact on
soil erosion, which is the primary source of P delivery with sloping ground. Although the results of P
loss with different tillage systems is site specific, research suggests less P loss generally occurs with
minimum tillage than conventional tillage systems. Systems such as no-till, for example, decrease
significantly the particulate P loss but usually increase the proportion of dissolved P lost.
Chapter10:EconomicsofNutrientManagementandEnvironmentalIssues|13
Cover crops: Cover crops reduce P loss mainly by reducing soil erosion, and the effect of P uptake
varies widely with the amount of growth allowed and the cover species. A cover crop increases soil
stability from root growth in addition to providing a physical barrier between rainfall and the soil
surface. Cover crops can be seeded in the fall using a variety of methods including drilling the seed
after crop harvest, broadcasting the seed after crop harvest, or aerially broadcasting the seed before
harvest. In northern regions the efficacy of cover crops is diminished because there is no winter
growth, and growth in the fall and early spring (before optimum crop planting dates) is limited.
Research suggests that when using a cereal rye cover before corn, the cover should be terminated
about 2 weeks before corn planting in order to limit negative impact on corn growth and yield.
On the other hand, there is no effect on soybean yield, so rye growth can continue longer in the
spring and potentially provide more benefit in reducing erosion and P loss during a period with high
rainfall intensity.
Sediment control structures, contour or strip cropping, buffers, and wetlands: Terraces and
ponds are well known practices that result in significant reduction of soil and P loss from fields,
although their efficacy is highly dependent on the landscape and maintenance. Contour cropping and
strip cropping that alternate summer and winter grain crops or grain crops with hay can significantly
reduce soil erosion, surface runoff, and mainly particulate P loss. Buffers come in many sizes and
shapes, and may involve diverse plant species. Buffers reduce sediment transport from fields and
stabilize stream banks, and physically remove particulate P from runoff water. The impact on
dissolved P loss usually is minor, and is more effective when will enters the soil under the buffer with
infiltrating water. The performance of installed wetlands is very dependent on the wetland-to-
watershed ratio (how large the wetland is compared to the watershed). The larger the wetland-to-
watershed ratio, the greater will be the percentage of P removal. Many factors affect the efficacy of
wetlands at reducing P loss, including how much land is available and the sediment influent
concentration. Over the long term, wetlands may not effectively remove P due to P saturation of the
system, and research has shown that some old wetlands are actually sources of dissolved P.
Summary
Adequate nutrient management permits efficient crop production while reducing water quality
degradation from nutrient pollution. A nutrient management plan is a site-specific decision process that
integrates appropriate rate, source, timing and placement. This permits efficient nutrient use by crops and
helps reduce nutrient losses to the environment. The issues associated with development and
Chapter10:EconomicsofNutrientManagementandEnvironmentalIssues|14
implementation of nutrient management plans are many and complex. Some amount of nutrient loss will
occur even when the best nutrient management practices are employed, but these losses should be lower
than would occur without nutrient management.
For N management, of greatest importance is for crop producers to carefully consider the rate of
application, and apply rates that provide maximum return to the N investment. Any N application will
increase soil NO3--N and thus potential for greater NO3
--N concentrations moving to water systems.
However, applying economic optimal rates maximizes return and reduces N effects on water quality.
Because N of most environmental concern is NO3-, other management practices need to focus on
improving crop N use, that is high yield production, and limiting NO3- accumulation or keeping NO3
- in
the soil system. These practices, such as overall optimal crop production practices, time of application,
nitrification inhibitors, slow-release products, cover crops and in-season tools such as soil NO3- testing
and crop sensing, will help with improving use efficiency and lower chance of N loss.
Phosphorus management is somewhat simpler than for N in humid regions, due to differences in the type
of chemical transformations, no gaseous phase or volatilization risk, and less influence of environmental
factors on processes that control crop-available forms and losses. Also, although the vast majority of P in
soils is unavailable to plants because it is bound in insoluble P minerals or sorbed strongly to soil
particles, soil sampling and testing is more reliable and useful than testing for N in humid regions. The
goal of sound P management in most regions of the U.S. should be to keep the soil-test P level at optimal
ranges for maximum economic crop yield, and utilize application methods and timing that optimize P use
efficiency and economic profitability, while minimizing the risk of excess P loss from fields that can
impair water resources. Due to the strong dependence of P loss on soil and water losses from fields,
crop, soil and P management systems should avoid or minimize practices that increase soil erosion and
surface runoff. Therefore, P management planning must consider practices that influence erosion and
water loss from fields, and cannot simply address soil-test P and P application. Use of the P index or
similar P risk assessment tool that estimates in a comprehensive way impacts of the risk of P loss for P,
soil, and water management practices the best way by which producers can evaluate how economically
optimum P management practices interact with soil conservation practices so that they can minimize
water quality impairment.