impacts of site-specific nutrient management in irrigated...
TRANSCRIPT

Impacts of Site-Specific Nutrient Management in Irrigated Rice Farms in the Red River Delta, Northern Vietnam
Divina Gracia P. Rodriguez* and Nguyen Thi Duong Nga
† *Department of Agricultural and Consumer Economics, University of Illinois at Urbana-Champaign &
International Rice Research Institute †Faculty of Economic and Rural Development, Hanoi Agricultural University
Corresponding author:
Divina Gracia P. Rodriguez
326 Mumford Hall 1301 W. Gregory Drive Urbana, IL 61801 USA
Phone No.: 1 (217) 621-7399 Email: [email protected]
Selected Poster prepared for presentation at the International Association of Agricultural Economists (IAAE) Triennial Conference,
Foz do Iguaçu, Brazil, 18-24 August, 2012.
Copyright 2012 by Divina Gracia P. Rodriguez and Nguyen Thi Duong Nga. All rights reserved. Readers may make verbatim copies of this document for non-commercial purposes by any means, provided that this copyright notice appears on all such copies.
2
Impacts of Site-Specific Nutrient Management in Irrigated Rice Farms in the Red River Delta, Northern Vietnam
ABSTRACT
This study estimates the impact of the adoption of SSNM practices on rice production of smallholder farmers in Vietnam using cross-section household data (n = 371) gathered from the provinces of Ha Nam and Ha Tay in the Red River Delta. Specifically, it investigates the economic impact of SSNM, focusing on SSNM-induced changes in the yield, profit, nitrogen use and pesticide use of farmers. The instrumental variables (IV) approach is used to achieve this objective because it deals with endogeneity and self-selection bias present in the study. SSNM improves the paddy yield of farmers by 0.6 tons per hectare and profit by $150 per hectare. It has no statistically significant effect on the amount of pesticide and nitrogen use of farmers. The higher profits for adopters versus non-adopters of SSNM arise from increased grain yield rather from reducing fertilizer costs and pesticide costs. Results of the impact analysis identified several directions that can be pursued to improve further the adoption of SSNM.
Key words: Site-specific nutrient management, instrumental variables, nitrogen, Red River Delta, smallholder farmers

3
Impacts of Site-Specific Nutrient Management in Irrigated Rice Farms in the Red River Delta, Northern Vietnam
I. Introduction
Rice is an important staple food for about 70 percent of the Asian population
(nearly 3 billion people). More than 75 percent of rice worldwide is produced in irrigated
rice lands and 90 percent of these irrigated lands are paddy rice production found
predominantly in Asia (Bouman et al., 2006). In irrigated rice grown under favorable
tropical conditions, rice requires essential nutrients such as nitrogen that are typically not
present in the soil in sufficient amounts to meet crop needs. Nitrogen is the most
important nutrient because it significantly affects tillering, leaf area growth, biomass
production, and grain yield (Yang et al., 2003). It is also the most limiting agent in
almost all soils (Balasubramanian et al., 1999). Rice production alone uses 16 percent of
total nitrogen fertilizer and 15 percent of fertilizer worldwide (Heffer, 2008). Fertilizer
accounts for about 20 percent of input costs in rice production – the biggest after labor
(Clayton, 2010). Because fertilizer is such an important input, it is essential for
agricultural sustainability to develop effective management of nutrients important for
plant growth (IFPRI, 2000). In this regard, rice production must become more efficient
in the use of fertilizer and essential plant nutrients.
Fertilizer recommendations provided to farmers typically do not consider field,
climate, and management-specific effects on the nutrient needs of the crop (Buresh,
2006). Indeed, factors affecting crop yield and quality are site-specific (Reets and Fixen,
2000). Therefore, to ensure that nitrogen and other essential plant nutrients are provided
in optimal amounts, and are readily available during crop-growth periods, site- specific
4
nutrient management (SSNM) was developed in Asia by the International Rice Research
Institute (IRRI) 1. SSNM is a low-tech, plant need-based approach for optimally applying
nitrogen, phosphorus, and potassium fertilizers to rice when they are needed (IRRI 2006).
As a result, wider farmer adoption of SSNM will increase land productivity, yield, and
profitability of farmers, and decrease fertilizer-related pollution in the environment.
In Vietnam, researchers from IRRI and Soil and Fertilizer Research Institute
(SFRI) initiated SSNM in five provinces in Red River Delta (RRD) in 1997. They
developed specific SSNM recommendations tailored to soil conditions/fertility and the
cropping seasons of different sites in the region. Given the large investments in the
SSNM approach by international agencies (e.g. Swiss Agency for Development and
Cooperation), various stakeholders and policy makers in Vietnam are interested in the
magnitude of its impacts and currently, SSNM is not yet approved as an “advanced
technology” in the country2. Hence, this study is conducted.
In this paper, I assess the impacts of SSNM on yield, profit, fertilizer use and
pesticide use of Vietnamese farmers. Cross-sectional data from a 2007 farm-level survey
conducted by IRRI in the provinces of Ha Nam and Ha Tay in the RRD form the basis of
the analyses. To my knowledge, the survey was the first farm-level survey on the impact
of SSNM conducted in Southeast Asia. I mainly rely on methods based on comparison of
groups (i.e. comparison of SSNM adopters versus non-adopters, rather than comparison
of before and after SSNM adoption or a combined panel data approach). Given that 1 The optimal amount of nitrogen and other essential plant nutrients is defined as the amount of nitrogen and other essential plant nutrients that will maximize yield. To focus on the SSNM itself, allocations under profit maximization which account for relative input and output prices are not considered since the effect of different rice prices and input prices is not large. 2 The SSNM is not yet approved as an “advanced technology” since a project called “Three Reductions, Three Gains” (3R3G) which aims to reduce production costs, improve farmers’ health, and protect the environment in irrigated rice production in Vietnam through the reduced use of seeds, nitrogen fertilizer, and pesticides, has already been approved and disseminated in the country.

5
cross-sectional data do not permit analysis of the dynamics of technology adoption (Doss,
2005), I use regression-based techniques to deal with selection issues typically present in
impact analysis that utilizes comparison of groups. In particular, I use instrumental
variables (IV) methods to solve the problem of missing or unknown controls. The IV
methods can deal with the self-selection bias in observational data collected through
household survey (Rosembaun and Rubin, 1983; Heckman and Vytlacil, 2005) and hence
can identify the causal effect of adoption. Results indicate that SSNM technology
improves farmers’ yield and profit. However, pesticide and nitrogen use are found to be
unaffected.
Analyses of this study will provide information to determine whether or not
SSNM is effective in raising the productivity and profitability of rice. Confidence and
consensus building on the developed SSNM technology is vital considering that other
less efficient nutrient technologies are being promoted in the area. Policy makers will
then be able to assess whether or not the research investment in developing this
technology is worthwhile. More importantly, results of this study, if found to be positive,
may help convince the Ministry of Agriculture and Rural Development (MARD) in
Vietnam to approve the SSNM technology as an “advanced technology” and hence can
be further disseminated in the RRD in particular, and in the whole country, in general.
Moreover, upon SSNM approval, this study may guide them in future priority-setting
decisions and help to focus dissemination efforts aiming to make an impact on farmers’
lives. Although this study focuses on RRD area of Vietnam, the conditions in the study
area are typical for rice farming in the intensive cropped lowlands of Southeast Asia.

6
Hence, findings from this study may have broader implications for other rice producing
countries in the region.
II. Literature Review
Numerous studies exist that investigate adoption and impact of various
agricultural techonologies (Griliches, 1957; Feder, Just and Zilberman, 1985; Feder and
Umali, 1993 for a detailed survey of the adoption literature). Pandey (1999) enumerates
that a farmer’s decision to adopt nutrient technology depends on the following: (1)
whether or not the fertilizer cost is greater than the marginal cost of acquiring and using
efficient nutrient management technology; (2) added labor cost in using the technology;
and (3) ease in applying the technology. Balasubramanian (1999) indicates that many
technical factors and management practices constrain the adoption of efficient nitrogen
management techniques. These include (1) poor water control; (2) low plant population;
(3) partial nutrient application3; (4) insufficient weed control; (5) untimely sowing,
transplanting, weeding, and/or harvesting; and (6) poor postharvest processing. Akinola
et al. (2007) add a number of factors such as (1) access to credit, (2) farmers’ perception
of the state of land degradation, and (3) assets ownership. Ouma et al. (2002) look at the
adoption of improved seed and fertilizer in Embu District in Kenya where they find that
gender, agro-climatic zone, manure use, hiring of labor and extension services are
significant determinants of adoption.
The potential impacts of these nutrient-management techniques are also studied
by Duflo et al. (2005). They run controlled experiments in Western Kenya over five years
to measure returns from fertilizer use and find that the average net rate of return for 3 When farmers are faced with cash constraints, they tend to buy and use mostly N fertilizers. This selective application of nutrients in intensive systems leads to soil mining of elements not supplied from external sources.

7
investing in top-dressing fertilizer is between 28 percent and 134 percent for an eight-
month investment. In addition, there are several studies that specifically examine the
impact of the SSNM approach on fertilizer use and/or paddy yields primarily using field
experiments.
Doberman et al. (2002) conduct on-farm experiments to develop and test a new
SSNM approach for eight key irrigated rice production domains of Asia located in six
countries from 1997 to 1999. They hypothesized that rice yields, profit, plant nutrient
uptake, and nitrogen use efficiencies can be significantly increased by applying fertilizers
on a field-specific and cropping season-specific basis, i.e. through SSNM. They find that
average grain yield increased by 0.36 Mg per hectare with SSNM as compared to current
farmers’ fertilizer practice in their study in cropping systems in Asia. Their results also
show than SSNM led to significant increases in nitrogen use efficiency. Average
agronomic efficiency applied nitrogen (kg grain yield increase per kg nitrogen applied)
under SSNM was 15 kg kg-1, apparent recovery efficiency of applied nitrogen (kg
nitrogen taken up per kg nitrogen applied) 0.40 kg kg-1, and partial factor productivity of
applied nitrogen (kg grain per kg nitrogen applied) 52 kg kg-1. Compared to the farmers’
fertilizer practice, average agronomic efficiency applied nitrogen and recovery efficiency
of applied nitrogen increased by almost 30 percent, partial factor productivity of applied
nitrogen by six percent.
In terms of profitability, on average, across all sites, there was an increase in
profitability of US$46 ha-1 through the use of SSNM. This increase is attributed to the
following: (1) SSNM technology was gradually improved and more effective at

8
increasing yields in the second year; and (2) the SSNM strategy involved re-capitalizing
soil phosphorus and potassium applied in the first year.
Son et al. (2004), particularly analyze the SSNM in irrigated rice systems of the
Red River Delta. A SSNM plot was established on each of the 24 farm fields as a
comparison with the farmers’ fertilizer practice. Using simple comparison of means,
SSNM results in a small yield increase of 0.19 tons per hectare on winter-spring season
over the farmers’ fertilizer practice, which is not statistically significant. They also look
at the effect of SSNM on fertilizer use and profit. Results of their study reveal that
SSNM decreased the total fertilizer cost by about $2 per hectare in 1998 and by $22 per
hectare in 1999. The average profit increase over farmers’ fertilizer practice is $41 per
hectare in 1998 and $74 per hectare in 1999.
Pampolino et al. (2007) explore the environmental impact and economic benefits
of SSNM in irrigated rice systems in Asia, particularly in the Philippines, southern India,
and southern Vietnam. Using on-farm trials research data, their results show that SSNM
leads to higher efficiency of nitrogen use. While the annual nitrogen use was the same
for SSNM and farmers’ fertilizer practice farmers in India, the reductions in fertilizer use
with SSNM averaged 10 percent in the Philippines, and 14 percent in Vietnam. In all
three locations, the estimated grain yields were significantly higher in SSNM than in
farmers’ fertilizer practice fields. In addition, the partial factor productivity of nitrogen
increased significantly with SSNM in the Philippines and Vietnam. This increase can be
associated with increased plant use of nitrogen and reduced loss of nitrogen. SSNM
decreases the percentage of total nitrogen losses from applied fertilizers, thus reducing
the nitrous oxide emissions and global warming. Economic performance of SSNM ad

9
and adopters and non-adopters are also compared using economic data through focus
group discussions. Gross revenue and gross return above fertilizer costs are higher for
SSNM than non-SSNM farmers across the three countries. Although the practice of
SSNM does not reduce the total input costs, it raises the net benefits of farmers by
US$168, US$106, and US$34 per hectare per year in India, the Philippines, and Vietnam,
respectively. Dawe et al. (2004) find in their study in China, Southern India, and the
Philippines the profitability in SSNM ranged from $57 to $82 per hectare. They also find
out that the sites in Vietnam (southern and northern) exhibited intermediate levels of
profitability at $38-39 per hectare. Studies of Khurana et al. (2007) in northwestern India
and Wang et al. (2007) in China find similar results.
Most of the studies mentioned above typically are based on controlled field
experiments and focus group discussions data that use simple “with SSNM and without
SSNM comparisons” without controlling for a number of econometric problems that may
have affected inferences (i.e. endogeneity and selection). These studies do not utilize
farm-level survey data to examine actual behavior of farmers (who face constraints that
experiment participants do not) and impact of the SSNM approach. Also, it is likely that
farmers with more human capital are more likely to participate in the farm-trials. In
addition, no study (as far as I know) has specifically examined the impacts of SSNM on
pesticide use of farmers.
This paper contributes to the literature by (1) providing an analysis of SSNM
impact on yield, profit, nitrogen use, and pesticide use based on actual practice of farmers
since farmers’ perceptions of the effectiveness of SSNM will be an important factor
affecting adoption, and the visibility of yield gains will be an important factor influencing

10
those perceptions and (2) using regression-based approaches that control for endogeneity
and selection bias in the impact analysis of the SSNM technology.
III. Background, Survey Design, and Data Description
A. SSNM Technology in Vietnam: Overview and Dissemination Approach
Rice production in RRD accounts for about 20 percent of total rice output in
Vietnam. The RRD has an area of about 1.5 million hectare spread over 10 provinces
including Hanoi, the capital. It is probably one of the most intensively cultivated
agricultural areas in the world, in terms of both cropping intensity and the cumulative
amount of grain produced per year (Son et al., 2004). The total agricultural land in 2007
was 756,000 hectares account for 51 percent of the total land area of the region. RRD is
the second largest rice area in the country next to Mekong River Delta and is considered
as the rice bowl for the north.
From 1990 to 2003, the total land area cultivated to rice in Vietnam increased 1.4
times while nitrogen, phosphorus, and potassium applied per hectare increased 2.97
times, 4.76 times, and 14.3 times, respectively (Hien, 2005). Various studies (Hien,
2005; UNEP, 2005; Dung et al., 2003) report unbalanced and excessive use of chemical
fertilizer, especially nitrogen in the RRD. Inappropriate rates and timing of fertilizer
applied to rice lead to losses in income and negative environmental impacts.
To help address this problem, the IRRI and the SFRI developed specific SSNM
recommendations in RRD in 1997. The SSNM recommendations are based on the
following principles: (1) estimation of nitrogen-potassium-phosphorus requirements for

11
the target grain yield4; (2) determination of indigenous nitrogen-potassium-phosphorus
supply; (3) calculation of nitrogen-potassium-phosphorus fertilizer rates; and (4) use of
dynamic nitrogen management using leaf color charts (LCCs)5.
The SFRI then collaborated with the Plant Protection Division and the provincial
extension center in RRD. During the period 1997-2000, on-farm research was focused in
giving preliminary recommendations on nutrient management for alluvial and degraded
soils in the provinces of Ha Tay and Vinh Phuc. From 2001-2004, SSNM was validated
for intensive rice systems in five provinces of RRD namely, Nam Dinh, Ha Nam, Ha
Tay, Vinh Phuc, and Hai Phong. In these five provinces, SSNM evaluation and nutrient
omission plot experiments were conducted in five soil types of RRD. Pilot trials, training
of trainers, farmer field school, and field demonstrations were conducted. A curriculum
for training of farmers was developed and revised over four consecutive cropping seasons
(2003-2004). In 2005, wider-scale evaluation and promotion of SSNM began in 11
provinces of the RRD (Figure 1). In eight of eleven provinces, activities in 2005 included
both research (LCC demonstration, nutrient omission plots) and training of trainers. In
the three provinces remaining, the activities focused only on training of trainers.
The National Extension Center and the Plant Protection Division provided
extension information directly to farmers through mass media, such as television, radio,
and newspapers. The provincial extension center and sub-Plant Protection Divisions also
4 The grain yield target for a given location and season is the estimated grain yield attainable with farmers’ crop management when nitrogen, phosphorus, and potassium constraints are overcome. It therefore indicates the total amount of nutrients that must be taken up by the crop. 5 LCC is an easy-to-use and inexpensive diagnostic tool for monitoring the relative greenness of a rice leaf as an indicator of the plant N status, and then enabling farmers to apply fertilizer N whenever leaves reach a critical N status determined by their yellowish-green color (Alam et al. 2005). The standardized LCC is five inches long, made of high-quality plastic consisting of four-color shades from yellowish green (No.2) to dark green (No. 5). The color strips are fabricated with veins resembling rice leaves.

12
disseminated information through local television channels and publications. Note,
however, that information was broadcasted on limited occasions at the project sites.
SSNM was also introduced to farmers through extension networks in a limited
number of communes in the project sites. Extension workers held trainings, workshops,
and field visits. The National Extension Center and Plant Protection Division also had
demonstration model plots in the project sites. During the introduction of new rice
varieties or seed production, SSNM was incorporated in some communes as a required
practice. It is important to note that these activities were only feasible in areas where
there was enough budget/funding for SSNM development. So far, SSNM has not been
approved as an “advanced technology” by the Scientific Committee of Ministry of
Agriculture and Rural Development of Vietnam. Thus, it is not yet considered as a
technology that can be officially disseminated through the wide network of extension
systems, and hence, limited funds from extension departments (national and provincial)
are provided for the diffusion of SSNM.
B. Data Description and Sampling Approach
Primary survey data were obtained from both the SSNM farmer-adopters and
non-SSNM farmer-adopters in the provinces of Ha Nam and Ha Tay. The Ha Nam
province was selected for the following reasons: (1) presence of demonstration plots in
farmer fields (omission plots to determine the amount of fertilizers nitrogen, phosphorus,
and potassium required for attaining a yield target); use of a LCC to assist farmers to
decide whether the rice plant requires nitrogen fertilizer began in 2002 in one village in
each of its two districts; (2) a farmer field day was held in 2003 with coverage by the
local television channel; (3) training of trainers and farmer field days have been held each

13
year from 2004-2007 which involved local government officials, including extension
specialists from each district within the province, and key farmers; and (4) strong support
for extension of the technology from the provincial Department of Agriculture. Ha Tay
province was selected because: (1) it was one of the five provinces where SSNM
evaluation and nutrient omission plot experiments were conducted on five soil types from
1998-2004; and (2) activities such as LCC demonstration and training of trainers where
conducted from 2005 onwards.
A three-stage sampling approach was then employed in the selection of farmer-
respondents. The first stage was the non-random selection of two districts within each
province based on the quality of the soil to account for soil-specific fixed effects. In Ha
Nam, these districts were Bin Luc District representing poor soil and Thanh Lien District
representing good soil6, while in Ha Tay, Thuong Tin (good soil) and Thach That (poor
soil) were chosen. Second, two or three villages from each district were then randomly
chosen. The villages selected within a district had similar characteristics with regard to
the topography of soil and climate. Third, a random selection of farmer respondents was
conducted for each village. After the survey, considering time and budget constraints,
there were 371 farmer-respondents in the study. Sixty-one percent of the respondents
were classified as SSNM adopters and 39 percent as SSNM non-adopters. SSNM
adopters are those farmers who currently practice SSNM; otherwise they are SSNM non-
adopters.
The data were collected from 2006 winter-spring season which consist of on-farm
fertilizer management strategies of the farmers, various input and output data for rice 6 In the context of this study, poor soil is high lime content, whereas good soil is the alluvial type of soil. Alluvial soils are generally rich in mineral nutrients. This is the best soil in the delta, with humus content of two percent, total nitrogen of 0.1 to 0.25 percent, and medium phosphorus and potassium.
14
production, such as input use (i.e. labor, seed, etc.), rice production output, input costs,
and rice revenues7. In addition, information about pertinent socio-demographic
characteristics of the farm like the household size, tenure status, and exposure to SSNM
training were collected.
IV. Empirical Approach and Estimation Procedures
A. Estimation Strategies
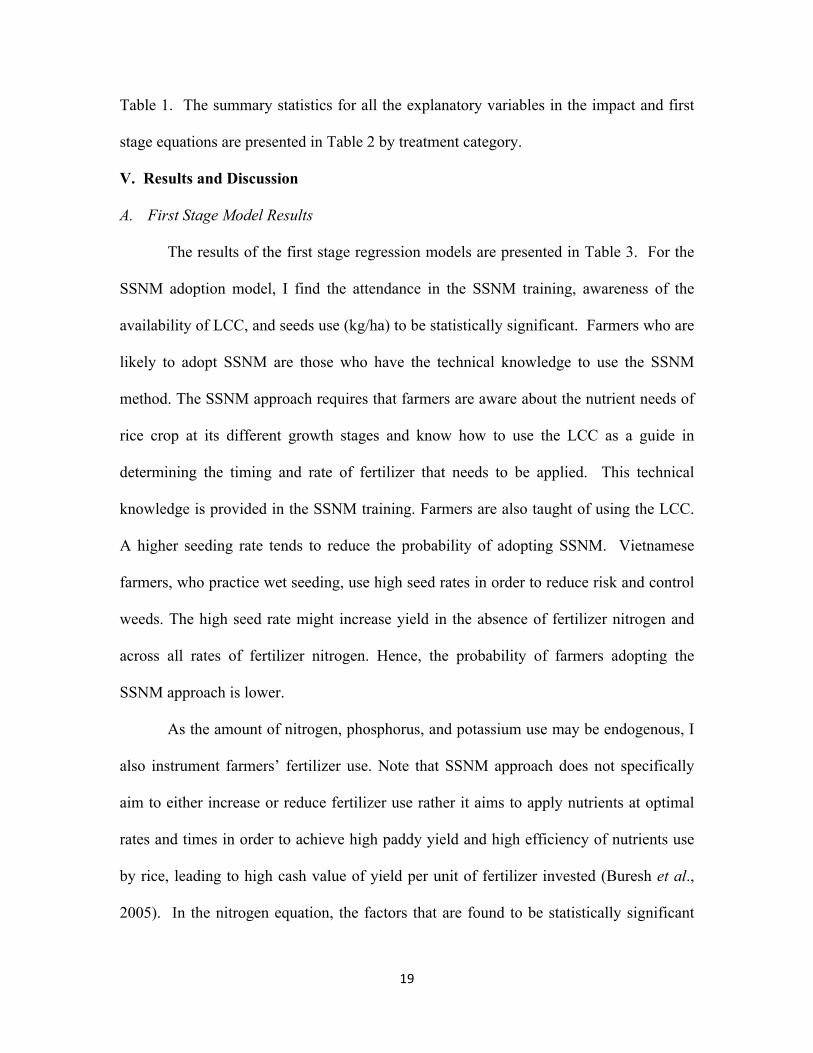
The following estimation measures the impact of SSNM adoption on the
following outcome variables: paddy yield, profits, nitrogen use, and pesticide use. In the
context of this study, the equation to estimate the outcome variables can be expressed
using the following Ordinary Least Squares (OLS) regression:
!! = !!!+ !!"#!! + !! (1)
where is the outcome of interest of farmer i, is the vector of farm/farmer
characteristics, is a binary variable representing whether or not farmer adopted
SSNM, is a vector of parameters to be estimated, is the impact parameter of
interest, and is a random error term. A crucial assumption of OLS is that the random
error term is uncorrelated with independent variables in the model. In the context of my
study, the samples are not randomly selected; therefore SSNM dummy variable and the
amount of fertilizer use may be endogenous because of unobserved covariates (i.e.
unobserved management ability) that affect the decision to adopt SSNM, amount of
fertilizer use, and the outcome variables of interest. That is, SSNM and amount of
fertilizer use are likely to be correlated with .
7 I only use the data from winter-spring season because the summer-autumn season is often affected by heavy rainfall or storms.
€
yi
€
xi
€
SSNMi
€
β
€
α i
€
ε i
€
ε i

15
I control this endogeneity problem using instrumental variables (IV) for treatment
(Imbens and Angrist, 1994; Imbens, 2004; Heckman and Vytlacil, 2005). Let the SSNM
adoption now be defined as follows:
(2)
where is a vector of explanatory variables that affect SSNM adoption, is a
conformable parameter vector to be estimated, and is a random error term. The
endogeneity problem exists if there are unobserved factors in !! and !! that make these
errors correlated (See Heckman, 1978; Burrows, 1983). To ensure proper identification,
there should be at least one instrument that is correlated with SSNM status but does not
affect the outcome once the effects of the covariates are controlled for. Using my
sample, I can now regress (2) using probit model and then use the predicted probability
!!"# as an instrument for the actual SSNM dummy variable, i.e.,
!! = !!!+ !!"#! ! + !! (3).
Equation (3) can then be estimated using OLS regression and the parameter estimate ! is
more accurate impact measure of the SSNM approach. I use also IV for the amount of
fertilizer use (nitrogen, phosphorus, and potassium) that may also be endogenous.
However, instead of using the predicted probability as an instrument, I use the predicted
values of nitrogen, phosphorus, and potassium. One possible problem in using IV
approach is heteroskedasticity because it can make the standard errors inconsistent. To
address this problem, I implement Generalized Method of Moments (GMM) estimation
that generates efficient estimates in the presence of heteroskedasticity.
€
SSNMi = ziπ i + vi
€
zi
€
π i
€
vi

16
B. Empirical Specification
The outcome/dependent variables of interest !! are farmer’s nitrogen use, paddy
yields, profits, and pesticide cost8. Nitrogen use is tested to see whether SSNM adoption
reduce or increase the quantity of nitrogen use. SSNM eliminates waste of fertilizer by
preventing excessive rates of fertilization and by avoiding fertilization when the crop
does not require nutrient inputs. Reduction in nitrogen use may be possible in some areas
without any sacrifice in yields (Wang et al., 2001). This would in turn improve farm
profitability to some extent (lower input costs); perhaps even a large extent in areas
where fertilizer use is very high. More so, optimal use of fertilizer will lead to increased
paddy yield. Hence, yield and profitability of farmers are of interest. A given percentage
increase in yield will do much more for profitability than a similar reduction in nitrogen
use, because the ratio of nitrogen costs to gross revenue from paddy is typically eight
percent or less (Dawe, 2000). Lastly, since improved nitrogen management makes crop
less attractive to pests, it is interesting to see whether SSNM adoption reduces the cost of
pesticide use for irrigated rice.
To estimate the impact of SSNM on yield, profit, and pesticide cost (equation 3),
the following covariates are used in my specification: education, years of farming
experience, land ownership dummy, household size, whether or not the soil is good,
nitrogen use, phosphorus use, potassium use, whether or not farmer has access to credit,
seed use, and labor use. Education and farming experience are proxy variables for
knowledge, farming ability, and experience. Land ownership dummy and household size
variables account for wealth and scale effects and good soil dummy variable accounts for
8 Pesticide costs includes insecticide, fungicide, herbicide, molluscicide, and rodenticide. I could not find a common measurement index for these pesticide, thus cost is used in the analysis.

17
soil-specific effects. The credit dummy variable is included to see whether a farmer has
access to credit because the lack of such access may constrain farmers from using
technologies that require the initial investments (Doss, 2005). The nitrogen, phosphorus,
potassium, seed, and labor variables account for other essential inputs of production and
these explanatory variables are consistent with previous empirical impact studies of
technology (Pampolino et al., 2007; Wang et al., 2007).
To predict probability of SSNM in the first-stage probit (equation 2), I use as
explanatory variables (!!) education, years of farming experience, land ownership
dummy, household size, whether or not the soil is good, amount of nitrogen use, amount
phosphorus use, amount potassium use, whether or not farmer has access to credit,
amount of seed use, and amount of labor use. The instruments I use are whether or not
the farmer is married, a dummy for training, whether or not the farmer has seen a LCC, a
province dummy and a male dummy. A priori, a married farmer is expected to adopt
SSNM since he needs to feed more mouths (i.e. he has more incentives/motivation to
increase his profits). The training dummy pertains to the SSNM training where farmers
are trained on the techniques and guidelines to use effective nutrient management
practices for their specific rice-growing conditions. The LCC dummy is also included to
account for the awareness of farmers on the relative greenness of a rice leaf as an
indicator of the leaf nitrogen status. The province dummy serves as a proxy for provincial
agricultural extension agents’ effectiveness in the conduct of SSNM training while male
dummy variable is specified to account for the female household heads participation. In
RRD, females are usually the one who buys fertilizer, and who decides when and what
fertilizer to buy while applying fertilizers is largely perceived as men’s role. Note that

18
married, training, LCC, province, and male dummies are the explanatory variables in the
selection equation but not in the impact equation to ensure identification. An over-
identification test indicates that these instruments are valid for both SSNM and fertilizer
use. The predicted probability of SSNM using these instruments is then used to estimate
the yield, profit, and pesticide cost in the second stage. Since fertilizer use may also be
endogenous, the estimated values of nitrogen use, phosphorus use, and potassium use are
also computed using these instruments9.
Since the amount and timing of fertilizer decision is the major component of
SSNM, the SSNM approach will not only affect yield, profit, and pesticide cost of
farmers, but also the nitrogen use. To estimate the impact of SSNM on nitrogen use, the
following explanatory variables are used: training dummy, LCC dummy, education, years
of farming experience, land ownership, household size, good soil dummy, amount of seed
and labor, and pesticide cost. The following are the explanatory variables to predict the
probability of SSNM and the estimated values of phosphorus and potassium use in the
first stage: education, years of farming experience, land ownership dummy, household
size, whether or not the soil is good, amount of nitrogen use, amount phosphorus use,
amount potassium use, whether or not farmer has access to credit, amount of seed use,
amount of labor use, whether or not the farmer is married, a dummy for training, whether
or not the farmer has seen a LCC, a province dummy and a male dummy. The credit,
married, male, and province dummies are the instruments used in the selection equation
but not in the impact equation. The over-identification test indicates that the instruments
used are valid. A detailed description of all the variables used in analysis is shown in 9 Usually nitrogen, phosphorus, and potassium are applied together by farmers. However, in this study I analyze these three nutrients separately since farmers usually apply different formulations of nitrogen, phosphorus, and potassium to the farm.
19
Table 1. The summary statistics for all the explanatory variables in the impact and first
stage equations are presented in Table 2 by treatment category.
V. Results and Discussion
A. First Stage Model Results
The results of the first stage regression models are presented in Table 3. For the
SSNM adoption model, I find the attendance in the SSNM training, awareness of the
availability of LCC, and seeds use (kg/ha) to be statistically significant. Farmers who are
likely to adopt SSNM are those who have the technical knowledge to use the SSNM
method. The SSNM approach requires that farmers are aware about the nutrient needs of
rice crop at its different growth stages and know how to use the LCC as a guide in
determining the timing and rate of fertilizer that needs to be applied. This technical
knowledge is provided in the SSNM training. Farmers are also taught of using the LCC.
A higher seeding rate tends to reduce the probability of adopting SSNM. Vietnamese
farmers, who practice wet seeding, use high seed rates in order to reduce risk and control
weeds. The high seed rate might increase yield in the absence of fertilizer nitrogen and
across all rates of fertilizer nitrogen. Hence, the probability of farmers adopting the
SSNM approach is lower.
As the amount of nitrogen, phosphorus, and potassium use may be endogenous, I
also instrument farmers’ fertilizer use. Note that SSNM approach does not specifically
aim to either increase or reduce fertilizer use rather it aims to apply nutrients at optimal
rates and times in order to achieve high paddy yield and high efficiency of nutrients use
by rice, leading to high cash value of yield per unit of fertilizer invested (Buresh et al.,
2005). In the nitrogen equation, the factors that are found to be statistically significant

20
are SSNM training, LCC, province dummy, education, and pesticide cost. The attendance
in training increases the use of nitrogen by 8 kg/ha. This suggests trained farmers are
aware of the importance of nitrogen in rice. Nitrogen is applied to crop to increase height,
promote production of tillers, and increase the sizes of leaves and grains. On the other
hand, LCC tends to decrease nitrogen use by 14 kg/ha. Farmers used to think that green
leaves are always a good indicator of high yield and try to apply as much nitrogen as
possible. However, with the use of LCC, farmers are able to monitor the nitrogen status
of plants and only apply nitrogen fertilizer whenever leaves reach a critical nitrogen
status determined by their yellowish-green color. With the use of LCC, they are able to
maintain optimal leaf nitrogen content. With the training and awareness of LCC, they
learned that nitrogen should not be applied at anytime and at any amount to achieve
“green leaves”. However, only one-fifth of the SSNM adopters own a LCC. Other
adopters do not own and use LCC because they are able to observe leaf color and already
know when and how much nitrogen should be applied. Also, when village leaders and/or
extension workers visit, they use LCC and recommend farmers on fertilizer application.
Further, if a farmer lives in Ha Nam, the amount of nitrogen fertilizer is reduced.
The province dummy serves as a proxy for the level of skills or effectiveness of
provincial extension workers. The effective uptake by farmers of a relatively knowledge
intensive technology such as SSNM necessitates the communication of consistent and
clear messages to farmers. This requires ensuring the extension workers who provide
information to farmers are familiar with the SSNM guidelines and how they can be used
by farmers to develop improved practices for specific rice fields through trainings.
However, since there is a very limited fund for SSNM in Vietnam, it is possible that the

21
quality of training given to local extension workers and eventually the quality of training
workshops, and information given to farmers by the former might be affected by the
budget constraint. The reduction of nitrogen use might suggest that extension workers in
Ha Tay are more effective in teaching farmers the importance of essential plant nutrients,
especially nitrogen, phosphorus, and potassium to the development of rice crop.
Meanwhile, higher education level of farmer tends to decrease its nitrogen use. This
suggests more educated farmers tend to avoid using excessive amount of nitrogen.
Perhaps with their education level, these farmers are aware that excessive use of nitrogen
does not necessarily translate to higher yield and is harmful to the environment. On the
contrary, the higher the pesticide use, the higher is the nitrogen use of farmers. To
compensate for the loss in yield due to presence of pests, farmers tend to apply more
nitrogen. Recent studies (Potera, 2007; Fox, et al., 2007) also show that pesticide disrupts
nitrogen fixation10. When this happens, increased dependence on synthetic nitrogenous
fertilizer occurs.
In the phosphorus equation, I find that having access to credit, living in Ha Nam
province, and increasing the seed rate have a negative statistically significant effect on
the amount of phosphorus use in the field. Although fertilizer accounts for almost 20
percent of farm expenditure, farmers usually do not borrow money to spend on fertilizers.
Vietnamese farmers usually access credit to pay for farm labor requirements (e.g. land
preparation). More so, access to credit is used for other household expenditure (e.g.
education of children). Like in the case of nitrogen use, the province dummy has
negative relationship on phosphorus use. This may suggest that extension workers in Ha 10 Plants produce chemicals that attract Rhizobium soil bacteria to their root systems to form nodules for nitrogen fixation (Potera, 2007). Nitrogen-fixing Rhizobium bacteria convert atmospheric nitrogen to ammonia and other sources utilizable by plants.

22
Nam province may have not fully explained and emphasized the importance of
phosphorus to rice to farmers. Phosphorus stimulates root development, tillering, and
early flowering. It also helps in the grain development.
The statistically significant factors that affect the use of potassium are the
following: LCC, access to credit, province dummy, and farming years. Like the effect in
nitrogen use, LCC, access to credit, and province dummy have negative relationship on
the amount of potassium use. In contrast, the more years of farming experience of
farmers tends to increase the amount of potassium used and this has to be interpreted with
caution. One way to interpret this result is that more experienced farmers are the ones
who are more knowledgeable in farming. They know that potassium plays an important
role in physiological process of rice, and contributes to greater canopy photosynthesis
and crop growth. Potassium also increases the number of spikelets per panicle (flowers
per grain bunch) and percentage of filled grain. Another way to interpret this is it is
possible that old farmers are once told to use potassium in their rice field using blanket
recommendation and thus, they just apply potassium fertilizer because they are told to do
so. It does not necessarily mean that more experienced farmers are more aware of the
importance of potassium in the plant.
In the previous discussion, results show that pesticide increases the amount of
nitrogen applied. It follows that pesticide also increases the amount of potassium used
since in most cases, farmers are applying fertilizer in a nitrogen-phosphorus-potassium
(NPK) formulation. These three nutrients are usually the basic components in fertilizer.

23
B. Impacts on paddy yield
The estimated impact of SSNM on yield (kg/ha) using OLS procedure and a two-
stage procedure are shown in columns 3 and 4, respectively, of Table 4. The results from
the two-stage least square regression method indicate that there is a statistically
significant difference between the SSNM adopters’ and SSNM non-adopters’ rice yield
(at the 1 percent level). My mean comparison shows that SSNM adopters have 615 kg/ha
(0.6 ton/ha) more yield. This suggests farmers who adopt SSNM approach tend to
increase their yield level conditional on other factors that affect yield. Without
controlling for endogeneity and selection, the magnitude of impact of SSNM is
underestimated (only 0.14 tons per hectare). This is consistent with the study of Son et
al. (2004), which reports SSNM only increases yield by 0.19 ton per hectare and is not
statistically significant. The instrumental variable heteroskedasticity test reports a Pagan-
Hall general test statistics of 0.949, failing to reject the null hypothesis of
homoskedasticity. Given this, the Sargan test statistic for over-identifying restrictions is
the appropriate test. The Sargan test statistic indicates validity of the chosen instruments.
The three other factors that have positive relationship with yield are access to
credit, good soil dummy and amount of potassium use. When farmers have access to
credit, yield increases by 300 kg/ha. This is because it will be easier for farmers to
procure seeds and fertilizers at the start of the growing season, rent machinery, and hire
labor. Planting in a good soil increases yield by 750 kg/ha. This is not surprising since
alluvial soils are generally rich in mineral nutrients. Yield also increases by
approximately 40 kg/ha when additional kilogram of potassium is used. The SSNM
approach encourages farmers to apply phosphorus and potassium within 14 days after

24
transplanting and apply potassium at panicle initiation stage of the crop growth. Since
potassium plays an important role in increasing the size and weight of the grains, it
follows that yield increases.
One statistically significant factor that has a negative effect on yield is the number
of years of farming experience of farmers. This result is counter-intuitive. More years of
experience is often hypothesized to increase the yield. However, it is also possible
experienced farmers tend to shy away from training opportunities and not willing to
innovate but rather rely on their experience in farming to increase yield. Given this,
younger farmers are more receptive to new information and that they apply nitrogen,
phosphorus, and potassium fertilizer at the right time and thus, they have higher yield
than those more experienced farmers.
C. Impacts on profit
Using the two-stage least square regression, SSNM increases farm profit by
almost $150/ha (Table 4). A large part of this increase results from the positive impact of
SSNM on yield. Compared to the results from the study of Pampolino et al. (2007), this
amount is almost four times larger. This indicates that the method used by Pampolino et
al. (2007) underestimates the impacts of SSNM on profit. The difference in the
magnitude of profitability may significantly affect the decision of farmers to adopt the
SSNM approach. Financial profitability of a technology is a necessary condition for
widespread adoption by farmers.
The Pagan-Hall test statistic of 0.769 suggests failing to reject the
homoskedasticity. The Sargan statistic supports the validity of the instruments used.
Table 4, Column 4 also shows that increasing the amount of phosphorus applied

25
significantly increases profit. Phosphorus helps increase the size and weight of grain.
This increase converts to higher yield and thus, higher profit.
In contrast, the relationship between profit and nitrogen use is negative and
statistically significant. That is, a kilogram increase in the nitrogen use decreases profit
by roughly $6/ha. For farmers in RRD, this is practically a significant amount.
Increasing the amount of nitrogen applied to rice does not necessarily convert to neither
increase profit nor yield. This supports the idea of SSNM, i.e. increasing the amount of
nitrogen applied to crop will not surely increase yield and/or profit but it is important that
the fertilizer is applied at the right time when the plants need it.
Increasing the amount of labor used and ownership of rice farm also has negative
impact on farmer’s profit. A one-manday increase in the labor use decreases profit by
almost $12/ha. Labor in Vietnam are usually hired and in great demand during land
preparation, planting, and harvest season. Interestingly, if a farmer owns a land, his
profit will significantly decrease by almost $130/ha. Additional explanatory variables
capturing wealth effects on farming would have perhaps explain such counter-intuitive
results. Location factors of the land - such as climate and availability or access to
information - can also influence the profitability of farmers.
D. Impacts on pesticide cost
The adoption of SSNM has a negative impact on pesticide cost although it is
statistically insignificant. The negative relationship may indicate SSNM approach makes
rice less attractive to pests because of better nitrogen management. Balanced application
of fertilizer for rice plants improves crop health, hence crop resistance to insects and

26
other diseases, especially those related to nutrient management such as blast, bacterial
blight, stem borer, brown plant hopper (Son, 2006).
Using the OLS regression model, the factors that affect pesticide cost are
potassium use, amount of seed use and labor. Results show that an additional kilogram
increase per hectare of potassium use increases the pesticide cost by $0.05. When over-
applied, fertilizer can increase insect and disease problems. However, the increase in
pesticide cost is minimal and economically insignificant. Meanwhile, as farmer increases
the amount of seed used, the pesticide cost decreases. This is because farmers also treat
seeds from pest. Labor and pesticide cost have negative relationship. Labor and
pesticide can be substitute inputs to control pests. For example, instead of spraying
molluscicide, farmers can just pick up the snails in the farm. Although these variables
are statistically significant, like the increase in pesticide cost, the numbers are not
practically significant. When endogeneity is controlled for, no explanatory variable is
found to have a significant relationship on pesticide cost (Table 4, Column 7). This may
indicate that pesticide, as an input, is no longer constraint to paddy yield.
E. Impact on nitrogen use
The impact of SSNM adoption on nitrogen use is presented in Table 5. Using the
OLS procedure (Column 2), SSNM adoption has a negative effect on the level of
nitrogen use of farmers although this is not statistically significant. Even when
endogeneity and selection problems are accounted for (Column 3), this relationship
between SSNM adoption and nitrogen use still holds true. This result suggests that SSNM
neither reduces or increases the nitrogen use of farmer but rather it makes farmers to
apply nitrogen at optimal rates and times in order to achieve high rice yield and high

27
efficiency of nitrogen use by rice. This result is in contrast with the findings reported by
Pampolina et al. (2007), which shows SSNM significantly reduces the nitrogen
application of farmers.
To check for the presence of heteroskedasticity, a Pagan-Hall test statistic is
computed that gives a value of 4.845 and is not significant. Thus, I fail to reject the null
hypothesis of homoskedasticity. Given this result, the Sargan statistic is presented with a
value of 0.69 with a p-value of 0.40, indicating the instruments used in the analysis are
valid. Similar to the results in the first stage regression, educational level is statistically
significant factor that affect the nitrogen use of farmers.
VI. Conclusion and Policy Implications
This study estimates the impact of the adoption of SSNM practices using cross-
section household data gathered from the provinces of Ha Nam and Ha Tay in RRD,
Vietnam. I use the instrumental variable approach to control for endogeneity and
selection bias. In general, my results suggest that SSNM does have a positive impact; it
increases farmers’ yields and profits. SSNM improved the paddy yield of farmer by 0.6
ton/ha, and the profit by approximately $150/ha. It is important to note, however, that
higher profits attributed to SSNM arise from increased grain yield rather from reducing
fertilizer and pesticide costs. It appears that SSNM farmers improved their fertilizer
management and increase fertilizer nitrogen efficiency. Results suggest that increasing
the amount of fertilizer use, particularly nitrogen, does not guarantee increase yield and
profit but what important is that essential nutrients, such as nitrogen, phosphorus, and
potassium are applied to crops when they are needed. The implication of this result for
my study area is that SSNM approach can help address the excessive use of chemical

28
fertilizer in the area, especially nitrogen (and perhaps for most major rice producing
regions in Asia) because nitrogen use can potentially be reduced without the adverse
effect of lowering rice producers’ yield and profit. On average, rice producers who adopt
SSNM can help reduce nitrogen runoff and gaseous nitrogen losses into the environment.
Results of the study also show that attendance in SSNM training and knowledge
on the use of LCC are important factors that positively impact the likelihood of SSNM
adoption. Extension programs that provide specific information regarding SSNM and the
manufacture and distribution of LCCs can potentially encourage further adoption of this
nutrient management technique. Therefore, benefits of SSNM to environment and to
farmers can be realized if SSNM technology will be approved by the Scientific
Committee of MARD. This is a key factor for the sustainable widespread diffusion of
SSNM technology on a larger scale. Once it is approved, funds will be available and the
technology can then be officially disseminated through the wide network of extension
systems, which is important for the technology diffusion.
A challenge ahead is limited capability of extension staff, especially at grass root
level. The dissemination of SSNM starts with the training of researchers, local extension
workers, fertilizer retailers, and farmer leaders on techniques and guidelines for enabling
rice farmers to use effective nitrogen management practices for their specific rice-
growing conditions. SSNM requires good understanding and motivation of the extension
staff. Different rice areas, different farmers/farmers-groups require different SSNM
recommendation. To address this issue, the Nutrient Manager for Rice, a decision
software, can facilitate extension workers and technical staff in guiding farmers with
SSNM. This software gives comprehensive fertilizer guideline that is tailored to specific

29
conditions in rice fields. With this software installed in computer, technical staff only
needs to ask farmers several simple questions about their rice production then a printable
SSNM recommendation paper can be provided for farmers. Therefore, in this regard,
there is a need to build capacity of extension workers and technical staff, especially
computer skill and managing the software upon its release.
Lastly, previous recommendations of SSNM on fertilizer application have not
taken into account other sources of nutrient such as farmyard manure, crop residues
carried over, and quality of (i.e. water from Red river have higher content of sediments
which provide nutrient for crop). Future development of SSNM as well as Nutrient
Manager for Rice should consider these sources of nutrient supply.

30
VI. References
Akinola, A.A., Arega, D.A., Adeyemo, R., Sanogo, D, Olanrewaju, A.S, Nwoke, C., Nzigaheba, G. and Diels, J., (2008). Determinants of adoption and intensity of use of balanced nutrient management systems technologies in the northern Guinea savanna of Nigeria, No 52007, 2007 Second International Conference, August 20-22, 2007, Accra, Ghana, African Association of Agricultural Economists (AAAE).
Alam, M. M. 2005. Leaf color chart for managing nitrogen fertilizer in lowland rice in
Bangladesh. Agronomy Journal 97, (3): 949-59. Angrist, Joshua D., Guido W. Imbens, and Donald B. Rubin. 1996. Identification of
causal effects using instrumental variables. Journal of the American Statistical Association 91, (434) (Jun.): 444-55.
Balasubramanian, V. 1999. Farmer adoption of improved nitrogen management
technologies in rice farming: Technical constraints and opportunities for improvement. Nutrient Cycling in Agroecosystems 53, (1): 93-101.
Bouman, B.A.M., Humphreys, E., Tuong, T.P., Barker, R., 2006. Rice and water.
Advances in Agronomy 92, 187 – 237. Buresh, R.J., Witt, C., Ramanathan, S., Chandrasekaran, B., Rajendran, R., 2005. Site-
specific nutrient management: managing N, P, and K for rice. Fert. News 50 (3), 25–28, 31–37.
Buresh, RJ. 2006. Site-specific Nutrient Management. International Rice Research
Institute, Los Baños, Philippines. Burrows, Thomas M. 1983. Pesticide demand and integrated pest management: A limited
dependent variable analysis. American Journal of Agricultural Economics 65, (4) (Nov.): 806-10.
Clayton, Sophie. 2010. “50 years of rice science for a better world – and it’s just the
start!” Rice Today, IRRI. Dai, Do Dinh, Nguyen Thi Ha, Vu Xuan Thanh. 2005. Food security and reasonable use
of rice land in Vietnam. In " Agricultural Technology and Science and Rural Development, 20 years of renovation" Vol 3. Vietnam National Political Publisher, pp 147-167.
Doberman, A. 2002. Site-specific nutrient management for intensive rice cropping
systems in Asia. Field Crops Research 74, (1): 37-66. Doss, Cheryl R. 2006. Analyzing technology adoption using microstudies: Limitations,
challenges, and opportunities for improvement.(author abstract). Vol. 34.
31
Duflo, Esther, Michael Kremer, and Jonathan Robinson (2005). “Understanding Fertilizer Adoption: Evidence from Field Experiments,” Mimeo, MIT.
Feder, G. 1985. Adoption of agricultural innovations in developing countries: A survey.
Economic Development and Cultural Change 33, (2): 255-98. ———. 1993. The adoption of agricultural innovations. A review. Technological
Forecasting and Social Change 43, (3-4): 215-39. Fox, Jennifer E., Jay Gulledge, Erika Engelhaupt, Matthew E. Burow, and John A.
McLachlan. 2007. Pesticides reduce symbiotic efficiency of nitrogen-fixing rhizobia and host plants. Proceedings of the National Academy of Sciences of the United States of America 104, (24) (06/12): 10282-7.
GRILICHES, Z. 1957. HYBRID CORN - AN EXPLORATION IN THE ECONOMICS
OF TECHNOLOGICAL-CHANGE. Econometrica 25, (4): 501-22. Heckman, James J. 1979. Sample selection bias as a specification error. Econometrica
47, (1) (Jan.): 153-61. ———. 1978. Dummy endogenous variables in a simultaneous equation system.
Econometrica 46, (4) (Jul.): 931-59. Heckman, James J., and Edward Vytlacil. 2005. Structural equations, treatment effects,
and econometric policy evaluation. Econometrica 73, (3) (May): 669-738. Heffer, P. 2008. Assessment of Fertilizer Use by Crop at the Global Level. International
Fertilizer Industry Association. Paris, France. Hien, Bui Huy. 2005. Results on crop nutrition and efficient use of fertilizer during
Renovation period and plan for 2006-2010. In “Agricultural Technology and Science and Rural Development, 20 years of rennovation”. Vol 3. Vietnam National Political Publisher, pp 245-264.
Imbens, G. 2004. Nonparametric estimation of average treatment effects under
exogeneity: A review. The Review of Economics and Statistics 86, (1): 4-29. IMBENS, G., and J. ANGRIST. 1994. IDENTIFICATION AND ESTIMATION OF
LOCAL AVERAGE TREATMENT EFFECTS. Econometrica 62, (2): 467-75. International Rice Research Institute (IRRI). 2006. Site-specific nutrient management.
Available from:http://www.irrri.org/irrc/ssnm/. Accessed 22 January, 2010. Khurana, H. S. 2007. Performance of site-specific nutrient management for irrigated,
transplanted rice in northwest India. Agronomy Journal 99, (6): 1436-47.

32
Mendola, M., and Mendola. 2007. Agricultural technology adoption and poverty reduction: A propensity-score matching analysis for rural Bangladesh. Food Policy 32, (3): 372-93.
Ouma, James O., Festus M. Murithi, Wilfred Mwangi, Hugo Verkuijl, Macharia Gethi,
and Hugo De Groote. Adoption of Maize Seed and Fertilizer Technologies in Embu District, Kenya. Mexico: CIMMYT, 2002.
Pampolino, M. F., I. J. Manguiat, S. Ramanathan, H. C. Gines, P. S. Tan, T. T. N. Chi, R.
Rajendran, and R. J. Buresh. 2007. Environmental impact and economic benefits of site-specific nutrient management (SSNM) in irrigated rice systems. Agricultural Systems 93, (1-3) (3): 1-24.
Potera, Carol. 2007. Pesticides disrupt nitrogen fixation. Environmental Health
Perspectives 115, (12) (12): A579. Reetz, H.F. Jr. and P.E. Fixen. 2000. Strategic approach to site-specific systems. In: Site-
specific Management Guidelines Series. Potash and Phosphate Institute (PPI), SSMG-28.
ROSENBAUM, P., and D. RUBIN. 1983. THE CENTRAL ROLE OF THE
PROPENSITY SCORE IN OBSERVATIONAL STUDIES FOR CAUSAL EFFECTS. Biometrika 70, (1): 41-55.
Son, Tran Thuc. 2006. Combining nutrition management and IPM is the key to reduce
fertilizer, pesticides, to increase crop yield, quality, and to improve rice farmers' income. Paper presented at the workshop “Three reductions, three gains in rice”. Vinh Phuc province.
Son, Tran Thuc, Nguyen Van Chien, Vu Thi Kim Thoa, A. Dobermann, and C. Witt.
2004. Site-specific nutrient management in irrigated rice systems of the Red River Delta of Vietnam.
UNEP. 2005. Integrated Assessment of the Impact of Trade Liberalization. A Country
Study on the Viet Nam Rice Sector. Wang, Shaohua, Yan Zhu, Haidong Jiang, and Weixing Cao. 2006. Positional differences
in nitrogen and sugar concentrations of upper leaves relate to plant N status in rice under different N rates. Field Crops Research 96, (2-3) (4/30): 224-34.
Yang, W. H. 2003. Using leaf color charts to estimate leaf nitrogen status of rice.
Agronomy Journal 95, (1): 212-7.

33
Table 1. Variable definitions Variable name Definition
Independent SSNM Educ Farm_yrs Male Married Province Own Land HHsize Goodsoil Training Labor Seed Credit Nitrogen Phosphorus Potassium LCC
Dependent
Pesticide use Nitrogen use Yield Profits
=1 if adopt SSNM; =0 otherwise Years of education for household head Years of farming experience =1 if male; =0 otherwise =1 if married; =0 otherwise =1 if Ha Nam province; =0 if Ha Tay province =1 if own land; =0 otherwise Number of household members =1 if good soil; =0 otherwise =1 if attended SSNM training before; =0 otherwise Total labor used in production (manday per hectare) Total seed used in production (kg/ha) =1 if fertilizer payment by credit; =0 otherwise Fertilizer N use (kg/ha) Fertilizer P use (kg/ha) Fertilizer K use (kg/ha) =1 if seen LCC; =0 otherwise Total cost of pesticide use ($/ha) Total amount of fertilizer N use Paddy yield in kg/ha Profits (income less variable costs)

34
Table 2. Summary statistics: Full sample
Variable SSNM Adopter
(n=228) non-SSNM adopter
(n=144)
Mean Std. Mean Std.
Hhsize (number) 3.917 1.283 3.806 1.334
Male Dummy 0.149 0.357 0.160 0.368
Married Dummy 2.110 0.638 2.056 0.350
Training Dummy 0.575 0.495 0.063 0.243
Farm_yrs (years) 27.355 11.500 26.410 11.078
Educ (years) 9.259 12.094 8.590 8.308
Good soil Dummy 0.956 0.205 0.931 0.255
Credit Dummy 0.307 0.462 0.431 0.497
Own_Land Dummy 0.908 0.289 0.839 0.369
Profit ($/ha) 568.885 299.676 499.007 296.732
Yield (tons/ha) 5.58 848.123 5.28 938.392
Pestcost ($/ha) 18.873 12.266 21.735 12.989
Nitrogen(kg/ha) 79.072 24.346 83.310 27.949
Phosphorus(kg/ha) 22.200 11.806 19.300 11.582
Potassium(kg/ha) 60.278 28.534 65.315 27.639
Seed(kg/ha) 41.573 17.976 45.731 20.821
Labor(manday/ha) 14.589 12.200 12.999 10.950

35
Table 3. First stage model results on SSNM adoption and nitrogen, phosphorus and potassium use (n=371)
VARIABLE SSNM adoption Nitrogen use (kg/ha)
Phosphorus use (kg/ha)
Potassium use (kg/ha)
(1) (2) (3) (4) (5)Married Dummy 0.03 -3.87 -0.76 4.39
[0.0948] [5.918] [2.696] [6.210]Training Dummy 0.347*** 8.578*** 0.56 3.56
[0.0518] [3.233] [1.473] [3.393]LCC Dummy 0.302*** -14.01*** -1.20 -6.697*
[0.0547] [3.416] [1.556] [3.585]Credit Dummy -0.05 -1.72 -2.727** -7.631***
[0.0447] [2.794] [1.273] [2.933]Province Dummy 0.01 -9.632*** -5.187*** -18.60***
[0.0477] [2.979] [1.357] [3.126]Hhsize (number) 0.01 -0.91 -0.80 -0.99
[0.0179] [1.119] [0.510] [1.174]Male Dummy 0.03 -2.29 -3.21 -0.65
[0.0770] [4.811] [2.191] [5.049]Farm_yrs (years) 0.00 0.10 0.04 0.281**
[0.00198] [0.124] [0.0563] [0.130]Educ (years) 0.00 -0.216* 0.01 -0.01
[0.00201] [0.126] [0.0573] [0.132]Good soil Dummy 0.06 2.48 3.07 -8.18
[0.0938] [5.858] [2.669] [6.148]Seed (kg/ha) -0.00208* -0.04 -0.0796** 0.05
[0.00113] [0.0704] [0.0321] [0.0739]Labor (manday/ha) 0.00 0.03 0.00 0.09
[0.00195] [0.122] [0.0554] [0.128]Own_Land Dummy 0.04 1.61 1.91 -2.58
[0.0669] [4.175] [1.902] [4.382]Pesticide cost ($/ha) 0.00 0.200* -0.03 0.276**
[0.00170] [0.106] [0.0484] [0.112]Constant 0.373** 87.13*** 26.81*** 67.17***
[0.174] [10.88] [4.955] [11.42]R-squared 0.35 0.10 0.10 0.17Akaike Information Criteria 390.44 3458.10 2874.68 3493.92Bayesian Information Criteria 449.18 3516.84 2933.42 3552.66
*,**,*** imply significance at 90%,95%, and 99% confidence intervalsRobust standard errors in brackets

36
Table 4. Impacts of SSNM on yield, profit, and pesticide use (n=371)
VARIABLE
One-Stage (OLS) Impact Model
Two-stage Impact Model
One-Stage (OLS) Impact Model
Two-stage Impact Model
One-Stage (OLS) Impact Model
Two-stage Impact Model
(1) (2) (3) (4) (5) (6) (7)SSNM 143.10 615.2*** 42.97 145.4*** -1.98 -4.18
[105.9] [166.5] [35.24] [55.25] [1.653] [2.616]Credit Dummy 9.20 303.0*** 8.75 52.54 1.75 2.45
[89.87] [103.6] [29.92] [34.37] [1.403] [1.658]Hhsize -45.32 -39.81 -10.71 4.04 0.82 0.64
[35.47] [40.90] [11.81] [13.57] [0.553] [0.666]Farm_yrs (year) -0.76 -10.98** -1.10 -0.42 0.03 0.00
[3.934] [4.453] [1.310] [1.477] [0.0615] [0.0694]Educ (year) 5.47 3.22 1.93 0.40 0.02 0.00
[3.992] [4.440] [1.329] [1.473] [0.0624] [0.0693]Good soil Dummy 483.7*** 751.5** 94.45 -65.51 2.53 4.19
[185.7] [346.1] [61.80] [114.8] [2.901] [5.143]Nitrogen (kg/ha) 1.26 -9.08 -1.283** -5.781* 0.04 -0.02
[1.831] [9.632] [0.609] [3.195] [0.0286] [0.150]Phosphorus (kg/ha) 3.57 10.58 -1.43 34.50** -0.04 -0.10
[3.926] [49.61] [1.307] [16.46] [0.0614] [0.770]Potassium (kg/ha) 3.572** 41.45** 0.77 -5.67 0.0470* 0.22
[1.662] [16.42] [0.553] [5.447] [0.0259] [0.240]Seed (kg/ha) -1.17 -0.99 -1.387* 1.88 -0.0895** -0.10
[2.249] [5.253] [0.749] [1.743] [0.0349] [0.0752]Labor (manday/ha) -2.53 -5.39 -11.97*** -11.21*** -0.0995* -0.10
[3.841] [4.211] [1.278] [1.397] [0.0598] [0.0631]Own_Land Dummy 211.70 302.80 -50.32 -131.2** 3.18 3.89
[132.0] [192.2] [43.94] [63.75] [2.058] [2.787]Pesticide cost ($/ha) 2.97 -3.44 -1.20 2.75
[3.403] [6.438] [1.133] [2.136]Constant 4,767*** 2,538*** 919.5*** 716.3*** 14.72** 7.74
[389.1] [712.8] [129.5] [236.4] [6.036] [10.98]R-squared 0.26 0.23 0.27 0.25 0.08 0.05Underidentification test 1.27a 1.27a 1.96b
Chi-sq(2) P-val 0.53 0.53 0.38Overidentification test 1.85c 0.15c 1.37d
Chi-sq(1) P-val 0.17 0.70 0.24
cSargan statisticdHansen J statistic
*,**,*** imply significance at 90%,95%, and 99% confidence intervalsRobust standard errors in brackets
YIELD (kg/ha) PROFIT ($/ha) PESTICIDE COST ($/ha)
aAnderson canonical correlation LM statisticbKleibergen-Paap rk LM statistic

37
Table 5. Impacts of SSNM on nitrogen use (n=371)
VARIABLES One-Stage (OLS) Impact Model
Two-stage Impact Model
(1) (2) (3) SSNM -4.42 -38.84 [3.069] [52.37] Training Dummy 8.863*** 20.47 [3.160] [18.52] LCC Dummy -10.23*** 0.89 [3.280] [16.35] Hhsize (number) -0.06 -0.40 [1.031] [1.289] Farm_yrs (years) 0.00 0.01 [0.114] [0.148] Educ (years) -0.225* -0.257** [0.115] [0.129] Good soil Dummy 2.46 7.19 [5.397] [11.15] Phosphorus (kg/ha) 0.726*** 0.24 [0.107] [1.530] Potassium (kg/ha) 0.237*** 0.40 [0.0466] [0.482] Seed (kg/ha) -0.01 -0.11 [0.0654] [0.198] Labor (manday/ha) 0.01 0.01 [0.112] [0.131] Own_Land Dummy 1.01 3.81 [3.838] [6.358] Pesticide cost ($/ha) 0.14 -0.01 [0.0986] [0.266] Constant 53.43*** 64.88*** [10.95] [23.00] R-squared 0.25 0.09 Underidentification test 1.172a Chi-‐‑sq(2) P-‐‑val 0.56
Overidentification test 0.695b Chi-‐‑sq(1) P-‐‑val 0.40
aAnderson canonical correlation LM statistic bSargan statistic Robust standard errors in brackets *,**,*** imply significance at 90%,95%, and 99% confidence intervals

38
Figure 1. Maps showing the provinces where SSNM was evaluated and promoted in RRD, North Vietnam.
Source: http://www.irri.org/irrc/ssnm/country%20sites/vietnam/North%20Vietnam.asp