sip report_surabhi narad_hdfc bank
DESCRIPTION
ready to printTRANSCRIPT
A REPORT
ON
CORPORATE FINANCIAL ANALYSIS
COMPANY GUIDE FACULTY GUIDEMR.SANJIV BHUYAN DR.BHARATHI KAMATHDEPUTY VICE PRESIDENT ICFAI B-SCHOOLCORPORATE BANKING MUMBAI
SUBMITTED BY SURABHI NARAD
06BS2966

ACKNOWLEDGMENTS
No significant achievement can be solo performance especially when starting a project from ground up; this is true with the project called “CORPORATE FINANCIAL ANALYSIS” also.
Mr. Sanjiv Bhuyan, has been very supportive and involved in this project. It was his support that helped the project to start in its earliest and most vulnerable stages. I would like to extend my gratitude towards him as he took out time from his extremely busy schedule, for guiding and helping me during this project.
I would like to thank Mr. Rajeev Bhide, who helped me with his valuable suggestions irrespective of his health problem.
This project could not have taken its present shape without the proper direction shown by Dr.Bharathi Kamath.
My sincere thanks to all at HDFC BANK, who directly and indirectly helped me to carry forward this project.

TABLE OF CONTENTS
Executive Summary.............................................................................1
Introduction..........................................................................................2
About the company..............................................................................3 Objective and flow of the project........................................................4 Analysis of Chemical industry............................................................5 Analysis of Power equipment industry..............................................37
Analysis of Auto ancillary industry...................................................62
Analysis of Textile industry..............................................................86
Analysis of Food processing industry.............................................114
Conclusion.......................................................................................140
Value additions from the project.....................................................141
References.......................................................................................142

EXECUTIVE SUMMARY
This is a project which is being done for HDFC CORPORATE BANK. The aim of this project is to identify those companies which can be potential clients for HDFC's business.These companies belong to five industries (industries have been decided by Mr.Sanjiv Bhuyan, the company guide) in India.
HDFC Bank's aim behind bringing this project on floor is that it wanted to have more volume of business with less number of clients. It is more useful to do business with few big clients rather than dealing with various small clients. Because the ultimate aim of any business is increasing profit and reducing cost. With the above aim in mind HDFC Bank will achieve both.
This project deals with following five industries:
Chemical Industry Power Equipment Industry Auto Ancillary Industry Textile industry Food Processing Industry
The first step is to do analysis of the industry. By analysis of the industry one gets a good and in depth understanding of that particular industry. For e.g. It helps in analyzing whether the industry requires large investment or has large working capital requirement. Industry analysis clearly shows investment opportunities present in the industry and the risks associated with it.
This is useful in analyzing global scenario of the industry and its impact on the Indian industry. This also helps in identifying the major competitors present in the market and to study their strategies and moves. All this is similar to equip yourself properly before you enter the battle field so that the chances of victory increases.
Then, the second step is to find databases containing all companies present in Indian in that particular industry .
Third step is to sort out companies in western India with a turnover of more than Rs. 300 crores. And then financial analysis of each firm is done.
In fourth and the last step is to understand all the products provided by HDFC Corporate Bank. Then decide which product will be best suited to which firm in above mentioned industries.
1

INTRODUCTION
BANK: STRUCTURE AND FUNCTIONS
A bank is a business which provides financial services for profit. Traditional banking services include receiving deposits of money, lending money and processing transactions. Traditionally, a bank generates profits from transaction fees on financial services and from the interest it charges for lending. Much of a bank's income is provided by overdraft fees and riskier investments.
Banks' activities can be divided into retail banking, dealing directly with individuals and small businesses, and investment banking, relating to activities on the financial markets.
Banks have a long history, and have influenced economies and politics for centuries.
A bank raises funds by attracting deposits, borrowing money in the inter-bank market, or issuing financial instruments in the money market or a capital market. The bank then lends out most of these funds to borrowers. However, it would not be prudent for a bank to lend out all of its balance sheet. It must keep a certain proportion of its funds in reserve so that it can repay depositors who withdraw their deposits. Bank reserves are typically kept in the form of a deposit with a central bank. This behavior is called fractional-reserve banking and it is a central issue of monetary policy.
Banks are susceptible to risks which include liquidity risk (the risk that many depositors will request withdrawals beyond available funds), credit risk (the risk that those that owe money to the bank will not repay), and interest rate risk (the risk that the bank will become unprofitable.
Banks, especially commercial banks play a crucial role in accelerating the tempo of growth in a developing economy. Therefore, there must be a central governing body which may run the system smoothly and economy of the country keeps on rolling. Such a body is known as CENTRAL BANK of the country.
A central bank or reserve bank is an entity responsible for the monetary policy of its country. It has supervisory powers to ensure that banks and other financial institutions do not behave recklessly or fraudulently. A central bank is usually state-owned and headed by a Governor.
“THE RESERVE BANK OF INDIA” is the central bank of the country entrusted with monetary stability, the management of currency and the supervision of the financial as well as the payments system.
The Bank was constituted to
Regulate the issue of banknotes. Maintain reserves with a view to securing monetary stability To operate the credit and currency system of the country to its advantage.
2
ABOUT THE COMPANY
HDFC Bank was incorporated in August 1994 in the name of 'HDFC Bank Limited', with its registered office in Mumbai, India. The Bank commenced operations as a Scheduled Commercial Bank in January 1995.
Headquartered in Mumbai, HDFC Bank, has a network of around 650 branches spread over 270 cities across India. All branches are linked on an on line real-time basis. Customers in over 120 locations are serviced through Telephone Banking. The Bank also has a network of about over 1050 networked ATMs across these cities.
HDFC offers various services, some of them are Branch Banking, Retail Assets, Product Development, Operations, Marketing, Treasury, Equities, Corporate Banking, Cash Management Services, Custody and Depositories etc.
HDFC IN CORPORATE BANKING
Corporate Banking is a part of wholesale banking. Corporate Banking reflects HDFC Bank's services to their corporate clients in India, a wide array of commercial, transactional and electronic banking products. They achieve this through innovative product development and a well-integrated approach to relationship management. HDFC offers top companies in the India, a full range of client-focused corporate banking services, including working capital finance, trade and transactional services, foreign exchange and cash management, to name a few. The product offerings are suitably structured taking into account a client's risk profile and specific needs. Based on their superior product delivery, industry benchmark service levels and strong customer orientation, they have made significant inroads into the formal banking consortia of a number of Indian companies including multinationals, domestic business houses and prime public sector companies.
3
OBJECTIVE AND FLOW OF THE PROJECT
Basically the project is all about to identify those companies, in five industries, which can be potential clients for HDFC's business.
In this project, I have to deal with following five industries, namely:
Chemical Industry Power Equipment Industry Auto Ancillary Industry Textile industry Food Processing Industry
The flow of the project will be the same as explained in following few paragraphs.The first and the foremost step is to do analysis of the industry. Through this analysis following things become clear about the particular industry:
Characteristics of the industry. Growth drivers of the industry. Risk factors involved in the industry. Major players in the industry. Whether the industry requires large investment or has large working capital
requirement. Investment opportunities present in the industry.
Through industry analysis one can understand Requirements of the industry. Dynamics of the industry. Major competitors present in the market and their strategies.
After this search of databases begins, here aim is to find as many companies present in the industry as possible. Then financial analysis of each firm is done. Firstly, from the balance sheet of the company, its turnover is checked. If turnover is less than Rs. 300 Crs, that company is removed from the list. Secondly, profitability and Net worth of the company is calculated.
After this, study of all the products provided by HDFC Corporate Bank will be done thoroughly so that those products can be sorted out which fit into that particular industry and accordingly marketed to the potential clients.
The study of all the five industries will follow the same flow as explained above.
4

ANALYSIS
OF THE
CHEMICAL INDUSTRY
5
INDIAN CHEMICAL INDUSTRY
India is one of the fastest growing economies in the world, making rapid progress since 1991. The country has undertaken far-reaching economic reforms of deregulation and liberalization as well as financial and corporate restructuring, which have enhanced economic growth rates considerably.
Chemical industry is one of the oldest industries in India. It not only plays a crucial role in meeting the daily needs of the common man, but also contributes significantly towards industrial and economic growth of the nation. The industry, including petro-chemicals, and alcohol-based chemicals, has grown at a pace outperforming the overall growth of the industry.
The global chemical market is estimated at approximately USD 1.7 trillion. Western Europe is the largest chemical-producing region followed by North America and Asia.
The Indian chemicals and materials industry is the second largest industrial sector in the country,behind information technology (IT). The chemicals, materials, and foods (CMF) industry is one of the oldest in India, contributing significantly to its industrial and economic growth. India ranks 12th in the world and third in Asia in the production of chemicals and materials and is poised to become a major venue for out souring chemical manufacturing.
The current economy and the general economic policies have stimulated various segments of the Indian CMF industry and its industry-specific policies have facilitated its development. The Indian CMF industry is mainly demand-driven and increasing foreign and industrial investments drive the industry further. Trends in investment, exports, and imports have also greatly influenced the CMF industry.
Chemicals, Materials, and Foods Country Industry Forecast service provides vital inputs for evaluating the attractiveness of a country and its CMF industry. Besides enabling decision makers to assess the impact of non-market forces, it also helps in identifying new market opportunities. This service provides a strong base for preparing contingency plans. In addition, investors can assess industry-specific risk factors as well as conduct a more in-depth micro research.
The Indian Chemicals Industry comprises both small and large scale units. The fiscal concessions granted to small sector in mid-eighties led to establishment of large number of units in the Small Scale Industry (SSI) sector. Currently, the Indian Chemical Industry is in the midst of major restructuring and consolidation phase. With the shift in emphasis on product innovation, brand building and environmental friendliness, this industry is increasingly moving towards greater customer-orientation. Even though India enjoys an abundant supply of basic raw materials, it will have to build upon technical services and marketing capabilities to face global competition and increase its share of exports.
The Indian Chemical Industry ranks 12th by volume in the world production of chemicals. The industry’s current turnover is about USD 30.8 billion which is 14% of the

total manufacturing output of the country. The export of chemicals in the year 2002 was USD 5.875 billion, which forms almost 0.9 % of the world export of chemical products and about 13% of the country’s total export. Substantial proportion of these exports goes to the USA, Europe and other developed nations. Its contribution to the national revenue by way of custom and excise duties is about 20%. India is strong in basic chemicals that go into production of consumer items like paints, dyes, soaps, medicines, toiletries, cosmetics, etc.
The chemical, petrochemical and pharmaceutical industry in India is one of the fastest growing segments of the industrial sector with an annual growth rate of 12.5% per year for the last 10 years. It accounts for 12.5% of India's industrial production and 16.2% of the country's exports of manufactured goods. This rate of growth has been consistently high as the country has one of the largest resources of scientific and technical manpower in the world with the capacity to absorb, upgrade and develop high technology. India also has excellent engineering and project management skills.
CHEMICAL INDUSTRY STRUCTURE IN INDIA

Source: KPMG Survey of the Indian chemical industry, 2002
Highly fragmented and widely dispersed. Wide product range – basic, speciality and knowledge segments. Basic comprising of petrochemicals, inorganic chemicals and fertilizers is the largest segment.
Output 2% of the world total output --- USD 30 billion. Petrochemicals --- usd 7 billion (22% of India's total chemical output). Industry growth rate is approx. 5% during the last 5 years. Profit margin- 14%. Western India accounts for 45-50% of total Indian chemical Industry. Gujarat, Maharastra , West Bengal and Andhra Pradesh has the largest
concentration of chemical and petro chemical industries. Large players in bulk chemicals. Both large and small players in Fine and
Speciality chemicals. Presence of many multinational companies also.
Factors Responsible for Limiting the Growth of Chemical Industry
Indian manufacturers compare favourably in terms of key manufacturing conversion costs with the best in the world.
High Power Cost (Utility costs are higher) Inefficient Process Technology
Basic Feed Stock Prices are High Cascading Effects of various Taxes and Duties Stringent labour Laws Uneconomic Size of plants (due to erstwhile licensing system) High Cost of Finance (Interest rates are high) Inadequate infrastructure Facility (Road, Rail and Ports) International Competition (Dumping) Drastic Reduction in Import Duties (unable to compete in global scenario)
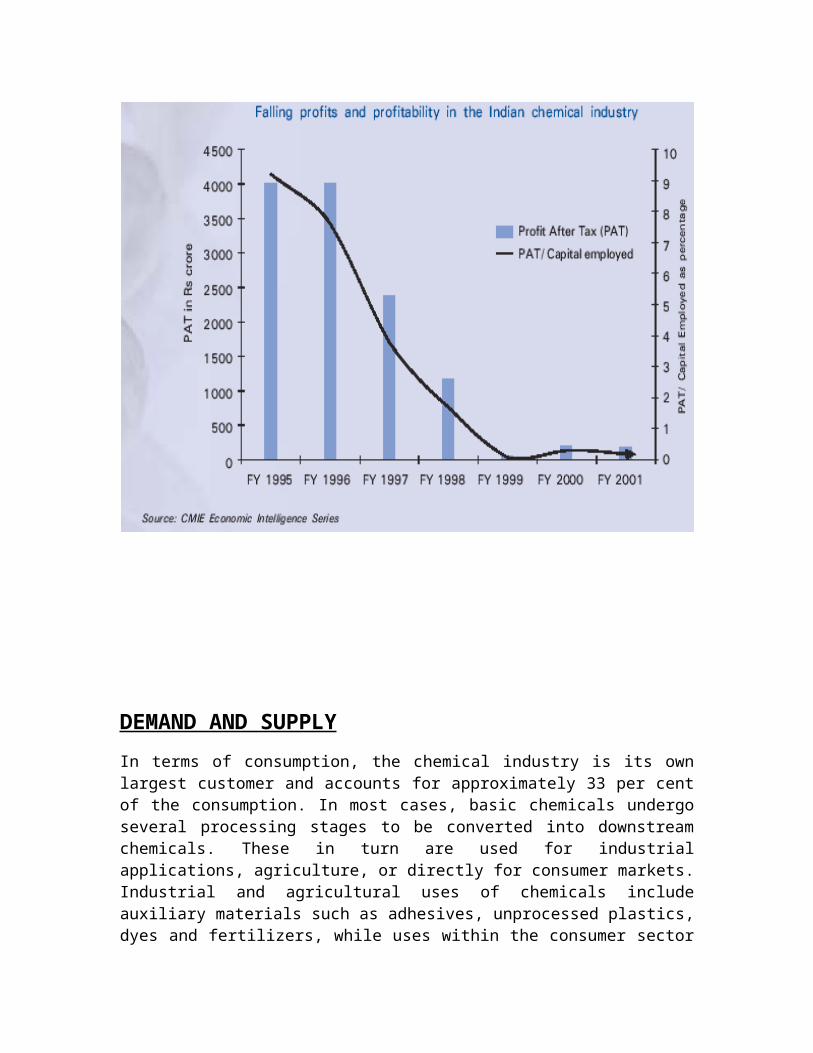
Source – CMIE
Above weaknesses are the reason of the declining profitability of the Indian chemical industry. Following statistic substantiates the above made statement.

DEMAND AND SUPPLY
In terms of consumption, the chemical industry is its own largest customer and accounts for approximately 33 per cent of the consumption. In most cases, basic chemicals undergo several processing stages to be converted into downstream chemicals. These in turn are used for industrial applications, agriculture, or directly for consumer markets. Industrial and agricultural uses of chemicals include auxiliary materials such as adhesives, unprocessed plastics, dyes and fertilizers, while uses within the consumer sector include pharmaceuticals, cosmetics, household products, paints, etc.
INDIAN DEMAND AND SUPPLY SCENARIO
The Indian chemical industry manufacturers a wide spectrum of products spanning the Basic, Speciality and Knowledge segments.
At 57 percent , Basic chemicals comprise the largest segment of the Indian chemical industry. The composition of the industry, however , is shifting in favour of Speciality and Knowledge chemicals.
GLOBAL CHEMICAL MARKET AND THE CURRENT TREND
Source: KPMG survey of the Indian chemical industry, 2002
GLOBAL CHEMICAL INDUSTRY
Globally, the Basic segment accounts for about 52 percent of the industry, Speciality 20 percent and Knowledge 28 percent.
Source: Department of chemicals & petrochemicals, GOI
Knowledge is the fastest growing segment – growing at more than six times the growth rate of Basic. Speciality has a growth rate faster than Basic, but lags behind the Knowledge segment as shown in the following figure.

Cost structure of the three segments highlight distinct characteristics. Basic has high feedstock and other raw material costs, whereas speciality has very high selling and product development costs. Knowledge segment, on the other hand is characterised by large spends on advertising and R&D. Basic is the most mature segment with the lowest profitability , while knowledge chemicals have the highest profitability and growth projections.

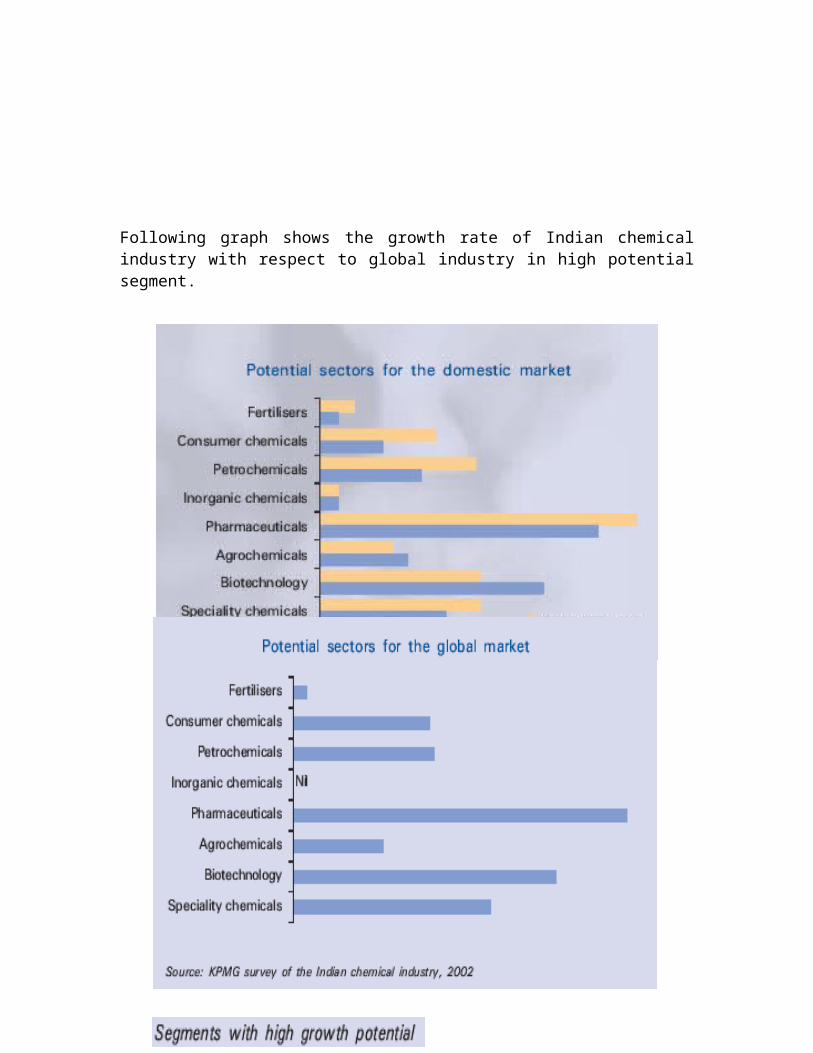
Following graph shows the growth rate of Indian chemical industry with respect to global industry in high potential segment.

SEGMENTAL ANALYSIS
Highly heterogeneous, the chemical industry in India encompasses many sectors like organic, inorganic chemicals, dyestuffs, paints, pesticides, specialty chemicals, etc. Some of its more prominent individual chemical industries are caustic soda, soda ash, carbon black, phenol, acetic acid, methanol and azo dyes. Broadly, the chemical industry in India is classified into polymerization products, basic chemicals, fine chemicals and pharmaceuticals. It accounts for more than 10% of the country's total export earnings.
India also produces a large number of fine and speciality chemicals, which have very specific uses and are essential for increasing industrial production. These find wide usage as food additives, pigments, polymer additives, anti-oxidants in the rubber industry, etc. Some of the important manufacturers of speciality chemicals include NOCIL, Bayer (India), ICI (India), Hico Products and Colourchem.
The Dyestuff sector is one of the important segments of the chemicals industry in India, having forward and backward linkages with a variety of sectors like textiles, leather, paper, plastics, printing ink and foodstuffs.India has emerged as a global supplier of dyestuff and dyes intermediates, particularly for reactive, acid, vat and direct dyes. As for a global production of dyes is concerned, India accounts for 6% of the world production.
Chemical fertilizers and pesticides played an important role in the "Green Revolution" during the 1960s and 1970s. The consumption of pesticides in India is low in comparison to other countries. Indian exports of agrochemicals have shown an impressive growth over the last five years.
The key export destination markets are USA, UK, France, Netherlands, Belgium, Spain, South Africa, Bangladesh, Malaysia and Singapore.
Chemical industry is broadly segmented into :
u Petrochemicals u Inorganic Chemicals u Organic Chemicals u Fine and specialties u Bulk Drugs u Agrochemicals u Paints and Dyes

Source:Department of chemicals & petrochemicals, GOI
INDIAN PETROCHEMICALS
✔ Domestic market size – US$700 million✔ Fastest growing sector at 15%✔ Reliance – key player in this market
INORGANIC CHEMICALS✔ Market size – US$260 million✔ Growth rate – 9%✔ 4.5% of global market✔ Mainly used in detergent, glass, soap, fertilizer and alkalis
PHARMACEUTICALS✔ India ranks 4th In terms of volume & 13th in terms of value.✔ Domestic market size – US$450 million✔ Indian market is 1.6% of the global market✔ Domestic market growth rate – 8 to 9%✔ Strong player in generic market--several of the world’s leading drug
companies are based in India.✔ Significant export led growth
AGRO CHEMICALS AND FERTILISERS✔ Domestic market size – US$88 million

✔ Domestic market growth rate – 10% annually✔ 2.5% of the global market.✔ In India, insecticide commands major share 76%.✔ Globally, herbicides commands major share 48% & insecticide only 29%.✔ India is largest manufacture of basic pesticide chemicals among South Asia
& Africa, next only to Japan.
SPECIALITY & FINE CHEMICALS✔ Market size – US$860 million✔ Major used in textile, leather, paper, detergent, rubber,✔ Paints, polyester, oil & gas.✔ Growth rate – 10-12%.
DYES & PAINTS✔ Market size – US$110 million.✔ Growth rate – 12%✔ Indian market is 6% of the global market✔ Major used in✔ Paints, inks, textiles, polymers.✔ Highly fragmented market✔ 25 large & medium players holding 50% of the market.✔ Remaining 50% is with another small 2000 un-organized players
Success Stories in Fine & Specialty Chemicals
In the pharmaceutical industry, India has demonstrated repeatedly its ability to produce the latest drugs available in the world cost effectively. Within six months after Pfizer launched ‘Viagra’ globally, 3 -4 Indian pharmaceutical companies had introduced it to India market. Demonstrated ability to develop and absorb the latest technologies. Examples are given below :
Rallis manufactures Hexaconazole, a complex Agro-Chemical with purity of 95% withindigenous technology. The innovator produces this product with 90% purity.Gharda manufactures Dicamba, another complex Agro Chemical with purity of 95% withindigenous technology. The innovator of this product produces this product with a purity of 87%.
Other examples include the anti-AIDS drugs including ‘Lamivudine’ ‘Zidovudine’ and‘Indinavir’ each of which are being produced in India at a cost which is a fraction of the price at which these products are being sold internationally.
The following diagram, very well expresses the industry opinion regarding future of various segments in chemical industries:-

(MCIE stands for Mega Chemical Complexes)
Source: Department of chemicals & petrochemicals, GOI
INDUSTRY DYNAMICS

The Government is promoting research on the use of alternative and unharmful pesticides using neem seeds. A country programme entitled "Development and Production of Neem Products as Environment Friendly Pesticides" is being undertaken by the Department of Chemicals & Petrochemicals with the financial assistance of United Nations Development Programme (UNDP)/ United Nations Industrial Development Organization (UNIDO). The project is being implemented at two locations viz., Nimpith in West Bengal and Nagpur in Maharashtra to promote production, processing and use of neem-based products, thereby aiding wasteland development, generating rural employment and providing farmers with eco-friendly/ bio-degradable pesticides.
MAJOR COSTS INVOLVED IN CHEMICAL MANUFACTURING
Raw materials R & D Processing Preservation Special containers for storage
INDIAN GENERIC INDUSTRYIndia has a significant share in the global generics market and is ranked third. In recent years, this segment has been facing stiff competition which makes the scale of production important to improve profitability. India has pre-dominantly been a generic player and has the potential to gain a global presence for the following key developments:
Multiple branded drug patent expirations in the short term. According to IMS Health, in 2006 and 2007 a total of US$ 28 bn and US$ 20 bn, respectively, of branded sales were likely to become susceptible to the entry of generic equivalents.
Increasing confidence of consumers in generics in the developed markets. A pro-generic sentiment from healthcare authorities driven by the pressure of
containing rising healthcare costs. An aging population across the world, leading to increasing demand for low cost
therapies. Global healthcare crisis like AIDS in the developing world, necessitating
affordable medication for the masses.
Generic companies in India are recognizing the importance of patent expiries and are making significant incremental investments in research and drug development
INDIAN BIOTECH INDUSTRY
India, today, holds a small share of the global biotech market, but has all the capabilities to become a dominant player. The consumption of biotech products in India is expected to quadruple in the next decade. The human and animal segment of the industry alone is growing by at least 20%.
While India has been practicing conventional biotechnology for decades modern biotechnology is rather new to India. In 1997, the total biotech market in India was
valued at $ 500 million. This grew to $ 1 billion in 1999 and is expected to grow to $ 4.5 billion by 2010. Human health biotech accounts for 60 % of the total sales, while agro biotech and veterinary-biotech together account for 15 % of the total revenue and medical devices, contract R&D and reagents and supplies constitute the remainder. There exist 800 companies, operating in all sectors of biotechnology, but there are only 25 companies that are working in the modern biotech sectors.
India has very interesting natural features like bio-diversity, varied species of flora and fauna, varied climatic zones, large population with varied demography, largest agriculture sectors, world-class information-technology industry, vibrant pharmaceutical sector and a large pool of scientific talent that creates almost a perfect environment for biotech companies to shift base here. With its large population of over a billion people India also provides a huge market for products and services.
India has a rich human capital, which is the strongest asset for this knowledge-based industry. India has a large English speaking base and produces roughly 2.5 million graduates in IT, engineering and life sciences, about 650,000 postgraduates and nearly 1500 PhDs qualified in biosciences and engineering each year. India has proved its competency in selected areas of biotechnology such as capacity in bioprocess engineering, skills in gene manipulation of microbes and animal cells, capacity in downstream processing and isolation methods, and its competence in recombinant DNA technology of plants and animals.
India has also allowed assisted stem cell research that permits researchers to use embryos from fertility clinics upon informed consent of the donors, thus giving it a clear head start in this new and promising field in Biotech. Clearly, India has the strength and capabilities in this industry, and a definite advantage to forge ahead and become the chosen location for many biotech companies looking for large markets and low cost qualified manpower to work in their R&D division.
The inherent strengths of the Nation combined with rising public interest in this sector, growing investment by traditional business houses, tax incentives and the significant foreign investment available, poises Indian biotechnology sector to emerge as a significant force on the global biotech map.
GROWTH DRIVERS FOR INDIAN CHEMICAL

INDUSTRY
Consolidation Growing orientation towards Research and Development (R&D) Outsourcing Growing Demand Pharma sector going strong Environmental consciousness
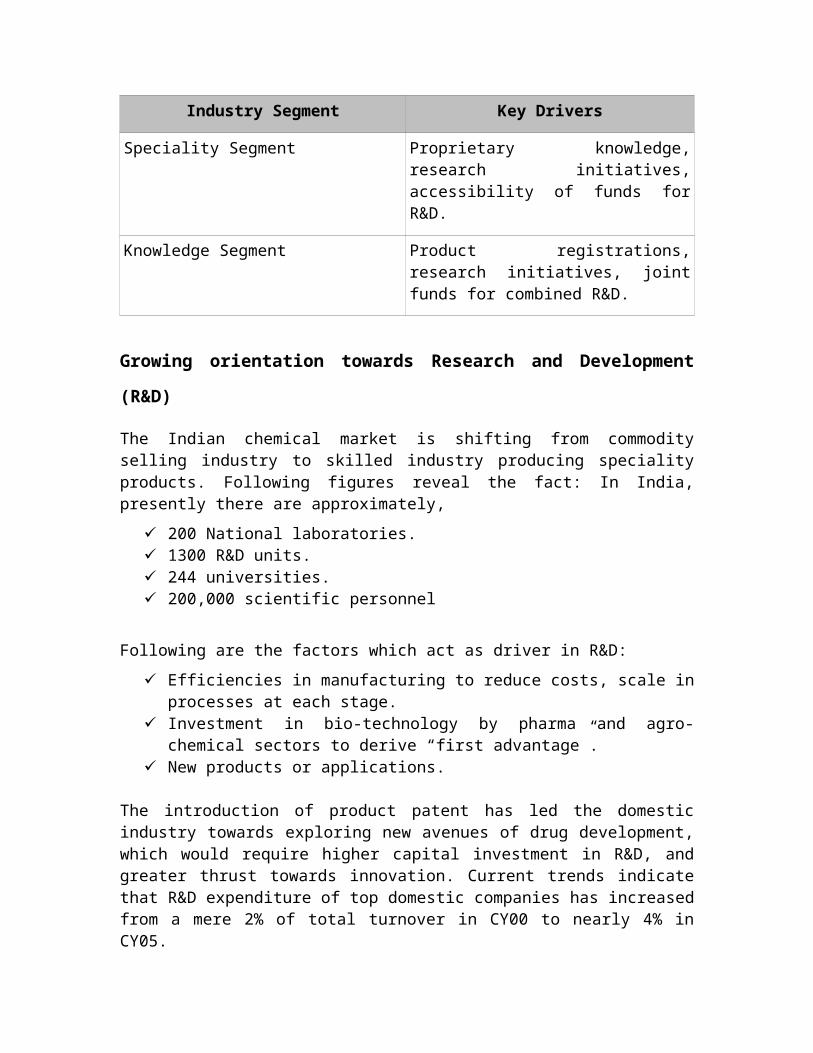
Consolidation
Industry Segment Key Drivers
Basic Segment Falling duties; scale in manufacturing, logistics, marketing and finance.
Speciality Segment Proprietary knowledge, research initiatives, accessibility of funds for R&D.
Knowledge Segment Product registrations, research initiatives, joint funds for combined R&D.
Growing orientation towards Research and Development (R&D)
The Indian chemical market is shifting from commodity selling industry to skilled industry producing speciality products. Following figures reveal the fact: In India, presently there are approximately,
200 National laboratories. 1300 R&D units. 244 universities. 200,000 scientific personnel
Following are the factors which act as driver in R&D:
Efficiencies in manufacturing to reduce costs, scale in processes at each stage. Investment in bio-technology by pharma and agro-chemical sectors to derive
“first advantage”. New products or applications.
The introduction of product patent has led the domestic industry towards exploring new avenues of drug development, which would require higher capital investment in R&D, and greater thrust towards innovation. Current trends indicate that R&D expenditure of top domestic companies has increased from a mere 2% of total turnover in CY00 to nearly 4% in CY05.
Outsourcing

India's workforce ranks first in the availability of qualified, skilled engineers. This leads to many advantages like lower capital outlay , focus on core activities , reduce risk , generate faster cycle times.
Growing Demand
In Indian industry , following are the growth rates for different segment:
Speciality chemical industry = 8% Paints = 8 – 10 % Pharmaceuticals = 9% Knowledge chemicals = 12%
Pharma sector going strong
Globally , the output of Indian pharmaceutical industry ranks fourth in terms of volume and 13th in terms of value.
In FY02, the domestic Indian pharma market was valued at $4.5bn , representing 1.6% of the global market, and is growing at an annual rate of 9%.
The industry produces about 60,000 finished medicines and roughly 400 bulk drugs, which are used in formulations.
In FY03, the Indian pharma market is estimated to have exported drug worth Rs. 110bn.
In the past eight years, the pharma exports grew by 30% per annum.
Following are the growth drivers for the pharma industry;
High number of manufacturing units approved by USFDA. Manufacturing costs less than 1/10th of developed nations. Well established API manufacturing industry. High level of IT awareness of R&D staff. Expertise in process development.
Environmental consciousness
Government initiative in consultation with the industry Formalization of charter on Corporate Responsibility for Environmental
Protection (CREP) for 17 categories of industry.
Leveraging CRAMs opportunities
India is emerging as the global hub for contract research and manufacturing services (CRAMs) due to its low cost advantage and world class quality standards. The Indian chemical industry possesses world standard manufacturing facilities as per the GMP norms which are approved by various regulatory agencies across the globe.
Majority of the contract manufacturing deals relate to production of active pharmaceutical ingredients (APIs) and intermediates, in which India possesses
competence. Nicholas Piramal, Shasun Chemicals, Divi’s Lab, Dishman Pharma, Cadila Healthcare, Lupin, Matrix Lab and Aurobindo Pharma are some of the companies which have witnessed impressive growth in revenues from their CRAMs business under various tie-ups with global pharmaceutical majors.
Growing exports
The proportion of exports in domestic turnover has been increasing over the years, despite the growing domestic demand. Exports have been the major growth enabler of the Indian chemical industry in recent years. India exports chemical products, APIs and intermediates to more than 200 countries across the world.
Expanding presence in regulated market
Over the years, India has shown better regulatory awareness and superior technical skills, which has enabled Indian companies to penetrate the high-value markets like the US and EU. For instance, exports of pharmaceutical products (finished products as classified under heading 30 of ITC-HS code) to the US grew by an impressive 33% to Rs 23 bn and by a whopping 62% to Rs 35 bn to the EU during FY04-FY06. Regulated markets, though difficult to penetrate due to stringent regulations, are known to give better value and margin to exporters. The increasing presence in high-value markets like the USA and Europe has strongly boosted the overall growth of the Indian chemical industry. However, with competition getting stiffer in the regulated markets and the consequent pressure on margins, Indian players are also expanding their geographical reach to high-growth regions
Rise in new product launches
In the pharmaceutical industry, new product launches create new demand. After the introduction of product patent in India, the domestic industry has witnessed a fresh spell of new product launches. New products launched since 2005 accounted for around 12% of the overall market growth. These launches have been done by both domestic and international players and some of them are first time launch of new chemical entity (NCE).
ENTRY BARRIERS
This well-diversified sector covers more than 70,000 commercial products and is intensive in knowledge, capital and power. This sector has made good progress during the last five years, and turned from a net importer in the 1990s to a net exporter. During 2005-06, however, there was a deceleration in the growth rate of the sectorto 8.2 per cent from 14.5 per cent in 2004-05. Major part of Indian exports of chemicals goes to highly developed western countries, where the quality standards are very strict. And therefore following are the industry specific barriers for a new entrant:
Heavy investment in Research and development. Expensive infrastructure Quality assurance norms have to be strictly adhered to.

RISK AND CONSTRAINTS
Cost of power: Very high cost and poor quality of power. Cost of Finance: Chemical industry is highly capital-intensive, cost of finance in
India is very high. Infrastructure: Infrastructure facilities are not of world class.
Weakness: Legacy of Past policies of Industrialization Technology: Low Investment in R&D to be able to sell value added products and
compete in developed countries is absent. Cost Disadvantages : Locational disadvantages, such as extra transport cost for
raw materials as well as finished products. Scale of Production : Plant sizes are not comparable to world scale operations. Multiplicity of Taxes: Multiple levies (various taxes and duties likes sales tax,
turnover tax, Octroi, service tax, electricity duty and cross subsidies etc)..
Threats:
Quantitative Restrictions for imports have been removed already. Most of the chemicals are now in the Open General List(OGL) of import.
Tariff levels in India for most chemicals are significantly higher than in other countries manufacturing the chemicals.
Pressure on the government to reduce these tariff levels. Unless industry acquires competitiveness, it may face extinction.
Price erosion in generics
Indian generics market is witnessing a margin pressure in most of the product categories due to two main reasons: the proposed price control likely to be imposed by the Government and the stiff competition among domestic players. In fact, India has witnessed a fast rise in the number of players over a period of time. Moreover, the expansion of capacities by certain leading players has also fuelled competition in certain product categories, which restricts margins of the smaller players.
The fall in prices of generic drugs are not limited to India only. The US, which is the world’s largest pharmaceutical market, is also experiencing a sharp reduction in prices of generic drugs due to stiff competition. Some other developed countries like the UK and Germany have also witnessed the same scenario. The erosion in prices is to the extent of 90% in some cases. Indian players, which have been operating in these markets, have also witnessed erosion in margins in certain therapeutic segments.
Low R&D productivity
Despite the increasing expenditure on R&D, the introduction of new molecules by Indian players has been limited. It is, in fact, a hit-and-miss situation in the field of discovery and developments of new chemical entity (NCEs), where misses are more than hits. Very few discoveries reach the final stages of approvals, and in most of the cases, the claim for patent gets stuck in legal battles.
In spite of the rising expenditure in R&D, the level of investment in R&D is still low, at average 4% as compared to the global practice of spending 12-16% of sales on R&D.
The European generics market has emerged as a major attraction for acquisitions by Indian companies. According to reports, margin erosion in Europe is much less compared to the US when a drug or formulation becomes generic.

INVESTMENT REQUIREMENTS
Chemical and Petrochemical Industry occupies an important place in the country’s economy, as the Chemical industry has grown at a pace outperforming the overall growth of the industry. The Chemical Industry produces a wide spectrum of products, which include Pharmaceuticals, Dyes, Man-made Fibers, Plastics, Pesticides, Fertilizers, Cosmetics and Toiletries, Paint, Auxiliary Chemicals and wide range of Organic and Inorganic compounds for applications ranging from automobiles, textile industry, engineering industry, construction chemicals and food additives to veterinary and health care products.
The lower per capita consumption of many important items at present and growing middle class with increasing purchase power constitutes an attractive market for various products The development of Chemical and Petrochemical Industry requires creation of basic and allied infrastructure facilities and in view of the availability of the same, the Indian/Gujarat Chemical Industry has opportunity to grow within as well as outside the country. Further the motivated entrepreneurs, pool of technical manpower and flexibility to changes in production set up which forms the competitive strength of the Chemical Industry in the State and therefore, will rise to all opportunities for development and growth in the investment.
The Chemical Industry needs to engage in strategic partnerships with foreign partners with a view to realize and capitalize the latent potential. The existing technology needs to be upgraded with the help of foreign partners. The Chemical Industry in India/Gujarat provides a large scope for collaboration in Technology tie-up, Process Development, Joint Research and Development, Solid and Liquid Waste Management and Market Access for various sub-sectors of the industry.
GOVERNMENT POLICIES
Government policies play an important role in shaping the future of any business. Decision makers at both macros as well micro level will have to take into account existing policies, the way Govt. and other bodies are thinking about them and what will be the shape of these policies in future to come.
Industrial Policy: The items, which require compulsory license are Hydrocyanic acid and its derivatives; Phosgene and its derivatives; Naptha/Gas cracker complexes producing and its ethylene, propylene, aromatic complexes manufacturing benzene, toluene & xylenses- o-xylene, ethylene oxide and polyethylene having a specific gravity of less than 0.94
Policy for foreign direct investments facilities approval through automatic route. The following categories of FDI proposal are only approved through foreign investment promotion board. All proposal that require industrial licence includes, the items requiring an industrial licence under the IDR Act, 1951; all items which require industrial licence in terms of locational policy notified by government under the new industrial policy. All proposals relating to acquisition of shares in existing Indian company in favour of a foreign/NRI/OCB investor. All proposals failing outside sectoral policy/caps or under sectors in which FDI is not permitted and/or whenever any investor chooses to make an application to the FIPB an not to avail of the automatic route
KEY PLAYERS IN INDIAN INDUSTRY
Indian Chemical Council, ICC is the apex national body representing all the sectors of the chemical industry in India viz. Organic and Inorganic, Plastics and Petrochemicals, Dyes and Dye-intermediates, Drugs and Pharmaceuticals, Agrochemicals and Pesticides, Fine Chemicals, Specialty Chemicals etc. ICC has its members spread all over India. Since the concentration of the chemical industry is mainly in Maharashtra and Gujarat, the western region consists about 60 % of the total membership of ICC.
Few well known and major Indian players of this industry are Ranbaxy in pharmaceuticals, Asian paints, Pidilite in paints and dye segment.
FUTURE OUTLOOK
The Indian chemical industry is passing through a transformation and industry players are organizing themselves to avail of the immense opportunities that have opened up globally. The sector is set to report impressive growth in the years to come and outlook for the industry remains strong.
Following are the factors which substantiate the strong outlook for the industry:
Demographic factorsPopulation growth coupled with rise in per capita income and increasing usage are factors which will continue to drive domestic demand for the chemical industry. According to projections given in the Economic Survey 2005-06, India’s population is likely to touch 14.11 bn by 2026.
New product launchesAfter the introduction of product patent laws in India, multinational companies have shown renewed interest in launching some blockbuster products in India. This trend is likely to continue in future as well. Launches of new molecules by MNCs will accrue contract manufacturing and in-licensing opportunities for Indian players including the small and medium enterprises. SMEs have acquired expertise in formulations & chemical synthesis. Manufacturing under contracts gives them a safe position against margin fluctuations.
Increasing investments in R&D in pharmaceutical industryGiven the long gestation period right from the discovery of molecules to the final approval for marketing, the current investments made towards R&D will lead to sustainable growth. Some important molecules developed by Indian players have already reached different stages of clinical trials, some of which have reached the critical phase-II.
Growing generics market - an opportunity for IndiaIncreasing number of products getting off-patent and recognition of generic drugs by some developed countries is set to expand opportunities for India in the generics market. The generic industry is estimated to grow by more than 20% annually till 2008 and the total size is estimated to be around US$ 80 bn by 2008. In the US, generic drugs make up for 55% of the prescription written.
Leveraging the cost-effective production capabilities of Indian manufacturers, better scientific skills and favourable regulatory environment, the Indian pharmaceutical industry is well-placed to tap these opportunities.
Growing exports marketExports will continue to remain strong and an enabler of growth for the chemical industry. Impressive performance of Indian exports, achieved during last few years, is likely to continue in the near future. Despite the growing competition in the global generics market and increased participation among developing countries in the global chemical market, Indian companies have already proven their ability to compete.

CRAMs opportunities will continue to pick upContract manufacturing and contract research will gain prominence among the Indian pharmaceutical companies. There has been a spate of tie-ups and acquisitions by companies in the CRAMS segment in India. The driving factors include the rising manufacturing costs in developed countries and falling prices in the generics segment world over. India aptly suits the changing global scenario, having the largest number of US FDA approved facilities outside the US and low cost manpower with technical expertise. Contract manufacturing business is estimated to touch US $30 bn by 2010 and is likely to grow at 10-12%.
In the field of R&D, Indian companies are capable of conducting various clinical trials at relatively lower costs. Although India has also started experiencing rising bills on skilled manpower, it is still in a relatively advantageous position on the cost front. Contract research business is estimated at US$ 6-10 bn, and is growing in the range of 16-18%.
Competitive Advantage of India Large resource of scientific and technical manpower Large domestic market for various sectors of chemicals. Long coast line and abundant availability of salt. Tropical region: facilitating open storage for bulk chemicals. A developed financial market. A large English-speaking population Rapid growth in Information Technology provides competitive access to the rich
European and American market.
Vision for the Future
Developing a global outlook World scale capacities Mutually beneficial strategic alliances Responsible care
Following diagram shows Indian chemical industry and how can it increase its hold in global market

RECOMMENDATIONS
For most of the leading companies in speciality segment and pharmaceutical sement, the future is indeed promising. Biotech, is also an upcoming sector and its market will shoot high with coming period.
The establishment of business relations with these companies will definately prove fruitful to HDFC Bank and will open new avenues for its growth and success.
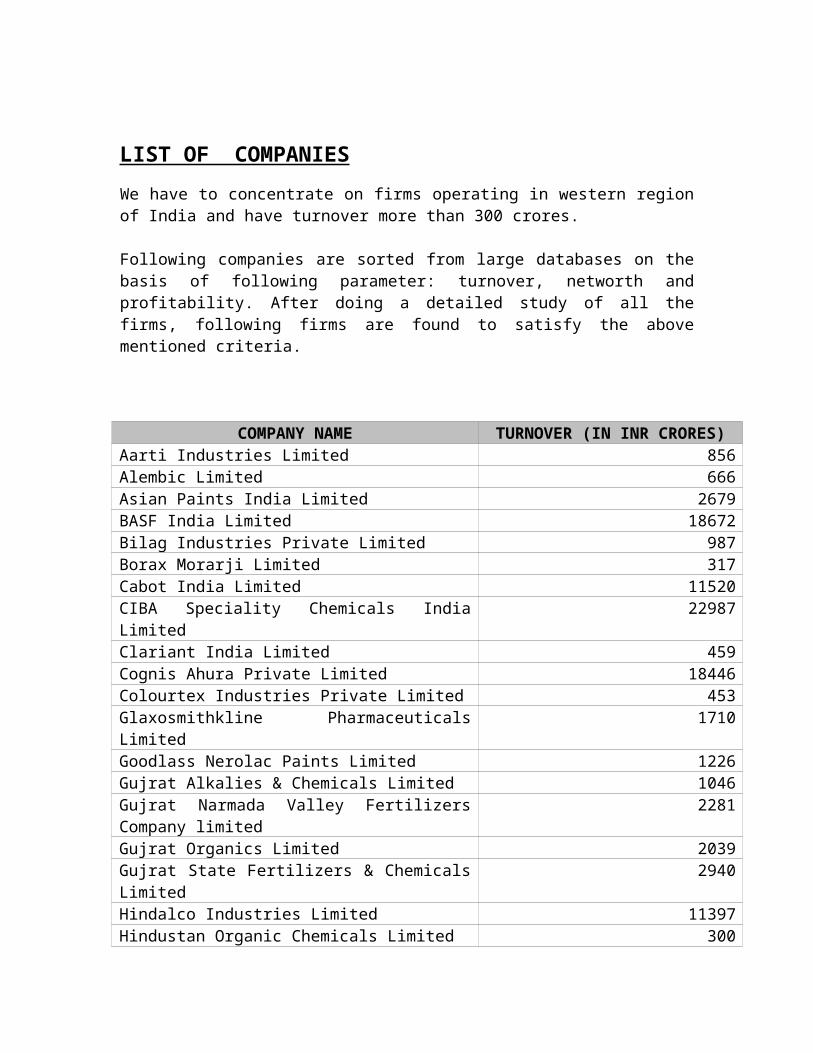
LIST OF COMPANIES
We have to concentrate on firms operating in western region of India and have turnover more than 300 crores.
Following companies are sorted from large databases on the basis of following parameter: turnover, networth and profitability. After doing a detailed study of all the firms, following firms are found to satisfy the above mentioned criteria.
COMPANY NAME TURNOVER (IN INR CRORES)Aarti Industries Limited 856Alembic Limited 666Asian Paints India Limited 2679BASF India Limited 18672Bilag Industries Private Limited 987Borax Morarji Limited 317Cabot India Limited 11520CIBA Speciality Chemicals India Limited 22987Clariant India Limited 459Cognis Ahura Private Limited 18446Colourtex Industries Private Limited 453Glaxosmithkline Pharmaceuticals Limited 1710Goodlass Nerolac Paints Limited 1226Gujrat Alkalies & Chemicals Limited 1046Gujrat Narmada Valley Fertilizers Company limited 2281Gujrat Organics Limited 2039Gujrat State Fertilizers & Chemicals Limited 2940Hindalco Industries Limited 11397Hindustan Organic Chemicals Limited 300Hindustan Engg. & Industries Limited 386Indian Petrochemicals Corporation Limited 12362Indofil Chemicals Company 328Lanxess ABS Limited 473Lubrizol India Private Limited 365Lupin Laboratories Limited 1661Merck Limited 99714Nirma Limited 2244Pidilite Industries Limited 1044Rashtriya Chemicals & Fertilizers Limited 952TATA Chemicals Limited 3517United phosphorous Limited 363
ANALYSIS
OF THE
POWER EQUIPMENT
INDUSTRY
37

POWER INDUSTRY OVERVIEW
India's power market is the fifth largest in the world. The power sector is high on India's priority as it offers tremendous potential for investing companies based on the sheer size of the market and the returns available on investment capital.
India is witnessing more than 8% growth in GDP for third year in succession. With huge and rising investment in infrastructure, capacity additions across the industry, the demand for power is set to escalate on a sustainable basis for years to come. Already, the country is witnessing widening of demand supply gap, and to fuel the growth, there is urgent need to scale up power generation and distribution capacities and to reduce transmission and distribution losses. While significant progress have been made in facilitating private participation, the weak link remains to be the poor financials of State Electricity Boards and populist and lack of political will to charge market related rates for residential and agriculture sector. The ultra mega power projects can partly satisfy the growing demand, and Central PSUs keep bringing in fresh capacities.
Power sector in India aims to provide power to all by FY 2011-12, to achieve it, a multi-pronged strategy has been chalked out, which includes:
Distribution reforms Renovation and modernization of old power plants Demand-side management and capacity addition.

INDUSTRY STRUCTURE
The power equipment industry can be broadly classified into three segments.
Power generation equipment such as turbines, generators and boilers. Transmission and distribution equipment such as transformers, distributors and
instrumentation and control systems. Services for renovation and modernisation.
Though part of the same industry, these segments are different when it comes to business characteristics.
Analysts reckon power equipment makers/solutions provider to the power sector stand to benefit from the expected huge expansion in the power generation sector and transmission & distribution segment over the next few years. Easing copper and steel prices also bodes well for these firms.

MARKET
INDIAN MARKETThe current installed capacity of power plants is 124, 287 MW (as of March 2006). Almost 55 percent of this capacity is based on coal, about 10 percent on gas, 26 percent on hydro, just under 5 percent on renewable sources, about 2.6 percent on nuclear and 1 percent on diesel.
In the past few years, there has been considerable growth in power plants based on renewable sources of energy. The current installed capacity based on these sources is about 6,200 MW of total utility capacity. In addition, as the merits of hydro have become apparent, in an era of high fuel prices, there has been a big push for hydro. An initiative to add 50,000 MW of hydro capacity by 2017 was announced in 2003. The current installed capacity, at about 32,000 MW, utilizes just over one -fifth of 150,000 MW hydro potential.
The Plant Load Factor (PLF) of generating plants has improved consistently over the last 10 years. In 2005-06, the PLF of generating plants was almost 74 percent, compared to 60 percent in 1994-95.
In the past five years, there has been a much greater emphasis on transmission and distribution reforms. The interregional transmission capacity has been increased to 9,500 MW. The National Grid Development Programme calls for 37,150 MW of interregional capacity by 2012.
The reform process in the power sector continues. Thirteen states have unbundled SEBs into separate entities for transmission, distribution and generation. Two states have privatized distribution. Regulatory authorities have been set up in 24 states. These authorities are applying commercial principles to tariff setting, monitoring the performance of state utilities and paying attention to areas such as demand side management and grid discipline.
The government aims to provide "power to all" by 2012. To achieve that promise, it will have to add as much as 1,00,000 MW of generation capacity, cut AT&C losses substantially to below 20 percent, rationalize tariffs and ensure that average revenue realization is greater than the cost of production. It will have to continue to push the process of reform and restructuring and ensure greater private participation, in every segment.
DEMAND AND SUPPLYAs India is a rapidly growing economy, the demand for power is ever rising and thus cannot be quantified. However, it is very clear from this analysis of this industry that there exist an acute gap between the supply and ever growing demand.

INDUSTRY DYNAMICS
ELECTRICITY ACT 2003Electricity Act 2003 has been enacted. The objective is to introduce competition, protect consumer's interests and provide power for all. The Act provides for National Electricity Policy, Rural Electrification, Open access in transmission phased open access in distribution, mandatory SERCs, license free generation and distribution, power trading, mandatory metering and stringent penalties for theft of electricity.
It is a comprehensive legislation replacing Electricity Act 1910, Electricity Supply Act 1948 and Electricity Regulatory Commission Act 1998. The aim is to push the sector onto a trajectory of sound commercial growth and to enable the States and the Centre to move in harmony and coordination.
The Electricity Act 2003 has had a positive effect on the entire sector, including generation. Overall, this legislation has liberalized generation and freed it from licensing. The requirement of techno - economic clearance has also been removed. In addition, the recently announced National Tariff Policy makes it mandatory that all future requirements of power should be produced through a competitive bidding mechanism instead of cost-plus route.
The positive environment created by the electricity act and the proactive role-played by the ministry of power in helping private projects achieve financial closure have led to a revival of the IPP model.
Seven ultra mega coal based power projects with a capacity of 4000 MW each in the first phase are on the anvil. These projects will be set up at Sasan in Madhya Pradesh, Mundra in Gujarat, Akaltara in Chhattisgarh, Karvar in Karnataka, Ratnagiri in Maharashtra, Krishnapatnam in Karnataka, and in Orissa. For the Orissa project, three sites- Hirma, Derabahai and Bhashma have been short-listed.
The initial development work (land acquisition, water linkage, EIA studies, preparation of project report, etc.) is being done through SPV companies, with initial funding provided by the Power Finance Corporation (PWC). Each company will be a fully owned subsidiary of PFC. These projects will be awarded on the basis of competitive bidding. The bidding will be based on the first year of tariff quoted. The projects will be transferred to the investors by the end of 2006. These projects will entail a total cost of Rs. 750 billion. They are likely to be financed at debt-equity ratios of 70:30. The cost of power from these projects is estimated to be about Rs. 2.50- 2.75 per unit.
The recent Indo-US nuclear deal makes nuclear power a much more realistic option for the future. The centre has given approval for the construction of eight new nuclear reactors with a combined capacity about 6,800 MW.
The Government plans to add 32,000MW in the tenth plan and an additional 67,500 MW in the eleventh plan. The capacity addition target for the twelfth plan stands at 66,500 MW.

GENERATIONIndia's power generation capacity (excluding captive plants) stood at 124,287 MW in March 2006. Actual generation has grown at a CAGR of about 5.82 per cent in the last decade from 350,490 MUs in 1995-96 to 617,382 MUs in 2005-06.
The overall generation in the country has increased (Thermal + Nuclear + Hydro) in public utilities in the country over the years is as under:
YEARGENERATION (BILLION
UNITS)
1990-91 264.3
1995-96 380.1
2000-01 499.5
2001-02 515.3
2002-03 531.4
2003-04 558.3
2004-05 587.4
2005-06 (Upto Feb. 2006) 562.7
Source: Annual Report 2005-06, Ministry of Power
The bulk of the capacity is thermal (coal, gas, liquid fuel and diesel). Thermal plants contribute 66.3 percent to overall capacity. Of this coal contributes 55 percent of the capacity, gas another 10 percent, while the rest (1 percent) is based on diesel.
Over the years, the fuel mix has changed. The share of power from thermal sources decreased from 71 percent in 1994-95 to 66.3 percent in 2005-06. The share of hydro has increased from 25.7 percent to 26 percent. Growing environmental concerns have led to an interest in renewable sources of energy (comprising wind energy, solar photovoltaic energy, biomass power and mini hydro plants). But despite great potential, renewable sources contribute only a little over 6,000 MW at present.
The contribution of the private sector to installed generation capacity was 14, 139 MW or 11.3 percent in 2005-06. Amongst the private players, Tata Power has the highest installed capacity at 2,300 MW. In terms of actual generation, private contribution is 8.7 percent. There is renewed interest in IPPs in the power sector. Private IPPs contributed 5,961 MW to installed generation capacity in March 2006.
The PLF of generating plants has improved consistently over the last few years. The all India average PLF on March 2006 stood at 73.6 percent compared to 60 percent in 1994-95. The PLF of central plants in 2005-06 was 82.1 percent while the average PLF of the

state sector units was close to 67 percent. The average PLF of the private sector was 85.4 percent in 2005-06.Drivers of power generation are:
Orders from new power projects and is thus heavily dependent on their commissioning.
Replacement demand is limited and restricted to renovation and modernisation.
Being heavy capital equipment they have a long manufacturing time cycle. Typically, the manufacture of a turbine/generator for a 500 MW plant would take about 36-42 months from the order's date. The approximate value of such equipment would be about Rs 2,000 crore.
Technology in this segment is mature and there have been few developments in turbine or generator technology in the last two decades. The last major development in turbine technology was the development of gas turbines by General Electric in the 1980s. Since then there have been rapid improvements in gas turbine technology but there has been nothing radical or path-breaking. There are just a handful of companies in the whole world in this business such as,
GE Siemens Alstom Mitsubishi
They are either present on their own in different countries across the world or they license their technology to others.
TRANSMISSION Transmission lines have grown from 3,708 ct. Km in 1950 to more than 2,64,240 ct. km in 2005. In the last four years, the network has grown by about 12.5 percent. It is projected to grow to 3,50,000 ct. km.
Transmission projects continue to be accorded a high priority in the context of the need to evacuate power from generating stations to load centres, system strengthening and creation of National Grid. The construction targets of transmission projects for the year 2005-06 and the achievements up to December 2005 are summarized below:
Parameter MOU Target (Excellent)
Achievement upto December 2005
Percentage of Achievement
No. of Ckt Kms. Ready for commissioning 3800 4040 106.00%
Transformation Capacity Addition 4885 4670 95.50%

Transmission lines and sub-stations completed during the year 2005-06 (upto December 2005) are shown in the following table:
Sr.No Name of the line/Sub station Voltage class
Ia Transmission Lines
1.0 Rihand- Allahabad-Mainpuri D/c line 400 Kv
2.0 Mainpuri-Ballabgarh D/c line 400 Kv
3.0 Patiala- Malerkotla S/C line 400 kV
4.0 LILO of Nalagarh-Hissar at Patiala & Kaithal D/C 400 Kv
5.0 Raipur- Chandrapur D/C 400 kV
6.0 LILO of Bongaigaon –Malda at Siliguri D/C 400 kV
7.0 Madurai- Thiruvananthapuram D/C 400 kV
8.0Dhauliganga (NHPC) –Bareily (UPPCL) D/C
(to be initially charged at 220 KV level)400 kV
9.0 Tarapur 3&4- Boisor D/C transmission Line 400 kV
10.0 Tarapur 3&4 –Padghe D/C transmission line (Ckt –II) 400 kV
11.0 LILO of S/C Gandhar – Padghe line at Boisor 400 kV
12.0 Kaiga – Narendra D/C Line 400 kV
13.0 LILO of S/C Gandhar – Padghe at Vapi 400 kV
14.0 LILO of S/C Nagarjunsagar –Raichur at Mahaboobnagar 400 kV
15.0 Meerut (POWERGRID)- Shatabdi Nagar S/C line 220kV
16.0 Tarapur 3&4 – Boisor S/C Tr. Line 220kV
17.0 LILO of D/C Siliguri- Gangtok at Melli 132kV
18.0 LILO of 1st Ckt. Of D/C Siliguri- Rangit at Gangtok (New) 132kV
Ib) Other Schemes

Sr.No Name of the line/Sub station Voltage class
1.0 ULDC –ER
2.0 ULDC –WR
3.0 Series Compensation at Rengali
II New Sub-Stations
1.0 Thiruvananthpuram 400/220 Kv
2.0 Mainpuri 400/220 Kv
3.0 Vapi 400/220 kV
4.0 Boisor 400/220 Kv
5.0 Kaithal 400/220 kV
6.0 Patiala 400/220 kV
7.0 Narendra 400/220 kV
8.0 Baripada 220/132 kV
9.0 Gangtok 220/132 kV
GROWTH DRIVERS
Unlike the generation equipment segment the T&D equipment business relies equally on new orders and replacement demand. It has been able to survive even in the complicated business environment of the last decade thanks to business from the replacement market. Of course, the replacement market is not as large as it should be for the installed capacity of 1 lakh MW in the country because of the absence of a good renovation and maintenance programme in most power plants.
The companies engaged in laying of power transmission lines in India historically had been getting business of laying power transmission lines at Middle East / North Africa on account of being cost competitive. Lately companies engaged in laying of power transmission lines in India have been getting business of laying power transmission lines at Middle East / North Africa due to increase in income level of this region on account of increase in oil prices / due to reconstruction activity undertaken in countries like Iraq.
Restrictions on GrowthThe orders for laying of power transmission lines historically were mainly received from SEBs (are incurring losses and have track record of delayed payments of retention

money). This resulted in restricted business opportunities for the companies in India engaged in power transmission line business.
This segment is highly competitive, especially as one goes down the value chain. For small products such as distribution transformers and energy meters there is tremendous competition that thins out in the high value/high technology products. Competition is more even here between BHEL and MNCs such as ABB, Siemens and Alstom. After the worldwide divorce between ABB and Siemens in 2000, ABB now concentrates on the transmission and distribution business leaving the generation equipment area to Alstom.
DISTRIBUTIONThe demand for electrical energy is ever increasing. Today over 21% of the total electrical energy generated in India is lost in transmission (4-6%) and distribution (15-18%). The electrical power deficit in the country is currently about 18%. Clearly, reduction in distribution losses can reduce this deficit significantly. It is possible to bring down the distribution losses to a 6-8 % level in India with the help of newer technological options (including information technology) in the electrical power distribution sector that will enable better monitoring and control.
Electric power is normally generated at 11-25kV in a power station. To transmit over long distances, it is then stepped-up to 400kV, 220kV or 132kV as necessary. Power is carried through a transmission network of high voltage lines. Usually, these lines run into hundreds of kilometres and deliver the power into a common power pool called the grid. The grid is connected to load centres (cities) through a sub-transmission network of normally 33kV (or sometimes 66kV) lines. These lines terminate into a 33kV (or 66kV) substation, where the voltage is stepped-down to 11kV for power distribution to load points through a distribution network of lines at 11kV and lower.
Distribution Companies
With State Electricity Boards (SEBs) having to restructure themselves following the passage of the Electricity Act, 2003, the power sector has undergone a significant structural change. A key constituent of the evolving industry structure in each State will be the Distribution Companies (DISCOMs), which will be providing the “last mile” connectivity to the final consumers, both retail and wholesale. Several large players in the power sector plan to acquire majority stakes in the state owned DISCOMs once they are up for privatisation. While traditionally, DISCOMs have been purchasing power from the State Transmission Utilities (Transcos) —usually the successors of the SEBs—through long-term power purchase agreements (PPAs), the procurement pattern could also undergo a change with the Electricity Act, 2003 allowing freedom to licensees to source power from any source. Also since Transcos are not allowed to trade in power as per the Electricity Act, 2003, the PPAs would also need to be reassigned.
The demographic profile of the service area that a DISCOM serves determines the quality of cash flows, as well as the extent of likely threat from competition. Given the level of cross-subsidy currently prevalent in the tariff structure, a high proportion of agricultural consumption inevitably implies greater burden of subsidy payment on the State
Government, as well as relatively higher levels of cross-subsidy. At the same time, a higher proportion of Commercial and High Tension(HT) segment in the consumer mix implies greater vulnerability to competition in a liberal regime for captive power plants (CPPs) and in an open access scenario that allows freedom to consumers to source power from alternative sources. The key determinants of demographic profile are:
Proportion of various consuming segments Growth rates in different segments Extent of agricultural consumption Geographical dispersion of HT consumers
The extent of geographical dispersion within the HT segment is an indicator of concentration risk and hence competitive threats. ICRA also assesses the steps being taken by the utilities /State Government to minimise the impact of high paying consumers switching from the incumbent licensee. ICRA notes, for instance, that utilities in some states have initiated supply of power to HT industrial consumers through a special incentive scheme at tariffs that are substantially lower than the normal tariff levels applicable for such consumers. Further, some State Governments have been levying taxes on captive power generation, which also mitigates the threat from CPPs to an extent, although questions remain about the sustainability of such measures.
The major power equipment makers in the distribution segment are,
Company Name SalesEMCO 405.37
Bharat Bijlee 300.29 Voltamp Trans 248.79 Accurate Trans. 150.74
Indo Tech 97.34 Trans. & Elec. 82.90
RTS Power Corpn 78.01 IMP Powers 67.40
Services
Services is a lucrative activity given the large installed base and it is not surprising that MNCs such as Alstom and ABB are rather active in this business. Here again, the market has not really taken off as it should have and the reasons are familiar. State electricity boards that own the majority of the stations in need of renovation and modernisation are in no position to use the limited funds they generate in R&M activity. That this market is lucrative is evident from the two joint ventures floated by BHEL with GE (BHEL-GE Gas Turbine Services Ltd) and Siemens (Powerplant Performance Improvement Ltd). These two companies service the existing installations based on their respective technologies. A measure of their success is that both these companies are doing very well financially, with one of them declaring a 95 per cent dividend for 2000-01. Others such

as Alstom are equally active in this business. In fact, it is these areas that provide them with business in this difficult environment.
Towards Formation of National Grid
Ministry of Power has envisaged establishment of an integrated National Grid in the country by the year 2012 with an inter regional power transfer capacity of about 37,150 MW (enhanced from earlier planned target of 30,000 MW). A perspective transmission plan has been evolved for strengthening the regional grids with the ultimate objective of establishment of strong and vibrant National Power Grid to support the generation capacity addition program of about 1,00,000 MW during the tenth and eleventh plans.
Private Sector Participation in Transmission
The first major step towards encouraging private investment in the power sector was taken in 1991 by providing a legal framework through an amendment of the then existing Electricity (Supply) Act, 1948 enabling private sector participation in generation. Subsequently, a definite tariff framework was also put in place through notification issued by the government of India.
POWERGRID has established First Public -Private joint venture in Indian Power sector with M/s Tata Power (POWERGRID's stake is 49 percent and M/s Tata Power's stake is 51 percent in the joint venture company viz. "Powerlinks Transmission Limited") for implementation of major transmission lines of Transmission System associated with Tala HEP in Bhutan, East-North inter connector and northern region transmission costing about Rs. 1612Crore. This letter received excellent response from International Funding Institutions like IFC, Washington including multilateral financing from private sector arm of ADB, Manila, and Indian Financial Institutions like IDFC and SBI.
The JV Company has received its transmission license from CERC, the first such license in Indian Power Sector. Financial closure of the project was achieved in May 2004. A debt of Rs. 980mCrore has been tied up with the consortium of multilateral and domestic financial institutions.
Action has been initiated to bring in more private investment in transmission projects and two more projects. For example: transmission systems associated with Koldam and Parbati- II (Estimated Cost: Rs.660 Crore) have been floated under joint venture route. In addition, some transmission lines under Western Region Strengthening Scheme are envisaged to be implemented through 100 percent private sector participation (IPTC).Ministry of Power is in the process of finalizing policy guidelines for private investment in transmission.
ENTRY BARRIERS
As the number of companies in power transmission line sector in India is low (as there are high entry barriers on account of power transmission line projects being awarded on the basis of project execution track record), leading companies like KPTL will reap the benefits of growth in power transmission line sector in India. Also the trend in the power transmission line sector in India is increasingly to go for laying of HVDC power transmission lines, where transmission and distribution losses are lower, thereby KPTL would be again benefited as very few companies including KPTL along with global majors like ABB have expertise in HVDC power transmission lines.

RISK & CONSTRAINT
CHINESE Threats to POWER EQUIPMENT Industry
Chinese electrical equipment manufacturers are set to enter India due to the ultra mega power projects (UMPPs) and the renewed interest in India’s power sector. Companies such as Dongfang, Chint Electrics, Wenzhou Hezhong and China National may claim a sizeable stake in India’s electrical power spectrum, if talks with domestic players succeed.
Dongfang is planning to tie up with Lanco Infratech, which outbid players to win the country’s first UMPP at Sasan, for supplying super critical boilers. But Dongfang has to get licence to sell its products outside China and talks are currently on. Chint and Wenzhou Hezhong are evaluating the opportunities and may start equipment supply to medium-scale projects in the country. China National had held talks with two power generation companies, though they are yet to materialise.
At present, out of 95 private power projects, 58 projects for around 36,000-mega watt (MW) capacity have foreign developers. As per the information available, around Rs 10,500 crore foreign investments has already been made in the private power sector. Global majors such as Siemens, Samsung, LG, ABB and Areva have units in India. As of now, the presence of Chinese companies in the power sector is marginal, but this scenario may change when the other UMPP bids are finalised,.
Encouraged by the response to the first two UMPPs, the government plans to award three more UMPPs in 2007. The first project, Krishnapatnam in Andhra Pradesh, is targeted for award in April 2007, second one in May-June 2007 and third by the year-end.
Chinese companies are now looking at opportunities outside their country. Once the growth within China is saturated, these companies will have to find new markets. Comparing the economy growth and market potential, both India and China have many similarities.
The south Asia region, consisting of Bangladesh, Bhutan, India, the Maldives, Nepal, Pakistan and Sri Lanka, is witnessing rapid growth in energy demand. With a 1.4 billion population, this region constitutes almost one-fifth of the world population. But half of this population still lives in darkness. “Traditionally, Chinese companies were considered to be weak in after-sales-service. But the situation is changing This may lead to Indian companies importing equipment from China at competitive prices.
With the government’s commitment to scale-up capacity, Chinese players are now taking a serious look at the Indian market. With a project of 4,000 MW on hand, Dongfang may consider setting up a stronger base in India. If the Sasan project proves successful, more Chinese investments can be expected, and Bhel’s market share in new projects may come under pressure.

INVESTMENT REQUIREMENTS
Investment needs in the power sector:
New Power Plants – Rs. 150,000 Crs Transmission Line – Rs. 71,000 Crs Renovation of Old power plants – Rs. 100,000 Crs
Investment Opportunities and Potential
According to Central Electricity Authority's sixteenth electric power survey, peak demand is expected to increase by a staggering 77 percent to 157,107 MW by 2012. Similarly, the energy requirement is also expected to increase by 274 percent to 975,222 MU by 2012. It is estimated that a capacity addition of over 100,000 MW units by 2012 to bridge the supply deficit and keep up with the increasing demand. The total investment required in capacity creation, along with necessary investments in transmission and distribution segments is estimated at US$ 200 billion. This quantum of investment calls forth public -private partnerships in the sector.
Hydro Projects Sixty eight percent, i.e., 101,454 MW of potential capacity is still not
developed. Seventy-seven schemes with a cumulative total of 33,000 MW have been
identified. Captive Power
At present, CPP accounts only for fifteen percent, i.e., 22,100 MW of total combined capacity. Government plans to bring further 5000 MW into mainstream.
"Open Access" and "Group Captive" allowed under recent policy initiatives.
Ultra Mega Power Projects Seven projects with an individual capacity of 4000 MW, requiring an
investment of approximately US$ 3.26 billion (INR 15,000 crore) each have been identified.
Nuclear Power In the post indo-US agreement period, there is scope for private -public
partnership in this sector National Grid Program
The program envisages addition of over 60,000 ckm of transmission network in a phased manner by 2012 with an estimated investment of about US$ 15.18 billion. Of this about US$ 4.33 billion is ought to be mobilized through private participation.
Distribution: with respect to distribution, the following opportunities exist a) Rural Electrificationb) Privatization of Discomsc) Participation under Franchise Model

Trading "Power Pools" system has been established to facilitate trading
opportunities for licenses. Renewables
Existing untapped wind energy potential of 45,000 MW. Untapped Bio-power potential of 52,000 MW. Untapped Cogeneration- bagasse based potential of 5000 MW.
Investment PolicyThe 1991 Power Policy seeks to attract significant private sector investment in the Indian power sector. The key initiatives include:
Private sector permitted to set up cool, gas or liquid based thermal project, hydel projects and wind or solar projects of any size.
Foreign equity participation brought under automatic approval of generation, transmission and distribution of power generated in hydro-electric, oil based and coal/lignite based power projects.
Role of the Central Government curtailed and the State Governments and State Electricity Boards (SEBs) empowered to negotiate directly with developers, facilitating speedy clearances for the investor.
Ancillary sector such as cool significantly deregulated. 100% foreign equity permitted.
Opportunities
Demand is expected to grow to 570 billion Kwh by 2001-02 and to 782 billion Kwh by 2006-07. Over the 10 year period from 1997-2007, a total capacity addition of 98,000 MW is envisaged, entailing an investment of Rs. 5,750 billion in power generation, transmission and distribution.
The specific project opportunities expected in the near future include:Liquid Fuel Based Projects using low sulphur heavy stock (LSHS), furnace oil (FO), heavy petroleum stock (HPS), Naphtha, Vacuum Residue, Condensate and Orimulsion are permitted by the Government. Import of liquified natural gas (LNG) is also being considered for setting up large capacity combined cycle power plants, Transmission projects for power transfer are available for competitive bidding by the Central Transmission Utility (Power Grid) and State Transmission Utilities (SEBs)/Grid Corporations). The transmission system project are being identified for competitive bidding by the Central and State Transmission Utilities.
Attractive investment opportunities are likely to develop in distribution of power as several State governments have agreed to allow the gradual entry of the private sector in distribution.

Non-Conventional Energy Sources
Investment Policy
Foreign Investors can enter into a joint venture with an Indian partner for financial and/or technical collaboration and also for setting up of renewable energy based power generation projects. The liberalized foreign investment approval regime is aimed at facilitating foreign investment and transfer of technology through joint ventures.100% foreign investment as equity is permissible.
Government of India encouraging foreign investors to set up renewable energy based power generation project on Build-Own-Operate basis.

GOVERNMENT POLICY
Policy Initiatives ✔ 100 percent foreign equity participation is allowed under the automatic approval
route in all segments of the industry (except atomic energy).✔ Generation and distribution power projects of any type and size are allowed ✔ The electricity act 2003 allows trading in power and provides for further
deregulation.✔ A renewable license period of 30 years has been set.✔ Return on equity up to 16 percent is assured at 68.5 percent PLF for thermal
power plants. Similar incentives are provided for hydroelectric power projects.✔ Import duty at the concessional rate of 20 percent has been set for import of
equipment.✔ The government allows a 5-year tax holiday for power generating projects with an
additional five years in which a deduction of 30 percent taxable profits is allowed.
Major Policy Initiatives to Streamline the Process of Project Development
Captive Power Plants: under the electricity act 2003, captive power plants, including group captive, have been freely permitted. The act provides that any person may construct, maintain or operate a captive generating plant and dedicated transmission lines. Further, under the provisions of the act, every person, who has constructed a captive generating plant and maintains and operates such plant, shall have the right to open access for the purpose of carrying electricity from his captive generating plant to the destination of his use subject to the availability of transmission capacity.
Open Access to Transmission: under the provisions of electricity act 2003, open access in transmission has been introduced to promote competition amongst the generating companies who can now sell to different distribution licensees across the country. Open access has been made available to captive generating plants subject to availability of transmission capacity.
No Techno-Economic Clearance for Thermal Generation: generation has been delicensed under the Electricity Act 2003. The requirement of techno economic clearance of CEA for thermal power plants has also been done away with. The intention is to provide enough freedom and flexibility in the system for promoters of power plants to put up generating stations.
Setting up of Mega Power Projects: to facilitate setting up of large sized thermal power plants in the country and in order to derive the economies of scale, the Ministry of Power issued guidelines in November 1995 for setting up of mega power projects. Power projects having a capacity of 1000MW or above and supplying power to more than one state were defined as mega projects. After considering the experience of this policy, the policy was revised in 1998. Under the revised policy, specific inter-state and inter-regional mega power projects
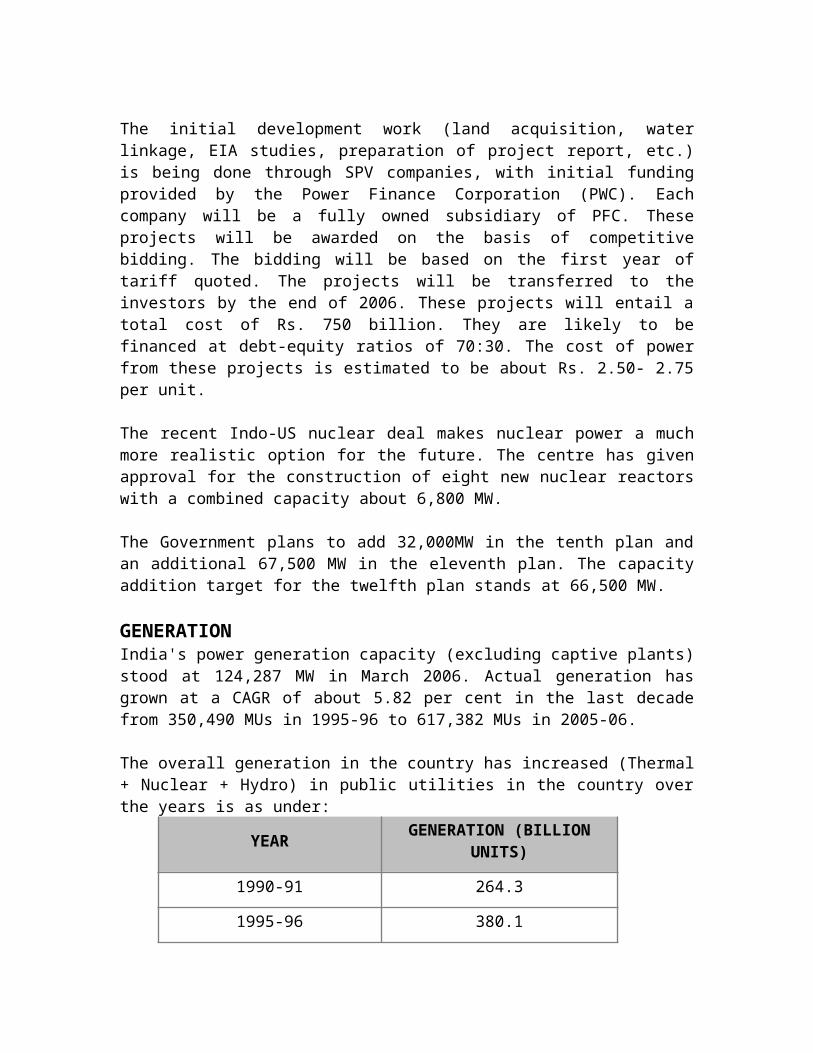
were identified for being developed in both- public and private sector. A Power Trading Company (PTC) has been established to purchase power from the private sector mega projects and sell it to the beneficiary states. The policy has been further liberalized and with effect from 1.3.2003, all inter-state projects with a capacity of 1000MW and above for thermal and 500 MW and above for hydel projects are being treated as mega power projects subject to fulfillment of required conditions and would be extended the concession of "Zero" customs duty on import of capital goods.
Automatic Approval for Foreign Direct Investment (FDI); in order to facilitate FDI, automatic approval (RBI route) for 100 percent foreign equity without any upper ceiling on the quantum of investment is permitted in all sectors of the power sector, i.e., generation, transmission and distribution of electricity.
Generating Company Permitted to Distribute Electricity in Rural Areas: Section 14 of the Electricity Act, 2003 allows any generator of electricity to distribute electricity in a rural area without the requirement of any license, subject to compliance with measures as may be specified by the Central Electricity Authority under section 53.
Setting up of Independent Regulatory Mechanism: CERC and SERC
The Central Electricity Regulatory Commission (CERC), an independent statutory body with quasi-judicial powers, was constituted on 25th July 1998 under the provisions of section 76 of the Electricity Act, 2003.
State Electricity Regulatory Commissions (SERC) have been established under the provisions of the ERC Act1998 or under respective state reforms acts. These SERCs have been continued under the provisions of electricity act 2003.
Appellate Tribunal for Electricity: under the provisions of section 110 of the electricity Act, 2003, the Appellate Tribunal for Electricity has been established at Delhi which will hear appeals against the orders of the Adjudicating officer or the appropriate Regulatory Commission under the Act. The Tribunal has become operational from 21st July 2005. The Tribunal comprises of chairperson & judicial member, Judicial Member, 2 Technical Members.

KEY PLAYERS
Players in the Indian power industry are as follows:
Chattisgarh State Electricity Board EMCO Enercon Euromoney Energy Delhi Control Devices Deutz Power FICCI Honeywell HPL Socomec IEEMA IREDA Jaiprakash Industries Jharkhand State Electricity Board KLG Systel Lapp Kabel Megger NDPL NTPC Nuclear Power Corporation of India Powergen Power Grid Corporation Power Trading Corporation Reliance (BSES Rajdhani Power) Rockwell Automation Safcon Suzlon Taurus Powertronics Teledata Informatics Vestas RRB West Bengal State Electricity Board
FUTURE OUTLOOK
Ultra Mega Power ProjectsAs a part of the planned target of 1,00,000 MW of capacity addition by 2012, the government has announced the setting up of five ultra mega power projects (4000 MW each). All these projects are planned to be commissioned during the 11th Plan (2008-12). The government has also provided sops for these ultra mega power projects in the form of extension of tax exemptions under sec 80 IA. All the five plants are coal based; three of them are based on imported coal while the rest are based on indigenous coal.
The Government of India has envisaged a capacity addition of 1,00,000 MW to meet its mission of ‘Power For All by 2012’. Achievement of this target requires the development of large capacity projects at the national level to meet the requirements of a number of States. Recognizing the fact that economies of scale leading to cheaper power can be secured through development of large-size power projects using super critical technology, Ministry of Power, CEA and PFC are working together for development of 7 Ultra Mega Power Projects (UMPPs) through tariff-based competitive bidding. These UMPPs, each with a capacity of about 4000 MW, would also have scope for further expansion. These UMPPs will add about 28,000 MW within a span of 7-8 years and help in achievement of the targets for faster capacity addition. The fund requirement for the proposed 7 projects is estimated to be around Rs.1,25,000 crores. These projects would be awarded to developers on Build, Own, and Operate (BOO) basis. The size of these projects being large, they will meet the power needs of a number of States through transmission of power on regional and national basis.
Apart from these, there are two new ultra mega power projects announced; one each in Orissa and Andhra Pradesh. As per the 70:30 debt-equity norm, funds of around Rs 1,05,000 crs will be needed to be pumped in. This leaves a huge window of opportunity for the financing sector. The government has invited bids for the first five ultra mega power projects. It has also approached the Asian Development Bank (ADB) for funding these projects. Power Finance Corporation has evinced interest in funding one of them. The finance minister had announced in Union Budget 2006-07 that all the projects would achieve financial closure by the end of 2006-07.
The initialing of Power Purchase Agreements (PPAs) between Sasan Power Ltd., & Coastal Gujarat Power Ltd., and authorized representatives on behalf of 22 Distribution Companies of 9 States took place on 9th Oct., 2006 at New Delhi. The beneficiary States are; Delhi, Gujarat, Haryana, Madhya Pradesh, Maharashtra, Punjab, Rajasthan, Uttar Pradesh and Uttaranchal. It is for the first time in the history of Indian Power Sector that PPAs are being initialed for a capacity of this magnitude i.e. 8000 MW.
Lanco Infra has emerged as the lowest bidder for Sasan Ultra mega power plant, which has a capacity of almost 4000 megawatt while TATA Power has emerged as lowest bidders for the Coastal Gujarat Power Ltd.

The initialing of PPAs for 8000 MW capacity addition through tariff-based competitive bidding marks the beginning of a new approach to capacity addition which will facilitate private investment at a faster pace and provide power at the most competitive rates.
Brief details about five the Ultra Mega Power Projects are as below,Ultra mega power projects
Rs CrsProject Units Cost Location Fuel Fuel imports AllocationCoastal Maharashtra
5x800 15,000 Maharashtra Imported coal
Australia, South-east Asia
Rajasthan, MP
Mega Power Ltd Africa or China ChhattisgarhMaharashtraKarnataka
Coastal Karnataka 5x800 15,000 Karnataka Imported coal
Australia, South-east Asia
Rajasthan, TN
Power Ltd Africa or China KeralaMaharashtraKarnataka
Coastal Gujarat Power Ltd
5x800 15,000 Gujarat Imported coal
NA UP, Punjab,
RajasthanHaryanaGujaratMaharashtra
Akaltara Power Ltd
5x800 15,000 Chhattisgarh
Indigenous coal
Sasan Power Ltd 5x800 15,000 MP Indigenous coal
UP, Delhi
UttranchalPunjabRajasthanHaryanaMP, Chhattisgarh
75,000
RECOMMENDATIONS
This is a very important industry, as its growth is directly related to the development of all other sectors of country’s economy. It is a ever growing sector. Non-renewable sources of power generation is the need of the hour and hence, investment in this sector will yield colourful results.

LIST OF COMPANIESFollowing are the short-listed companies in the industry, which can be targeted by HDFC Bank, to establish business relations with. Following companies are sorted from large databases on the basis of following parameter: turnover, networth and profitability. Following companies satisfied the above mentioned criteria:
COMPANY NAME TURNOVER(RS INR CRORES)A B B 29630ABG Heavy Inds. 602ACC Machinery Co 326Advance Power 753Alfa Laval (I) 5778Alstom Projects 9456Amara Raja Batt 3917Anup Engineering 304Areva T&D 8695Ashoka Buildcon 1650Asian Electronic 1558Assam Carbon Pr 367Atlanta 1071Audco India 4649B E Billimoria 1329B H E L 134426Batliboi 1006Bharat Bijlee 3003Biecco Lawrie 345Birla Power Sol. 929Chemtrols 320Controls &Switch 948Crompton Greaves 25416CTR Mfg.Inds. 459Disa India 433ECE Inds. 892Eimco Elecon(I) 910Elecon Engg.Co 4565Elpro Intl. 585EMCO 4053Engineering Proj 5119Engineers India 7927Ewac Alloys 586Flat Product Eq. 2860Flex Engineering 394G R Engineering 495Gansons 387Gei Hamon Inds 691
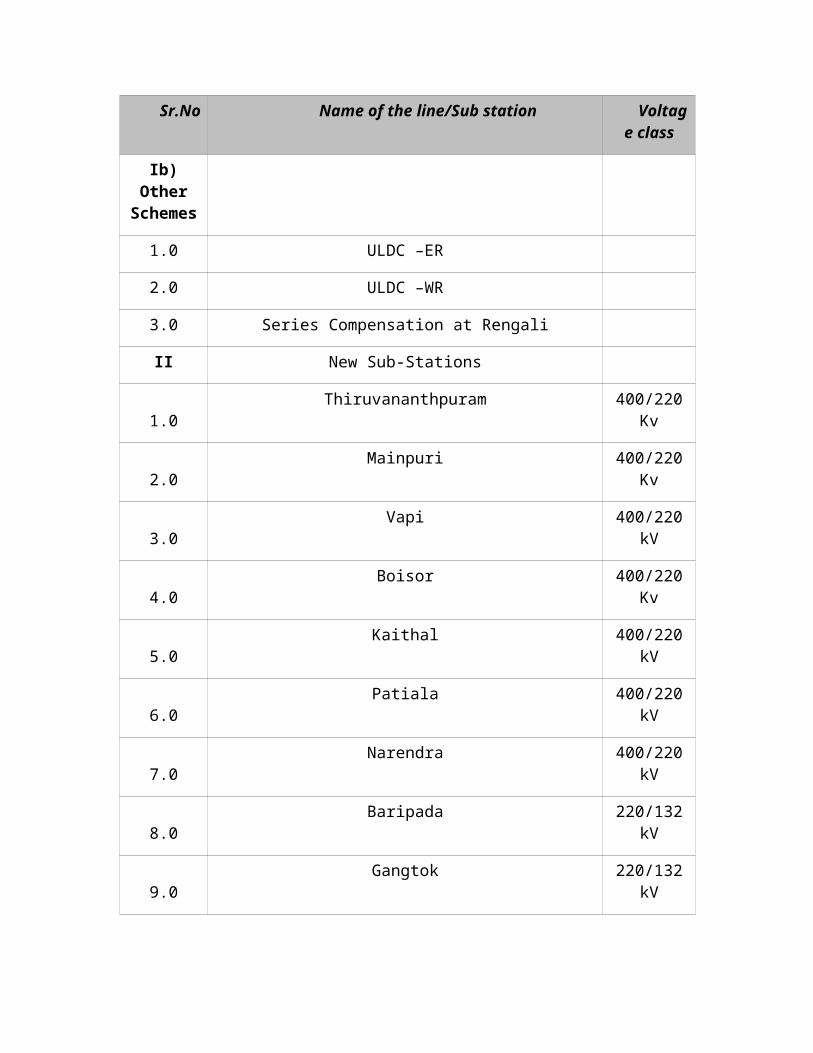
GMM Pfaudler 1016Guj. Apollo Eq. 1060Gwalior Tanks 575Hercules Hoists 641Hind.Aeronautics 45436Hind.Dorr-Oliver 1414Honda Siel Power 1965Howrah Trading 1350I D M C 400IMP Powers 674Indian Oiltank. 1833Intl. Combustion 672Intl. Conveyors 344Jaihind Projects 620Jaya Hind Sciaky 389Jord Engineers 835Jyoti 1039Kabra Extrusion 1005Kanohar Elect. 323Kilburn Engg. 658Kirl. Brothers 9201Kirl. Electric 4140Koch Glitsch 350KSB Pumps 3585L & T-Komatsu 3763Larsen & Toubro 147400Lubi Electricals 456M & P Pumps 618Manugraph India 3180Mazda 365MDS Switchgear 707Mercantile Ind 806Modern Insulator 1404Modison Metals 529New Consol Const 715Oriental Civil 339OTIS Elevator 5182Petron Engg 3027Praj Inds. 2599Precision Gears 429Projects & Dev 420Rajoo Engineers 304Reliance Ind.Inf 645
Rishi Laser Cutt 340

RTS Power Corpn 780San Engg. & Loco 304Sanghvi Movers 1491Sayaji Iron 452Shakti Pumps 477Shanthi Gears 1623Simplex Engg. 897Stewarts & Lloyd 1075Stone India 530Sulzer India 555Sulzer Pumps Ind 1224Sunil Hitech 1327Supreme Infra 463Suzlon Energy 37885TAL Manuf. Sol. 685Tata Liebert 1149Tata Projects 4491Thermax Babcock 1381TIL 4361Toyo Engineering 4672TRF 2146UB Engg. 2291Uhde India 2099Vijay Tanks &Ves 1149Virgo Engineers 447Voltamp Trans 1744Voltas Inter. 1361W I Inds. 592W M I Cranes 360Walchan. Inds. 2528Windsor Machines 1000WPIL 733

ANALYSIS OF
AUTO ANCILLARY INDUSTRY
62

INDIAN AUTO ANCILLARY INDUSTRY
Auto ancillary industry consists of manufacturers in the auto ancillary sector supplying auto accessories to original equipment manufacturers (OEM) and the replacement market. The auto ancillary industry plays a crucial role in the automobile sector as manufacturing vehicles typically involve assembling a large number of components out-sourced from small-scale manufacturers. The Global Auto component industry is currently pegged at USD 1.70 trillion (Source: ACMA Industry Summary Auto Industry)
The Automotive Component Manufactures Association (ACMA) classifies the auto ancillary industry into the following product segments:
Engine Parts (Pistons, piston rings, piston pins, gaskets, carburetors, fuel injection pumps, etc.) - 31%; Drive Transmission and Steering Components (Transmission gears, steering gears, crown wheels and pinions, axles, wheels, etc.) - 19%;
Suspension and Braking Components (Leaf springs, shock absorbers, brake assemblies, etc.) 12%; Body & Chassis (12%);
Equipment (Dashboard instruments, headlights, horns, wipers, etc. ) 10%; Electrical Components (Spark plugs, starter motors, generators, distributors, voltage regulators, flywheel magnetos, ignition coils, etc.) 9%; and
Others (Fan belts, sheet metal parts, plastic mouldings, etc.) 7%. (Source: ACMA)
Sources of DemandThe market for automotive components can be segmented into the following categories based largely on the identity of the buyer:
Demand from Original Equipment ManufacturersThe pattern of growth in the automotive industry has a very significant influence on the performance of the automotive components segment. This is because the components content per vehicle differs significantly across vehicle categories. Demand for larger and higher-value automobiles implies higher demand for ancillary units.
Replacement DemandThe huge unorganized sector typically caters for the demand emanating from the replacement market. The unorganized sector in turn is a low-cost one, given that its fiscal liabilities (in terms of excise duties) are low. As a result, this sector is able to supply the replacement market with significantly lower-priced parts vis-à-vis those produced by the organized sector. The aftermarket is highly competitive for components with a high price elasticity of demand and a tolerance of lower quality standards. A major channel of

marketing and distribution for this sector is the typical roadside mechanic. Interestingly, the unorganized sector has recently shown the technical competence to even replicate some of the relatively sophisticated components.
Five factors primarily influence the aggregate annual demand for replacement parts:
Size of National Vehicle Population: More the number of vehicles, higher the aggregate demand for replacement parts.
Average Age of National Vehicle Population: A longer use of the vehicle would ensure higher replacement demand.
Average Number of Kilometers Driven per Vehicle: The demand for replacement parts would increase as the wear associated with higher mileage of vehicles per year increases.
Road Infrastructure: It is estimated that around 2% of the road length in the country carries about 40% of the road traffic. This has led to deteriorating driving conditions like increased traffic congestion and low vehicular speed, besides higher pollution levels. While increasing fuel consumption, low speed also adds to the wear and tear of most automotive components.
Driving Conditions: Besides congestion, the poor average quality of Indian roads is a significant factor adding to the wear and tear of vehicular parts. For instance, internationally, axles are not high-replacement demand products. However, in India, because of the poor quality of roads, axles have a high replacement demand.
Currently the demand for ancillaries arises from OEM market (60%) and replacement market (40%).

INDUSTRY STRUCTURE
The total turnover of the Indian auto component industry is estimated at US$9 bn in 2006. The industry has the resources to manufacture the entire range of auto products required for vehicle manufacturing, approximately 20,000 components. The entry of global manufacturers into India during the 1990s enabled induction of new technologies, new products, improved quality and better efficiencies in operations. This in turn effectively acted as a catalyst to the local development of the component industry.
The Indian auto component industry is extensive and highly fragmented. Estimates by the Department of Heavy Industries, Government of India, indicate there are over 400 large firms who are part of the organised sector and cater largely to the Original Equipment Manufacturers (OEMs). Another 10,000 firms exist in the unorganised sector that operates in a tier-format. The firms in this segment operate in low technology products and cater to Tier I and Tier II suppliers and also serve the replacement market
Around 4% of the companies operating in the auto component segment cater to 80% of the demand emanating from OEMs. Within the unorganised segment, apart from supplying in the aftermarket, a number of players are also involved in job work and contract manufacturing.
Source: ACMA
The range of products manufactured, with each broad product segment having a different market structure and technology, has negated any possible concentration of the market in a few hands. The market is so large and diverse that a large number of players can be

absorbed to accommodate buyer needs. However, there are a select few large companies that have integrated their operations across the value chain. The key to competing in this industry is through specialisation by product-type, and integrating operations across the related area of specialization.
An interesting insight provided by a study conducted by the National Council of Applied Economic Research revealed that the market segments for auto components included OEMs constituting 33%, local components having 25% with the balance 42% comprising of spurious market including re-conditioned parts. A large part of the spurious or grey market companies are in the unorganised sector.
The regional base of auto component manufacturers is mostly concentrated in the West, North and South of India. This regional concentration of auto component manufacturers has been dictated by the emergence of automobile manufacturers in these regions. The set up of Tata Motors, Bajaj, Mahindra & Mahindra and TVS in the 1950s and 1960s laid the foundation for auto component manufacturers in the West and South, whilst the entry of Maruti during the 1980s created the base in the North.
MARKET
Auto component Industry in India
According to the Automotive Component Manufacturers Association of India (ACMA), the production of Indian automotive components industry was US$ 8.7 billion in 2004-05. In 2004-05 Exports touched US$ 1.4 billion, accounting for 16 per cent of the total production. The industry has been growing at an estimated compounded annual growth rate of 16.4 per cent over the past seven years (1998-2005) owing to strong domestic volumes and robust growth in exports. The Industry is expected to grow at CAGR of 15%till 2012. (Source: ACME, Sourcing Auto Components- Destination India).Even though the Indian automotive components industry is relatively small by global standards, there are close to 400 players in the organized sector and over 5,000 in the unorganized sector competing against each other for market share. However, the share of the organizedsector has increased over time. Players in the organized sector supply the vehicle manufacturers directly. The unorganized sector, on the other hand, mostly has small units, producing low-technology components. (Source: http://www.osec.ch) The production, Investment and Export trend in the Indian Auto components industry during the last 10 years is given below:

Production of Automotive ComponentsTill the 1990s, the auto component industry was solely dependent on the domestic automobile industry to drive the demand for ancillary products. This composition of the market however is undergoing radical changes with global outsourcing gaining momentum. In recent times, exports has emerged as a significant driver of growth, and the demand emanating from global OEMs and Tier I manufacturers has opened new opportunities for the auto component industry in India. At the same time, a bright outlook for the domestic automobile industry also offers significant growth potential, given the fast rising income levels with a rapidly growing middle and high income consumers.
But still, the Auto component industry is heavily dependent upon the domestic automobile industry. According to Society of Indian Automobile Manufacturers (SIAM), the annual production of Indian automotive industry touched 8.46 million vehicles in 2004-05. Two wheelers accounted for 77 percent of the production followed by passenger vehicles comprising cars and utility vehicles (14.5%), commercial vehicles (4%) and three wheelers (4.5%). The organized sector of the industry is fragmented.
According to ACMA, the number of automotive components manufacturers in India total 480 of which sales of only 38 companies fall in the US$ 50-500 million category, 220 companies fall in the US$ 5-5 million category and 222 companies fall in the US$ 1-5 million category. The unorganized sector is also very large and includes counterfeits of reputed brands, a host of local brands and the reconditioning of old components. Geographically, Indian automotive components manufacturers have come up in four clusters:
✔ Bangalore/Hosur/Chennai in south India; ✔ Delhi/Gaziabad/Gurgaon/Faridabad/Lucknow in North India; ✔ Mumbai/ Nasik/Pune in Western India; ✔ Uttarpara/Jamshedpur in Eastern India.
(Source: http://www.ibef.org)

The Auto Component Industry has grown from US$ 3278 Mn. in 1996-97 to about US$10,000 in 20005-06.
Exports – Future untapped outsourcing opportunity
The upheaval in the international auto components industry has presented a window of opportunity for the Indian Auto Component manufacturers.With the Big 3 auto manufacturers in the USA cutting down production in the face of competition from Japan and looking at sourcing cheaper auto components from other parts of the world in order to improve profitability, has resulted in overcapacity in the global automotive component industry especially in the USA. This has resulted in many component manufacturers closing down and others moving production to cheaper locations in China, Eastern Europe and India. General Motors and Ford have stated their intention to increase their off take of components from Asia to US $8bn-10bn per annum (published data) by 2010 from $1.2bn currently.

In the past, India has emerged as a significant exporter of auto parts. From US$ 578 million in 2001-02, overseas sales of Indian companies have jumped to US$ 1.4 billion in 2004-05.
Typically 60% of the exports are to the replacement market and the rest 40% to the OEM segment. In the past, Indian component manufacturers were heavily dependent on this market for the reason that unlike the OEM market, the replacement market has low volumes but high margins. The OEM market, on the other hand, has very large and assured volumes, but low margins and stringent quality norms. As a result, Indian component manufacturers targeted mainly the replacement market for exports.
AUTO COMPONENT INDUSTRY EXPORT (IN US $ MLN.)
ACMA estimates the auto component exports to reach USD 20-25 Bn by 2015 growing at a CAGR of 33.4% Domestic Growth Potential The auto component industry is dependent on the growth of the auto industry. As per ACMA estimates, the passenger vehicle production in India is expected to be 2 million by 2010 and 3 million by 2015. The projected growth rates for multi-utility vehicles and passenger cars are 6% and 11% respectively.
DEMAND AND SUPPLYCurrent trends indicate a smooth run for the auto component industry. In fact, since 2000, this is one sector which has made a global mark and has been identified as a sunrise industry. The industry is transforming from being highly domestic-centric, to a force ready to face global competition.
The factors that will drive growth for the auto component industry are: The growth expected in the domestic automobile industry will give a fillip to the
auto component sector. The Indian automobile industry offers great potential considering the low penetration along with rising income levels and a rapidly growing middle class. These factors will see a boost in demand for vehicles, especially passenger cars and two wheelers. These two segments are estimated to grow at between 10-12% for at least the next five years.
The entry of global OEMs, making India as their manufacturing base, has given a big boost to the industry. For instance, Skoda plans to source parts for its European operations from its Indian base and raise indigenisation level for Indian models to 70%. This trend has also enabled Indian companies to gain a competitive edge in the global market. Further, the model of cluster-based development prominent in this sector will provide economies of scale.
Export of automobiles has also emerged as a key component of growth. Rising exports of Indian-made vehicles like M&M’s Scorpio model, Bajaj Auto’s Bikes, Tata Motors’ City Rover are indirectly increasing the demand for Indian auto components. Also, the export of India-made models of global OEMs like Hyundai’s Santro Xing and Suzuki’s Alto has given a boost to the industry.
De-regulation and the Government’s policy initiatives have facilitated growth and focus has now shifted towards attracting foreign direct investments. Also, the Government’s initiative towards road development will give a boost to demand for vehicles and indirectly auto components.
The Government’s initiatives towards opening up channels of finance.
Investments coming in for research and development will keep the industry abreast of the latest technology.
Entry of global OEMs has transformed the Indian automobile and auto components landscape. India is being perceived as a major market for cars and two wheelers by global OEMs. Before the end of 2006, at least 30 new car models are expected to be launched by foreign OEMs.

SEGMENTAL ANALYSIS
Market share statistics is shown following
GROWTH DRIVERSThe Auto component sector is emerging as the next big business opportunity for Indian companies as global original equipment manufacturers (OEMs) hike procurement plans and domestic companies expand. India has gradually become a sourcing hub for auto companies worldwide. Among the companies outsourcing from India are General Motors, Ford, Daimler Chrysler, Hyundai, Fiat, Toyota, Delphi, Navistar, Visteon, Cummins and Caterpillar.(Source: http://acmainfo.com)
The three main drivers to the growth of Indian automotive components industry are✔ Growth of domestic automobile market✔ the entry of foreign vehicle manufacturers and✔ growing cost pressures in the global automotive industry.
The biggest threat to Indian auto components industry is from China. However, the two countries have unique strengths enabling them to find their own niche in the world market. India has an edge in engineering-driven supply of automotive components industry while China holds an edge in cost-driven components supply.
Export CompetitivenessInternational automotive players with operations in India are increasingly sourcing components from Indian automotive component manufacturers. The demonstrated ability of Indian component makers to make supplies to global automotive manufacturers in the country opens up the possibility of the component makers supplying the same OEMs in other countries as well. Indian component manufacturers continue to enjoy competitive advantages primarily on the strength of the following factors:
Low labour costs: it pulls down the total cost of production, typically in assembled parts such as clutches and lighting equipment.
Less stringent environmental regulations: environmental regulations have rendered the production of parts like castings cost prohibitive in developed countries.
Low minimum economic scales and possession of established technology.
The parts exported by Indian automotive component manufacturers are targeted at following distinct groups of buyers:
1. To international vehicle majors: exports are made largely to their operations in developing countries.
2. To vendors who supply to component manufacturers3. To the replacement market: which accounts for a large proportion of the exports of
components from the Indian market.

At present India's share in the global market is minuscule because even though the Indian automotive components industry is quality-consistent, the export competitiveness of the industry leaves scope for improvement. The automotive components industry is expected to witness an increase in competition and quality pressures in the near future.
According to a Auto Component Manufacturers Association (ACMA)-McKinsey study, India can achieve a 3-4 per cent share of the potential sourcing market (estimated by them at US$ 700 billion) by 2015 given India's strengths, especially its competitiveness in manufacturing labour intensive, skill-intensive parts and parts in evolving technology aggregates among others.
The domestic Auto component market try has a strong correlation with the GDP growth. The GDP has been growing at approximately 7% over the last three years and is expected to touch 8% growth in the coming years. This augurs well for the auto industry, which in turn should boost the Indian auto component industry. India has a strong competitive advantage to become a preferred base for outsourcing as compared to countries like China and the Philippines. India’s strength lies in the following:
Highly skilled and educated workforce and primarily English-speaking engineers and managers
Low cost skilled labour: A skilled person in Europe can earn as much as $29 per hour while skilled labour in India earn as low as euro 5 per day
With High Machine Tool Capability, improving tooling capability, extremely capable component industry and most raw material being locally produced, India provides the opportunity of being an excellent manufacturing base. Together with its high quality, reasonable pricing and special capability in Supplying Smaller Volumes, India is an excellent source for supplying auto components.
INDUSTRY DYNAMICSThe major challenges that the auto industry is presently facing is with respect to its capability to innovate and upgrade in order to remain competitive (both qualitatively andprice wise) in the international market.

ENTRY BARRIERS Following are some of the reasons which act as entry barrier to the automobile industry:
High level of accuracy while manufacturing auto parts
Knowledge of latest technology
Heavy investment in the research and development

RISK AND CONSTRAINTSThough India rides on its inherent strengths, a few risks exist that the auto component manufacturers may have to confront.
A global slowdown can derail the prospects of the industry. Volatility in the prices of metals and other inputs could erode the industry’s cost
competitiveness. Further, global OEMs expect a commitment of 5-10% reduction in prices every year.
Tier I manufacturers taking up greenfield projects overseas. Intense competition from counterparts in other emerging economies may add pressure
on margins of manufacturers.Product substitutes due to fast-changing technology
Addressing these challenges and risks will be crucial to promoting SMEs in the auto component industry. The government has initiated cluster-based development – geographical concentration of enterprises having similar lines of business – which gives rise to external economies and favours emergence of specialised technical, administrative and financial services. This form of networking of small firms is a means of achieving economies of scale. Extending this intitiative further, the government is encouraging banks to adopt a cluster-based lending approach to ease availability of funds to SMEs.
Auto Component Clusters in India State No.
Andhra Pradesh 1
Delhi 1
Gujarat 5
Haryana 3
Jharkhand 1
Karnataka 2
Maharashtra 5
Madhya Pradesh 1
Punjab 4
Tamil Nadu 1

The Indian auto component industry is poised for robust growth till 2010. There is a perceptive exuberance in the industry and growth estimates indicate a booming industry. Going by current trends in production and exports of auto components, indicate a doubling of the domestic auto component industry by 2010. The production of auto components could grow to US$22 bn by 2010. Similarly, India’s exports of auto components could grow to US$4.5 bn as compared to US$1.8 bn in 2005. Expected growth in production and exports of auto components is shown in the graphs below.

INVESTMENT REQUIREMENTSince 2000, the auto component industry has recorded an investment level of Rs 18 bn and has attracted US$ 530 mn in terms of foreign direct investment. Investments in the sector have been growing at 14% per year. In 2005-06, investments touched US$ 4.4 bn, and are expected to grow significantly in future.
Source:ACMA
The Investment Commission has set a target of attracting foreign investment worth US$ 5 bn for the next five years to increase India’s share in the global auto components market from the present 0.4% to 3-4%. This is a sizeable target considering the meagre amount of FDI currently coming into the industry. The changing perception of global auto makers is however fast altering this scenario.
With less than 1% share in the global market, India has tremendous potential to emerge as a supply base. Several global giants like Ford and Toyota have already set up base in India to source auto components. Outsourcing is fast catching up with domestic OEMs as well, with most Indian OEMs today sourcing nearly 70-80% of their component requirements from vendors.
This changing business scenario is leading to an inevitable outcome of consolidation within the industry. The takeover of Kar Mobiles by Rane Engine and of Gero Auto by Uma Precision are few instances. However, such mergers and takeovers will be few and far in between in the auto component industry, unlike the churn out anticipated in other emerging industries – the principal factor being the vastness of the market and the range of products that need to be delivered.
Rather than domestic consolidation, the general trend at present is for the large auto component manufacturers to establish a global presence. Top auto component manufacturers have already set up base in the global markets, especially in Europe. Overall, there have already been 16 acquisitions, with six made in 2005. The industry is the third highest among the Indian industries after IT and Pharma, in acquiring overseas assets. These acquisitions have largely been in Europe and the USA. This trend has been possible as the auto ancillary industry in these countries have been collapsing, thus making it affordable to acquire these companies. Nevertheless, this will provide a base for Indian companies to access the European and American markets.
Indian auto component companies are also setting up bases in other emerging economies, who are potential competitors, for instance, Sundaram Fasteners’ greenfield facility in Zhejiang and Bharat Forge’s joint venture with the Chinese automotive major FAW Corporation. Another auto component manufacturer with plans to enter China is PMP Components, which intends to set up a sourcing base to establish itself as a low cost supplier.
These trends are indicative of the changing business environment in the country. Top auto component manufacturers are gearing to take big risks. Their cross-border vision has established them as global companies. Though the going-global phenomenon is limited to a handful of companies, the smaller companies are also indirectly gearing to this trend by entering into formal manufacturing contracts and specialization.
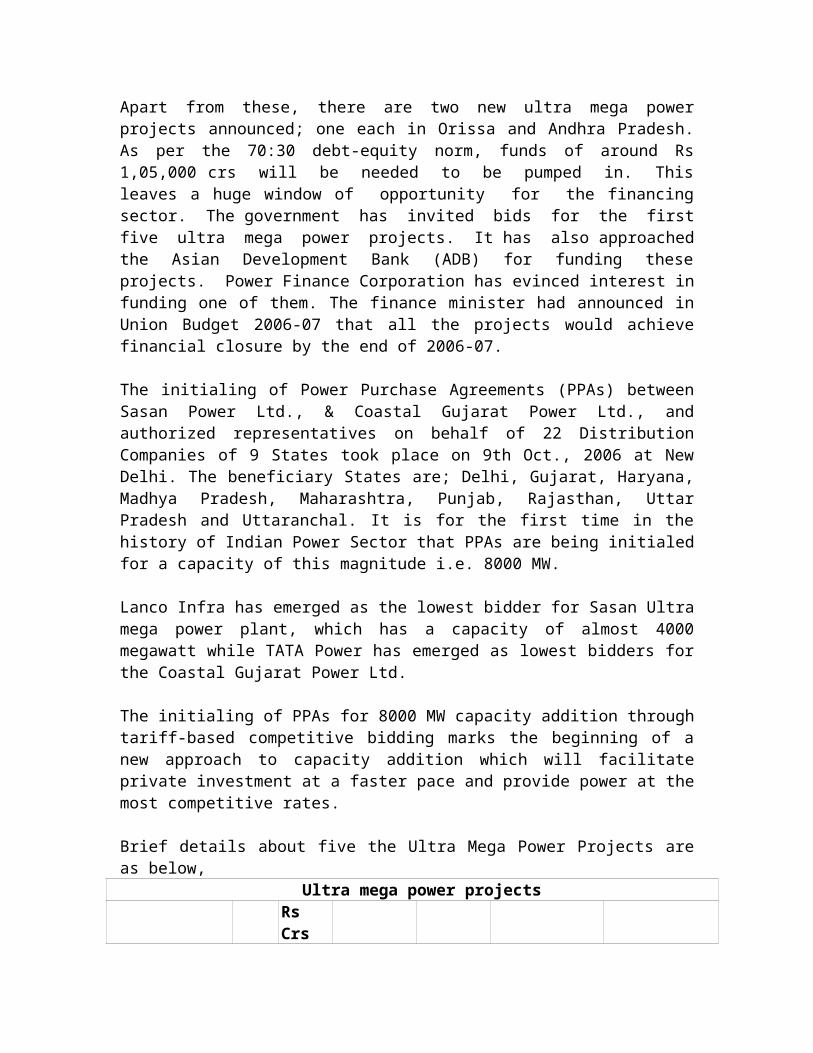
GOVERNMENT POLICYThe auto component industry, comprising of around 500 firms in the organized sector and more than 10,000 firms in the small and unorganized sector has been one of the fastest growing segments of Indian manufacturing. It has the capability to manufacture the entire range of auto parts and has rapidly added to its capacity base.
The initiatives taken by the Government in 2006-07 to give a boost to the automobile sector include: a) reduction in the duty of raw material to 5-7.5 per cent from the earlier 10 per cent, b) setting up of the National Automotive Testing and R&D InfrastructureProject (NATRIP) at a total cost of Rs.1,718 crore for enabling the industry to usher in global standards of vehicular safety, emission and performance standards, and (c) finalization of the Automotive Mission Plan (AMP) 2006- 2016 for making India a preferred destination for design and manufacture of automobile and automotive components.

KEY INDIAN PLAYERSThe major players of the Auto components industry in India (within the brackets their product range) are:
Autolec (oil pumps)Automotive Axles (axles)Bharat Gears (gears) Clutch Auto (clutch) Gabriel India (shock absorbers) IP Rings (piston rings) Kalyani Brakes (brake assemblies) Lumax Industries (rear view mirrors) Mico (fuel pumps) Sundaram Brake Linings (brake linings) Sundaram Clayton (air brake assembly) Sundaram Fasteners (fastners) Swaraj Engines (engines) Ucal Fuel (carburetors) Wheels India (wheel rims) etc.
Bharat Forge's product portfolio includes steel-forgings, machine crankshafts and fronts.
Kalyani Brakes deals with air and hydraulic brake systems, Motherson Sumi with moulded components and door panels and Automotive Axle with axle and brake assemblies.
(Source: Society of Indian Automobile Manufacturers and Ministry of Road Transport)

FUTURE OUTLOOK
These factors portend a robust auto ancillary industry in India and the overall expected good growth will provide several opportunities for the emergence of new enterprises. Extending their reach to global markets is the pre-dominant outlook among the top auto component manufacturers in the country. The vision to compete globally comes from the inherent strengths the Indian auto component industry possesses. Some features are:
Cost reduction of 25-30% in production in the domestic market compared to overseas
Low labour costs Designing, engineering and technical skills Established quality systems Availability of raw materials Adaptability to new technology Investments in research and development, coming in from global OEMs. This
stands out positively in favour of India. Key players are not only willing to invest in R&D but also in mechanical and engineering operations. These investments are expected to increase in the near future.
The Indian auto component industry is poised for robust growth till 2010. There is a perceptive exuberance in the industry and growth estimates indicate a booming industry. Going by current trends in production and exports of auto components, indicate a doubling of the domestic auto component industry by 2010. The production of auto components could grow to US$22 bn by 2010. Similarly, India’s exports of auto components could grow to US$4.5 bn as compared to US$1.8 bn in 2005. Expected growth in production and exports of auto components is shown in the graphs below.
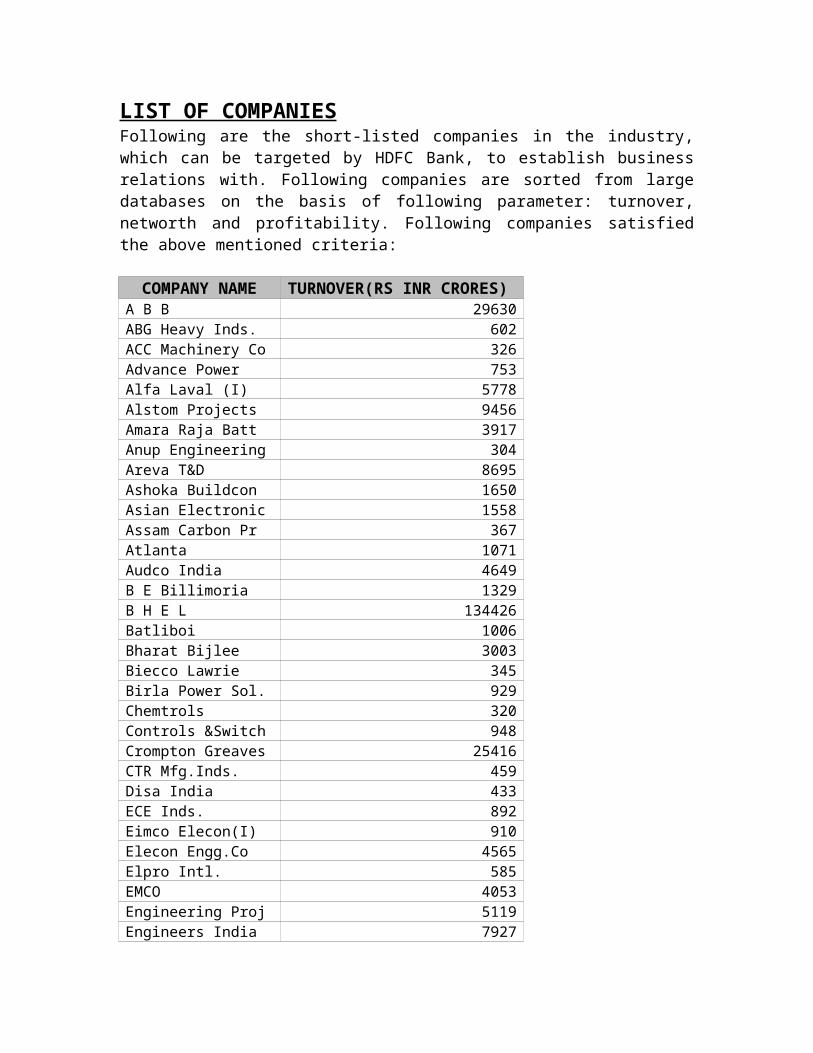

The overall trend is encouraging, but remaining competitive in this changing scenario will be the toughest challenge. The combination of low manufacturing costs along with quality systems would give an edge to companies in terms of pricing and quality. Expansion and diversification will help break into new markets. It would be imperative for these companies, which are largely based on traditional management practices, to imbibe technology in a big way.
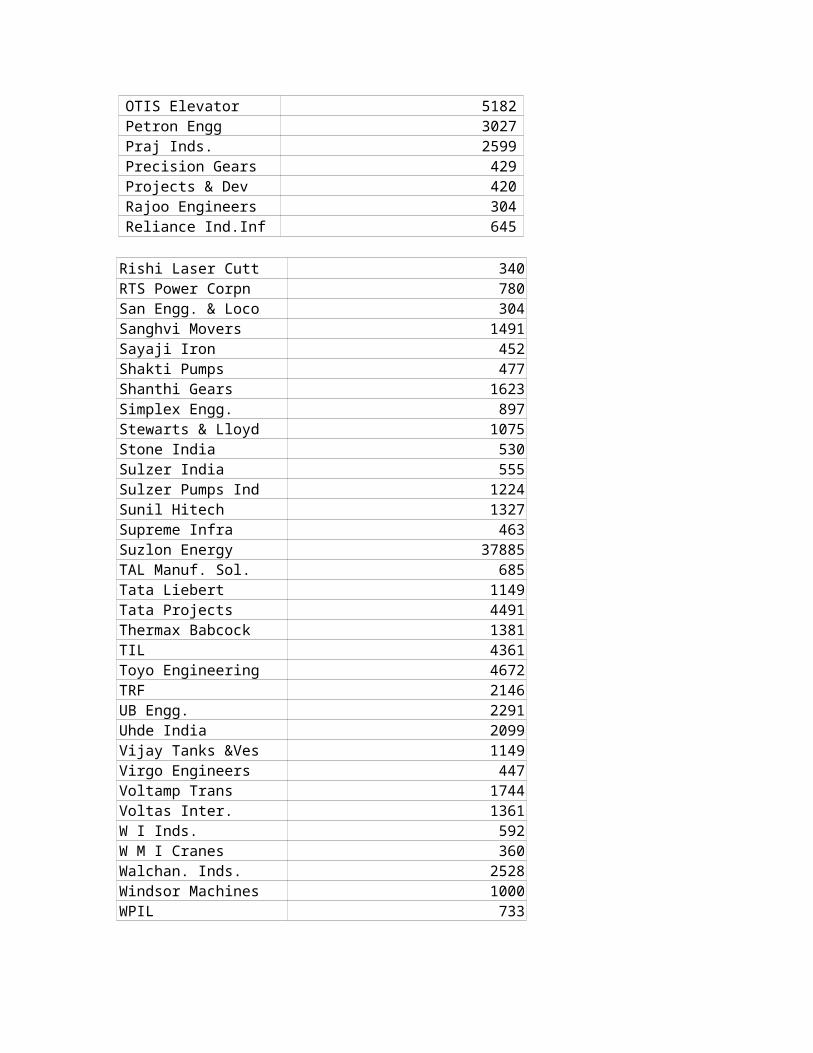
RECOMMENDATIONS
Looking forward, the industry displays tremendous potential in generating employment and boosting entrepreneurship in the country. The spate of new investment plans announced by global and domestic automobile manufacturers promises the emergence of India as a global hub for auto components.
The industry is transforming, and the boost in demand will see the emergence of several new players in the industry. The vast market for auto components, and the diverse products and technology involved ensures a place and role for many. At the same time, the entry of several global automobile manufacturers will bring in more regulation into the industry and see a pruning of the spurious market. Among the smaller players in the unorganized segment, this implies moving away from being standalone companies, to entering into either contract manufacturing or being ancillary units. The newly defined rules are specialization, development and delivery that hold the key to success in the auto component industry.

LIST OF COMPANIESFollowing companies are sorted from large databases on the basis of following parameter: turnover, networth and profitability. Based on the industry analysis of the auto ancillary industry and financial analysis of the players present in the industry, following are the shortlisted companies.
COMPANY TURNOVER (INR IN CRORES)
Alfa Laval 1,478
Atlas Copco 72,069
Automotive Stampings 13,484
Bajaj Auto 737
Bharat Forge 3,976
Century Inka 13,359
Cosmo Films 4,082
Cummins India 7,408
Deepak Fertilizers Ltd. 5,017
Finolex Cables 5,142
Finolex Industries 19,170
Force Motors 6,917
Idea Cellular 891
Kalyani Steels 1,348
KBL 2,204
KOEL 1,351
KPIT Cummins 9,692
Newage Electricals 2,193
SKF Bearings 2,030
Spicer India 3,325
Sudarshan Chemicals 2,400
Suzlon Energy 1,436
TATA Autocomp 19,110
TATA Toyo 1,436
Tech Mahindra 4,565
Thyssen Krup 6,545
Venky’s 3,016

ANALYSIS
OF
THE
TEXTILE INDUSTRY

86
INDIAN TEXTILE INDUSTRY OVERVIEW
The Indian textile industry is one the largest and oldest sectors in the country and among the most important in the economy in terms of output, investment and employment. The sector employs nearly 35 million people and after agriculture, is the second-highest employer in the country. Its importance is underlined by the fact that it accounts for around 4% of Gross Domestic Product, 14% of industrial production, 9% of excise collections, 18% of employment in the industrial sector, and 16% of the country’s total exports earnings. With direct linkages to the rural economy and the agriculture sector, it has been estimated that one of every six households in the country depends on this sector, either directly or indirectly, for its livelihood.
A strong raw material production base, a vast pool of skilled and unskilled personnel, cheap labour, good export potential and low import content are some of the salient features of the Indian textile industry. This is a traditional, robust, well-established industry, enjoying considerable demand in the domestic as well as global markets.
Cotton textiles continue to form the predominant base of the Indian textile industry, though other types of fabric have gained share in recent years. In 1995-96, the share of cotton and manmade fabric was 60% and 27% respectively. More recently, cotton fabrics accounted for 46% of the total fabric produced in 2005-06, while man-made fibres held a share of 41%. This represents a clear shift in consumer preferences towards man-made fabric.
The phasing out of the international quota system is a major turning point for the Indian textile industry – an opportunity and a threat. The textile industry is among the SME intensive sectors in India, largely an outcome of government policies during the early years of Independence. Focusing on promoting domestic employment, large-scale production in the textile industry was curtailed through restrictions on total capacity and level of mechanisation. Several textile items were reserved for the small scale segment. These policies promoted the extensive growth of small scale textile enterprises that were highly labour intensive, though it eroded the competitiveness of the industry and acted as a disincentive for capital investment.
These policies -- pursued from the 1950s to the 1970s -- resulted in the dominance of the decentralised powerloom and handloom sectors in the textile industry, which are mainly small and medium scale enterprises. In fact, many of the large textile companies are also conglomerates of medium sized mills. Statistics released by the Ministry of Textiles shows a highly fragmented industry, except in the spinning sub-segment. The organised sector contributes over 95% of spinning, but hardly 5% of weaving fabric. Small Scale Industries (SSIs) perform the bulk of the weaving and processing operations.In the post-quota regime, the Indian textile industry is poised to become a major player in the US $395 billion global textile and clothing market. With the global retailing industry exploring opportunities for outsourcing, Indian exports are expected to surge from the

current levels of $14 billion to $50 billion by 2010. ICFDC.com presents an analysis of the sector, the key drivers and the opportunities for Indian players.
India is fast emerging as a key player in the $395 billion global textiles and clothing market. Clothing accounts for roughly 60 per cent of the market while textiles constitute the balance 40 per cent. The dismantling of the quota regime has brought the entire market at an interesting stage with players like China and India beginning to make their presence felt. On 1 Jaunary 2005, the WTO Agreement on Textiles and Clothing (ATC) came into operation replacing the earlier Multi-Fibre Agreement (MFA). The phasing out of the MFA is expected to trigger exponential growth for global textile trade.
Currently the US imports nearly 85 per cent of its clothing needs while the EU imports 60-70 per cent. In 2004, the US imported $76 billion of textiles from across the world. China at $18.2 billion was the front runner in meeting this demand with a 24 per cent share of the market, a little less than the total share of Mexico, India, Canada and Indonesia. In the first quarter of 2005, India's textile exports to the US has risen by an estimated 22 percent. A key driver of global textile trade is low cost sourcing of textiles and clothing. Global retailing industry is exploring opportunities for outsourcing to deal with pricing pressures. As a result outsourcing budgets of retail giants like Wal-Mart, JC Penny, Tommy Hilfiger, Marks and Spencer, K-Mart and Tesco are on the rise. China is expected to get a bulk of the advantage due to its economies of scale and superior infrastructure. India too will be a major beneficiary, thanks largely to its low cost labour, its skilled manpower and the fact that it is a low cost sourcing base for cotton. What's more, the anti-surge initiatives launched against Chinese exports will benefit the Indian industry and experts believe that India could emerge as the second largest textile outsourcing hub. Indian exports are estimated to grow from the current levels of $14 billion to $50 billion by 2010. And its share of the global textile trade is expected to double from 3.5 per cent currently over the next five years.
Textile Sector in the Post-MFA Regime
2004 2010 (estimated)
Global Textile Trade $395 billion $600 billion
China's Exports $97 billion $220 billion
India's exports $14 billion $50 billion
The key advantages of the Indian industry are:
India is the third largest producer of cotton with the largest area under cotton cultivation in the world. It has an edge in low cost cotton sourcing compared to other countries.
Average wage rates in India are 50-60 percent lower than that in developed countries, thus enabling India to benefit from global outsourcing trends in labour intensive businesses such as garments and home textiles.
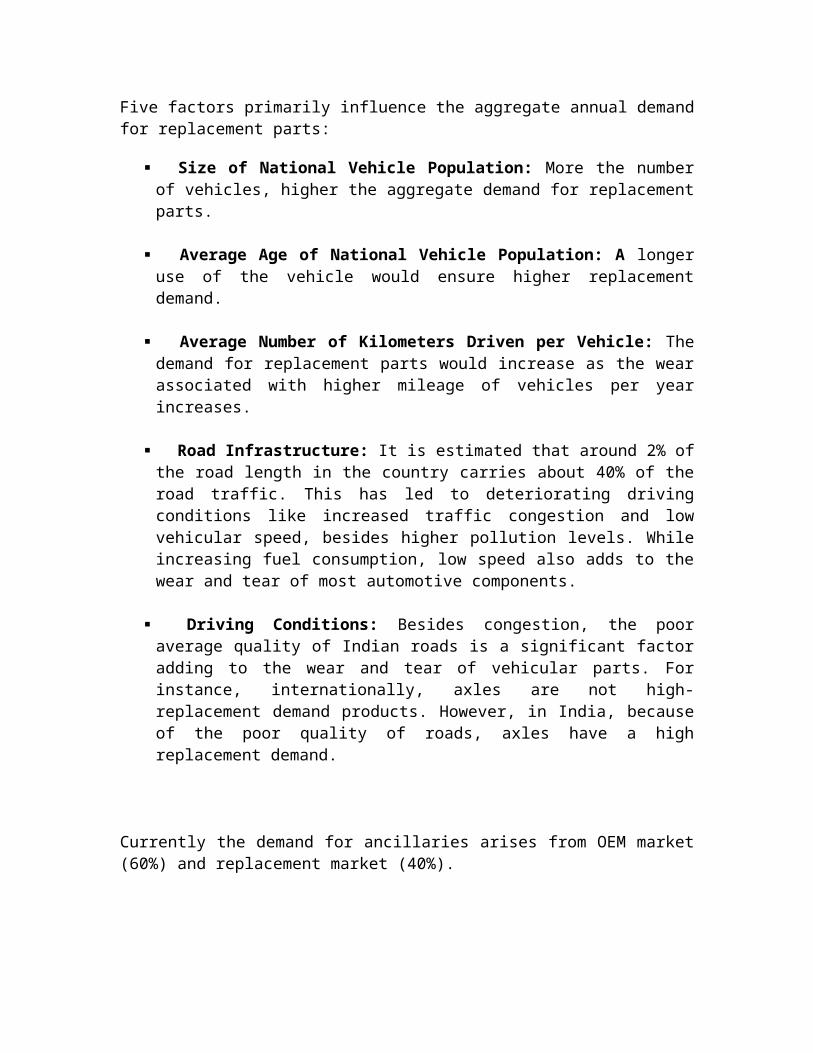
Design and fashion capabilities are key strengths that will enable Indian players to strengthen their relationships with global retailers and score over their Chinese competitors.
Production facilities are available across the textile value chain, from spinning to garments manufacturing. The industry is investing in technology and increasing its capacities which should prove a major asset in the years to come. Large Indian players such as Arvind Mills, Welspun India, Alok Industries and Raymond's have established themselves as 'quality producers' in the global market. This recognition would further enable India to leverage its position among global retailers.
India has gathered experience in terms of working with global brands and this should benefit Indian vendors.
India vis-à-vis Global Textiles
In the global scenario, India is the third largest producer of cotton after the US and China, accounting for 25% of the world trade in cotton yarn. India accounts for 24% of the world installed capacity of spindles and it is one of the biggest exporters of yarns in the global market.
The global textile and clothing industry is estimated to be worth about US$ 4,395 bn and currently global trade in textiles and clothing stands at around US$ 360 bn. The US market is the largest, estimated to be growing at 5% per year, and in combination with the EU nations, accounts for 64% of clothing consumption.
The Indian textile industry is valued at US$ 36 bn with exports totalling US$ 17 bn in 2005-2006. The Indian textile industry has grown by 19% in 2005-06 and is expected to grow at 20% while its export is likely to grow at 25% in the next few years. In 2005-06, India’s share was 4.72% of global textile and clothing exports. The export basket includes a wide range of items including cotton yarn and fabrics, man-made yarn and fabrics, wool and silk fabrics, made-ups and a variety of garments. Quota constraints and shortcomings in producing value-added fabrics and garments and the absence of contemporary design facilities are some of the challenges that have impacted textile exports from India.
India’s presence in the international market is significant in the areas of fabrics and yarn.
India is the largest exporter of yarn in the international market and has a share of 25% in world cotton yarn exports
India accounts for 12% of the world’s production of textile fibres and yarn In terms of spindleage, the Indian textile industry is ranked second, after China,
and accounts for 23% of the world’s spindle capacity Around 6% of global rotor capacity is in India The country has the highest loom capacity, including handlooms, with a share of
61% in world loomage.

INDUSTRY STRUCTURE : INDIAN & GLOBAL
The industry structure is fully vertically integrated across the value chain, extending from fibre to fabric to garments. At the same time, it is a highly fragmented sector, and comprises small-scale, non-integrated spinning, weaving, finishing, and apparel-making enterprises. The unorganised sector forms the bulk of the industry, comprising handlooms, powerlooms, hosiery and knitting, and also readymade garments, khadi and carpet manufacturing units. The organised mill sector consists of spinning mills involved only in spinning activities and composite mills where spinning, weaving and processing activities are carried out under a single roof.
Buyer-Driven Network
The global textile industry, a buyer-driven network, is dominated by retailers, marketers and manufacturers. In the newly defined business environment for textiles, retailers like Zara, H&M, etc. have redefined the life of fashion trends from the earlier five to six months to around two months. In this scenario of such short shelf-life, the small scale operations of Indian SME apparel manufacturers gives them the flexibility to service custom-made orders at low cost. It is likely that India will become a preferred destination for global manufacturers and retailers as well, and big opportunities for SMEs are forthcoming.
Today, apart from the big Indian textile manufacturers like Gokuldas Exports, Alok Industries, Raymonds, Welspun India, Arvind Mills and Madura Garments, several small and medium sized apparel manufacturers have also become significant contributors to the total apparel exports of the country. Cotton knitwear suppliers of Tirupur, hosiery suppliers of Ludhiana and suppliers of home textiles from Tamil Nadu, Kerala and Punjab, among others, have been accepted as high quality and cost effective apparel suppliers in international markets.


Indian textile industry functions in the form of clusters across the country. India has about 70 textile clusters producing 80% of the country’s total textile production. Some of these clusters are very huge like
Panipat, accounting for 75% of the total blankets produced in the country Tirupur, responsible for 80% of the country’s hosiery exports Ludhiana, which accounts for 95% of the country’s woollen knitwear produced.
Some key benefits of a cluster based approach are:
Networking among enterprises Economies of scale Improved bargaining power Technology and skill upgradation Global visibility and being part of the value chain Easier access to finance Greater institutional support.

MARKET FOR TEXTILE PRODUCTS
As in January 2006, there were 1779 cotton/man-made fibre textile mills in the organised sector, with an installed capacity of 34.1 million spindles and 395,000 rotors. Of these, 218 were composite mills which accounted for just 3% of total fabric production, with 97% of fabric production happening in the unorganised segment. Cloth production in the mill sector has fallen from 1,714 million sq mtrs in 1999-2000 to a projected 1,493 million sq mtrs in 2005-06, declining at a rate of 2% per annum. As a result, the number of sick units in the organised segment has also been growing rapidly.
The competitiveness of composite mills has declined in comparison to the powerlooms in the decentralised segment. Policy restrictions relating to labour laws and the fiscal advantages enjoyed by the handloom and powerloom sectors have been identified as two of the major constraints responsible for the declining scenario of the mill sector.
Nonetheless, overall cloth production in the country has been growing at 3.5% per annum since 2000, with growth driven largely by the powerloom sector. Being the largest manufacturer of fabric in the country, the powerloom sector produces a wide variety of cloth, both grey as well as processed. According to the Ministry of Textiles, there are 1.923 mn powerlooms in the country distributed over 430,000 units. The sector accounts for 63% of the total cloth production in the country and provides employment to 4.815 mn people.
The handloom sector is the second-highest employer in the country after agriculture. The sector accounts for 13% of the total cloth produced in the country, not including wool, silk and handspun yarn. The production of handloom fabrics had gone up to 4629 mn sq mtrs in 2005, from 500 mn sq mtrs in the 1950s, representing an annual growth of around 4%. The sector is weighed down by several problems such as obsolete technology,unorganised production systems, low The Man-made textile industry comprises fibre and filament yarn manufacturing units of cellulosic and non-cellulosic origin. The cellulosic fibre/yarn industry is under the administrative control of the Ministry of Textiles, while the non-cellulosic industry is under the administrative control of the Ministry of Chemicals and Fertilisers. XV productivity, weak marketing links, overall stagnation in demand and competition from the powerloom and mill sectors.
Knitting and hosiery units account for around 17% of fabric production in the country. According to data available for the year 2000, India had about 6,000 knitting units registered as producers or exporters and most of these units were registered as small-scale units.
Trade Scenario
According to the provisional DGCI&S data, textile exports during fiscal 2005- 06 stood at around US$17 billion, recording a 22% growth year-on-year. Except for man-made textiles, all segments in the textile industry, including handicraft carpets, wool and silk, have recorded a growth in exports during 2005-06 -- the first year since the phasing out of the quota system in the global market.
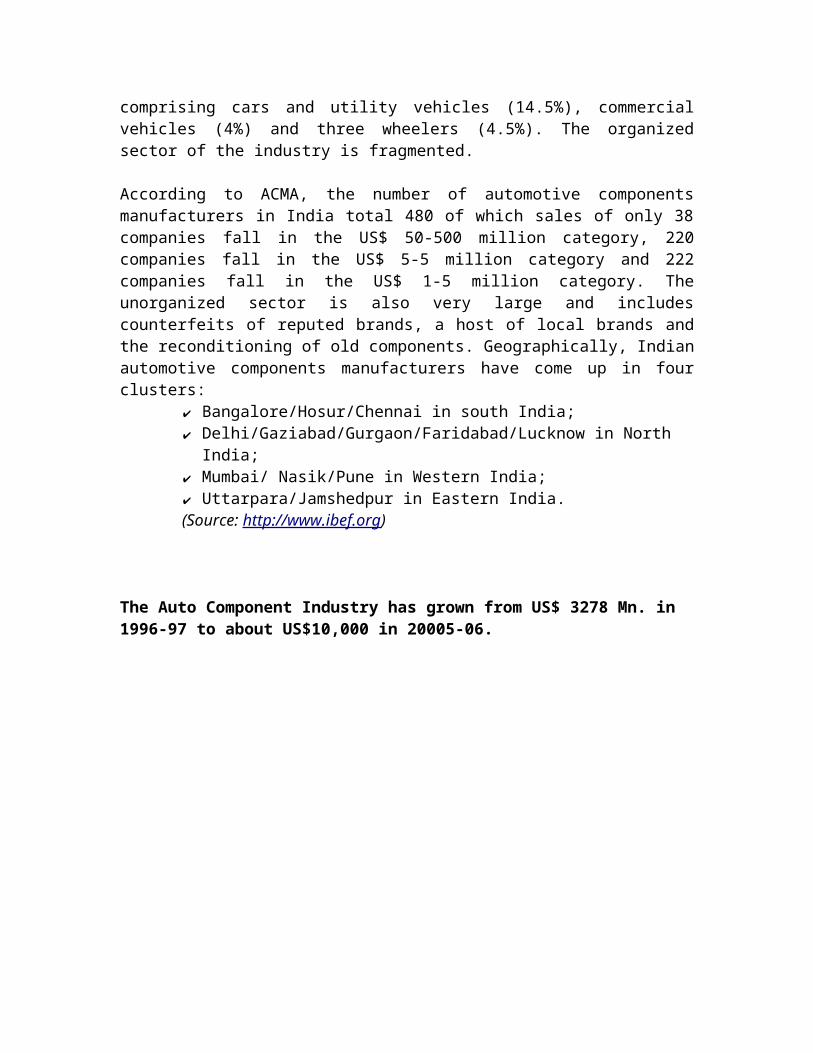
Readymade garments (RMG) is the largest export segment, accounting for a considerable 45% of total textile exports. This segment has benefited significantly with the termination of the Multi-Fibre Arrangement (MFA) in Jan 05. In 2005-06, total RMG exports grew by 29%, touching US$ 7.75 bn. In 2003-04 and 2004-05, the growth in RMG exports was 8.5% and 4.1% respectively. The jump in 2005-06 exports has been largely due to the elimination of quotas.
Exports of cotton textiles -- which include yarn, fabric and made-ups -- constitute over 2/3rd of total textiles exports (excluding readymade garments). Overall, this segment accounts for 26% of total textile exports. According to the Ministry of Textiles, in 2005-06, total cotton textile exports Source: Ministry of Textiles, GoI Source: Ministry of Textiles, GoI XVI were worth US$ 4.5 bn, implying a growth of 27% over the exports in 2004-05, which were worth US$ 3.5 bn.
Man-made textiles exports have witnessed a decline of 2.5% in 2005-06. Between 1999-2000 and 2002-03, man-made textiles exports were growing at around 30% per annum. The slowdown began since 2003-04 and has been on the decline since.
Major export destinations for India’s textile and apparel products are the US and EU, which together accounted for over 75% of demand. Exports to the US have further increased since 2005, post the termination of the MFA. Analysis of trade figures by the US Census Bureau shows that post-MFA, imports from India into the US have been nearly 27% higher than in the corresponding period in 2004-05.

DEMAND AND SUPPLY
The following graph shows the trend of demand in various segments of textile industry (the information available is only upto 2002 but the demand since then is increasing, especially in man- made fibers section)
Source: www.emeraldinsight.com
Supply, in textile segment is always more than the demand for it. The reason behind this mismatch in demand and supply is the low entry barriers for the industry and no expiry date of the products.

SEGMENTAL ANALYSIS
Textile industry can be broadly divided into 3 segments viz. ✔ Spinning (conversion of Cotton/ Fibre to Yarn)✔ Weaving (Yarn to Fabric) ✔ Garment manufacturing (Fabric to Garments).
Trends in ProductionYarn and fabric production has been growing annually at 1.9% and 2.7% respectively, since 2000. Yarn production has increased from 3,940 mn kg in 1999- 00 to 4,326 mn kg in 2004-05. Man-made yarn has driven much of this, showing a robust growth of 4.3% in the last five years. Spun yarn production and the cotton yarn sector have also grown, albeit less impressively, recording growths of 2.4% and 0.6% respectively.
Source: www.fashion2fibre.com

Fabric production has been growing at 2.7% annually between 2000 and 2005, driven primarily by the smallscale, independent powerloom sector. Growth in the 100% non-cotton segment touched 5%, followed by cotton fabric at 1.5% and blended fabric at 0.3%. Fabric production touched a peak 45,378 million sq mtrs in 2004-05, and in Nov 06, production recorded a robust 9% growth compared to the corresponding period in the previous year.
Source: www.fashion2fibre.com

Segment-wise Exports, 2002-2006 (US$ bn)
Category 2002-03 2003-04 2004-05 2005-06
Cotton Textiles 3.62 3.68 3.54 4.49
Man made Textiles 1.53 1.86 2.05 2
Silk 0.49 0.56 0.59 0.69
Wool 0.29 0.35 0.42 0.47
Ready Made Garments 5.75 5.92 6.02 7.75
Handicrafts 1.42 1.11 1.01 1.24
Jute 0.2 0.25 0.28 0.29
Coir & Coir Manufactures 0.08 0.08 0.11 0.13
Source: www.fashion2fibre.com
INDUSTRY DYNAMICSIn textile industry, manufacturers require more than production efficiencies to survive in the years ahead. They need professionalism to undertake hard -core marketing, focused and consistent positioning, and most of all a keen understanding of fashions and trends to cash in on advantage of competing in a world without quotas.
Above all, a change in mindset backed by consistent efforts in the rough and tough environment of quota-less competition, will be required to attain a standing in the world of garments market. Without them the global buyers will wait and watch just long enough before moving over to more suitable supply centers.

GROWTH DRIVERSDrivers of exports
Rising outsourcing budgets of retail giants Indian companies evolving from mere converters to vendor partners of global
buyers Large outsourcing orders is helping Indian companies build capacities, lower per
unit cost and become competitive Imposition of caps on certain import segments from China by EU and US given
the surge in Chinese exports has opened up opportunities for India Skilled manpower to handle orders with complex designs.
Drivers of domestic market Growing young population Rising household income levels Growth of organised retail
Several government initiatives targeted to attract investments Technology Upgradation Fund Scheme Scheme launched in 1999 to provide firms access low interest loans for
technology upgradation and setting up new Units with state-of-art technology Scheme has disbursed INR 91.61 bn till 31st December 2005
Policy related to foreign investment Upto 100% foreign direct investment allowed in textile and apparel
manufacturing industry, with approval of the Foreign Investment Promotion Board
Companies free to set up fully-owned sourcing (liaison) offices, as well as marketing operations
Upgrading infrastructure “Scheme for Integrated Textile Parks”, based on public-Pvt partnership model to
build world class infrastructure facilities Technology Mission on Cotton (TMC), focusing on Cotton R&D, dissemination
of technology to farmers, improvement of market infrastructure and modernisation of ginning and pressing sector
Positive developments in the Textile Policy Reservation for small scale sector, especially key segments removed over last few
years Fiscal anomalies in terms of excise duty structure removed
Product development and design capabilities Several institutes in India for textile development, the major one being National
Institute of Fashion Technology (NIFT) Several leading colleges also offer courses in Textile Engineering

Business opportunities for foreign players in Indian textile industry Top 10 buyers in India (Carrefour and Synergies India, Federated, Fifth Avenue,
Gap, H&M, JC Penny, Li & Fung, The Children’s Place, Wal-Mart) account for 35% of total textiles sourced from India. Other major companies include El Corte, Ecko, Kellwood, VF Corporation, Tesco, Next, Karstadt-Quelle
Partner with Indian vendors to import from India, by nominating large Indian companies having credibility in terms of capacities and quality
With Indian consumers increasingly getting exposure to international fashion trends, potential exists for export of lifestyle brands of garments and accessories to India
Brand licensing/ franchising Brand licensing - Hugo Boss, Tommy Hilfiger, Mango, Lovable, Nike, Lacoste Master franchisee - Marks & Spencer, Crocodile
Growth Segments for Indian Players
The domestic market is expected to boom with demand for high value branded items and household items showing a sharp increase. Not surprisingly, yarn manufacturers are shifting away from exports and focusing on domestic markets. The industry is ready to utilise high quality yarn in the domestic market, which was earlier meant exclusively for exports.
The global home textiles market, estimated at US $ 70 billion offers tremendous opportunities for Indian players. The US and EU imports nearly $30 billion worth of home textiles. The US market is growing at 5 per cent per year while the EU market is growing at an estimated rate of 9-10 per cent. Japan, Australia, New Zealand are also large consumers of home textiles. McKinsey estimates that the global trade in home textiles will grow from $8.6 billion to $23 billion in 2010. India's presence in the US home textile market is growing. India is the largest supplier of terry towels, bed linen and second largest vendor of cotton made-ups to the US markets. China, Pakistan, Bangladesh and Vietnam are major competitors for India in this segment. In the post-quota regime, India's share of US imports has grown (between January and August 2004) for sheets (20%) terry towels (21%), pillowcases (19%) and total made-ups (11%).
While China is slated to be the biggest beneficiary in terms of market share in US apparel imports, India and Pakistan are expected to benefit substantially as well. China's share in total US apparel imports is 16 per cent compared to India's 3.5 per cent. In cotton apparel imports, China's share is 10 per cent while India's is 5 per cent, in wool apparel, the shares are 9 per cent for Chinese products and 6 per cent for Indian. In man-made fibre apparel, China's share is 15 per cent compared to India's 2 per cent.
Another segment in which India is a strong player is the embroidery market. The Indian market for embroidery is valued at Rs 7.5 billion and is growing at 18 per cent per year. This is a highly fragmented market with the organised sector constituting 40 per cent of the industry. Demand for embroidery is on the rise and export to countries like the US, UK, Africa, Middle East offers a huge market for embroidery products.
ENTRY BARRIERSThere exists no such entry barrier for the new entrant in any segment of the textile industry. Reasons for the low entry barriers are:
Heavy investment is not required to enter the industry. Flexible quality standards. No expiry date for the products. Skilled, cheap and seasonal labour.
Due to almost no entry barriers, competition in this industry is always increasing with new players coming into the picture. Hence, the industry is very dynamic and position of players in the market is not very static.

RISKS AND CONSTRAINTSChallenges for Indian Companies
While Indian exports to the US have risen 22 per cent in the first quarter of 2005, profits are sliding as prices have dropped 8-20 per cent and the industry is on the verge of a shakeout. With importers preferring suppliers that have 'vertical' production systems rather than dispersed production facilities, Indian exporters need to shore up their mass production techniques. Of the 1,500 Indian exporters only 15 have turnovers of $50 million-plus. Infrastructure development is the need of the hour. Power and water contribute to nearly 37 per cent of total production costs. In contrast, in China, this cost comprises just 24 per cent. India also has to deal with inefficient port handling facilities.
Labour laws also comprise a stumbling block in the growth of Indian textile companies. Political considerations have prevented successive governments from instituting an exit policy. As a result, manufacturers cannot employ short duration labour as they cannot lay them off when the global trade cycle turns. Low labour productivity is also another constraint.
On the technology front, the Technology Upgradation Fund Scheme has been instituted by the government in an effort to encourage manufacturers to go in for enhanced technology. The grant during the current fiscal has been enhanced to nearly two-and-a-half times the amount that was granted the year before. But this does not get utilised in the appropriate manner as the technology imported is obsolete and virtually no new technology is developed indigenously.
While China is clearly the leading exporter in the world of textiles and clothing, China and India are not direct competitors. While China mainly uses man-made fibre and serves mass markets, India essentially produces natural fibre and caters to niche markets. India is now the No. 1 producer of man-made fibre, thanks to Reliance Industries, but is only No. 3 in cotton. A garment-driven and export-led strategy is expected to help the Indian industry to grow to a $85 billion industry by 2010, according to a CRISIL report. The focus should be on moving up the value chain instead of exporting intermediate stage products, say industry analysts. The investments needed to make the Indian industry a dominant player in the global textile market is estimated to range between $15 and $30 billion. Increase in foreign direct investment will benefit the industry but this is largely dependent on the reforms process.

INVESTMENT REQUIREMENTS
Textile industry requires an investment of Rs1,40,000 crore to become US$85 billion in size by 2010. For 2005-06, the industry witnessed an investment of Rs15,000 crore and for the fiscal 2006-07, the investment is expected to double to Rs30,000 crore. The weaving segment has already witnessed high investment in 2005-06.
Investments in the textiles sector can be assessed on the basis of three factors:
Plan schemes such as the Technology upgradation Funds Scheme (TUFS), Technology Mission on Cotton, Apparel Parks, etc. -- Under the TUFS scheme, a total of Rs 916 bn has been disbursed for technology upgradation. There are around 26 Apparel Parks in eight states in India, with a total estimated investment of Rs 134 bn
Industrial Entrepreneurship Memorandums implemented from 1992 to Aug 06, amounting to Rs 263 bn
Foreign Direct Investments inflows worth US$ 910 mn have been received by the textile industry between Aug 91 and May 06, which account for 1.29% of total FDI inflows in the country.
Though significant investments are being made in the textiles segment, the bulk of them are in the spinning and weaving segments. A cumulative total of US$ 6.67 bn in investment is expected by 2008. Of this, more than two-thirds is expected in the spinning and weaving segments, while only 25% is expected in processing and garment units.

Source: www.fashion2fibre.com
The government has been very supportive, with textile ministry organizing various road shows around the world to attract FDI in the sector. It has also plans to extend Textile Upgradation Fund Scheme beyond 2007; it has approved to provide an additional Rs1000 crore during the current fiscal, as the already-allotted Rs535 crore was exhausted in first quarter of the fiscal 2006-07.

GOVERNMENT POLICIES Recognizing the immense potential of the textile industry to spur economic growth and drive exports, the Indian government has taken initiatives to encourage investment and enhance global competitiveness of the sector. In the recent Budget reforms the textile sector has been given some major concessions. Prominently, the government has removed the disparity in excise duty structures between organized and unorganized sector. Reduction of custom duty on textile machinery, polyester, viscose, and garment making machinery further acted as an impetus to the industry. The excise duty on polyester has also been reduced from 24 per cent to 16 per cent, which has brought the duty structure in line with ASEAN countries, providing filament yarn processors with optional excise duty of nil or 8 per cent excise duty with cenvat credit.
Government Initiatives
The Government’s role in the textile industry has become more reformist in nature. Initially, policies were drawn to provide employment with a clear focus on promoting the small-scale industry. The scenario changed after 1995, with policies being designed to encourage investments in installing modern weaving machinery as well as gradually eliminating the pro-decentralised sector policy focus. The removal of the SSI reservation for woven apparel in 2000 and knitted apparel in 2005 were significant decisions in promoting setting up of large-scale firms. Government schemes such as Apparel Parks for Exports (APE) and the Textile Centres Infrastructure Development Scheme (TCIDS) now provide incentives for establishing manufacturing units in apparel export zones.
The new Textile Policy of 2000 set the ball rolling for policy reforms in the textile sector, dealing with removal of raw material price distortions, cluster approach for powerlooms, pragmatic exit of idle mills, modernisation of outdated technology etc. The year 2000 was also marked by initiatives of setting up apparel parks; 2002 and 2003 saw a gradual reduction in excise duties for most types of fabrics while 2004 offered the CENVAT system on an optional basis. The Union Budget of 2005-2006 announced competitive progressive policies, whose salient features included:
A major boost to the 1999-established Technology Upgradation Fund Scheme for its longevity through a Rs 4.35 bn allocation with 10% capital subsidies for the textile processing sector
Initiation of cluster development for handloom sector Availability of health insurance package to 0.2 mn weavers from 0.02 mn initially Reduction in customs duty from 20% to 15% for fibres, yarns, intermediates,
fabrics and garments; from 20% to 10% on textile machinery and from 24% to 16% in excise duty for polyester oriented yarn/polyester yarn.
Reduction in corporate tax rate from 35% to 30% with 10% surcharge Reduction in depreciation rate on plant and machinery from 25% to 15% Inclusion of polyster texturisers under the optimal CENVAT rate of 8%

To meet the challenges of the post-MFA setup, the Government of India initiated a reforms process which aimed at promoting large capital investments, pruning cumbersome procedures associated with the tax regime, etc. The Textile Vision 2010 was born as a result of interaction between the government and the industry which envisages around 12% annual growth in the textile industry from US$ 36 billion now to US$ 85 billion by 2010. Additionally, Vision 2010 also proposes the creation of an additional 12 million jobs through this initiative.
KEY INDIAN PLAYERS
Welspun India is Asia's largest terry towel manufacturer and fourth largest in the world. It supplies to leading global retailers, meeting 15 per cent of Wal-Mart's terry towel requirements, 85 per cent of Tom Hilfiger's and 100 per cent of Shopko's. It has plans to double its terry towelling capacity to 23830 TPA, enhance yarn capacity by 25000 spindles and introduce bed linen with a 35 million metres capacity and has earmarked a Rs 6 billion budget for its expansion plans.
Alok Industries has the largest processing capacity in India and offers fully integrated facilities for yarn texturising, weaving, knitting, processing, made-ups and garments. It has initiated plans to expand capacities across all segments by investing Rs 10 billion. It is focusing on home textiles and garments, which will contribute to nearly 50 per cent of its revenues by 2007. It has already got an impressive client list that includes brand names such as JC Penney, Tommy Hilfiger, TARGET, Wal-Mart and international buying houses such as Britannica Home Fashions, Elite Home Products, etc.
Arvind Mills boasts of a wide product range in value added fabric, from fabric to garments in denim, shirting and knits. It is a supplier to brands such as GAP, Marks & Spencer, Levis, Tommy Hilfiger and Nike and is upgrading its garment capacities to 14.3 million pieces per annum. Arvind Mills dominates the Indian denim market with a 72 per cent share of the estimated 80 million metres denim market.

FUTURE OUTLOOK
Expectations are high, prospects are bright, but capitalizing on the new emerging opportunities will be a challenge for textile companies. Some prerequisites to be included in the globally competing textile industry are:
Imbibing global best practices Adopting rapidly changing technologies and efficient processes Innovation Networking and better supply chain management Ability to link up to global value chains.
The Indian textiles industry has established its supremacy in cotton based products, especially in the readymade garments and home furnishings segment. These two segments will be the key drivers of growth for Indian textiles. Readymade garment exports were worth US$ 8 bn in FY06 and will cross US$ 16 bn by the end of 2010, assuming a conservative growth of 15% per annum. According to estimates, investments in textiles are expected to touch US$ 31 bn by 2010.
The readymade garment segment will be the principal driver of growth even in the domestic industry. The changing preferences of Indian consumers -- from buying cloth to readymade garments -- have prompted several companies to move up the value chain into the finished products segment.
Strategic Initiatives
Business integration -- especially forward integration -- by the larger textile companies has been prominent among Indian companies. Several companies that are engaged in fabric manufacturing are now keen to enter the readymade garments space. A recent entrant is Siyaram, which launched its readymade garments range in Nov 06, following suit with other majors like Century Textiles and Raymond's.
Most of the large textile companies have opted for an inorganic growth strategy to scale up operations. Acquisition is the most logical step towards integrating operations and building the value chain. Domestic acquisitions are on the rise, while acquiring foreign assets is yet to gain traction. Some recent domestic acquisitions that have been executed in 2006 include KSL & Industries’ acquisition of Deccan Cooperative, and Ambattur Clothing taking over Celebrity Fashions. Another growing phenomenon observed among Indian textile companies is the setting up of manufacturing facilities in strategic regions outside India, where they can avail of duty concessions and reduce export lead-time. Zodiac and Ambattur Clothing have set up facilities in the Gulf region to cut down on export delivery schedules to the European and US markets. Raymond's has set up a unit in Bangladesh to avail of the zero duty access to the EU.

This trend is seen primarily among the large domestic players, who are trying to achieve sizable scales in order to win orders from the large retailers in the US and EU. Global retailers prefer large-sized companies that can scale up capacities consistently, keep up with delivery schedules and meet their growing demand. They have clear preferences for companies with integrated design, process and manufacturing facilities.
An interesting commonality in countries with successful garment exports is that they have a much lower level of sub-contracting than India. A study during the 1990s found that apparel firms Future Outlook XXXIII in India subcontracted 74% of their output, as compared to only 11% in Hong Kong, 18% in China, 20% in Thailand, 28% in South Korea and 36% in Taiwan. Consequently, these countries have a wider base of exports and have done very well in the market for large volumes of uniform products.
Foreign Acquisitions by Indian Textile Companies
Period Acquirer Acquired Company
May 01 Arvind Mills License Of ‘Healthtex’ Kidswear Brand Of Vf Corpn (USA)
Jun 01 Ambattur Clothing Colourplus (UK)
Sep 01 Raymonds Regency Texteis Portuguesa Limitada (Portugal)
Sep 03 Jindal Polyester Rexor Group (France)
Dec 04 JCT Ltd CNLT Malaysia (Synegal)
May 05 Reliance Group ICI Pakistan Ltd (Pakistan)
Jun 05 Zodiac Clothing Shirting Company Located In AlqozeIndustrial Area (Dubai)
Dec 05 GHCL Dan River (USA)

Period Acquirer Acquired Company
May 06 Malwa Industries Emmetre Tintolavanderie Industrial (Italy)
May 06 Malwa Industries Third Dimension Apparels (Italy)
Jul 06 Welspun India CHT Holding (UK)
Jul 06 Spentex Industries Tashkent-To’yetpa Tekstil Ltd (Uzbek)
Jul 06 GHCL Rosebys (UK)
The exports market will remain favourable for India till 2008, when quota restrictions on China end. Post 2008, competition will become tougher. This will be the phase in which Indian textile companies will come under tremendous pricing pressures and tighter product delivery schedules. Nevertheless, the value-added segments of readymade garments, home furnishings and made-ups will continue to grow.
IMPLICATIONS
The fragmented industry structure has in the past been beneficial in generating employment, but will be difficult to sustain in a globally competitive environment. For fabric manufacturers in the unorganised segment, this will mean inefficient units losing out eventually, while the more efficient and dynamic ones aligning with manufacturers or buyers.For readymade garment SMEs, rising demand and preference for ready-to-wear outfits in the domestic market will sustain a large number of units in this sector. This will be the most thriving segment in the industry and SMEs will play a key role.
India’s key assets include a large and low-cost labour force, sizable supply of fabric, sufficiency in raw material and spinning capacities. On the basis of these strengths, India will become a major outsourcing hub for foreign manufacturers and retailers,with composite mills and large integrated firms being their preferred partners. It will thus be essential for SMEs to align with these firms, which can ensure a market for their products and new orders.
Weaknesses of the Indian textile industry include fragmentation of the industry, lengthy delivery times, delays in customs clearance and high transportation and input costs. To tackle these factors, the Government will have to play a key role. Infrastructure development, reforms in labour laws and significant policy support will be essential.

RECOMMENDATIONS
The future prospects for the Indian industry are bright, particularly in the post-quota regime. The industry is in an expansion mode and is likely to benefit from growing demand both in the domestic as well as global markets. Further, the anti-surge mechanism which the WTO has imposed on Chinese exports is expected to benefit India. Turkey is the first country to set quotas on textile and apparel imports from China. The EU is also in the process of adopting measures to avoid surge in imports from China. China has announced exports tarriff on textile and clothing with effect from January 2005 that will last until 2007 as measures to avoid penal duties. Even though these tarriffs are nominal, it will increase export prices and curb demand for low priced Chinese goods in world markets. This should enable Indian industry to offer competitive products to global markets and increase its share in US and EU markets.
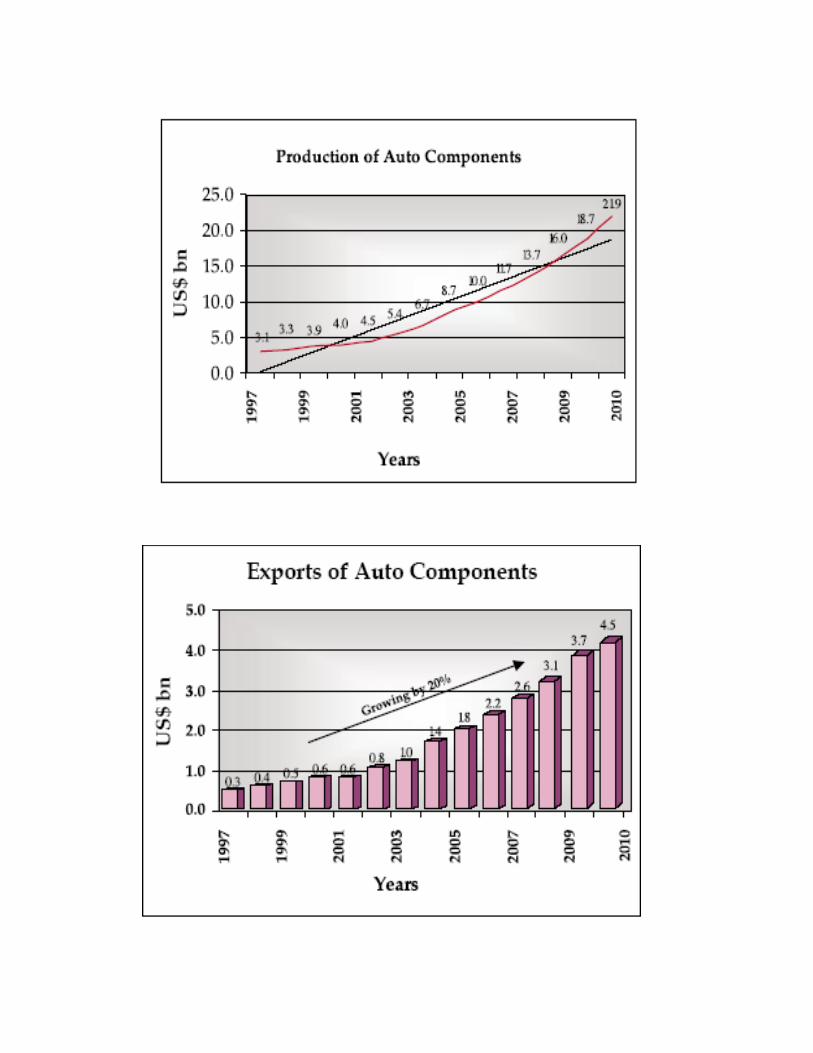
LIST OF COMPANIES
Following companies are sorted from large databases on the basis of following parameter: turnover, networth and profitability.
Based on the analysis of the textile industry and financial analysis of various companies in the industry, following are shortlisted companies.
COMPANY NAME TURNOVER (INR IN CRORES)
Aditya Birla NUV 2,772
Arvind mills 1,623
Arvind products 392
Ashima 450
Garden silk mill 1,080
Nova petrochem 535
Welspun India 633
Alok Inds. 1,454
Central Ind. Pol. 425
Cotton Corporation 1,012
Forbes Gokak 602
Futura Polyester 521
Mafat Fine Merg 307
NRC 445
Orkay Inds. 310
Pratibha Syntex 355
Raymond 1,341
S Kumars Nation 890
Siyaram Silk 450
Indo Rama Synth 2,102

ANALYSIS
OF THE
FOOD PROCESSING
INDUSTRY
114
FOOD PROCESSING INDUSTRY OVERVIEW
The Food Processing Industry sector in India is one of the largest in terms of production, consumption, export and growth prospects. The government has accorded it a high priority, with a number of fiscal reliefs and incentives, to encourage commercialization and value addition to agricultural produce; for minimizing pre/post harvest wastage, generating employment and export growth.Though agriculture contributes only 1/4th of Indian GDP, it sustains approximately 2/3rd of the population and continues to determine the growth rate of the national economy.
Change in consumption patterns
Increasing incomes are always accompanied by a change in the food basket, which analyses food expenditure patterns over the last three decades in India. The report observes that the proportionate expenditure on cereals, pulses, edible oil, sugar, salt and spices declines as households climb the expenditure classes in urban India while the opposite happens in the case of milk and milk products, meat, egg and fish, fruits and beverages.
For instance, the proportionate expenditure on staples (cereals, grams, pulses) declined from 45 per cent to 44 per cent in rural India while the figure settled at 32 per cent of the total expenditure on food in urban India.
A large part of this shift in consumption is driven by the processed food market, which accounts for 32 per cent of the total food market. It accounts for Rs 1,280 billion (US$ 29.4 billion), in a total estimated market of Rs 3,990 billion (US$ 91.66 billion). The food processing industry is one of the largest industries in India -- it is ranked fifth in terms of production, consumption, export and expected growth.
The Confederation of Indian Industry (CII) has estimated that the food processing sector has the potential of attracting Rs 1,50,000 crore (US$ 33 billion) of investment in 10 years and generate employment of 9 million person-days. The Government has formulated and implemented several Plan Schemes to provide financial assistance for setting up and modernising of food processing units, creation of infrastructure, support for research and development and human resource development in addition to other promotional measures to encourage the growth of the processed food sector.
INDUSTRY STRUCTURE
No specific structure exists as it is a highly segmented industry and each segment contained within has it’s own way of functioning. It would be made clearer as we go through the document.
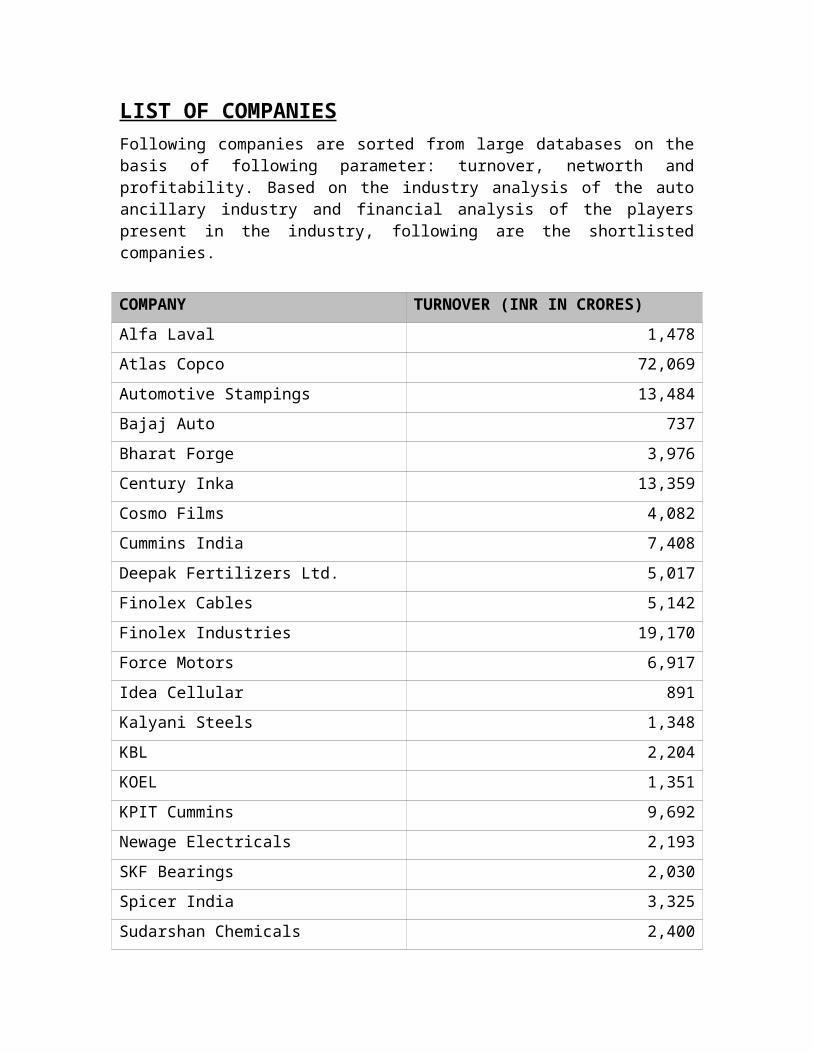
MARKET
INDIAN FOOD PROCESSING INDUSTRY
The Food Processing Industry is estimated to grow at 9-12%, on the basis of an estimated GDP growth rate of 6-8%, during the tenth plan period.
Value addition of food products is expected to increased from the current 8% to 35% by the end of 2025. Fruit & vegetable processing which is currently around 2% of total production will increase to 10% by 2010 and to 25% by 2025.
The industry employs 1.6mn workers directly. The number of people employed by the industry is projected to grow to 37mn direct and indirect job workers by 2025.
The total exports of the Food Processing Industry in 2001-02 were Rs136bn and the target exports for subsequent years kept on incresing at the rate of 7-8 % annually. Marine products export was the single largest constituent of the total exports of processed foods contributing over 40% of total processed food exports.
Five-year tax holiday for new food processing units in fruits and vegetable processing along with other benefits in Budget 2004-05 has bolstered the Government’s resolution of encouraging growth in this sector.
India is the largest producer of milk in the world with an estimated production of 91mn tons in the year 2002-03. Milk and milk products account for a significant 17% of India’s total expenditure on food and the popular milk products are cheese, butter, ghee, dairy whiteners and ice-creams.
The Indian snack food market comprising bakery products, ready to eat mixes, curries, chips, namkeens and other processed foods is large, diverse and dominated by the unorganized sector.
The total size of the Indian snack food market is at an estimated over 400,000 tons in volume terms and Rs100bn in value terms and is growing at over 10% for the last three years (2000-2003). The three largest consumed categories of packaged foods are packed tea, biscuits and soft drinks.
DEMAND AND SUPPLY
Due to diversified consumption patterns the demand and supply is varied and cannot be quantified.

SEGMENTAL ANALYSIS
Important sub sectors in food processing industries are:-
Fruit & Vegetable Processing Fish-processing Milk Processing Meat & Poultry Processing Packaged/Convenience Foods Alcoholic beverages & Soft drinks Grain Processing.

FRUITS AND VEGETABLES PROCESSING
Historically speaking, processing of fruit & vegetables in the simplest form like pickling, sundrying and or making preserves has been practiced in the country from very ancient times almost in every home.
Food processing industry has been recognised by the government as a major sector of growth.
PROGRESS OF THE INDUSTRYIt was in the First World War that some mechanization and commercialisation entered into this industry mainly to meet the demand of the armed forces. The Second World War gave it a much-needed fillip. Since then it has been progressing fairly well and has been meeting the entire local demand and in a very limited way entered the exports market. It is, however, not a heavy weight industry but has the potential to develop into a Sunshine Industry of the country. Inspite of the fact that India, is the second largest producer of fruit and also of vegetables in the world yet the commercial processing of fruit & vegetables is less than 2.0%.
PROCESSING UNITS AND INSTALLED CAPACITYPresently there is a little over 5198 units registered under the Fruit Products Order of 1955 distributed all over the country. Most of the units fall in the cottage and or small-scale sector. A few modern processing plants have, now come up and many more are in the pipeline.
MODERN UNITSAfter the liberalisation of the economic policies in the country a few very modern plants to produce mango pulp, tomato paste etc. in aseptic packing, freeze drying of many fruit & vegetables including mushroom is being taken up. It is expected that in the years to come many modern state of the art plants shall come up.
Since liberalisation in july, 1999 till February, 2000. 1120 proposals of industrial licenses and 100% export oriented units were approved and about 248 such proposals have already been emplemented.
The important countries with which the Joint Ventures have been signed are U.S.A., U.K., Netherlands, Switzerland, and Germany.
PRODUCT RANGEThe important items manufactured in the country are fruit pulps particularly of tomatoes & mangoes, ready to serve juices, canned fruits, jam, pickles, squashes, etc. Recently, items like frozen fruits, pulps, dehydrated & freeze dried vegetables, canned mushrooms etc. are also being produced. In the coming years new items like carbonated fruit drinks, dehydrated and freeze dried fruits, fruit juice concentrate are expected to be manufactured.

EXPORTSIndia in a small way has been in the export market for almost 30 years. Among the popular items in export are mango chutneys, pickles. Fruit juices, canned and dehydrated mushrooms, frozen & canned fruit & vegetables.
In the year 1997-98 the exports of processed fruit and vegetables were in the order of 299 thousand tonnes valued at Rs. 761 crores or US $ 200 million.
FUTURE OF THE INDUSTRYBecause of the liberal government and other developmental measures being taken the future of the Industry looks very bright. The production base is being enlarged, modern methods of cultivation are being adopted thus improving the productivity and cutting the per unit cost. To some extent cold chain is being provided, which will help in retaining quality, freshness and reduce post-harvest losses. The quality is now the watchword for success.
The multinationals now entering the food industry have an international marketing network and have their brand loyalties all over the world. This will enable the Indian products reaching all over the world in the form and packing required.With the rise in the per capita income particularly of the middle class a drastic change in the food habits has been noticed. This will lead to an increased domestic consumption of processed foodstuff.
INVESTMENT OPPORTUNITIESThe country's share in the world trade of processed fruits and vegetables is still less than one percent. As such, abundant investment opportunities are there in the expanding domestic market and export arena. An increasing acceptance of new products with market development efforts is seen.
Changes in export-import policies and exchange rate adjustments have helped improving the export potential.
There is a good international demand for certain fresh fruits as well as processed fruits products. Fresh fruits identified as having good export potential are: mango, grapes, banana, lichee and exotic fruits like sapota, ber, pomegranate, custard apple and other tropical fruits.
Among vegetables, the items identified as having good export potential are: onion, potato and green traditional vegetables like: okra, bitter gourd, green chillies and other seasonal vegetables.

FISH PROCESSING
With its over 8000 km. of coastline, 3 million hectares of reservoirs and 1.4 million hectares of brackish water, India has vast potential for fishes from both inland and marine resources. Units mostly exist in the small scale sector as proprietary/partnership firms or fishermen co-operatives. Over the last decade, the organized corporate sector has become increasingly involved in preservation, processing and export of coastal fish.
PRODUCTS AND PRESENT STATUS Sixty per cent of the production of fish in India is from marine sources. Processing of produce into canned and frozen forms is carried out almost entirely
for the export market.
INVESTMENT OPPORTUNITIES With the liberalised policy, fish processing sector has been attracting more foreign investments. Processed IQF marine products fetch better price than conventional block frozen materials in the foreign markets.
RAW MATERIAL'S AVAILABILITY India's substantial fishery resources are seriously under-utilised and it is widely recognised that there is substantial potential to increase the output of this sector.
Over half of the production of fish originates from marine sources of which coastal fishing from the continental shelf accounts for the bulk of the catch. It is estimated that only 10% of the marine catch derives from deep sea resources.
The Indian seafood sector depends for its raw material upon both the traditional and non-traditional fishing sectors.Fishing is principally confined to the small scale sector and embraces individual fishermen, small partnership firms, private and public limited companies and co-operatives.

MILK PROCESSINGIndia has one of the largest livestock populations in the world. Fifty percent of the buffaloes and twenty percent of the cattle in the world are found in India.India is the second largest milk producing country with anticipated production of about 78 million tons during 1999-2000.
The milk surplus states in India are Uttar Pradesh, Punjab, Haryana, Rajasthan, Gujarat, Maharashtra, Andhra Pradesh, Karnataka and Tamil Nadu. The manufacturing of milk products is concentrated in these milk surplus States.
The production of milk products i.e milk products including infant milk food, malted food, condensed milk & cheese stood at 3.07 lakh tonnes in 1999-2000.Production of milk-powder including infant milk-food has risen to 2.25 lakh tons in 1999-2000, whereas that of malted food is at 65000 tons.
Cheese and condensed milk production stands at 5000 and 11000 tonnes respectively. Some plants are coming-up for producing lactose, cassein and improved cheese varieties.
INDUSTRY STATUSIndia is set to retain its position as the world’s largest milk production in 1999-2000 with the output expected to touch 78 million tonnes mark, up from 74.5 million tonnes last year. The large increase in milk production has been the result of frozen semen technology.The estimated production of condensed milk has increased from 9000 tonnes in the year 1998 to 11,000 tones in the year 1999.
Milk Products:Principal dairy products manufacturers are:
Company Brands Major ProductsNestle India Limited Milkmaid,
Cerelac, LactogenSweetened condensed milk and milk powder
Milkfood Limited Milkfood Ghee, ice cream, and other milk products
SmithKline Beecham Limited
Horlicks Malted milkfood, ghee, butter, powdered milk, milk fluid and other milk based baby foods.
Indodan Industries Limited Indana Condensed milk, skimmed milk powder, whole milk powder, dairy milk whitener, chilled and processed milk
Gujarat Co-operative milk Marketing Federation
Limited
Amul Butter, cheese and other milk products
H.J. Heinz Limited Farex, Complan,Glactose,
Bonniemix, Vitamilk
Infant milkfood, malted milkfood
Cadbury Bournvita Malted foo

Liberalisation of the economy has led to a flood of new entrants, including MNCs due to good prospects and abundant supply of the raw material.
Milk and Milk Products Order (MMPO) regulates milk and milk products production in the country. The order requires no permission for units handling less than 10,000 litres of liquid milk per day or milk solids upto 500 tpa.
All the milk products except malted foods are covered in the category of industries for which foreign equity participation upto 51% is automatically allowed. No license is required for setting up of large scale production facilities for manufacture of ice cream.Subsequent to decanalisation, exports of some milk based products are freely allowed provided these units comply with the compulsory inspection requirements of concerned agencies like: National Dairy Development Board, Export Inspection Council etc.

MEAT & POULTRY PROCESSING
The production of meat and meat products has shown an impressive growth. The details of production of meat and meat products from 1994 to 1998 is as under: (in thousand tonnes)
Sr.No 1994 1995 1996 1997 1998
1. Mutton and Goat Meat
637 647 669 670 675
2. Pork Meat 366 420 420 420 420
3. Poultry Meat 422 578 480 580 600
4. Cattle Meat (Beef)
1290 1292 1202 1292 1295
5. Buffalo Meat 1200 1204 1204 1205 1210
GROWTH DRIVERS
Source-Annual Report 1999-2000 ,MFPI

The total meat production in the country is 4 million tonnes which includes beef, buffalo meat, mutton, goat meat, pork and poultry meat. However, only about 1% of the total meat is converted into value added products like sausages, ham becon etc. Poultry processing is still in its infancy. There are only seven modern integrated poultry processing plants.
The country has 3600 slaughter houses, 9 modern abattoirs and 171meat processing units licensed under Meat Products Order. A few modern pork processing plants are also coming up in the country.
RAW MATERIAL AVAILABILITYPoultry and Meat Products India's animal resources are substantial when measure strictly in terms of numbers. However, most animals are not bred for meat (most Indians are vegetarian). Cattle are mainly reared for milk and as drought animals.
Consumption per head of both fresh and processed meat in India is very low at 1.5 kilograms. This compares with the world average of 35.5 kilograms.
There are a number of issues which presently affect the effectiveness of the meat processing industry in India. These are summarized below:
Quality of animal herds, with the possible exception of milking herds, has received little attention resulting in low efficiency of food conversion and poor ratios of lean to fat.
Animal feed, which is vitally important in tropical countries when dry season lack of rain reduces grass production, is very limited and distribution is poor.
Lack of veterinary support reduces the level of both dairy and meat production. Fragmented herd ownership means farmers do not have sufficient funds to pay for services and drugs. Animal diseases are widespread with consequent effect upon meat and dairy quality.
Abattoir management is poor and technologies employed are out of date. During the 1990s a number of initiatives have been introduced to improve the quality of abattoirs. Overall, there has been little improvement even in the licensed sector. In the unlicensed sector there has been none at all.
Slaughter levels remain low, particularly among cattle and beef populations. This results in poor exploitation of the animal population.
The use of by-products is very limited which substantially raises the cost of the meat to the consumer.
The lack of a chilled distribution system means that the majority of slaughter house are located close to the metropolitan centers.
As a result of the above constraints, most meat consumed in India is eaten fresh. Only a minute quantity of meat undergoes further processing. Official estimates put the total at around 5,000 tonnes although trade sources consider that this may be a substantial underestimate.The demand for processed meat products which can be rapidly cooked will rise.

GOVERNMENT POLICIES
The Meat Products Control Order, 1973 under the Essential Commodities Act, 1954 regulates the manufacture, quality and sale of all meat products and is operated by the Directorate of Marketing and Inspection, Faridabad. A license is required under this order to set up a factory for producing/processing meat products.
Export of meat is subjected to pre-shipment inspection and a certificate is required from State Animal Husbandry Department/Directorate of Marketing and Inspection that the meat was obtained from healthy animals, slaughtered in a licensed slaughter house, and is fit for human consumption. In addition, a certificate specifying that the meat has been tested for specific micro-organisms like E.coli, salmonellas is required.
The export of canned and other value added meat products, additionally require certificate of tests performed as per the standards specified under the Meat Food Products Order from the Directorate of Marketing and Inspection, Faridabad.
Slaughter of cows is banned in most of the States. Export of beef is prohibited. A No Objection Certificate (NOC) has to be obtained from the District
administration for the slaughter of cattle, buffaloes etc. Permission from the civic bodies/State Government (Department of Animal
Husbandry) is also required before setting up a meat processing unit integrated with a slaughter house.
INVESTMENT OPPORTUNITIES
There is a large potential for setting up of modern slaughter facilities and development of cold chains in meat and poultry processing sector. The market has not been taken tapped tally for ready-to-eat and semi-processed meat products in the domestic market as well as for exports to neighboring countries especially to the Middle East. Buffalo meat is surplus in the country and has good export potential. Poultry production and egg processing industries have come up in the country in a big way and are exporting egg powder, frozen egg yolk, albumin powder to Europe, Japan and some other countries. Meat products have a growth rate of 10% whereas the growth rate of of eggs and broilers are 16% to 20% respectively.
Most of the production of meat and meat products continues to be in unorganized sector. However, some branded products have also come up in the domestic market. At present, poultry export from India is mostly to Maldives and Oman. Some other markets can be explored for export of poultry meat products like Japan, Malaysia, Indonesia and Singapore.

MAJOR PLAYERS
Principal manufacturers of processed meat products include:
COMPANY MAJOR PRODUCTS BRANDS
Frigo Refico Allana Limited, Kulaba,Mumbai
Frozen buffalo meat Allana
Frigo Refico Allana Limited, Kulaba,Mumbai
Canned meat Allana
Hind Industries Limited, New Delhi
Frozen buffalo meat Sibaco,Eatco
Hind Industries Limited, New Delhi
Chilled/Frozen sheep and Goat meat
Sibaco,Eatco
Alkabeer Exports Limited, Mumbai
Frozen buffalo meat Alkabeer
Alkabeer Exports Limited, Mumbai
Chilled/Frozen sheep and Goat meat
Alkabeer
P.M.L. Industries, Chandigarh
Frozen buffalo meat PML
U.P. Pashudhan Udyog Nigam Ltd. Uttar Pradesh
Pork and other meat products
CDF
U.P. Pashudhan Udyog Nigam Ltd. Uttar Pradesh
Canned meat manufactures CDF

COMPANY MAJOR PRODUCTS BRANDS
A.P. Meat & Poultry Corporation,Hyderabad
Pork and other meat products
APSMPC
Pigpo, Jorbagh Market, New Delhi
Pork and other meat products
Pigpo
MAFCO, Mumbai Pork and other meat products
MAFCO
Ranchi Bacon Factory, Ranchi
Pork and other meat products
Rajasthan Meat and Wool Marketing Federation,
Alwar
Canned meat Manufactures
Venkateshwara Hatcheries, Pune
Poultry products Venky’s Food
DeeJay, Bangalore Poultry products
Source : Ministry of Food Processing Industries

PACKAGED/CONVENIENCE FOODS
Packaged food products have been slow in penetrating the large potential presented by India's 250 million strong middle class. But due to growing urbanization and changing food habits, the demand has been rising at a good pace and there is enough latent market potential waiting to be exploited through developmental efforts.
PRESENT STATUSThis segment comprises of bread, biscuits and other bakery products, confectionery, chocolates and cocoa products, soya-based products, ready to eat pasta products like noodles, cereal flakes etc., high protein foods and other processed foods/snack foods. Besides, items like starch, glucose etc, required for food products are also included.
The soya products industry, worth over Rs.80 crores (US $ 22.2 million) , has been growing at around 10% Several large units have come up due to their enormous export potential.
The size of the semi-processed/ready to eat food segment is over Rs.4000 crores (US $ 1.1 billion) with over 60,000 bakeries, 20,000 traditional food units and starch/glucose/sorbitol producing units have also come up, catering to domestic and international markets. In confectionery & cocoa based products several MNCs have set up manufacturing units.
Production of macroni/noodles is about 16500 tons, pearl barley at 1,240 tons and corn-flakes at about 600 tons. Annual Production of bread & biscuits and other bakery products in the country is estimated at 30 million tonnes.
GOVERNMENT POLICIESThe packaging laws and regulations affecting food products are mainly covered under the Standards of Weights and Measures Act, 1976, and the Standards of Weights and Measures (Packaged Commodities) Rules, 1977 (SWMA) specifying the quantity and package-labelling regulations for all products.
The Prevention of Food Adulteration Act, 1954, and the Prevention of Food Adulteration Rules, 1955 (PFA) specify food adulteration/contamination norms and permissible ingredients` from consumer health and safety point of view.
The Agmark Rules relate to the quality specifications and needs of certain agricultural products to be eligible for Agmark certification. Some of the food products like edible nuts, honey etc may be covered under this.
The industry is delicensed and automatic approval for foreign investment upto 51% of equity (except for items like malted food and items which are reserved for production in

small scale sector) is granted. The setting up of 100% export oriented units requires specific govt. approval.
INVESTMENT OPPURTUNITIESThe convenience foods segment, growing at a rate of 20%, offers the greatest potential. Export of soya based products is increasing at a rapid pace. Technological revolutions in processing and packing of food products, coupled with fast growing inland and export markets presents a very good potential for further investment in this sector.
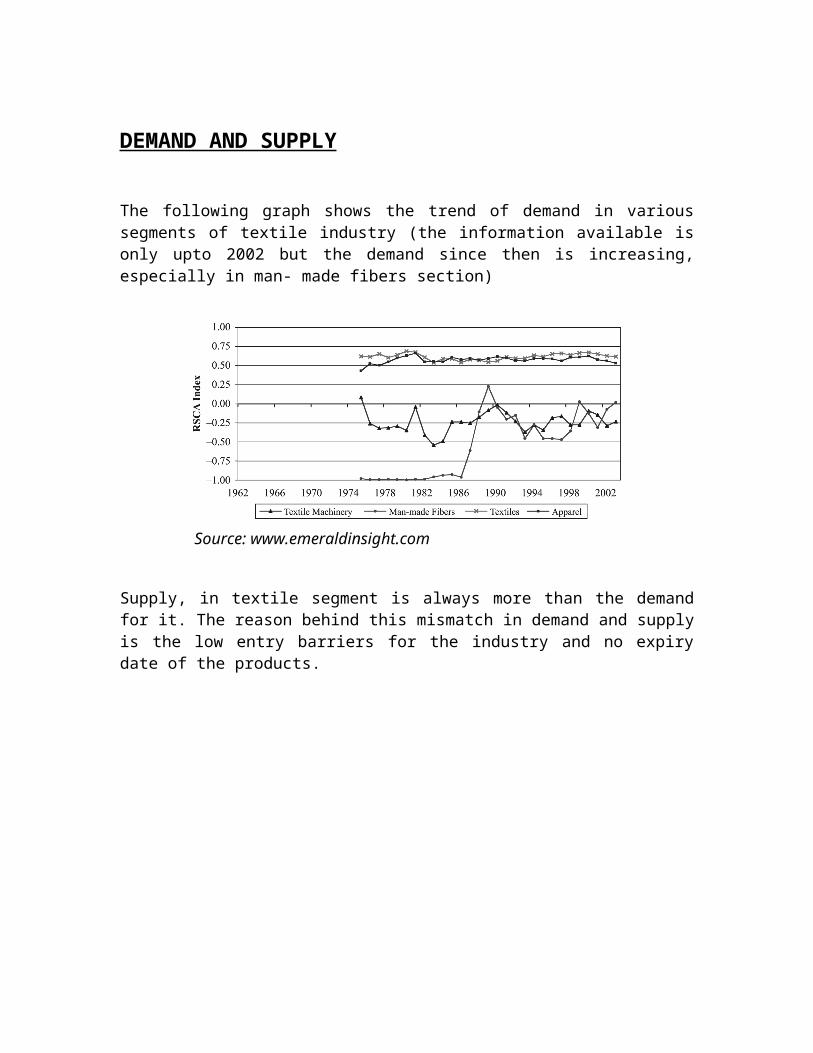
ALCOHOLIC BEVERAGES & SOFT DRINKS
Beer and Alcoholic BeveragesThe importation of potable alcohol is subject to government licensing. Alcoholic drinks carry a very heavy tax burden which is itself a major source of revenue for state governments.
Liquor manufactured in India is categorized as beer, country liquor and Indian Made Foreign Liquor (IMFL). IMFL production includes wines, whiskey, rum, vodka, gin and brandy.
PRESENT INDUSTRY STATUSCurrently the industry is dominated by 3 brewers, the United Breweries, Shaw Wallace and Mohan Meakins dominate the market. However, a number of international brewers are starting to become established. Joint ventures will continue to be more important as the distribution network in India is complex.
There are around 23,000 licensed liquor outlets in India, with another 10,000 outlets such as bars and restaurants.
Whisky and Other Spirits
In India country liquor and IMFL cater for two quite different sectors of the liquor market. Country liquor is consumed in rural areas and by low-income groups in urban areas. IMFL is consumed by the middle and high income groups, primarily in urban areas.
As was found to be the case with beer, so it is with whisky. Increasingly more and more of the major international liquor companies are introducing new brands in India through local joint venture arrangements. These include the following new whisky brands:
Allied Domeq with Clan Morgan & Co to produce Teachers Brand Scotch Whiskies. IDV (Grand Met.) with Polychem Limited to produce Spey Royal Scotch Whiskey. United distillers with U.B.Group to produce Black & White, Blend 69, Black Dog &
Vat 69. Seagram with Seagram India to produce Something Special, 100 Pipers Scotch
Whiskey. McDonald & Muir with Mohan Meakins to produce Highland Queen Scotch
Whiskey. White spirits are considered by many observers to be the next major growth sector.
WineIt is only very recently that wine has begun to be produced on a significant scale in India. Its production takes place in both the organized and the household sectors. Sparkling

wine is also manufactured in India. However, this is intended for the export market and the volumes involved are small.
SOFT DRINKS
The production of soft drinks have increased from 5670 million bottles in 1998-99 to 6230 million bottles in 1999-2000.Range & Scope Of Products
These major product group are non-alcoholic flavoured/sweetened beverages,Cola, Orange & Lemon are some of the accepted ,tasted in India. Currently it is estimated that 65% prefer non-alcoholic drinks. Manufacture of Packaged drinks is governed by FPO.Major Players
There are several well established corporations in this Industry with widely advertised Brands.Some of the major manufacturers are
Parle (Exports) Pvt.Ltd Pepsi Foods Ltd Coca-Cola Pure Drinks (New Delhi) Ltd.
PRESENT INDUSTRY STATUS
Source: www.mofpi.nic.in
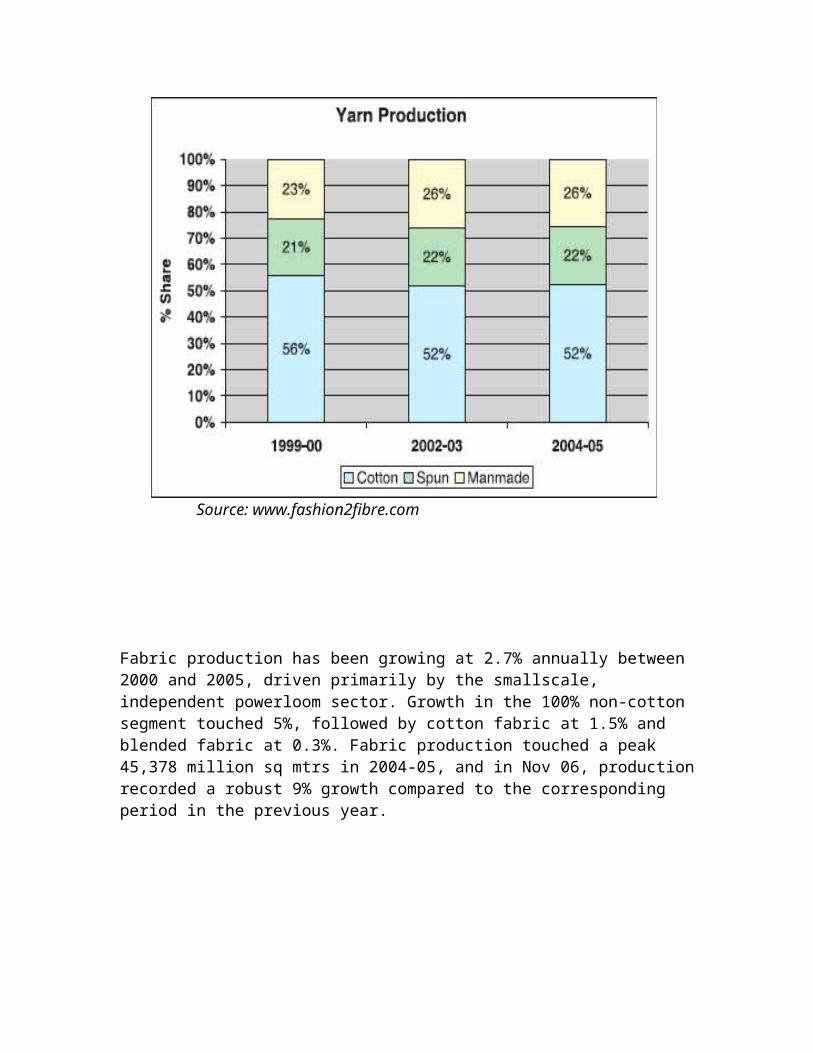
GRAIN PROCESSING
India produces about 200 million tonnes of different food grains every year. All major grains --paddy, wheat, maize, barley, millets like: jowar (great millet), bajra (pearl millet) & ragi (finger millet) are produced in the country. The country is self sufficient in grain production and is the second largest rice producer in world, with a 20% share.
PRESENT INDUSTRY STATUS
Source - Ministry of Food Processing Industries, Annual Report 1999-2000
Primary milling of rice, wheat and pulses is the most important activity in food grains. There are over 91,000 rice hullers and 2,60,000 small flour mills engaged in primary milling. Further there are about 43,000 modernised rice mills/huller-cum shellers and the quantity of rice bran processed for bran-oil extraction stood at 3.4 million tonnes in 1999-2000.
Around 820 large flour mills in the country convert about 10.5 million tonnes of wheat into wheat products. Also there are 10,000 pulse mills milling about 75% of pulse production of 14 million tonnes in the country.
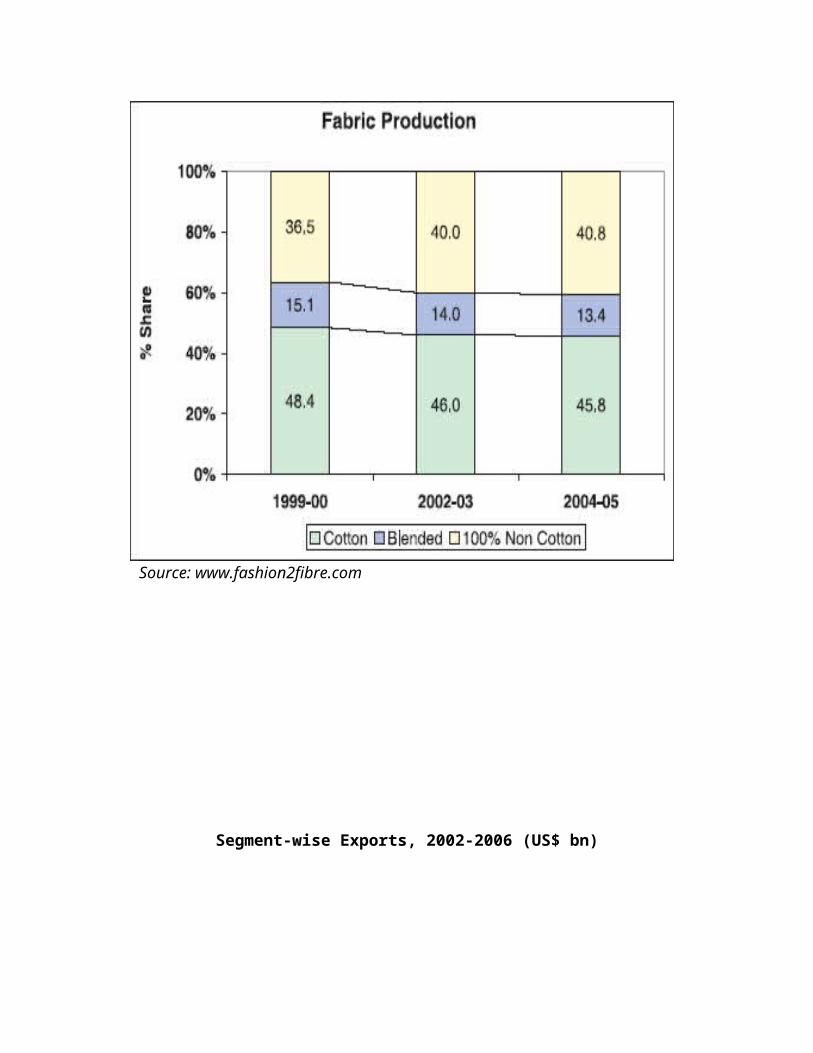
Branded rice is becoming popular in the country and significant corporate presence is there in the domestic as well as export markets. Some quantity of wheat and wheat products has also been exported.
Ninety Four foreign investment and 100% EOU proposals have been approved in the rice milling sector, with a total investment of about Rs.949 crores (US $ 235 million). Eight pulse milling units as 100% EOU have also been approved.
GOVERNMENT POLICIESThe Rice Milling Industry (Regulation) Act 1958 & Rice Milling Industry (Regulation & Licensing) Rules 1959 have been repealed w.e.f 28th May, 1997. Further, Rice milling and pulse milling sectors, which were earlier reserved for the small scale sector, have now been dereserved. As such, no license/permission is now required for setting up a rice mill/pulse mill.
Since liberalisation, there is no license requirement for setting up or capacity expansion of roller flour mills. The mills can obtain their wheat supply from any source. Also there is no license requirement or price/distribution controls on manufacture of wheat products.
INVESTMENT OPPURTUNITIESWith the popularity of branded rice and flour among urban population, the investment scope in the field has increased. Also, there is very good demand of Indian basmati and non-basmati rice in export markets and a lot of export has been taking place.
Leading Players:
Agro Foods Pvt Ltd HLL Ltd Parle Products Pvt LtdBritannia Industries Ltd Haldiram Pvt Ltd PepsiCo IncDabur India Ltd (Foods) ITC Ltd General Mills-PillsburyDynamix Dairy Ind Ltd MTR Foods Ltd Surya Foods and Agro Pvt
LtdGits Food Products Pvt Ltd Nestle Ltd Tata Chemicals LtdGodrej Industries Ltd-Foods Division Parle Agro Pvt Ltd

Financing of the food processing sector
The structural complexion of the Indian supply chain has led to limited scale of financing as well as higher risk, given the lack of control of each of the players, on the supply chain.
✔ Financing of farmersFarmers often rely on unorganized sources of credit due to bottlenecks in access, timeless in availability and adequacy of credit from organised sources. The key hurdles faced by banks in financing farmers are their inability to provide adequate collateral as security and the potential for default in the absence of an assured market for their produce.
✔ Financing of processing enterprisesThe food processing enterprises primarily comprises small and medium sized companies, a large proportion of which have stand alone operations, with no linkages with farmers, and reliant on other organizations to undertake marketing/further processing of their products. Consequently, companies in the food-processing sector usually bear a steep cost of interest for the high-risk perception associated with the nature of their operations.
Further there are several regulations which limit availability of finance to the sector, including the definition of priority sector lending, the Cooperatives Act and the Warehousing Corporation Act.
Absence of well-developed risk mitigation tools has further impacted availability of finance to the food abd agriculture sector. Additionally, crop insurance schemes in India have faced various issues including assessment of farmer yield at the mandal level, lack of past statistical data to calculate premia, high premia for certain crops and administrative hurdles in managing claims, thus resulting in poor economic viability as also limited benefit to farmers.
✔ FDI in food processingFDI in the food-processing sector is low, constituting a mere 4% of total FDI in the period 1991-2004. The actual inflow is only about 28% of FDI approved (INR 4.2 billion out of approved INR 11.6 billion). This is despite the fact that with the exception of food retailing, plantation and alcoholic beverages, 100% FDI Is permitted in the sector.
✔ Government SchemesGovernment provides assistance to the industry and entrepreneurs under various schemes. While there are significant overlaps in these on the one hand, there are several undressed need gaps of the industry, on the other. Further, the restriction of quantum of finance assistance per unit disincentives. Additionally, the structure of the scheme needs to be

based on specific sectoral requirements. The Government needs to have a robust monitoring mechanism to assess the direct and indirect impact of such assistance.
RISK AND CONSTRAINTS
Constraints in the growth of food processingSub-optimal growth of Food Processing can be attributed to the vicious circles of high unit cost low demand low capacity and utilization high unit cost. Domestically, affordability is the key issue. Price differential between fresh and processed food. Low income Indians are very price sensitive since food accounts for over 50% of the family budget.
Availability cost and timeless of credit are thus major issues. Banks have looked at segmented financing of the food supply chain(producer to processor to retailer to consumer) leading to high risk regime. Moreover, cost of credit of an SSI unit is 2 to 3% higher than that for large units. Working Capital is even a bigger problem for this sector and its inventory requirement is high.
Cost of packaging sometimes may exceed 20% of the end consumer price. Large proportion of processed food is sold and bought in small packs which translate into even higher cost of packaging.
In the long and fragmented supply chain, right from farm to Mandi to processor to distributor to retailers, there is too many points of intermediation & disconnect. In the process, there is mis-match between demand and supply, limited choice to consumers, unacceptable wastage and hygiene, avoidable cost addition and opportunistic profiteering.
Marketing & distribution except by the big companies is largely unorganized and fragmented. Sales through large organized formats contribute 72% of food consumption across the world but its share is about 1% in India. Taxes on food in India are very high by international standard. Central and State taxes together increase cost to consumer often by 20%-30%.

GOVERNMENT POLICY
Steps taken so far to promote food processing
Food processing is declared a priority sector.
No industrial license is required for food processing except for alcoholic beverages and a few items reserved for SSI.
100% FDI is allowed except in alcoholic beverages and items reserved for SSI.
Foreign equity up to 25% is allowed even in SSI reserved items. For equity beyond 25%, export obligations of 50% apply.
Agro based units established in special economic zones and 100% EOU are allowed (a) Sales up to 50% in domestic tariff area, and (b) import of capital goods and raw materials at zero duty.
In order to boost the food processing sector, the Centre has permitted under the Income Tax Act a deduction of 100 per cent of profit for five years and 25 per cent of profit in the next five years in case of new agro processing industries set up to package and preserve fruits and vegetables. Excise Duty of 16 per cent on dairy machinery has been fully waived off and excise duty on meat, poultry and fish products has been reduced from 16 per cent to 8 per cent.
Food Parks In a bid to boost the food sector, the Government is working on agrizones and the
concept of mega food parks. Twenty such mega parks will come up across the country in various cities to attract Foreign Direct Investment (FDI) in the food processing sector. The ministry has released a total assistance of Rs.105.22 crore (US$ 23 million) to implement the Food Parks Scheme.
As a result of several POLICY INITIATIVES undertaken since liberalisation in August 1991, the industry has witnessed fast growth in most of the segments. As per a recent study on the food processing sector, the turnover of the total food market is approximately Rs.250,000 crores (US $ 69.4 billion) out of which value-added food products comprise Rs.80,000 crores (US $ 22.2 billion).
Since liberalisation in Aug'91 and up-till Feb 2000 proposals for projects of over Rs.53,800 crores (US.13.4 billion) have been proposed in various segments of the food and agro-processing industry. Besides this, Govt. has also approved proposals for joint ventures, foreign collaboration, industrial licenses and 100%export oriented units
envisaging an investment of Rs.19,100 crores (US $ 4.80 billion) during the same period. Out of this, foreign investment is over Rs. 9100 crores (US $ 18.2 billion).
Processed food exports were at over Rs.13,500 crores (US $ 3.2 billion ) in 1998-99. Out of these exports, rice accounted for 46%, whereas marine products accounted for over 34%.
Primary food processing is a major industry with lakhs of rice-mills/hullers, flour mills, pulse mills and oil-seed mills. There are several thousands of bakeries, traditional food units and fruit/veg./spice processing units in unorganised sector.
In the organised sector, there are over 820 flour mills, 418 fish processing units, 5198 fruit/veg processing units, 171 meat processing units.
India is the world's second largest producer of fruits & vegetables, but hardly 2% of the produce is processed. India is the land of spices producing all varieties worth over Rs. 3500 crores (US $ 900million) amounting to 25-30% of world production, which is processed for value-addition and export. It grows 22 million tonnes of oilseeds covering most of the varieties. Other important plantation products include tea, coffee, cocoa and cashew.
It has large marine product and processing potential with varied fish resources along the 8041 km. long coastline, 28000 km. of rivers and millions of hectares of reservoirs & brackish water. India's livestock population is largest in the world with 50% of world's buffaloes and
20% of cattles, but only about 1% of total meat production is converted to value added products.India is the largest milk producer in the world and about 15% of the total milk production is processed through the organised sector.
Size of the semi-processed and ready to eat packaged food industry is over Rs. 4000 crores (US $ 1 billion) and is growing at over 20%.

RECOMMENDATIONS
This was the detailed analysis of "Indian Food Processing Industry".
In next few sections of the report we will concentrate on the food processing companies in western part of India.
West Zone of the Food Corporation of India monitors the activities of the F.C.I. in the States of Maharashtra, Goa, Gujarat, M.P. and Chhatisgarh and also the Union Territories of Daman, Diu, Dadra and Nagar Haveli.The main operational activities of the Corporation in this Zone are Storage, Movement, Procurement, Public Distribution, dispatch of levy sugar and other allied activities.
Chhattisgarh, Madhya Pradesh and Maharashtra contribute to rice and wheat procurement States of Chhatisgarh and Madhya Pradesh undertake procurement under decentralized scheme also.

LIST OF COMPANIES
Following companies are sorted from large databases on the basis of following parameter: turnover, networth and profitability. Following is the list of food processing industries, in western zone with a turnover of more than Rs. Three hundred crores
COMPANY NAME TURNOVER (IN INR CRORERS)Allansons Ltd. 1,330Bilag Industries Pvt. Ltd. 410De-Nocil Crop Protection Pvt. Ltd. 300Syngenta India Ltd. 453Tata Tea 900Ventakeshwara Hatcheries Pvt. Ltd. 302Vimal Oil & Foods Ltd. 366Liberty Oil Mills Ltd. 1,097Agro Tech Foods Ltd. 938Britannia Industries Ltd. 1,818Dabur India Ltd. 838Hindustan Lever Ltd. 11,365ITC Ltd. 3,166Nestle India Private Ltd. 2,816Godrej Beverages & Food Ltd. 4,500Tata Chemicals Ltd. 3,008Pepsico India Ltd. 14,679

CONCLUSION OF THE REPORT
To conclude this report, lets have a quick recap of recommendations given at the end of analysis of each of the five industry.
CHEMICAL INDUSTRYFor most of the leading companies in speciality segment and pharmaceutical sement, the future is indeed promising. Biotech, is also an upcoming sector and its market will shoot high with coming period. Investment in these segments will be profitable.
POWER EQUIPMENT INDUSTRYThis is a very important industry, as its growth is directly related to the development of all other sectors of country’s economy. It is a ever growing sector. Especially, investment in non-renewable sources of power generation will yield colourful results.
AUTO ANCILLARY INDUSTRYThe industry displays tremendous potential in generating employment and boosting entrepreneurship in the country. The vast market for auto components, and the diverse products and technology involved ensures a place and role for many. At the same time, the entry of several global automobile manufacturers will bring in more regulation into the industry and see a pruning of the spurious market.
It is one of the hottest industries and investing in it will bring big returns.
TEXTILE INDUSTRYThe future prospects for the Indian industry are bright (particularly in the post-quota regime) but the growth rate of the industry is not very good. The industry is in an expansion mode and is likely to benefit from growing demand both in the domestic as well as global markets. Investment will bring profits but certainty is not there.
FOOD PROCESSING INDUSTRYThis is one of the most upcoming sectors, especially in India. Investment will definitely yield good results. Future of this industry is indeed bright.
140

VALUE ADDITIONS FROM THE PROJECT
At the individual level (Benefits to me)
Practical application of theoretical concepts, major ones are working capital cycle cash management services Trade services Treasury products Short term working capital financing Balance sheet analysis
Knowledge regarding the key parameters in the industries (within the scope of this project).
Industry structure Segments of the industry Industry dynamics Growth drivers Risks and constraint Investment requirements Key players Future outlook
Where and what are the opportunities available to finance in that industry
At the Organizational level (Benefits to HDFC Bank)
Industry analysis of five industries where the bank is looking at opportunities to expand.
List of potential clients in those industries
141

REFERENCES
www.dnb.co.inwww.icfdc.comwww.crisil.comwww.citiindia.comwww.chemical.gov.inwww.chemchannels.comwww.mofpi.nic.inwww.fibre2fashion.comwww.textilescommitee.nic.inwww.ciionline.orgwww.asiatradehub.comwww.indiacore.comCRISIL’s “Annual Review on Chemical Industry”ICFAI Publications “Financial Management”
142
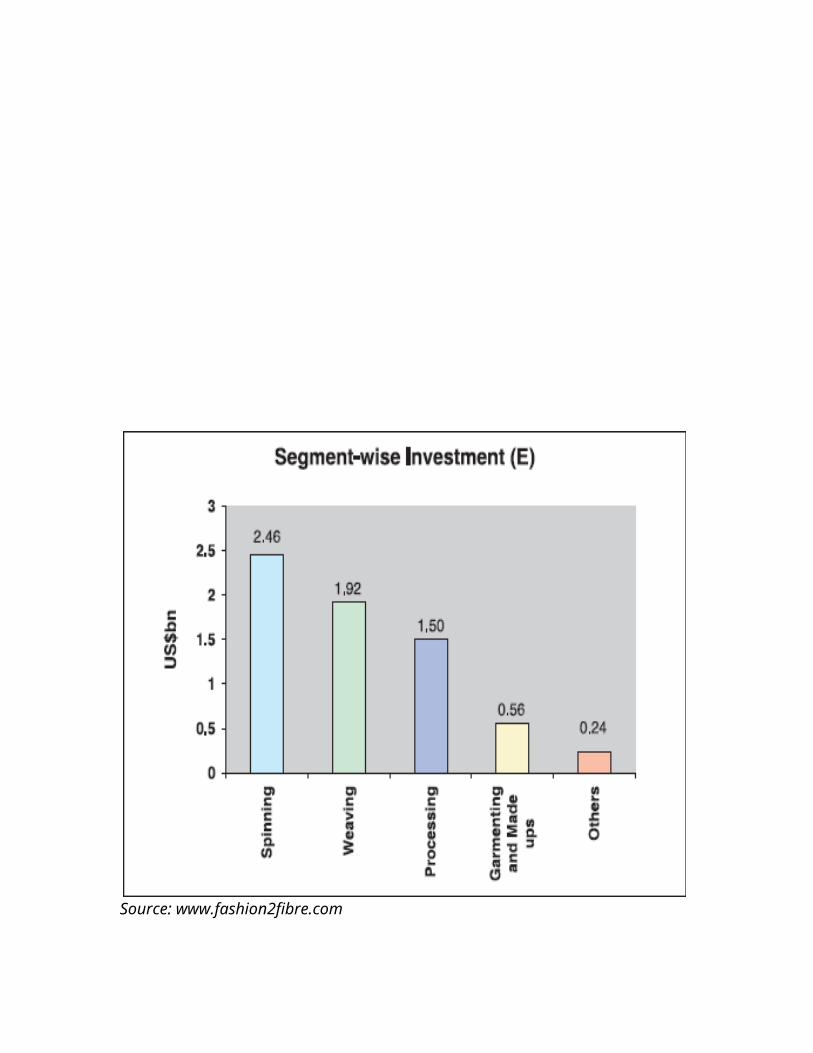
The information presented in this document has been extracted from various publicly available documents and sources, including officially prepared materials from the Government and its various ministries and has not been prepared or independently verified by the Issuer or the Lead Managers. The Refrences section in the document shows all the relevant sources.
