sinir2015-68 asean and india industry monitor / india industry monitor ... jakarta office vacancy...
TRANSCRIPT

1
Industry Report
ASEAN / INDIA INDUSTRY MONITOR 2015 Second Half Issue
Bank of Tokyo-Mitsubishi UFJ A member of MUFG, a global financial group
OCTOBER 1, 2015
【Summary】
� The business environment will be bolstered by robust domestic demand amid sluggish foreign demand.
� The business environment of major industries in ASEAN and India has witnessed slow growth due to sluggish foreign demand although it has improved thanks to firm domestic demand in line with income growth.
� ASEAN countries have maintained steady growth as a whole. The rate of economic growth in Singapore, which is dependent on exports, and Malaysia and Indonesia, which are vulnerable to commodity price changes, slowed down. In Thailand, although the service industry has propped up the economy, low goods exports have weighed down growth. Philippines and Vietnam have experienced higher growth rates compared to other ASEAN countries on the back of solid domestic demand. On another note, the new government in India has improved consumer sentiment and stabilised inflation, resulting in relatively high economic growth.
� Performance has been mixed across manufacturing sectors. In the automotive sector, sales have been robust in well performing economies such as the Philippines and Vietnam. Meanwhile, sales in Malaysia slowed down with the implementation of the Goods and Service Tax. In addition, sales volumes have dropped significantly in Thailand, due to slow economic recovery, and Indonesia, where the removal of fuel subsidies and other factors have decreased consumer demand.
� Although growth has been generally stable in non-manufacturing sectors (retail, tourism, construction and real estate), retail sales have slowed down in Singapore and Thailand due to a drop in tourist arrivals from China and other countries.
� Going forward, the business environment in ASEAN and India is likely to be stable, as robust domestic demand will be able to offset the effects of sluggish exports. While the effects of China's slowdown and low commodity prices are unavoidable, increased public spending in Indonesia and Thailand, as well as increased domestic consumption and capital investment in India will help to push the economy.

2
Table of Contents
Country Industry Indicator Latest Data Page
Singapore
Electronics 1. Electronics Exports Jul 2015 3
Retail 2. Department Store Retail Sales Index Jun 2015
Travel 3. Standard Room Average Occupancy Rate & Visitor Arrivals
Jun 2015 4
Office Property 4. Office Vacancy Rate & Rental Index Q2 2015
Construction 5. Construction Contracts Awarded Jun 2015 5
Malaysia Automobile 6. Automobile Sales Jul 2015
Office Property 7. KL Office Vacancy Rate & Rental Index Q2 2015 6
Thailand
Automobile 8. Automobile Sales Jul 2015
Textile 9. Shipment Index of Textile Products Jun 2015 7
Cement 10. Cement Production Jun 2015
Retail 11. Retail Sales Index May 2015 8
Office Property 12. Bangkok Office Vacancy Rate & Rental Index Q2 2015
Indonesia
Automobile 13. Automobile Sales Jul 2015 9
Motorcycle 14. Motorcycle Sales Jul 2015
Office Property 15. Jakarta Office Vacancy Rate & Rental Index Q2 2015 10
Philippines Automobile 16. Automobile Sales Jul 2015
Office Property 17. Manila Office Vacancy Rate & Rental Index Q2 2015 11
Vietnam
Electronics 18. Computer & Electronics Components Exports Jul 2015
Automobile 19. Automobile Sales Jul 2015 12
Textile 20. Textile Exports Jul 2015
India
Steel 21. Crude Steel Production Jul 2015 13
Automobile 22. Automobile Sales Jul 2015
Motorcycle 23. Motorcycle Sales Jul 2015 14
Appendix Major Economics & Industrial Index (Real GDP Growth, etc.) 15
Note: The “FORECAST” period added in this edition is a short-term outlook (about 6 months to 1 year). This bulletin is issued semi-annually.

3
1. Singapore / Electronics Exports Forecast: Slow Recovery Expected to Continue
(Source:International Enterprise)
� Singapore’s electronics export value increased by 0.6% YoY in H1 2015.
� Demand for final products such as tablets, smartphones and PCs from the USA and Europe has increased with the slow recovery of their economies, resulting in a return to positive growth for Singapore’s electronics exports.
� Exports of integrated circuits, a major product, increased by 11.7% YoY, PCs by 54.0% YoY, and telecom equipment by 49.3% YoY. However, exports of PC components decreased by -22.3% YoY while hard disks declined -13.8% YoY.
� Electronics exports are expected to continue to recover over the next one year as demand from developed countries, especially for tablets and smartphones continues to increase. However, the extent of recovery will be limited as components and semiconductors for PCs make up Singapore’s majority of exports, while smartphone components are a small percentage.
2. Singapore / Department Store Retail Sales Index
Forecast: Limited Sales Growth Expected
(Source:Department of Statistics)
� Department store sales index in Singapore increased by 4.1% YoY in H1 2015.
� It was supported by domestic consumer spending on the back of retailers’ promotional activities. However, tourist visitations to Singapore saw -3.4% YoY decline during H1 2015. Coupled with the strengthening of SGD against currencies of several neighbouring countries, tourist spending was affected.
� Meanwhile, retailers need to cope with high rental costs and hiring difficulties after tightening of foreign workers in-flow by the Singapore government.
� At present, there is need for Singapore to seek ways to boost the recovery of its tourism industry. Domestic department store players will also have to rejuvenate their businesses with fresh retail concepts.
� However, addressing the above challenges will take time to bear fruit. In the meantime, department store sales may see muted growth over the next one year.
-100%
-80%
-60%
-40%
-20%
0%
20%
40%
1.0
2.0
3.0
4.0
5.0
6.0
7.0
8.0
Jul/12 Jan/13 Jul/13 Jan/14 Jul/14 Jan/15 Jul/15
Electronics Export Value(LHS)
(SGD Billion)
YoY (RHS)
-60%
-40%
-20%
0%
20%
40%
0
50
100
150
200
250
Jul/12 Jan/13 Jul/13 Jan/14 Jul/14 Jan/15
(2014=100)
YoY (RHS)
Department Store Sales Index(LHS)

4
3. Singapore / Standard Room Average Occupancy Rate & Visitor Arrivals
Forecast: Occupancy Rate and Average Room Rate Expected to Weaken
(Source:Singapore Tourism Board)
� Singapore’s visitor arrivals decreased by -3.4%
YoY and room occupancy rates also declined to 83.2%(-1.3pt YoY) in H1 2015.
� Room occupancy rates have maintained levels above 80% at the expense of lower average room rates of SGD244 (-5.5% YoY) due to room discounts offered by the companies to offset the muted demand.
� Room occupancy rates and average room rates are expected to weaken over the next one year.
� Downward pressure on visitor arrivals from major markets such as China, Indonesia and Malaysia is likely to persist in H2 2015, amid the current weakening of most Asian currencies.
� With minimal signs of recovery in Singapore’s visitor arrivals and a peak room supply in 2015 (about 3,200 room additions) especially in mid-range/mass hotel segments, we view the environment to be challenging going forward. Average room rates are expected to decline further to sustain the current occupancy levels.
4. Singapore / Office Vacancy Rate & Rental Index
Forecast: Office Rentals Expected to Ease
(Source:Urban Redevelopment Authority)
� Office rents in the Central Business District (CBD) in Singapore have suffered its first QoQ contraction of -2.6% in Q2 2015 after sustained increase since 2013.
� The low supply situation in 2015 is the key reason behind the strong improvement of rents in 2014. However, as increased supply is expected in 2016, office rents decreased slightly in Q2 2015 while vacancy rate improved slightly to 9.2% on the back of steady demand from non-financial sectors such as consumer goods, IT and social media industries.
� Office rents are likely to ease over the next one year. While demand for office space will be stable, close to 4 million sqf of new office space is expected to be completed in 2016, a historical high since 1997. It is highly likely that the office market vacancy rate in the CBD will increase as well.
20%
30%
40%
50%
60%
70%
80%
90%
100%
0
25
50
75
100
125
150
175
200
Jul/12 Jan/13 Jul/13 Jan/14 Jul/14 Jan/15
Visitor Arrival(LHS)
Standard Room Occupancy Rate (RHS)
(10,000 people)
0%
5%
10%
15%
20%
50
100
150
200
250
3Q/12 1Q/13 3Q/13 1Q/14 3Q/14 1Q/15
Vacancy Rate (RHS)
Rental(LHS)
(1990=100)

5
5. Singapore / Construction Contracts Awarded Forecast: Demand Expected to Be Stable
(Source:Urban Redevelopment Authority)
� In 2014, construction contracts awarded in Singapore was at a record high of S$38.8 billion. It decreased by -24.1% YoY in H1 2015 due to the high base effect.
� A breakdown of the H1 2015 figures shows that demand from the private sector contracted by -31.0% YoY due to easing residential and commercial sectors. Demand from the public sector has also declined by -16.8% YoY due to the slower construction of Housing and Development Board (HDB) public housing.
� While slower construction demand is expected in 2015 with forecasted range of S$29-36 billion, it will remain stable over the next one year.
� Private sector construction demand is expected to be moderate as developers may adopt a cautious stance amid a slowdown in private home sales. On the other hand, demand for public construction will remain favorable due to an increase in industrial projects and the sustained pipeline of civil engineering works.
6. Malaysia / Automobile Sales Forecast: Slow Return to Recovery Expected
(Source:Malaysian Automotive Association)
� Automobile sales in Malaysia dropped by -3.3% YoY to 322 thousand units in H1 2015.
� This was because the Goods and Service Tax (GST) that was introduced in April 2015 adversely affected consumer appetite.
� Perodua remained at the top, with sales increasing by 14.8% YoY to 109 thousand units (33.7% market share). Proton followed with 50 thousand units (15.6%). Honda overtook Toyota to become the 3rd best seller, with sales increasing by 17.2% YoY to 44 thousand units (13.5%) due to strong sales of the HR-V (compact SUV) that was launched in February 2015.
� Automobile sales are likely to start slowly recovering over the next one year. The stable employment and income environment in Malaysia is expected to continue. Also, the negative effect of the GST on consumer appetite should also abate in the second half of the year. The local industry association expects sales in 2015 to increase by 0.5% YoY to 670 thousand units.
-700%
-600%
-500%
-400%
-300%
-200%
-100%
0%
100%
200%
300%
0
5
10
15
20
25
30
35
40
45
50
Jul/12 Jan/13 Jul/13 Jan/14 Jul/14 Jan/15
(SGD Hundred Million)
Public Sector Demand, YoY (6 month Ave, RHS)
Private Sector Demand, YoY (6 month Ave,
RHS)
Public Sector Demand
(6 month Ave, LHS)
Private Sector Demand
(6 month Ave, LHS)
-80%
-60%
-40%
-20%
0%
20%
40%
0
20
40
60
80
100
120
Jul/12 Jan/13 Jul/13 1/14 Jul/14 1/15 Jul/15
New Car Sales(LHS)
YoY (RHS)
(1,000 units)

6
7. Malaysia / KL Office Vacancy Rate & Rental Index
Forecast: Office Rentals Expected to Ease
(Note) Due to a change in data, figures from 2Q/13 are estimates
(Source:Jones Lang LaSalle)
� Office rents in the Central Business District (CBD) in Kuala Lumpur have inched up by 0.8% in Q2 2015.
� Vacancy rate has increased slightly to 13.3% in Q2 2015 due to some new supply additions such as IB Tower and Menara Bangkok Bank. However, relocation and expansion activities of existing tenant have supported the stable office rents.
� About 2.5mn sqf of office space is expected to be completed in KL CBD for full year 2015; this is similar to the total KL CBD supply additions from 2011-2014.
� Office rents and the vacancy rate are expected to be under pressure over the next one year, even though demand will remain solid.
8. Thailand / Automobile Sales Forecast: Downward Trend Expected to Continue
(Note) Sales soared by 477% YoY on November 2012.
(Source:Thai Automotive Industry Association)
� Thailand’s automobile sales dropped by -16.3% YoY to 369 thousand units in H1 2015.
� Weak consumer appetite due to slow economic recovery, stricter auto loan approvals by financial institution due to high levels of household debt and reduced rural incomes driven by low agricultural prices, have resulted in decline of demand for automobiles.
� Toyota’s sales decreased -24.9% YoY to 123 thousand units (33.4% market share), followed by Isuzu, whose sales decreased -16.7% YoY to 69 thousand units (18.8%). However, Honda, in 3rd place, increased sales by 15.9% YoY to 55 thousand units (14.8%) due to strong sales of the HR-V (compact SUV) that was launched in November 2014.
� Automobile sales are expected to decline over the next one year as the economy and consumer appetite are expected to remain sluggish. Major manufacturers expect sales in 2015 to decrease by around -10% YoY to less 800 thousand vehicles.
0%
5%
10%
15%
20%
25%
30%
200
300
400
500
600
700
800
3Q/12 1Q/13 3Q/13 1Q/14 3Q/14 1Q/15
Rental(LHS)
Vacancy Rate(RHS)
(RM / sqm per year)
-240%
-200%
-160%
-120%
-80%
-40%
0%
40%
80%
120%
160%
200%
0
20
40
60
80
100
120
140
160
180
200
220
Jul/12 Jan/13 Jul/13 Jan/14 Jul/14 Jan/15 Jul/15
New Car Sales(LHS)
(1,000 units)
YoY (RHS)
7
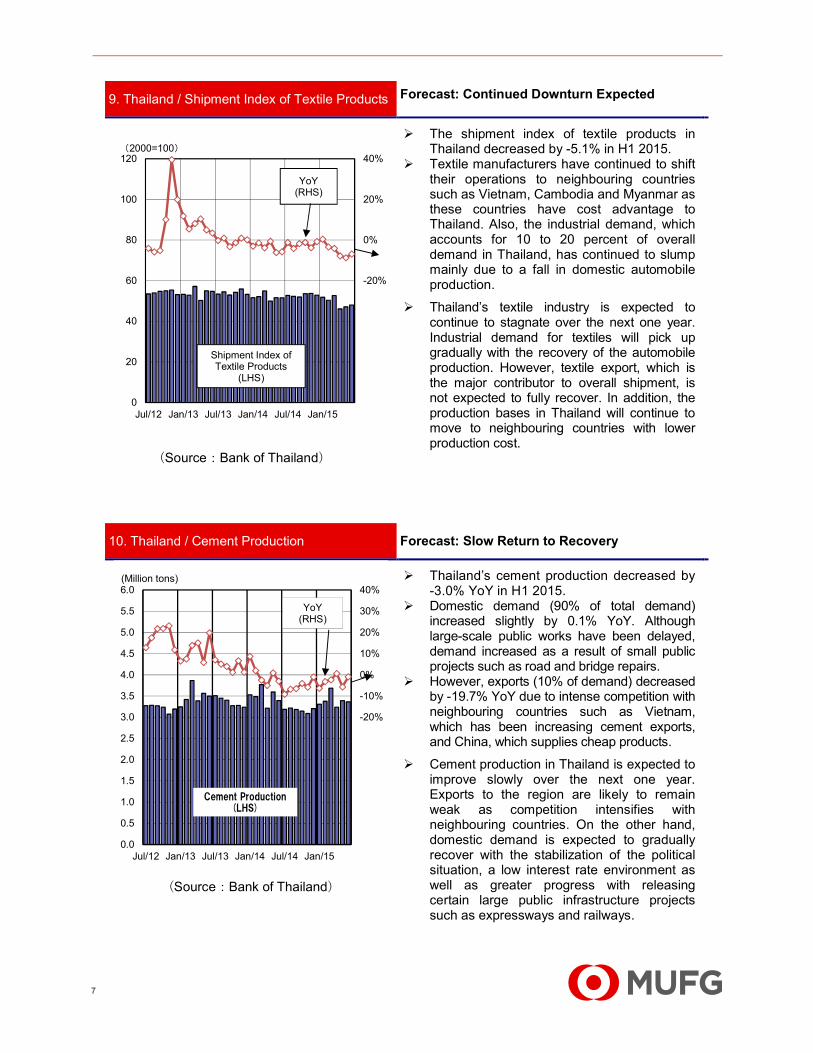
9. Thailand / Shipment Index of Textile Products Forecast: Continued Downturn Expected
(Source:Bank of Thailand)
� The shipment index of textile products in Thailand decreased by -5.1% in H1 2015.
� Textile manufacturers have continued to shift their operations to neighbouring countries such as Vietnam, Cambodia and Myanmar as these countries have cost advantage to Thailand. Also, the industrial demand, which accounts for 10 to 20 percent of overall demand in Thailand, has continued to slump mainly due to a fall in domestic automobile production.
� Thailand’s textile industry is expected to continue to stagnate over the next one year. Industrial demand for textiles will pick up gradually with the recovery of the automobile production. However, textile export, which is the major contributor to overall shipment, is not expected to fully recover. In addition, the production bases in Thailand will continue to move to neighbouring countries with lower production cost.
10. Thailand / Cement Production Forecast: Slow Return to Recovery
(Source:Bank of Thailand)
� Thailand’s cement production decreased by -3.0% YoY in H1 2015.
� Domestic demand (90% of total demand) increased slightly by 0.1% YoY. Although large-scale public works have been delayed, demand increased as a result of small public projects such as road and bridge repairs.
� However, exports (10% of demand) decreased by -19.7% YoY due to intense competition with neighbouring countries such as Vietnam, which has been increasing cement exports, and China, which supplies cheap products.
� Cement production in Thailand is expected to improve slowly over the next one year. Exports to the region are likely to remain weak as competition intensifies with neighbouring countries. On the other hand, domestic demand is expected to gradually recover with the stabilization of the political situation, a low interest rate environment as well as greater progress with releasing certain large public infrastructure projects such as expressways and railways.
-80%
-60%
-40%
-20%
0%
20%
40%
0
20
40
60
80
100
120
Jul/12 Jan/13 Jul/13 Jan/14 Jul/14 Jan/15
(2000=100)
YoY (RHS)
Shipment Index of Textile Products
(LHS)
-80%
-70%
-60%
-50%
-40%
-30%
-20%
-10%
0%
10%
20%
30%
40%
0.0
0.5
1.0
1.5
2.0
2.5
3.0
3.5
4.0
4.5
5.0
5.5
6.0
Jul/12 Jan/13 Jul/13 Jan/14 Jul/14 Jan/15
(Million tons)
Cement Production(LHS)
YoY (RHS)

8
11. Thailand / Retail Sales Index Forecast: Modest Growth Expected
(Source:Bank of Thailand)
� Thailand’s retail sales in the first 5 months of 2015 decreased by -2.7% YoY.
� Domestic consumers continued to be cautious in their spending, attributable in part to high household debt and the impact of weak agriculture product prices on farming households’ income. (Thailand’s household debt-to-GDP ratio is one of the highest in ASEAN at 75.2% in 2014.)
� Sales growth for the Thailand retail sector is expected to be modest over the next one year. Although the recovery of Thai economy is expected to remain slow, consumer confidence is likely to recover gradually due to the stabilization of the political situation.
� While the 2 bombings in Bangkok during Aug 2015 are likely to reduce tourist in-flow, we expect the impact to be short-term, provided the events are one-off cases. The tourism industry may resume growth towards the end of the year.
12. Thailand / Bangkok Office Vacancy Rate & Rental Index
Forecast: Rentals Likely to Remain Stable
(Source:Jones Lang LaSalle)
� Office rents in the Central Business District (CBD) in Bangkok increased by 0.9% QoQ in Q2 2015.
� Vacancy rate has improved marginally from 9.5% in Q1 2015 to 9.0% in Q2 2015 as only 1 new building came on stream in the quarter (Bhiraj Tower at EmQuartier) while demand has generally been stable.
� Office rentals are likely to remain stable over the next one year. Demand growth may slow due to the weaker economic situation. However, this is expected to be offset by the lower supply in 2015 and 2016.
� In addition, supply was very low in 2012-2013 and this has caused some corporate expansions to be put on hold. This pent-up demand will also help to absorb the new supply coming into the market.
-60%
-40%
-20%
0%
20%
40%
60%
100
140
180
220
260
300
340
Jul/12 Jan/13 Jul/13 Jan/14 Jul/14 Jan/15
(2002=100)
YoY (RHS)
Retail Sales Index
(LHS)
0%
5%
10%
15%
20%
25%
30%
4,000
5,000
6,000
7,000
8,000
9,000
10,000
3Q/12 1Q/13 3Q/13 1Q/14 3Q/14 1Q/15
Rental(LHS)
Vacancy Rate (RHS)
(THB/sqm per year)

9
13. Indonesia / Automobile Sales Forecast: Downward Trend Expected to Continue
(Source:Astra International)
� Automobile sales in Indonesia dropped by -18.2% YoY to 525 thousand units in H1 2015.
� Reduced consumer appetite due to the economic slowdown and higher fuel prices after the removal of the fuel subsidy in November 2014 have led to the decrease in automobile sales.
� Sales of passenger vehicles decreased by -19.1% YoY to 381 thousand units. Sales of popular LCGCs (Low Cost Green Cars) also decreased by -4.2% YoY. Sales of commercial vehicles decreased by -15.7% YoY to 144 thousand units.
� Bestselling Toyota’s sales decreased by -27.1% YoY to 163 thousand units (31.0% market share), followed by Daihatsu, which decreased by -6.8% YoY to 89 thousand units (16.9%).
� Automobile sales are expected to continue to decline over the next one year as the weak economy reduces consumer appetites and car prices rise due to the weakening rupiah. The local industry association expects sales in 2015 to decrease by more than -15% YoY to less than 1 million units.
14. Indonesia / Motorcycle Sales Forecast: Downward Trend Expected to Continue
(Source:Astra International)
� Motorcycle sales in Indonesia dropped by -24.5% YoY to 3.17 million units in H1 2015.
� Reduced consumer appetite due to the economic slowdown and higher fuel prices after the removal of the fuel subsidy in November 2014 have led to the decrease in motorcycle sales.
� Honda’s sales declined by -18.8% YoY to 2.13 million units (67.1% market share), followed by Yamaha, which decreased by -30.9% YoY to 919 thousand units (29.0%).
� Motorcycle sales in 2015 are expected to decline for the first time in 3 years as consumer appetite remains weak due to the poor economy. The local industry association expects motorcycle sales in 2015 to decrease by -15% YoY to about 6.70 million units.
-240%
-200%
-160%
-120%
-80%
-40%
0%
40%
80%
120%
0
20
40
60
80
100
120
140
160
180
Jul/12 Jan/13 Jul/13 Jan/14 Jul/14 Jan/15 Jul/15
New Car Sales(LHS)
YoY (RHS)
(1,000 units)
-100%
-80%
-60%
-40%
-20%
0%
20%
40%
0
200
400
600
800
1,000
1,200
1,400
Jul/12 Jan/13 Jul/13 Jan/14 Jul/14 Jan/15 Jul/15
YoY (RHS)
(1,000 units)
New Motorcycle Sales(LHS)
10
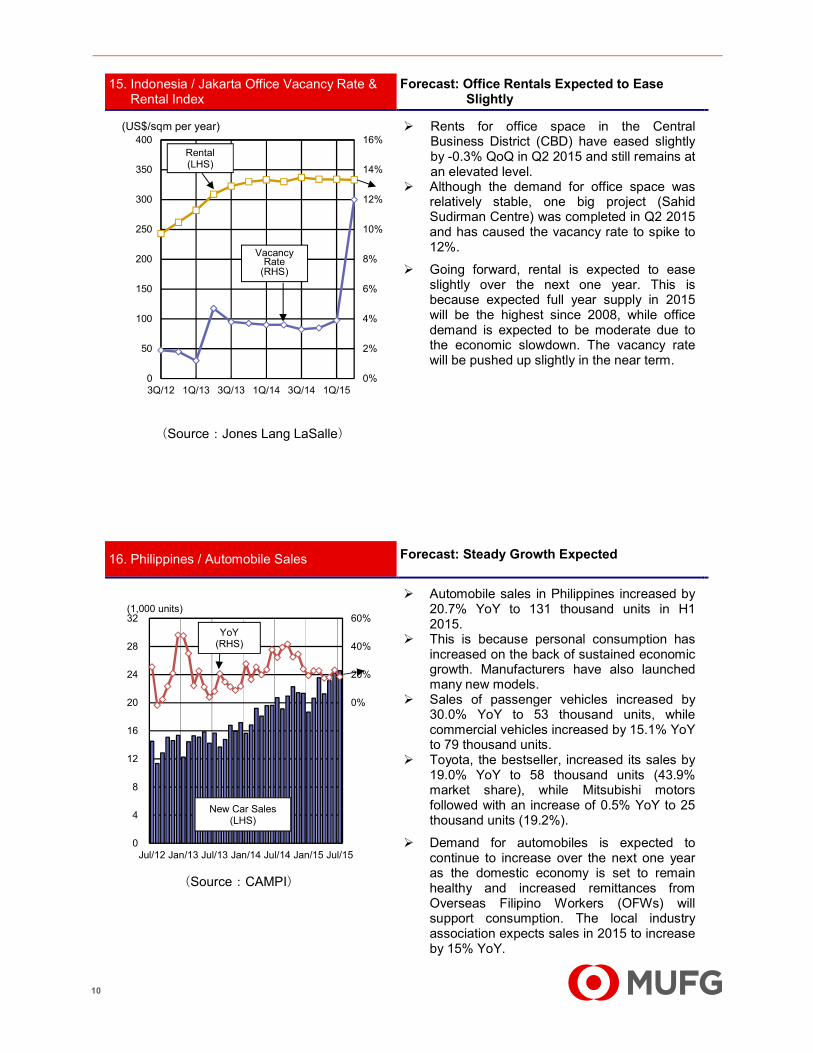
15. Indonesia / Jakarta Office Vacancy Rate & Rental Index
Forecast: Office Rentals Expected to Ease Slightly
(Source:Jones Lang LaSalle)
� Rents for office space in the Central Business District (CBD) have eased slightly by -0.3% QoQ in Q2 2015 and still remains at an elevated level.
� Although the demand for office space was relatively stable, one big project (Sahid Sudirman Centre) was completed in Q2 2015 and has caused the vacancy rate to spike to 12%.
� Going forward, rental is expected to ease slightly over the next one year. This is because expected full year supply in 2015 will be the highest since 2008, while office demand is expected to be moderate due to the economic slowdown. The vacancy rate will be pushed up slightly in the near term.
16. Philippines / Automobile Sales Forecast: Steady Growth Expected
(Source:CAMPI)
� Automobile sales in Philippines increased by 20.7% YoY to 131 thousand units in H1 2015.
� This is because personal consumption has increased on the back of sustained economic growth. Manufacturers have also launched many new models.
� Sales of passenger vehicles increased by 30.0% YoY to 53 thousand units, while commercial vehicles increased by 15.1% YoY to 79 thousand units.
� Toyota, the bestseller, increased its sales by 19.0% YoY to 58 thousand units (43.9% market share), while Mitsubishi motors followed with an increase of 0.5% YoY to 25 thousand units (19.2%).
� Demand for automobiles is expected to continue to increase over the next one year as the domestic economy is set to remain healthy and increased remittances from Overseas Filipino Workers (OFWs) will support consumption. The local industry association expects sales in 2015 to increase by 15% YoY.
0%
2%
4%
6%
8%
10%
12%
14%
16%
0
50
100
150
200
250
300
350
400
3Q/12 1Q/13 3Q/13 1Q/14 3Q/14 1Q/15
(US$/sqm per year)
Rental(LHS)
Vacancy Rate
(RHS)
-100%
-80%
-60%
-40%
-20%
0%
20%
40%
60%
0
4
8
12
16
20
24
28
32
Jul/12 Jan/13 Jul/13 Jan/14 Jul/14 Jan/15 Jul/15
New Car Sales(LHS)
YoY (RHS)
(1,000 units)

11
17. Philippines / Manila Office Vacancy Rate & Rental Index
Forecast: Office Rentals Likely to Be Stable
(Source:Jones Lang LaSalle)
� Rents for office space in the Makati district (the Philippines’ metropolitan area) in Manila grew by a marginal 0.7% QoQ in Q2 2015.
� Only 1 new office building was completed in Q2 2015 as 5 other scheduled completions have been delayed to H2 2015.
� Meanwhile, office vacancy rate was stable at 4.3% in Q2 2015 due to sustained demand from financial services and manufacturing. This is in addition to the traditional demand from Business Process Outsourcing (BPO) companies.
� Despite sustained demand, office rents are expected to remain stable over the next one year amid new supply coming on stream. Due to the delays of completion in H1 2015, it is expected that there will be substantial new supply of more than 300k sqm in H2 2015(from 12 projects). As such, the vacancy rate may be pushed up temporarily.
18. Vietnam / Computer & Electronics Components Exports
Forecast: Steady Growth Expected
(Note) “YoY” shows the figures from November 2012, as this chart was created based on data compiled
from November 2011 onwards. (Source:CEIC)
� Vietnam’s exports of electronic components increased by 36% YoY in H1 2015.
� Electronics exports have continued to increase as major Japanese and South Korean manufacturers have increased their investment in Vietnam and are expanding production.
� Exports of smartphones and their components make up 65% of electronics exports and increased by 26.8% YoY, while exports of PCs and PC parts also grew strongly by 59.4% YoY.
� Electronic exports are expected to continue to grow steadily over the next one year as demand for information and communications devices such as tablets and smartphones continues to increase. Also, the continued investment for electronic production plants by foreign manufacturers will help to boost exports.
0%
5%
10%
15%
20%
4,000
6,000
8,000
10,000
12,000
3Q/12 1Q/13 3Q/13 1Q/14 3Q/14 1Q/15
Rental (LHS)
Vacancy Rate (RHS)
(PHP / sqm per year)
-400%
-300%
-200%
-100%
0%
100%
200%
0
1,000
2,000
3,000
4,000
5,000
6,000
Jul/12 Jan/13 Jul/13 Jan/14 Jul/14 Jan/15 Jul/15
YoY (Note)
(RHS)
Electronics Export Value(LHS)
(USD Million)

12
19. Vietnam / Automobile Sales Forecast: Steady Growth Expected
(Source:VAMA)
� Automobile sales in Vietnam increased by 58.3% YoY to 103 thousand units in H1 2015.
� This is because the lowering of the vehicle registration tax in major cities such as Hanoi and Ho Chi Minh City increased sales of passenger vehicles. Also, a crackdown on overloaded trucks increased the demand for commercial vehicles from transport companies.
� Sales of passenger vehicles increased by 81.1% YoY to 43 thousand units, while sales of commercial vehicles increased by 45.1% YoY to 60 thousand units.
� Kia became the bestselling manufacturer due to a jump in its commercial vehicle sales, with total sales increasing by 84.0% YoY to 26 thousand units (25.3% market share). Toyota’s sales increased by 38.3% YoY to 23 thousand units (22.3%).
� Automobile sales are expected to continue to grow over the next one year as the economy recovers and some manufacturers slash prices to spur sales. The local industry association expects sales in 2015 to surge to a record high of 200 thousand units.
20. Vietnam / Textile Exports Forecast: Continued Growth Expected
(Source:General Statistics Office)
� Vietnam’s textile export value increased by 8.2% YoY in H1 2015.
� Demand from major export destinations in Asia (Japan, South Korea, etc.) and the US has grown steadily.
� Also, manufacturers have continued to shift production bases to Vietnam as production costs in China have risen and the expansion of Chinese domestic demand has resulted in sluggish growth in export capacity. In addition, rising labour costs in Thailand have also caused production to shift to Vietnam, pushing up export values.
� Vietnam’s textile export volume is expected to increase over the next one year. Vietnam has competitive export advantages in its main sewing industry as it has skilled labour at a relatively low cost. Also, production capacity is expected to continue to grow as new garment factories are being planned.
� Thus, Vietnam’s textile exports are likely to grow at a faster rate compared to other textile producing countries.
-300%
-200%
-100%
0%
100%
200%
0
50
100
150
200
250
Jul/12 Jan/13 Jul/13 Jan/14 Jul/14 Jan/15 Jul/15
YoY (RHS)
New Car Sales(LHS)
(100 units)
-200%
-150%
-100%
-50%
0%
50%
100%
0
5
10
15
20
25
30
Jul/12 Jan/13 Jul/13 Jan/14 Jul/14 Jan/15 Jul/15
YoY (RHS)
Textile Export Value(LHS)
(USD Hundred Million)

13
21. India / Crude Steel Production Forecast: Uptick in Growth to Be Gradual
(Source:World Steel Association)
� India’s crude steel production in the first 7 months in 2015 increased by 4.2% YoY, to 50.0mt.
� Domestic demand, which is the major contributor to the overall production, increased by around 4.5% over the same period. Demand from key end-use sectors like infrastructure and construction was yet to pick up, but automobile demand is showing signs of revival.
� Meanwhile, low-priced Chinese steel imports into India in the first 7 months increased 45% YoY and are proving to be an added negative for domestic production.
� Going forward, steel demand growth is expected to improve gradually over the next one year and gain pace thereafter. Steel-intensive infrastructure and construction sectors should get a boost from government spending. Improving consumer sentiment will aid recovery in other end-use sectors like automobiles and consumer durables. Overall, domestic steel demand is forecasted to grow by 5-6% YoY in 2015 and 2016.
22. India / Automobile Sales Forecast: Slow Return to Recovery
(Source:Monthly Review of the Indian Economy)
� Automobile sales in India increased by 4.9% YoY to 1.68 million units in H1 2015.
� This is due to improved consumer sentiment after the new government came into power in June 2014. Also, manufacturers have been aggressively launching new models.
� Sales of passenger vehicles increased by 5.0% YoY to 1.36 million units, while sales of commercial vehicles grew by 4.6% YoY to 317 thousand units as the demand for heavy commercial vehicles increased steadily.
� Maruti Suzuki’s sales increased by 9.4% YoY to 623 thousand units (37.2% market share), while Tata in second place increased by 5.2% YoY to 229 thousand units (13.7%).
� Automobile sales in 2015 are expected to return to growth for the first time in 3 years as the economy slowly recovers and manufacturers launch new models. The local industry association expects sales in 2015 to increase by 5% YoY to 3.35 million units.
-20%
-15%
-10%
-5%
0%
5%
10%
15%
0
2
4
6
8
10
12
14
Jul/12 Jan/13 Jul/13 Jan/14 Jul/14 Jan/15 Jul/15
YoY (RHS)
Steel Production (LHS)
(Million tons)
‘
-80%
-60%
-40%
-20%
0%
20%
40%
0
100
200
300
400
500
600
Jul/12 Jan/13 Jul/13 Jan/14 Jul/14 Jan/15 Jul/15
(1,000 units)
Passenger Car Sales(LHS)
Commercial Car Sales
(LHS)
YoY (RHS)

14
23. India / Motorcycle Sales Forecast: Slow Growth Expected
(Source:Monthly Review of the Indian Economy)
� Motorcycle sales in India increased by 0.2% YoY to 7.83 million units in H1 2015.
� Although the new government has boosted consumer appetites, poor weather conditions have affected the livelihoods of rural consumers, who form the bulk of motorcycle buyers. Hence, motorcycles sales only increased by a small percentage.
� The scooter segment, which has been growing rapidly in recent years, increased by 12.7% YoY to 2.25 million units. However, the mainstay motorcycle segment declined by -4.1% YoY to 5.21 million units.
� Top-ranked Hero Motocorp’s sales decreased by -2.8% YoY to 3.14 million units (40.1% market share), while Honda’s sales increased by 7.7% YoY to 2.12 million units (27.1%) as it has launched many new models (especially scooters).
� Motorcycle sales are expected to continue to grow slowly over the next one year due to steady demand from rural regions and new launches by manufacturers. The local industry association expects sales in 2015 to increase by 3% YoY to 16.5 million units.
-60%
-40%
-20%
0%
20%
40%
0
50
100
150
200
250
Jul/12 Jan/13 Jul/13 Jan/14 Jul/14 Jan/15 Jul/15
YoY (RHS)
New Motorcycle Sales(LHS)
(10,000 units)

15
Real GDP Growth Consumer Price Index (CPI)
Export Growth Rate Exchange Rates to USD (indexation)
Unemployment Rate Crude Oil Prices (WTI)
-2
0
2
4
6
8
10
12
14
Jul/12 Jan/13 Jul/13 Jan/14 Jul/14 Jan/15 Jul/15
Singapore Malaysia Thailand
Indonesia Philippines India
(%)
(Source) CEIC
-20
-10
0
10
20
30
40
50
3Q/12 1Q/13 3Q/13 1Q/14 3Q/14 1Q/15
Singapore Malaysia Thailand
Indonesia Philippines Vietnam
India
(%)
(Source) CEIC
70
90
110
130
150
170
Jul/12 Jan/13 Jul/13 Jan/14 Jul/14 Jan/15 Jul/15
Singapore
Malaysia
Thailand
Indonesia
Philippines
India
(Jan/04=100)
(Source) CEIC
0
1
2
3
4
5
6
7
8
9
10
3Q/12 1Q/13 3Q/13 1Q/14 3Q/14 1Q/15
Singapore Malaysia Thailand
Indonesia Philippines Vietnam
(%)
(Note) The figures of Indonesia show annual data. (Source) CEIC
0
20
40
60
80
100
120
140
Jul/12 Jan/13 Jul/13 Jan/14 Jul/14 Jan/15 Jul/15
(USD / barrel)
(Source) Bloomberg
Appendix
-2
0
2
4
6
8
10
12
14
3Q/12 1Q/13 3Q/13 1Q/14 3Q/14 1Q/15
Singapore Malaysia Thailand
Indonesia Philippines Vietnam
India
(%)
(Source) CEIC

16
Bank of Tokyo Mitsubishi UFJ’s Network in Southeast and South Asia
This report shall not be construed as solicitation to take any action such as purchasing/selling/investing in financial market products. In taking any action, each reader is requested to act on the basis of his or her own judgment. This report is based on information believed to be reliable, but we do not guarantee, and do not accept any liability whatsoever for, its accuracy and we accept no liability whatsoever for any loss or damage of any kind arising out of the use of all or any part of this report. The contents of the report may be revised without advance notice. Also, this report is a literary work protected by copyright. No part of this report may be reproduced in any form without express statement of its source. Bank of Tokyo-Mitsubishi UFJ is regulated by the Financial Services Authority. Copyright © The Bank of Tokyo-Mitsubishi UFJ, Limited 2015 No part of this publication may be reproduced, stored in a retrieval system or transmitted without the prior written permission of The Bank of Tokyo-Mitsubishi UFJ Limited.
Publisher: The Bank of Tokyo Mitsubishi UFJ, Corporate Research Division (Singapore)
9 Raffles Place #01-01 Republic Plaza, Singapore 048619 Yuji Takekoshi (65) 6531- 4624 [email protected]
Kazuhiro Hori (65) 6231- 1412 [email protected]
Kohei Yamaguchi (65) 6230- 4327 [email protected]
Xavier Kong (65) 6231- 1857 [email protected]
Say Yong Koh (65) 6230- 4376 [email protected]
Aishwarya Iyer (65) 6231- 1690 [email protected]
Diana Cheong (65) 6506- 3286 [email protected]
ホーチミン
Phnom Penh
ニムラナ
(2014年にアユタヤ銀行と統合予定)
Ho Chi Minh
Yangon
Branch Corporate Banking OfficeRepresentative Office
Sub-branch Service Point
Karachi
Chennai
Mumbai
New Delhi
Hanoi
Manila
Yangon
Dhaka
Bangkok
Kuala Lumpur Labuan
Surabaya
Bandung
Jakarta
Singapore
Bekasi
MM2100 Industrial Park
Caravan
Sunter
Cengkareng
Tjikampek
Kota Deltamas
Neemrana
Bangalore
(merged with Bank of Ayudhya)
Ho Chi Minh
Phnom Penh