single source baseline profit rates, capital servicing rates … · b profit rate, capital...
TRANSCRIPT

Single source baseline profit rate, capital servicing rates and funding adjustment methodology 2017/18 March 2017

1 Baseline profit rate, capital servicing rates and funding adjustment methodology 2017/18
Contents
Baseline profit rate, capital servicing rates and funding adjustment methodology 21. Introduction 2
Baseline profit and capital servicing rates 32. Key terms and definitions 3
3. Approach to the baseline profit rate and capital servicing rates 4
4. Functional analysis 6
5. External and internal comparables 7
6. Identify database 8
7. Perform search 8
8. Review company information 11
9. Select profit level indicator 12
10. Adjustments 12
11. Calculating the underlying profit rates and composite baseline profit rate 14
12. Ensuring that data is maintained year-on-year 14
The SSRO funding adjustment 15
1. The calculation of the SSRO funding adjustment 15
2. Data sources and adjustments 15
Appendix A – Activity characterisations 17
Appendix B – Industry codes and text search terms used in activity type search strategies 20
Appendix C – Orbis data fields and calculation steps for the underlying profit rates 24

2Baseline profit rate, capital servicing rates and funding adjustment methodology 2017/18
1. Introduction
1.1 Under the Defence Reform Act 2014 (the Act), the Single Source Regulations Office (SSRO) is required annually to review the figures used to determine the contract profit rate for pricing qualifying defence contracts (QDCs) and qualifying sub-contracts (QSCs). Section 19(2) of the Act requires that, for each financial year, the SSRO must provide the Secretary of State with its assessment of the appropriate baseline profit rate and capital servicing rates.
1.2 The Single Source Contract Regulations 2014 (the Regulations) provide that from 2017/18 the SSRO’s funding will be provided by deductions from the price payable under QDCs and QSCs. The extent of the funding recovered by this means it is not set out in the Act. The explanatory notes to the Act further set out an expectation that up to half of the SSRO’s funding requirements are to be met by deductions from the price payable by the MOD to contractors in QDCs and QSCs. The deduction is implemented as an adjustment (Step 4) in the calculation of the contract profit rate for QDCs and QSCs.
1.3 Section 19(2) of the Act requires the SSRO to provide the Secretary of State with its assessment of the appropriate funding adjustment rate for that year. The Regulations require a zero rate until the end of 2016/17. After that, the funding adjustment rate will need to be published in the London Gazette in accordance with section 19(4) of the Act.
1.4 This document sets out the SSRO’s methodology which is used to calculate the baseline profit rate, capital servicing rates and SSRO funding adjustment for recommendation to the Secretary of State in January of each year.
1.5 The SSRO’s statutory Guidance on the baseline profit rate and its adjustment provides details on the steps required to determine the contract profit rate.
Baseline profit rate, capital servicing rates and funding adjustment methodology

3 Baseline profit rate, capital servicing rates and funding adjustment methodology 2017/18
2. Key terms and definitions
Baseline profit and capital servicing rates
Activity characterisation A written description of the group of economic activities and the relevant boundaries which define an activity type.
Activity type A group of economic activities, defined by the SSRO, which correspond to types of activity that contribute to the delivery of QDCs and QSCs. For example ‘Develop and Make’, ‘Provide and Maintain’, ‘Ancillary Services’ or ‘Construction’.
Comparability principle The aim of the baseline profit rate is to provide the starting point in the determination of the contract profit rate (totalling steps one to six). It is set with reference to the returns of companies whose economic activities are included in whole or in part in the activity types that contribute to the delivery of QDCs and QSCs.
Comparable company A company whose economic activities are included, in whole or in part, within an activity type.
Comparator group A group of comparable companies undertaking one or more of the economic activities which make up an activity type.
Economic activity An activity that involves the production, distribution and consumption of goods and services.
NACE Rev 2 code The European Union system of classifying economic activities for the purpose of statistical and other analysis. The SSRO uses NACE codes in conjunction with text search terms to identify comparable companies within the Orbis database.
OECD Guidelines The OECD transfer pricing guidelines for multinational enterprises and tax administrations (2010). This provides guidance on the application of the "arm’s length principle", which is the international consensus on transfer pricing.
Orbis The database of company-specific information and data supplied by Bureau van Dijk. The SSRO uses this to identify comparable companies and as a source of financial data for those comparable companies for use in the calculation of the baseline profit rate.
Text search term A word or group of words relating to economic activities used to identify comparable companies. For example ‘manufacture’ or ‘production’. The SSRO uses text search terms in conjunction with NACE codes to identify comparable companies within the Orbis database.
Underlying profit rate The median profit level indicator of the comparator group after deducting allowances for the servicing of capital employed. An unadjusted underlying rate can also be calculated using financial data for the comparator companies that is not adjusted for capital servicing.

4Baseline profit rate, capital servicing rates and funding adjustment methodology 2017/18
3. Approach to the baseline profit rate and capital servicing rates
3.1 This section summarises the approach taken in the SSRO’s methodology for calculating the baseline profit rate (BPR) and capital servicing rates (CSRs).
3.2 In overview, the methodology identifies companies whose economic activities are included in whole or in part in the activity types that contribute to the delivery of QDCs and QSCs. These companies form the comparator groups for each activity type. The profit range for each set of comparator groups is then used to calculate an underlying rate for each activity type.
3.3 The comparable company search process follows the transfer pricing ‘arm’s length principle’ set out by the OECD. Transfer pricing is a concept which seeks to ensure that companies operating in a number of territories receive appropriate income and profit in each, as if each territory were operating at arm’s length as a third party would do. The UK’s transfer pricing legislation details how transactions between connected parties are handled and in common with many other countries is based on the internationally recognised ‘arm’s length principle’1. Transfer pricing is employed extensively by multinational enterprises and tax authorities globally and as such the OECD Guidelines and their related expectations and practices are widely known and understood, and their practical implications have been explored.
3.4 This process is used to calculate four underlying profit rates based on the following activity types:
• Develop and Make (D&M);
• Provide and Maintain (P&M);
• Ancillary Services; and
• Construction.
3.5 Three year rolling averages are then used as the basis for the composite baseline profit rate of ‘Develop and Make’ and ‘Provide and Maintain’ that the SSRO recommended to the Secretary of State for 2017/18.
3.6 The application of the arm’s length principle in international taxation is analogous to the SSRO’s requirement to recommend a baseline profit rate which simulates the outcome of a market process (for example a competitive tender). Box 1 sets out an overview of the application of the arm’s length principle as it would apply in the context of international taxation.
3.7 The principle of the BPR is to ensure that QDCs receive a fair level of profit on the MOD contracts, consistent with their functions performed. While this approach is distinct from tax matters, the goal is similar to that of certain transfer pricing methods, which seek to identify an arm’s length profit mark-up by benchmarking returns achieved by comparable companies. Figure 1 illustrates the application of best practice in transfer pricing in the context of the BPR.
1 Part 4 Taxation (International and Other Provisions) Act 2010.

5 Baseline profit rate, capital servicing rates and funding adjustment methodology 2017/18
3.8 The methodology for calculating the BPR from comparator companies selected using this approach involves:
i. calculating a profit level indicator for each company;
ii. calculating a capital servicing adjustment for each company;
iii. adjusting each company profit level indicator for capital servicing;
iv. removing loss makers in the current year;
v. calculating an underlying profit rate; and
vi. calculating the baseline profit rate.
3.9 The remainder of this document sets out the details relating to the application of each step taken by the SSRO.
Box 1: Application of the ‘arm’s length principle’ in taxation
“Step 1: Determination of years to be covered.
Step 2: Broad-based analysis of the taxpayer’s circumstances.
Step 3: Understanding the controlled transaction(s) under examination, based in particular on a functional analysis, in order to choose the tested party (where needed), the most appropriate transfer pricing method to the circumstances of the case, the financial indicator to be tested (in the case of a transactional profit method), and to identify the significant comparability factors to be taken into account.
Step 4: Review of existing internal comparables, if any.
Step 5: Determination of available sources of information on external comparables where such external comparables are needed taking into account their relative reliability.
Step 6: Selection of the most appropriate transfer pricing method and, depending on the method, determination of the relevant financial indicator (e.g. determination of the relevant net profit indicator in case of a transactional net margin method).
Step 7: Identification of potential comparables: determining the key characteristics to be met by any uncontrolled transaction in order to be regarded as potentially comparable, based on the relevant factors identified in Step 3 and in accordance with the comparability factors set forth in paragraphs 1.38-1.63.
Step 8: Determination of and making comparability adjustments where appropriate.
Step 9: Interpretation and use of data collected, determination of the arm’s length remuneration.”
OECD Guidelines, 3.4

6Baseline profit rate, capital servicing rates and funding adjustment methodology 2017/18
4. Functional analysis
4.1 Steps 3 and 7 in Box 1 are clear that the transactions (or activity) to be tested (in this case QDCs and QSCs) must be understood and the component aspects identified and sought in comparable companies. To do this, the activities to be tested must be characterised.
4.2 In developing these activity characterisations, the SSRO considered the nature of the activities involved in QDCs and QSCs. The SSRO invests time and resource to understand the defence industry as well as the contracts which are reported to it. The organisation does this in a number of different ways:
• It undertakes a regular programme of site visits to defence companies to understand their businesses and the nature of the work involved in QDCs.
• It regularly reviews the MOD Contracts Bulletin to identify the type of contracts both competed and single source being awarded.
• It logs queries to the SSRO Helpdesk so it can understand the areas where contractors may not be clear about the requirements of the regime and how these apply to individual contracts.
• It provides information on all QDCs to SSRO staff so they can understand at a high level the elements of each contract.
• It attends a range of defence industry events like the DSEI conference 2015, Farnborough Air Show and DPRTE 2016 to identify future developments and requirements.
• It has a number of staff who have experience of defence procurement and/or the defence environment.
Figure 1: Application of best practice approach to transfer pricing

7 Baseline profit rate, capital servicing rates and funding adjustment methodology 2017/18
• It speaks with the MOD integrated project teams to understand the complexity involved in defence procurement contracts.
• It attends training courses delivered by the Defence Academy to understand future priorities for the Front Line Commands.
• It reviews the annual reports of defence companies to understand past performance and future priorities.
• It reviews individual company details to confirm whether they are a comparator company in the calculation of the baseline profit rate.
• It learns about each individual contract through the statutory reports it receives and the additional information which is provided by contractors.
• It provides statistical bulletins based on what it learns across contracts on a range of topics, such as pricing methods, and sub-contracting.
4.3 Descriptions of the activities a company is typically expected to undertake to be considered as comparable are at Appendix A.
4.4 These activities, which form the characterisations, are not exclusive to defence contractors. For example, manufacturers of industrial production or agricultural equipment may fall within essentially the same criteria and as such may be considered as potentially comparable manufacturing activities (subject to other considerations such as location).
4.5 The OECD acknowledges that a search focused purely on a product can return limited results, particularly in smaller or niche industries. A broader search also negates potential concerns regarding the influence of government contracting under frameworks such as QDCs, which could be viewed as influencing the results.
4.6 As such the SSRO has developed these activity characterisations based on the principle that a comparable company is one that undertakes economic activities that are included in whole or in part in the activity types that contribute to the delivery of QDCs and QSCs.
5. External and internal comparables
5.1 This stage involves identifying companies that undertake comparable economic activities and transact with enterprises on an independent basis. Principally these will be ‘external comparables’, where the company does not engage in the delivery of QDCs or QSCs. However it may also include ‘internal comparables’, where companies transact on a single source basis with the MOD alongside competitive business with independent parties. ‘Internal comparables’ would include the MOD’s major single source suppliers.
5.2 Internal comparables will have a close relationship to the transaction involved in a QDC or QSC. However, differences are likely to exist between transactions carried out on a single source basis with the MOD and those with an independent third party. Therefore the SSRO’s approach principally relies on the use of external comparables.
5.3 To address any issues of comparability which may arise from the use of external comparables, the company search process has two stages. The first stage applies tailored search criteria to a database of company information (see section 7). This identifies a range of companies which meet a broad set of comparability criteria. At the second stage the database search is refined using other publicly available information (see section 8).
8Baseline profit rate, capital servicing rates and funding adjustment methodology 2017/18
6. Identify database
6.1 To undertake the search, comparable transactions between independent parties need to be identified. To achieve this, information from a third party database is used.
6.2 The SSRO uses historical reported data of companies as the basis for benchmarking contract profits. The lack of any guarantee that any intragroup transactions are conducted on an arm’s length basis means divisional results are not used. A lack of available contract level data and reliability of forecasts means there is no feasible alternative but to use historical company data to benchmark contract profits.
6.3 A third party database serves two functions in this process. Firstly it provides the functionality to assess companies against a set of search criteria. Secondly it is the source of financial information used to calculate the underlying profit rates.
6.4 A range of publicly available databases exist which can be used to meet these requirements. The Orbis database provided by Bureau Van Dijk has been used by the SSRO. Orbis is a comprehensive, global database containing information on approximately 200 million public and private companies2.
7. Perform search
7.1 Comparable companies are identified by applying the search criteria described in this section using data in the most recent year and the four years prior to that.
7.2 The use of multiple year data is recognised by the OECD guidelines to offer additional insight into factors which may (or should) have influenced the transaction being examined. For example information on changes in size or loss making may indicate at what stage a company is in its life cycle.
7.3 The SSRO defines the ‘most recent year’ as the period running from 1 April to 31 March concluding prior to the company search. In order to be considered for inclusion in the comparator groups, companies are required to have data for the most recent year present in Orbis at the time of the company search. For example to be considered for the 2017/18 comparator group a company must have data for their fiscal year ending between 1 April 2015 to 31 March 2016 inclusive, reported in Orbis.
7.4 When calculating the underlying profit rates, the SSRO uses the most recent year’s financial data from the comparable companies identified in the search.
Active companies
7.5 Companies are only included in the search if they are active trading companies and are not dormant.
Legal form
7.6 Companies are only included in the search if they take on one of the following legal forms:
• Public (PLC, AG, SA, SPS, NV, OYJ, ASA and KK etc.)
• Private (Ltd, Gmbh, SARL, SRL, BV, OY, AS and YK etc.)
7.7 LLPs and partnerships are not included in the search as a result of the potentially incomparable nature of their base costs. For example, payments to partners are not treated as expenses for the firm. Such payments are classified as “partners’ drawings” or distributions rather than operating costs. As such, costs may be understated compared to the costs of companies that pay and recognise salary costs, and the results of LLPs or partnerships could therefore distort the benchmarking results.
2 As of November 2016. Companies are added on a continuous basis. The database search was performed on 16 and 17 November 2016 using Orbis dataset number 153.

9 Baseline profit rate, capital servicing rates and funding adjustment methodology 2017/18
Independence
7.8 It is important to identify only those companies that are independent and transact solely with third parties rather than related entities. In order to select only companies that are independent, at least one of the following is required:
• The company was classified as ‘A’ independent3.
• The company was classified as ‘B’ independent4.
7.9 This excludes subsidiaries and joint ventures to ensure the selection of companies that operate in accordance with the transfer pricing arm’s length principle.
Consolidated accounts test
7.10 The consolidation process removes the direct effects of intragroup transactions. Consolidated accounts can be considered to give a fair reflection of an arm’s length transactions between the group and third parties (subject to the overall independence of the group).
7.11 Unconsolidated group accounts cannot be relied upon as there is no guarantee that any intragroup transactions are conducted on an arm’s length basis. An exception to this is in cases where a company has subsidiaries that are dormant since there will be no related party trading to consider. Companies with unconsolidated accounts and subsidiaries were therefore rejected.
Geographic location
7.12 Companies located in the following regions were included in the search:
• Western Europe5.
• North America6.
7.13 A company’s location is determined by the country of its incorporation (i.e. the place where a company is established and formally registered). A company’s place of incorporation is typically, but not always, the location of its head office and management function.
Latest year of accounts
7.14 ‘2015’7 was selected as the latest year for which a company’s accounts should be available on Orbis.
3 Attached to any company with known recorded shareholders none of which having more than 25 per cent of direct or total ownership.
4 Attached to any company with a known recorded shareholder none of which with an ownership percentage (direct, total or calculated total) over 50 per cent, but having one or more shareholders with an ownership percentage above 25 per cent.
5 Western Europe is defined as the UK, Austria, Belgium, France, Germany, Luxembourg, Netherlands, Switzerland, Denmark, Finland, Greece, Iceland, Ireland, Italy, Malta, Norway, Portugal, Spain and Sweden.
6 North America is defined as the USA and Canada.
7 The ‘2015’ year includes all accounting periods ending between 1 April 2015 and 31 March 2016 inclusive.

10Baseline profit rate, capital servicing rates and funding adjustment methodology 2017/18
Operating revenue (turnover)
7.15 The search includes only companies that meet a minimum turnover level of £5,000,000 for all the last five years (i.e. 2011/12 to 2015/16). This requires companies to have turnover data for all years subject to this criteria. This level of turnover returns a sufficient number of companies to make the process viable.
7.16 Financial results reported in other currencies are converted to GBP using the exchange rates reported on Orbis for each year. The exchange rates used on Orbis come by default from the International Monetary Fund (IMF) website and refer to the closing date of the statement.
Operating profit (EBIT)
7.17 The OECD Guidelines recognise that an independent enterprise would not tolerate indefinite losses, but that an associated enterprise may remain in business under these circumstances if it was beneficial to the group as a whole. Therefore companies are excluded that report a negative EBIT in all of the five years (i.e. 2011/12 to 2015/16)8.
Assets and liabilities
7.18 Companies must have data for tangible fixed assets, current assets, cash and cash equivalents, current liabilities and short-term debt (loans) for the most recent two years (i.e. 2014/15 and 2015/16) available in Orbis.
Function
7.19 To identify appropriate comparable data for the respective activity types, functional criteria are set with reference to NACE Rev 2 codes. A company may have more than one NACE code and the search draws on all codes attributed to a company.
7.20 Within Orbis, each company is provided with a brief trade description, primary business line description and full overview description which indicate their business activities.
7.21 The NACE Rev 2 codes and text search terms used for the 2017/18 baseline profit rate are an updated version of those used for the 2016/17. Revisions incorporated the feedback from the 2016 profit rate consultation, which resulted adding the words ‘defence’ and ‘defense’ to the text search and additional NACE codes9.
7.22 Text search terms were searched for within the Orbis trade description, primary business line description and full overview description for each activity type. In the case of Develop and Make, Construction and Ancillary Services, these were required in addition to having a relevant NACE code in order to target the search more effectively and return a manageable number of companies to review. In the case of Provide and Maintain, companies were selected which had a NACE code or a text search term in order to gain wider coverage to feed into the detailed review.
7.23 The NACE code system is subdivided into a hierarchical, four-level structure. The categories at the highest level are called sections. The first two digits of the code identify the division, the third digit identifies the group, and the fourth digit identifies the class. Where the search applies a NACE code criteria at division or group level, this includes all class level codes that fall beneath it in the hierarchy.
8 This requires companies to have EBIT data for all years under consideration. Where this data is not available, the company is excluded.
9 Review of single source baseline profit and capital servicing rates methodology and adjustment guidance 2016 available on the SSRO website at https://www.gov.uk/government/consultations/review-of-single-source-baseline-profit-and-capital-servicing-rates-methodology-and-adjustment-guidance-2016

11 Baseline profit rate, capital servicing rates and funding adjustment methodology 2017/18
7.24 Tables B1, B2, B3 and B4 in Appendix B present the NACE codes and text search terms used in the search strategy for the activity types of ‘Develop and Make’, ‘Provide and Maintain’, ‘Construction’ and ‘Ancillary Services’.
8. Review company information
8.1 Information on each potential comparator company resulting from the Orbis search is reviewed in detail to determine if it can be accepted for entry into the 2017/18 comparator groups. This involves assessing if the company’s activities are comparable with those set out in the relevant activity characterisation and if it operates in comparable markets.
8.2 The underlying principle is that an ideal comparable company will undertake those activities that are described in the activity characterisation. Therefore in order for a company to be accepted into the 2017/18 comparator groups, positive evidence is required that it undertakes comparable activities in Western Europe and North America. In line with the OECD Guidelines this review follows an iterative process, refining comparability at each stage.
8.3 At the first stage, the Orbis ‘primary business line’ and ‘main production sites’ are reviewed. This is used as a triage to reject companies that are non-comparable, for example those identified in the D&M activity type search that focused on sales or advertising. Rejection is only possible where there is strong positive evidence of non-comparability or where main production sites are located outside of comparable markets.
8.4 Companies not rejected at the first stage are then reviewed in greater detail. Orbis is interrogated to establish the company’s activities and where these take place. A broad range of information is examined, such as the location and activities of any subsidiaries and segmental data. Where positive evidence of comparability or non-comparability could be established the decision to accept or reject the company is made as appropriate.
8.5 Where a decision cannot be reached using Orbis information alone, internet searches are carried out to locate information about the company. Typically this involves examining the company website and, if required, the company reports. Details of the main subsidiaries of the company are also examined where the company is a group or holding company. Following the previous stage, where positive evidence of comparability or non-comparability can be established the decision to accept or reject the company is made. Where this does not yield sufficient information, the website is not accessible or could not be translated to determine comparability, the company is rejected.
8.6 The activities undertaken by group companies as a whole are considered rather than just those of the holding company. For example, the holding company of an airline is deemed to have an aviation-related function irrespective of the specific activities of the holding company.
8.7 Decisions are subject to a further round of reviews for quality assurance purposes. This entire process is supported by independent transfer pricing experts.
8.8 The outcome of the detailed review is a set of comparable companies from which financial indicators are identified to calculate the underlying profit rates.

12Baseline profit rate, capital servicing rates and funding adjustment methodology 2017/18
9. Select profit level indicator
9.1 To determine the underlying profit rate for each activity type, an appropriate profit level indicator (PLI) must be used. A PLI refers to the margin or measure used relative to an appropriate base (for example costs, sales or assets) that is realised from a transaction.
9.2 The net cost plus margin (also known as return on cost of production) is the PLI used by the SSRO. It is the closest equivalent measure of return on Allowable Costs used to determine the profit in QDCs and QSCs. The SSRO uses EBIT as the measure of the return a company makes on its operations. It excludes the impact of tax and financing structures (or other sources of income). EBIT also excludes depreciation and amortisation as contractors may be reimbursed for these through Allowable Costs on a contract by contract basis (where these pass the relevant tests). This maintains consistency with the approach to Allowable Costs10.
9.3 The PLI is calculated as:
10. Adjustments
10.1 Section 17(2) of the Act, and Regulation 11(7), set out the requirement for the capital servicing adjustment at ‘step 6‘:
“Take the amount resulting from step 5 and add to or subtract from it an agreed amount (“the capital servicing adjustment”), so as to ensure that the primary contractor receives an appropriate and reasonable return on the fixed and working capital employed by the primary contractor for the purposes of enabling the primary contractor to perform the contract.”
10.2 The PLI of each comparator company is adjusted to set a baseline with respect to capital employed upon which ‘step 6’ can be added. The approach of the SSRO is to adjust the PLI in proportion to the ratio of fixed and working capital employed by each comparator company. This is the reverse of the approach taken at ‘step 6’ in calculating the capital servicing adjustment set out in Guidance on the baseline profit rate and its adjustment.
10.3 The capital servicing adjustment process reduces issues of comparability driven by the difference in company capital structures. This adjustment acts to ameliorate the effects of extreme outliers in the data and is considered by the SSRO to enhance comparability which is consistent with OECD Guidelines.
10.4 The capital servicing adjusted profit level indicator is calculated according to the following:
Capital servicing adjusted PLI =
10 Single source cost standards: Statutory guidance on Allowable Costs July 2016.
Operating profit/loss
Cost of production
- Fixed capital × CSR FC
Cost of production-
Working capital × CSR WC
Cost of production
Net cost plus =Operating profit/loss
Cost of production
= Operating profit/loss
Operating revenue - Operating profit/loss

13 Baseline profit rate, capital servicing rates and funding adjustment methodology 2017/18
10.5 CSRFC and CSRWC are the capital serving rates for fixed capital and working capital respectively. The SSRO calculates the following capital servicing rates for:
• fixed capital;
• positive working capital;
• negative working capital.
10.6 The figures for fixed and working capital are the average of the opening and closing balances for the most recent year of the company whose PLI is being adjusted. The definitions of each balance sheet item, the relevant Orbis data fields and a detailed breakdown of the calculation of the capital servicing adjusted PLI is at Appendix C.
10.7 The capital servicing rates that apply at this stage are the same as those that apply at Step 6 in the calculation of the baseline profit rate. This ensures that contractors are not disadvantaged should the aggregate credit rating of comparator groups differ from their own.
10.8 Bloomberg and the Bank of England are the sources of data for the capital servicing rates.
Fixed capital rate
10.9 The fixed capital servicing rates use the C40515Y Bloomberg index for 15 year BBB rated daily yields of sterling denominated corporate bonds. The time period is seven years up to and including data available at 30 November in the year immediately prior to that in which the rate being calculated applies.
10.10 The ‘Yellow Book’ regime’s methodology used a BBB- credit rating approximated by a BBB interest rate plus an additional 0.5 percentage points applied. To reflect this legacy issue, the 0.5 percentage point adjustment is applied to all data points up to and including 31 December 2014.
10.11 The fixed capital servicing rate is calculated as the mean average of the seven years of daily data.
Positive working capital rate
10.12 The positive working capital servicing rate is calculated using Bloomberg data for one year BBB rated sterling denominated corporate bonds yields (C4051Y index). The time period is three years up to and including data available at 30 November in the year immediately prior to that in which the rate being calculated applies.
10.13 The ‘Yellow Book’ regime’s methodology used a BBB- credit rating approximated by a one year’s BBB interest, plus the spread between one year Euro BBB and Euro BBB- corporate bond rates. To reflect this legacy issue, a BBB- premium is added to all data points up to and including the 31 December 2014. This premium is approximated as the difference between comparable Euro BBB and BBB- bond yields. The indices used for BBB and BBB- are C4681Y (BBB) and C4691Y (BBB-) prior to 5 June 2014 and BVCSE201 (BBB) and BVCSE101 (BBB-) thereafter.
10.14 The positive working capital servicing rate is calculated as the mean average of the three years of daily data.

14Baseline profit rate, capital servicing rates and funding adjustment methodology 2017/18
Negative working capital rate
10.15 The negative working capital servicing rate is calculated as a three-year mean average of the Bank of England data on monthly interest for short term deposits (CFMBI32 index)11. The time period is three years up to and including data available at 30 November in the year immediately prior to that in which the rate being calculated applies.
10.16 The negative working capital servicing rate is calculated as the mean average of the three years of daily data.
11. Calculating the underlying profit rates and composite baseline profit rate
11.1 Companies that made a loss based on a negative capital servicing adjusted PLI are excluded from this calculation. This is to avoid selecting companies that have going concern issues and to reflect the expectation of positive profit on estimated Allowable Costs12.
11.2 The underlying profit rate for the current year is calculated using the median of comparator company data. At present, the SSRO places no upper limit on the profit level of comparator companies and considers the use of the median average as a suitable alternative to address the distortionary impact of outliers.
11.3 The three-year mean averages of the (capital servicing adjusted) underlying profit rate for the current year and those of the two immediately preceding years are calculated13. The mean average of the resulting rates for ‘Develop and Make’ and ‘Provide and Maintain’ is the composite rate that the SSRO recommended to the Secretary of State for 2017/18.
12. Ensuring that data is maintained year-on-year
12.1 To remain current, the comparable company data will be updated annually to reflect the latest available financial data.
12.2 The companies in the 2017/18 set will be reviewed annually to ensure that they remain appropriate comparators to the activities in question.
12.3 A full refresh of the comparator groups is anticipated every three years, which will involve repeating the end to end process described in this document. The SSRO will continue to monitor Orbis on a regular basis and may conduct a refresh earlier than planned should it be observed that the comparator groups are no longer sufficiently representative of the population of companies in the database.
11 Monthly average of UK resident monetary financial institutions’ (excl. Central Bank) sterling weighted average interest rate - time deposits with fixed original maturity <=1 year from private non-financial corporations (in percent) not seasonally adjusted
12 The construct of the profit formula is a markup on estimated Allowable Costs. Therefore we only include markup benchmarks in our calculations.
13 Underlying rates for Construction and Ancillary Services were calculated by the SSRO in developing its recommendation for the 2016/17 rate, although these were not published at the time. No data was collected on the four activity type prior to the SSRO introducing its revised methodology for 2016/17. Therefore the single underlying rate punished for 2015/16 is used in the calculation.

15 Baseline profit rate, capital servicing rates and funding adjustment methodology 2017/18
The SSRO funding adjustment
1. The calculation of the SSRO funding adjustment
1.1 The method to calculate the funding adjustment is intended to set it at a level that allows the MOD to recover half of the SSRO’s costs through a reduction in the amounts paid on single source contracts shared across contractors based upon the value of their QDCs14.
1.2 The SSRO funding adjustment is calculated as:
SSRO funding adjustment =
1.3 The SSRO’s costs, and the costs of additional tasks requested by the Secretary of State, are the mean averages of the three full financial years preceding the year of the recommendation.
1.4 Where the SSRO’s audited financial information is not yet available for three years, the funding adjustment will be based on those years that are available. For the 2017/18 funding adjustment the SSRO will use audited financial information for the year 2015/16 only. For 2018/19, the SSRO will use two years’ (2015/16 and 2016/17) costs, and three year averages will take effect from 2019/20 onwards.
1.5 The total value of QDCs will be a mean average of the annual sum of the Total Allowable Costs (including any Risk Contingency Allowance) values reported in the Contract Pricing Statement Report for all QDCs signed in each of the three preceding financial years. Where contract amendments are made the most recently reported values will be used but each contract will be included only once in the calculation.
1.6 QDC data will be drawn from the period which aligns to that used for SSRO running costs. Where information is not available for three years it will be based on those years that are available. For the 2017/18 funding adjustment the SSRO will use reported Allowable Cost values from 1 April 2015 until 31 March 2016.
2. Data sources and adjustments
2.1 All SSRO costs including referrals and one-off items will be included unless specifically incurred as a result of a request for additional work by the Secretary of State. The part year costs incurred during the set-up year (2014/15) and costs incurred by the MOD in establishing the SSRO will not be included.
2.2 The SSRO costs and the costs of additional tasks requested by the Secretary of State will be drawn from the audited financial statements in the preceding three financial years. The costs are drawn from the Statement of Comprehensive Net Expenditure – Net Operating Expenditure. This means capital expenditure is accounted for via depreciation rather than in cash terms (the SSRO is funded and pays for capital expenditure as it is incurred).
14 This includes QSCs.
1
2
xSSRO costs - costs of additional tasks requested by the Secretary of State
Total value of QDCs

16Baseline profit rate, capital servicing rates and funding adjustment methodology 2017/18
2.3 The total costs of QDCs will be extracted from DefCARS. The total value of QDCs is based on:
• Data for any contract which became a QDC between 1 April and 31 March of a given financial year, i.e. 1 April 2015 to 31 March 2016.
• The total Allowable Costs (including any Risk Contingency Allowance) reported in the latest available Contract Notification Reports as of the date of extraction.
• The QDCs’ data used to calculate the 2017/18 SSRO funding adjustment was extracted from DefCARS on 21 November 2016.
17 Baseline profit rate, capital servicing rates and funding adjustment methodology 2017/18
Appendix A – Activity characterisations
1. Develop and Make
1.1. Companies undertaking comparable activities considered as ‘Develop and Make’ are expected to engage in manufacturing and the design and development contributing to that process. This would therefore not include manufacturing on behalf of a hiring firm that supplies the design, or those solely undertaking research or design work with no associated manufacturing.
1.2. Comparable activities would typically be of the type that can be likened to those involved in producing equipment used for military or defence purposes. This would include scientific or technical research, design, development or testing activities leading to the production of self-contained sub-systems or finished goods. To the extent that a product is being assembled or constructed then it is likely to represent comparable manufacturing. This could cover a broad range of products such as structural metal goods, machinery, electronic and mechanical subsystems, vessels, containers, general machinery, ships, aircraft, and wheeled or tracked vehicles or other means of transportation and other items of machinery of an industrial nature. If the product is a commoditised unit or processed raw manufacturing input, for example a screw, bulb, sheet metal, shaped plastic, ancillary items such as basic tools, then this may not be sufficiently complex and is likely to be excluded. Mechanical components such as pumps, actuators and motors that are not of a commoditised nature are likely to be considered the output of a comparable manufacturing process.
1.3. The value added, cost base or profits of the business are expected to principally derive from the manufacturing, design and development activities as described above. For example comparable firms would not be expected to derive the majority of their value added through the purchase of raw materials, luxury branding, the exploitation of patents and copyrights or distribution activities. It may be acceptable for comparable firms to engage in some loosely associated activities as part of delivering core comparable business (for example the procurement of inputs and the distribution and marketing of final goods). However these activities are not expected to extend beyond what might reasonably be required to deliver the company’s principal business. Significant involvement in activities that are obviously non-comparable in nature (for example provision of financial services, marketing or food processing) would be cause to reject a company.
1.4. The end customers for the outputs generated by comparable companies are expected to be other businesses, institutions or governments. Comparable companies are not expected to maintain marketing models, sales operations, large networks of product outlets or dealerships aimed at the general public.
2. Provide and Maintain
2.1. Companies undertaking comparable activities considered as ‘Provide and Maintain’ are expected to deliver services to ensure the availability of an asset either through repair and servicing to third party equipment, or through hire or lease arrangements that include associated upkeep and maintenance services.

18Baseline profit rate, capital servicing rates and funding adjustment methodology 2017/18
2.2. Comparable activities would typically be of the type which can be likened to those involved in the support and provision of equipment used for military or defence purposes. This could cover a broad range of products such as structural metal goods, machinery, electronic and mechanical subsystems, vessels, containers, general machinery, ships, aircraft, and wheeled or tracked vehicles or other means of transportation and other items of machinery of an industrial nature. Comparable companies may also provide the training necessary to operate these assets.
2.3. Repair and servicing activities include arrangements where spares and labour are charged for as they are required, or may include these costs as part of a longer term contracting arrangement. Diagnosis, repair and installation activities would be expected to require an in-depth knowledge of the asset being serviced. This would exclude companies whose capabilities are limited to rudimentary work, such as those involving user-serviceable parts or domestic installations (for example domestic white goods). Hire and leasing arrangements should be focused on items of an industrial or commercial nature.
2.4. The value added, cost base or profits of the business are expected to principally derive from the asset provision and maintenance activities described above. For example, the provision of aftersales service to products that a company manufactures or sells would be insufficient to consider a company to be comparable. Companies are unlikely to be comparable if they include a significant consumer-targeted sales and marketing model or the sale of associated finance products (for example in the case of consumer automotive sales). It may be acceptable for comparable firms to engage in some loosely comparable activities as part of normal business (for example parts procurement, warehousing, logistics and installation). However these activities are not expected to extend beyond what might reasonably be required to deliver the company’s principle business. Significant involvement in activities which are obviously non-comparable in nature (for example manufacturing or distribution) is grounds for rejection.
2.5. The end customers for the services provided by comparable companies are expected to be businesses, institutions or governments. Comparable companies are not expected to maintain significant marketing models or sales operations in relation to the goods they service, or large networks of service outlets or dealerships aimed at the general public.
3. Construction
3.1. Companies undertaking comparable activities considered as ‘Construction’ are expected to deliver services in relation to the construction of buildings or other structures at fixed locations. Companies could provide such services either on a contract basis with designs and specifications received or using their own designs. Comparable companies may be responsible for the management of the construction project, and are likely to bear contract risk, procurement risk, staff risk and some quality control risk in respect of these activities. They are not expected to bear any significant property price risk in respect of these activities.
3.2. Buildings would include industrial buildings such as factories, warehouses, plants, and public, commercial or residential buildings of steel-frame or concrete construction (not individual houses) and may include the associated design services. Civil engineering works in the form of the erection of structures in a fixed location, for example in metal and concrete, would also be considered comparable. To the extent that civil engineering works relates to the assembly of a structure at a fixed location (for example it is not tunnelling, highways maintenance or rivers and coastal work) then it is more likely to be considered as ‘Construction’. Speciality trade contractors, such as outfit contracting services (plumbing, ventilation, electrical installation and windows) must be demonstrably of an industrial nature and be active in the construction of the building.

19 Baseline profit rate, capital servicing rates and funding adjustment methodology 2017/18
3.3. The value added, cost base or profits of the business are expected to principally derive from the construction activities described above. Comparable companies are not expected to hold land for long-term appreciation purposes and as such those who engage primarily in real estate development or the construction of residential property would typically be excluded. It may be acceptable for comparable companies to engage in some loosely comparable activities in the delivery of their core construction work (for example manufacturing or procurement of construction inputs, earthworks, provision of construction labour, building preservation, site clearance and recycling of reclaimed items from demolition). However these activities should not be the focus of their business. Significant involvement in activities which are obviously non-comparable in nature (for example toll-road operation, property investment, interior design services) is grounds for rejection.
3.4. The end customers for the services provided by comparable companies are expected to be other businesses, institutions or governments. Comparable companies are not expected to primarily serve the general public and as such domestic building services, roofing, flooring and general building maintenance contractors would not be considered comparable.
4. Ancillary Services
4.1. Companies undertaking comparable activities considered as ‘Ancillary Services’ are expected to deliver either one of administrative, facilities or IT support activities. Companies undertaking these support services are not expected to bear any significant risks other than that of failing to provide the contracted outputs. This captures risk in relation to the delivery of the services, contract risk, procurement risk, staff risk and some quality control risk in respect of these activities.
4.2. Administrative support relates to outsourced business services such as payroll processing, call centres, HR, basic book-keeping and other clerical work. IT support services would include data management, data processing, network hosting, IT repairs and maintenance and IT security services. Facilities support services would include property cleaning, property repairs and maintenance, canteen services, laundry, gardening and general guarding and security services.
4.3. The value added, cost base or profits of the business are expected to principally derive from the Ancillary Services activities described above. Companies that engage in support services loosely connected to those described above, but which are of a specialised nature would not typically be considered comparable. Such non-comparable services would include provision of security services in prisons, the design and procurement of IT infrastructure, professional services such as accountancy or legal advice, or the supply of clinical staff to hospitals. Companies that do not undertake activities akin to ancillary support services (for example recruitment, construction, software development, management consultancy) are not considered comparable.
4.4. The end customer for the services provided by comparable companies are expected to be other businesses, institutions or governments. Comparable companies are not expected to be entities which solely exist to provide these services to members of their own corporate group. Comparable companies are not expected to primarily serve the general public with, for example, domestic gardening or cleaning services.
20Baseline profit rate, capital servicing rates and funding adjustment methodology 2017/18
Appendix B – Industry codes and text search terms used in activity type search strategies
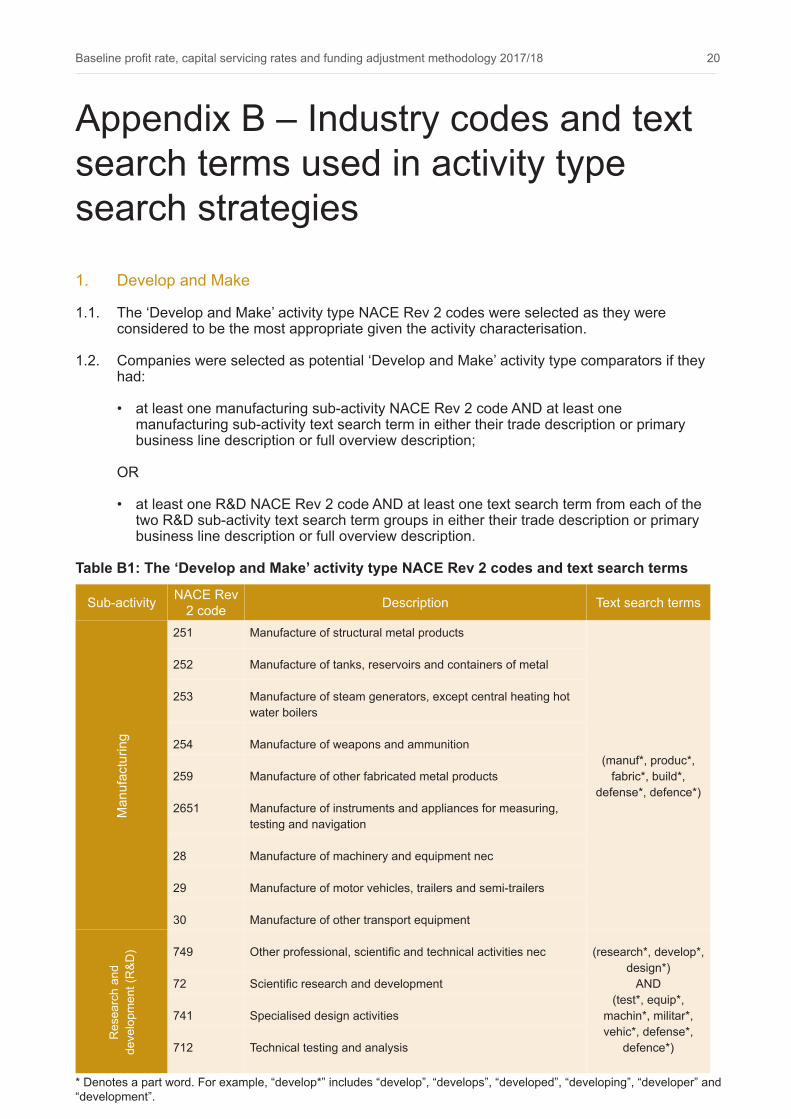
1. Develop and Make
1.1. The ‘Develop and Make’ activity type NACE Rev 2 codes were selected as they were considered to be the most appropriate given the activity characterisation.
1.2. Companies were selected as potential ‘Develop and Make’ activity type comparators if they had:
• at least one manufacturing sub-activity NACE Rev 2 code AND at least one manufacturing sub-activity text search term in either their trade description or primary business line description or full overview description;
OR
• at least one R&D NACE Rev 2 code AND at least one text search term from each of the two R&D sub-activity text search term groups in either their trade description or primary business line description or full overview description.
Table B1: The ‘Develop and Make’ activity type NACE Rev 2 codes and text search terms
Sub-activity NACE Rev 2 code Description Text search terms
Man
ufac
turin
g
251 Manufacture of structural metal products
(manuf*, produc*, fabric*, build*,
defense*, defence*)
252 Manufacture of tanks, reservoirs and containers of metal
253 Manufacture of steam generators, except central heating hot water boilers
254 Manufacture of weapons and ammunition
259 Manufacture of other fabricated metal products
2651 Manufacture of instruments and appliances for measuring, testing and navigation
28 Manufacture of machinery and equipment nec
29 Manufacture of motor vehicles, trailers and semi-trailers
30 Manufacture of other transport equipment
Res
earc
h an
d de
velo
pmen
t (R
&D) 749 Other professional, scientific and technical activities nec (research*, develop*,
design*)AND
(test*, equip*, machin*, militar*, vehic*, defense*,
defence*)
72 Scientific research and development
741 Specialised design activities
712 Technical testing and analysis
* Denotes a part word. For example, “develop*” includes “develop”, “develops”, “developed”, “developing”, “developer” and “development”.

21 Baseline profit rate, capital servicing rates and funding adjustment methodology 2017/18
1.3. The application of the above selection criteria resulted in 1,639 potential ‘Develop and Make’ activity type comparator companies being selected from the Orbis database.
2. Provide and Maintain
2.1. The ‘Provide and Maintain’ activity type NACE Rev 2 codes were selected as they were considered to be the most appropriate given the activity characterisation.
2.2. Companies were selected as potential ‘Provide and Maintain’ activity type comparators if they had:
• at least one capacity provisioning sub-activity NACE Rev 2 code;
OR
• at least one text search term from each of the two capacity provisioning sub-activity text search term groups in either their trade description or primary business line description or full overview description;
OR
• at least one upkeep and maintenance sub-activity NACE Rev 2 code;
OR
• at least one text search term from each of the two upkeep and maintenance sub-activity text search term groups in either their trade description or primary business line description or full overview description.
Table B2 - The ‘Provide and Maintain’ activity type NACE Rev 2 codes and text search terms
2.3. The application of the above selection criteria resulted in 3,061 potential ‘Provide and Maintain’ activity type comparator companies being selected from the Orbis database.
Sub-activity NACE Rev 2 code Description Text search terms
Cap
acity
pro
visi
onin
g 77
35
7735 Renting and leasing of air transport equipment (rent*, leas*, hir*, capacity*)
AND(container*, truck*,
tank*, trailer*, aircr*, aviation*, plane*,
industrial*, defence* , defense*)
7739 Renting and leasing of other machinery, equipment and tangible goods nec
7712 Renting and leasing of trucks
7734 Renting and leasing of water transport equipment
Upk
eep
and
mai
nten
ance
33 Repair and installation of machinery and equipment (repair*, maint*, upkeep*, update*,
train*)AND
(equip*, vehic*, aircr*, defense* ,
defence*)
452 Maintenance and repair of motor vehicles
712 Technical testing and analysis
749 Other professional, scientific and technical activities nec
22Baseline profit rate, capital servicing rates and funding adjustment methodology 2017/18
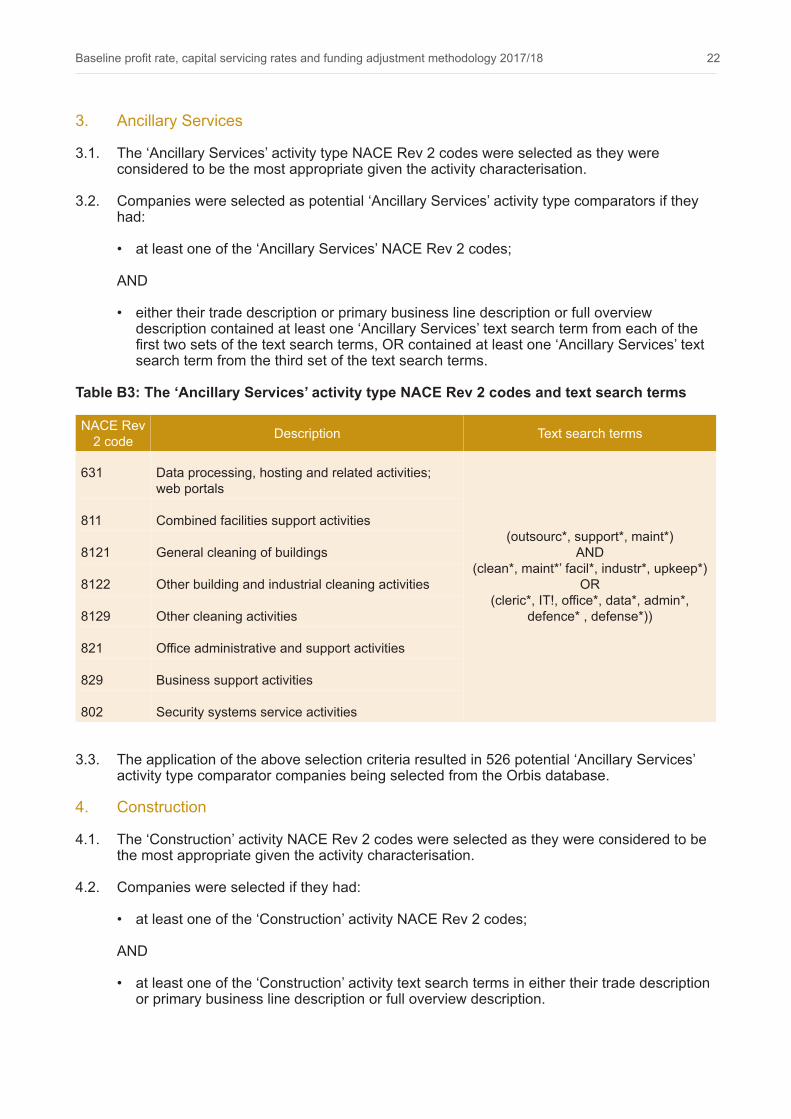
3. Ancillary Services
3.1. The ‘Ancillary Services’ activity type NACE Rev 2 codes were selected as they were considered to be the most appropriate given the activity characterisation.
3.2. Companies were selected as potential ‘Ancillary Services’ activity type comparators if they had:
• at least one of the ‘Ancillary Services’ NACE Rev 2 codes;
AND
• either their trade description or primary business line description or full overview description contained at least one ‘Ancillary Services’ text search term from each of the first two sets of the text search terms, OR contained at least one ‘Ancillary Services’ text search term from the third set of the text search terms.
Table B3: The ‘Ancillary Services’ activity type NACE Rev 2 codes and text search terms
3.3. The application of the above selection criteria resulted in 526 potential ‘Ancillary Services’ activity type comparator companies being selected from the Orbis database.
4. Construction
4.1. The ‘Construction’ activity NACE Rev 2 codes were selected as they were considered to be the most appropriate given the activity characterisation.
4.2. Companies were selected if they had:
• at least one of the ‘Construction’ activity NACE Rev 2 codes;
AND
• at least one of the ‘Construction’ activity text search terms in either their trade description or primary business line description or full overview description.
NACE Rev 2 code Description Text search terms
631 Data processing, hosting and related activities; web portals
(outsourc*, support*, maint*) AND
(clean*, maint*’ facil*, industr*, upkeep*) OR
(cleric*, IT!, office*, data*, admin*, defence* , defense*))
811 Combined facilities support activities
8121 General cleaning of buildings
8122 Other building and industrial cleaning activities
8129 Other cleaning activities
821 Office administrative and support activities
829 Business support activities
802 Security systems service activities

23 Baseline profit rate, capital servicing rates and funding adjustment methodology 2017/18
Table 5: The ‘Construction’ activity type NACE Rev 2 codes and text search terms
4.3. The application of the above selection criteria resulted in 1,338 potential ‘Construction’ activity type comparator companies being selected from the Orbis database.
NACE Rev 2 code Description Text search terms
2511 Manufacture of metal structures
(construct*, build*, engineer*, architect*, defense*, defence*)
2599 Manufacture of other fabricated metal products
2891 Manufacture of machinery for metallurgy
2892 Manufacture of machinery for mining, quarrying and construction
2899 Manufacturing of other special-purpose machinery
411 Development of building projects
4120 Construction of residential and non-residential buildings
4211 Construction of roads and motorways
4213 Construction of bridges and tunnels
4291 Construction of water projects
4299 Construction of other civil engineering projects
43 Specialised construction activity

24Baseline profit rate, capital servicing rates and funding adjustment methodology 2017/18
Appendix C – Orbis data fields and calculation steps for the underlying profit rates
1. Data fields
1.1. The following data was downloaded from Orbis to calculate the 2017/18 baseline profit rate:
• OPPL: Operating P/L [=EBIT] – 2015
• OPRE: Operating revenue (Turnover) – 2015
• TFAS: Tangible Fixed Assets – 2015 and 2014
• CUAS: Current Assets – 2015 and 2014
• CULI: Current Liabilities – 2015 and 2014
• CASH: Cash and Cash Equivalent – 2015 and 2014
• LOAN: Loans – 2015 and 2014

25 Baseline profit rate, capital servicing rates and funding adjustment methodology 2017/18
2. Calculation stepsStep
indicator Financial indicator Data source/calculation
A Operating revenue (turnover) Orbis data [Orbis code OPRE]
B Operating profit (EBIT) Orbis data [Orbis code OPPL]
C Cost of production A - B
D Profit level indicator (net cost plus) [percentage] B/C
E Fixed capital (2015 and 2014 average) Orbis data - ‘Tangible Fixed Assets’ [TFAS]
F Working capital (2015 and 2014 average) Orbis data –current assets [CUAS]- cash [CASH]- current liabilities [CULI] + short-term debt [LOAN]
G Capital employed (average) E + F
H Positive working capital F (when F is positive)
I Negative working capital F (when F is negative)
J Cost of production : capital employed ratio C/G
K Fixed capital ratio E/G
L Positive working capital ratio H/G
M Negative working capital ratio I/G
N Fixed capital servicing rate [percentage] Bloomberg data – 7 year average of C40515Y INDEX
OPositive working capital servicing rate [percentage]
Bloomberg data – 3 year daily rates’ average of BBB rated sterling denominated bonds (i.e. C4681Y
INDEX and BVCSE201 INDEX)
PNegative working capital servicing rate [percentage]
36 months average of Bank of England statistics on monthly interests for short term deposits [CFMB132
code]
Q Fixed capital servicing allowance K x N
R Positive working capital servicing allowance L x O
S Negative working capital servicing allowance M x P
T Capital servicing adjustment Q + R + S
U Capital servicing adjustment [percentage] T/J
V Capital servicing adjusted PLI [percentage] D-U
