single pilot ifr accident data analysis - nasa · single pilot ifr accident data analysis d. f....
TRANSCRIPT
NASA Contractor Report 36 5 0
Single Pilot IFR Accident Data Analysis
D. F. Harris and J. A. Morrisette
CONTRACT NAS 1 - 1692 0 NOVEMBER 1982
NASA CR 3650 C.1
https://ntrs.nasa.gov/search.jsp?R=19830005805 2018-08-13T05:44:12+00:00Z
TECH LIBRARY KAFB, NM
NASA Contractor Report 36 5 0
Single Pilot IFR Accident Data Analysis
D. F. Harris and J. A. Morrisette Spectrum Technology Incorporated Virginia Beach, Virginia
Prepared for Langley Research ‘Center under Contract NAS l- 1692 0
National Aeronautics and Space Administration
Scientific and Technical Information Branch
1982


TABLE OF CONTENTS
PAGE
INTRODUCTION 1
PREVIOUS TRENDS RE-EXAMINED 3
Phase of Flight Accidents in Terms of Mission Variables Accidents in Terms of Pilot Experience Summary on Trends
PILOT PROFILES 14
Actual Instrument Time 14 Simulated Instrument Time 15 Pilot Time Last 90 Days 15 Total Pilot Time 16 Summary 17
ACCIDENT TYPES AND RELATIONSHIP TO AIRCRAFT TYPE, NUMBER 18 OF PILOTS, AND TYPE OF TERRAIN
Type Aircraft Versus Accident Type 18 Single Versus Dual Piloted Accident Types 19 Type of Terrain Versus Accident Type 20
DAY VERSUS NIGHT GENERAL AVIATION OPERATIONS 21
Introduction 21 Day Versus Night Rates 21
CONTROLLED/UNCONTROLLED COLLISIONS 27
Introduction Uncontrolled Collisions Vertigo Caused Uncontrolled Collisions
1. Condition of Light 2. Total Instrument Time Versus Condition
of Light
43: Time in Type Versus Condition of Light Total Flight Time Versus Condition of Light
5. Total Night Time Versus Night Mishaps 6. Experience Profile
Vertigo Accident Discussion and Conclusions Icing Caused Uncontrolled Collisions Controlled Collisions
27 27 28 28 28
29 29
29 29
:i 33

SPIFR Night Controlled Collisions Pilot Experience Versus Night/Day Controlled
Collisions Visibility in Contrblled Collisions
CLOSING COMMENTS
SUMMARY
APPENDIX A Figures 1 through 5
APPENDIX B Figures 6 through 58
APPENDIX C References
35
38 40
42
44
A-l
B-l
C-l

ACKNOWLEDGEMENT
The authors of this report would like to acknowledge the enthusiastic and energetic support of Mr. Roland T. Frederick of the NASA Langley Research Center Business Data Systems Division. Mr. Frederick's consistent willingness to respond to short fuzed requests for reduction and extraction. of data from the NTSB accident data base was much appreciated and an inval- uable aid in the timely completion of this report.

INTRODUCTION
In 1978, aircraft accident data recorded and maintained by the National Transportation Safety Board (NTSB) were analyzed to determine what problems exist in the general aviation (GA) single pilot instrument flight rules (SPIFR) environment. The results of that analysis were based on the data from 1964 to 1975, and were used to help structure the NASA Langley Research Center SPIFR research program. Since the results of that analysis were published, GA SPIFR activity has continued to increase both in terms of numbers of flights and numbers of accidents, and the accident data from four additional years (1976-1979) have been added to the NTSB data base. The purpose of the research and analysis upon which this report is based was to determine what changes, if any, have occurred in trends and cause-effect rela- tionships reported in the earlier study. The increasing numbers have been tied to measures of activity to produce accident rates which in turn were analyzed in terms of change. Where anomalies or unusually high accident rates were encountered, further analy- sis was conducted to isolate pertinent patterns of cause factors and/or experience levels of involved pilots.
The first section of the report reviews and examines SPIFR accidents in many of the same terms and formats used in the original study. Data from the 1964-1975 period were compared with data from the 1976-1979 time frame to determine what changes are occurring in the SPIFR arena of operations. SPIFR accidents are addressed and analyzed in terms of phase of flight, mission variables, and pilot experience. In general, there are no major surprises in this section as accident trends have remained fairly consistent over the years.
The second section of this report addresses the profiles of GA pilots in terms of their experience levels. The results of a recent survey conducted by NASA through Ohio State University provide a basis for comparing the typical GA SPIFR pilot with a profile of the pilot represented in the NTSB accident statistics data base. The profiles established in this section are used in the later sections to provide comparisons with experience charac- teristics of pilots involved in specific classes of accidents.
The impact of a few specific variables is examined in the third section of the report in an attempt to relate types of ac- cidents to particular conditions. Type of aircraft, number of pilots, and type of terrain are tabulated by category of accident to see which impact upon what type of accidents.
The fourth section of the report explores day and night accident rates of the SPIFR pilot. Based upon a Federal Aviation Agency (FAA) survey of GA activity, actual day and night accident rates are calculated with some rather surprising results. Com-
1

parisons are presented between SPIFR and dual piloted IFR (DPIFR) accident rates for both day and night operations, and some of the specific characteristics of pilots involved in night accidents are addressed.
The final section presents the results of a comprehensive analysis of SPIFR collisions with the ground. Uncontrolled col- lisions are examined in depth and comparisons are presented be- tween SPIFR landing, DPIFR landing, and SPIFR take-off/enroute phase accident statistics. Specific sub-sets of vertigo and icing related accidents are analyzed and compared for commonali- ties and diversities as are controlled day and night collisions with the ground/water.
The majority of this report concerns the SPIFR pilot in the approach/landing phase. Specifically, the 554 accidents analyzed in the majority of the report are all landing phase accidents and represent only one subset of the 1396 pilot error SPIFR accidents in the data base. The reader is invited to explore the many com- binations of data in the myriad of charts and tables used in this effort and located following the text of this report. There are a number of nuances in those tables which provide food for thought, speculation, and detailed analysis which the authors of this report did not have the time nor the assets to address.

PREVIOUS TRENDS RE-EXAMINED
One of the objectives of this report is to update selected tables and graphs that were originally published in NASA TM-78773 (reference A). Those tables and graphs are presented in essen- tially the same format as they were in the original report. The data has been updated to include the years 1976-1979, and where appropriate, columns have been added which present the percentage of the table data that is from accidents in the latter time peri- od. The general methodology for interpreting indicated trends used throughout the analysis of the updated data is a straight forward check to see if the proportional increase in a particular subset of mishaps for 1976-1979 is distributed in the same manner as similar mishaps for the 1964-1975 data. In other words, did the number of accidents for each mission variable increase in the same proportion as the total increase in the total'number of ac- cidents. Given that 216 (39 percent) of the 554 total landing phase accidents occurred from 1976 to 1979, the number of acci- dents which are associated with each mission variable should re- flect a similar increase of approximately 39 percent.
A 95 percent confidence interval was calculated for the proportion of accidents that were categorized for each mission variable over the 1976-1979 time frame. Naturally, the larger the number of accidents for a particular variable, the smaller the acceptable range for the confidence interval and the better the test. The estimate of the 1976-1979 proportion (P) for each mission variable was calculated as:
P= _ a+ 1.96 a * (1-a) n
where a= number of accidents 1976-1979 -- ----- number of accidents 1964-1979
If the confidence interval (P) contains the proportional increase of total accidents from 1976 through 1979, then we are 95 percent sure that the increase in accidents for the mission variable is consistent with the proportion of those type of accidents that occurred over the earlier periods. Those variables that failed the confidence level test became the subject for further investi- gation and discussion. The summaries below provide a brief over- view of the updated tables.
Phase of Flight: From 1964 to 1979, NTSB accident data files reveal that 1396 pilot error accidents occurred for SPIFR operations covering all phases of flight and all flight plans. Figure 1 depicts the breakdown of these accidents by phase. The majority of accidents take place in the landing phase of flight. The largest proportion of fatal accidents as a proportion of
3
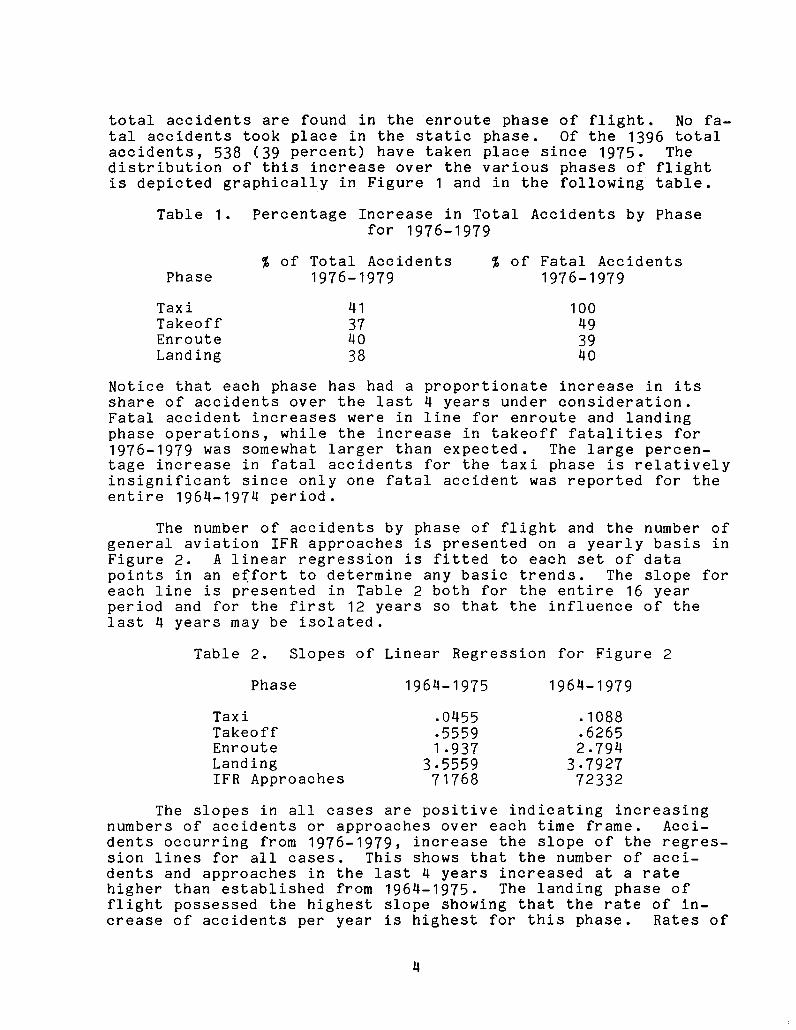
total accidents are found in the enroute phase of flight. No fa- tal accidents took place in the static phase. Of the 1396 total accidents, 538 (39 percent) have taken place since 1975. The distribution of this increase over the various phases of flight is depicted graphically in Figure 1 and in the following table.
Table 1. Percentage Increase in Total Accidents by Phase for 1976-1979
% of Total Accidents % of Fatal Accidents Phase 1976-1979 1976-1979
Taxi Takeoff Enroute Landing
100 49
40 38 zz
Notice that each phase has had a proportionate increase in its share of accidents over the last 4 years under consideration. Fatal accident increases were in line for enroute and landing phase operations, while the increase in takeoff fatalities for 1976-1979 was somewhat larger than expected. The large percen- tage increase in fatal accidents for the taxi phase is relatively insignificant since only one fatal accident was reported for the entire 1964-1974 period.
The number of accidents by phase of flight and the number of general aviation IFR approaches is presented on a yearly basis in Figure 2. A linear regression is fitted to each set of data points in an effort to determine any basic trends. The slope for each line is presented in Table 2 both for the entire 16 year period and for the first 12 years so that the influence of the last 4 years may be isolated.
Table 2. Slopes of Linear Regression for Figure 2
Phase 1964-1975 1964-1979
Taxi l 0455 Takeoff -5559 Enroute 1 l 937 2.794 Landing 3.5559 3.7927 IFR Approaches 71768 72332
The slopes in all cases are positive indicating increasing numbers of accidents or approaches over each time frame. Acci- dents occurring from 1976-1979, increase the slope of the regres- sion lines for all cases. This shows that the number of acci- dents and approaches in the last 4 years increased at a rate higher than established from 1964-1975. The landing phase of flight possessed the highest slope showing that the rate of in- crease of accidents per year is highest for this phase. Rates of
4

increase for the taxi and takeoff phase are very low. A test of the null hypothesis that the slopes of the taxi and takeoff phases are equal to zero against the alternative hypothesis that the slopes are not equal to zero for the 1964-1979 period was performed in an effort to determine with the given data that the regression lines have some rate of change other than zero. At a 95 percent confidence level, the null hypothesis could not be rejected. This indicates that with the data given, the low slopes of these two lines are not significantly different from zero. (i.e. There has been no change.)
Figure 3 is a yearly presentation of total single and dual pilot IFR accident rates, by phase of flight. The rate is ex- pressed as accidents per 100,000 general aviation IFR approaches. All linear regression lines fitted to the data have a downward slope indicating fewer accidents for any given number of approa- ches. In Figure 2, the number of total approaches 'and accidents for each phase of flight was shown basically to be increasing. Figure 3 indicates the rate of increase of approaches has ex- ceeded the increase in accidents for each year. This translates into a lower accident rate when approaches are used as an indica- tor of exposure level. Table 3 summarizes the slopes of the re- gression lines in Figure 3.
Table 3. Slopes of Linear Regression for Figure 3
Phase 1964-1975 1964-1979
Taxi -.054g -.0299 Takeoff -.0047 -.0027 Enroute -.4457 -.2698 Landing -.2404 -.I904
The absolute value of the slopes for 1964-1975 are greater than for 1964-1979 for all phases. This indicates that the in- fluence of the 1976-1979 period has been one of a hig;;;o;;zident rate than that established in the 1964-1975 period. phase accidents had the greatest rate of decrease. As in the case of Figure 2, the slopes for the taxi and takeoff phases are extremely low. Testing the null hypothesis that the slopes are equal to zero against the alternative that they are not equal to zero reuslted in the inability to reject the null hypothesis at a 95 percent confidence level. In other words, the taxi and take- off accident rates have not shown a positive or negative change over the 1964-1979 period, while the landing and enroute phase accident rates have decreased.
Figure 4 isolates accident data on the landing phase and breaks them down by year into groups of single and dual piloted operations and further delineates between pilot error and nonpi- lot error accidents. Table 4 presents the slopes of the linear regression for each set of data.
5

Table 4. Slope of Linear Regression for Total Landing Phase Accidents in Figure 4
Source 1964-1975 1964-1979
Single Pilot, Pilot Error Dual Pilot, Pilot Error Single Pilot, Non-Pilot Error Dual Pilot, Non-Pilot Error
:=z: 3.5662 -90588
-:0315 -.0632 -.04go .0456
Two aspects of this table should be noted. First, the non-pilot error accident slopes are essentially equal to zero. The hypothesis that the slopes are equal to zero could not be rejected at the 95 percent confidence level. This shows that total non-pilot error related accidents have remained at a rela- tively constant total number over the 16 year period. Secondly, the total number of single piloted, pilot error related accidents increased at a greater rate than the dual piloted. From an over- all standpoint, 90 percent of the single piloted accidents had pilot error as a listed cause/factor, while 83 percent of the dual piloted accidents had pilot error listed as a cause/factor. Of the total number of accidents, 25 percent were dual piloted.
Figure 5 presents an alternative view of Figure 4 by relating exposure levels to the total number of accidents. The general aviation IFR approaches are broken down into estimates of single operations and dual piloted operations for each of the 16 years as was done for the four previous figures. Total accident figures for each category are related to the appropriate approach figures for single or dual operations, to determine an accident rate per 100,000 approaches. The graph of these rates is presen- ted in Figure 5. Slopes for each line are presented in Table 5.
Table 5. Slopes of Linear Regressions for Figure 5
Type 1964-1975 1964-1979
Single Pilot, Pilot Error Dual Pilot, Pilot Error Single Pilot, Non-Pilot Error Dual Pilot, Non-Pilot Error
-0099 .0104 l 0457 -.0274
1017 -.0740 -:0942 -.0637
All lines involved have fairly small slopes. The hypothesis that the slopes were equal to zero could not be rejected for sin- gle and dual pilot, pilot error caused accidents. This implies that the two categories of accidents have had a constant accident rate over the past 16 years. The single and dual pilot, non-pi- lot error related accidents have a small negative slope and are statistically different from zero at a 95 percent confidence level. The impact of the 1976-1979 data is not consistent in how it affects the trends represented by the slopes of the first 12
6
years. It raised the single pilot, pilot error and dual pilot, non-pilot error slopes and lowered the other two trend lines.
Accidents in Terms of Mission Variables: Table 6 presents the distribution of SPIFR accidents in terms of obstruction to vision and mission variables at the crash site. As was evident in the previous report, fog continues to be the primary cause of poor visibility being present in 398 (72 percent) of the 554 acci- dents. Not surprisingly then, precipitation continued the previ- ous trend being present with the fog again in just over half the cases (54 percent) which was the same percentage of occurrences of precipitation in all accidents. When tested to determine whether or not each of the categories have grown proportionately to the overall population, two mission variable proportions for accidents in 1976-1979 fell outside of the acceptable confidence interval. The number of accidents occurring in hilly terrain along with those in areas dense with trees both experienced a relative decrease, failing outside the low end of the confidence interval.
Table 7 provides the tabulation of SPIFR accidents in terms of what impact the condition of light has on selected mission variables. The proportion of accidents occurring at night has remained virtually unchanged since the previous study dropping from 53.7 to 53.1 percent. The proportion of accidents occurring during the day, dawn, and dusk periods also remained virtually unchanged. Specific accident rates for day and night accidents with comparisons between SPIFR and DPIFR (dual piloted IFR) ope- rations is provided later in this report.
The breakdown of mission variables in Table 7 is the same as that in Table 6 with the exception of the obstruction to vision variables (fog and none) being added to the table. The results of tests for trends naturaily would be the same for those variables previously tested. The new obstructions to vision ca- tegory figures would not really require formal testing since at proportions of .40 and .39, we simply confirm our previous con- clusion that the impact of fog remains unchanged.
Table 8 provides the data for SPIFR accidents in terms of how the various mission variables impact upon the phase of lan- ding. Table 9 provides a breakdown of the proportional increases of the number of accidents in each phase of flight, and although some of the numbers reflect a 10 to 15 percent change, the chan- ges for all phases of flight were found to be statistically in- significant at a 95 percent confidence interval with the excep- tion of the accidents which occurred during initial approach and VFR go-around. The four accident briefs involved in the VFR go- around were reviewed, but there was no common denominator in those accidents which involved fuel starvation, an icing caused stall, and 2 delayed go-arounds. The initial approach phase trend change is addressed in the discussion on types of approa-
7

ches below. The increases in accidents by mission variable were again the same as discussed for Table 6. In fact, all of the observations discussed in the 1964-1975 NASA study remain valid. Final approach is still by far the most frequent phase during which accidents take place. The final approach and missed ap- proach phase accidents are still strongly related to low visibil- ity. Almost 30 percent of the final approach and 39 percent of the missed approach accidents had visibility of one-half mile or less at the accident site. Fog was present in 72 percent of the accidents.
Of particular interest is how the condition of light relates to the phase of landing accident. The ratio of night/day accidents for each phase of landing is presented in Table 9 for the years 1964-1975 and 1964-1979 to provide an indication of how the 1976-1979 accidents influenced the total. Comparing the ratios in these two rows shows that the differences are relative- ly large for the missed approach, roll, final VFR approach, and VFR go-around. For the missed approach, final VFR phase of lan- ding and VFR go-around, a shift toward more night occurrences has taken place since the ratios increased. In the case of the roll phase, a shift toward more accidents taking place during the day has occurred since the ratio is smaller.
The magnitudes of the ratios in Table 9 provide a measure of the relative difficulties that pilots face in the various phases of flight in conditions of darkness. The accidents on final approach occur three times more often at night than in day light and obviously provide an area for further analysis. The vast majority o.f these are classified as controlled or uncon- trolled collisions with the ground and are analyzed in-depth la- ter in this report. Interestingly, most of the remaining ratios fall under 1.0 which reflect more day time accidents than night. Although the latter is true in absolute terms, the relative oc- currence of night accidents actually ranged from 8 to more than 20 times higher than day accidents over the 16 years considered based upon actual day to night IFR activity. Thus, one would have to adjust each of the ratios by the appropriate magnitude to determine the true picture of the relative difficulties by phase of operation. For our purposes in this section, the ratios re- main unadjusted, still providing us with a good relative picture.
Table 10 provides the tabulation of the SPIFR accidents in terms of the type of approach flown as it relates to selected mission variables. The only mission variable not previously dis- cussed which failed to relfect a proportional increase in acci- dents was the initial phase of an approach. It reflected a sta- tistically significant lower proportion of accidents for the la- ter time period than for the 1964-1975 period. The specific rea- son for the relative decrease can be related to a combination of changes in other areas that may not be statistically significant by themselves, but combine to reflect a favorable rate change in
8
the initial phase. First, referring back to Table 8, we find the number of initial phase accidents in mountainous terrain was lower than expected, reflecting a mountainous to level ratio of 1 to 1 (12 accidents in mountainous terrain and 12 in level ter- rain) where that ratio was 5 to 4 based on the earlier data. Secondly, there was a 4 percent increase in the number of acci- dents during precision approaches over non-precision approaches flown which most likely reflects a continuing shift away from non-precision in favor of precision approaches. The demands on the pilot in the initial approach phase are significantly reduced in the precision approaches. Since the actual number of each type of approach flown could not be found for either time period, speculation of the trend of increased precision approaches is based upon the comparison of the proportion of accidents that occurred by approach type. Of interest in that arena were the following specific changes:
1.
2.
3.
A 4 percent decrease in accidents during VOR-only approaches which was offset by a 3 percent increase in VOR with DME.
A 4 percent decrease in localizer-only approach accidents matched by a 4 percent increase in ILS (without advisory) approach accidents.
A 1 percent decrease in ASR-only accidents which was matched by a 1 percent increase in ILS (with advisory) approach accidents.
Accidents in Terms of Pilot Experience: A pilot's experience may be measured in a number of categories which represent profi- ciency levels. Consequently, when expressing accident rates in terms of pilot experience, there are a number of relationships and methodologies that can be used. Tables ll,l2,l3, and 14 ad- dress SPIFR accidents in terms of total pilot hours, actual in- strument time, time in the last 90 days, and time in type of air- craft. Although the tables are presented to provide indications of changes in experience to accident relationships published in the earlier SPIFR accident study (reference A), the authors have chosen a slightly different measure of accident rates than the Reference A which used accidents per 100,000 pilots for each experience level.
Accidents of the type addressed in this study must, by the constraints established, have pilot error as a cause/factor. If one is trying to relate pilot experience to accidents, there is a certain amount of merit in using the direct relationship of accidents to the number of pilots at any given experience level. However, let us consider the following scenario:
9

Out of a group of 5 pilots, each with 100 hours of flight time, one pilot has an accident. Over the same period, 1 of a group of 3 pilots each with 5000 hours has an accident. Measured in terms of accidents per pilot, the 100 hour group has an accident rate of .2 while the more experienced group has an accident rate of .33. However, if we consider that the total exposure of the lesser experienced pilots is 500 hours as opposed to the other group's 15,000 hours, we might want to re- assess our measure. We could say that in terms of accidents per hours of exposure or experience, the lesser experienced group has an accident rate of 2.0 accidents per 1000 flight hours while the more experienced group has a rate of .07 accidents per 1000 flight hours.
Which of the above accident rates provide the llbestfl measure of the impact of pilot proficiency on accident rates? There are a number of other factors which undoubtedly should be considered. Particularly germane is whether or not the accident that the ex- perienced pilot has is his first? That is, if he also had an accident in his first 100 hours, our measure of accidents per hour of exposure loses some accuracy. In short, the authors have concluded that there is no ideal measure of accident rate that can be computed with the data that is currently available on the GA pilot. Tables 11, 12, and 13 present accident rates in terms of hours of exposure. The main factor in deciding to use this measure was that there are very few differences in the actual proportions of,accidents that occur at different experience levels. Thus, rather than duplicating the results of the previ- ous report, we have chosen to present the data in a new light which in essence reflects a decreasing rate with experience. We do not proclaim this measure to be the most accurate but we do find it more intuitively appealing than measuring rates in terms of accidents per group. In other words, there is little doubt in the author's mind which aircraft he would board as a passenger in night IFR conditions if one were piloted by a pilot with 3000 hours and the other by a neophyte. However, for analysis purposes, it is important to keep in mind that when using total hours as the basis for rate determination, hours of exposure include all pilots as opposed to only SPIFR pilots.
In order to arrive at a number of accidents per 10,000 flight hours, estimates for the total number of GA pilots were obtained from the FAA Statistical Handbook of Aviation 1980 (reference B). The proportion of pilots that currently exist at each experience level was extracted from the data contained in the Study to Determine the IFR Operational Profile of the Gene- ral Aviation Single Pilot (reference C). The total hoursof exposure for each bin is the product of the number of pilots and the mean of the experience level covered. The number of hours
10
used for the mean of the highest experience levels which are open ended (e.g. >300 or >15,000, etc.), were the means of the re- sponses of the NASA GA pilot survey (reference C) which were in the specified range.
The important point in the interpretation of the rates presented is that we are interested in trends and indications of trouble spots. Thus, the relationship of the rates is the criti- cal part of the tables, and that should not be greatly affected by the implicit assumptions that we have made but know to be inaccurate. The assumptions do not reflect actual conditions in that the distribution of pilots and experience levels was not constant over the entire 16 year period, and that all GA pilots do not necessarily fly single pilot IFR. Additionally, as men- tioned on the previous page, total pilot time is not necessarily proportional to instrument time. Thus the reader is asked to use the accident rates more for their relative than actual values.
Table 11 presents data on the SPIFR pilot factor landing phase accident rates in terms of the pilot's total time. Running 95 percent confidence level tests on the proportion of accidents in each bin that occurred during the 1976-1979 time frame resul- ted in acceptable ranges. That is, each included the overall proportional increase of 39 percent. Thus, it cannot be shown that there has been any change in the proportion of accidents experienced by any one group.
If one compares the trends displayed by the accident rates in the bottom row of Table 11 with Table XI in the earlier re- port 9 they will find that the tables present different pictures of the impact of experience levels on accident rates. (See above discussion on rates in this sub-section.) In terms of accidents per 10,000 hours, the accident rate continually declines as ex- perience is gained in total flight time. Over the first 1000 hours, the rate tends to decrease geometrically, then from 1000 to 5000 hours there is a linear decrease of .004 per thousand hours of experience. From 5000 hours on, the rate appears to decrease linearly at approximately .OOl per 5000 hours. One can only speculate that as in any field, experience will never com- pletely eliminate human error (i.e. Murphy's Law is applicable to aviation just as it is to any other endeavor).
As noted on Table 11, the number of pilots in the GA population was adjusted for the number of pilots in the Ohio State survey who did not respond to the query on total flight hours. Similarly, adjustments were made and so noted on the ta- bles discussed below.
Table 12 presents the data on the SPIFR accidents in terms of the pilot's total actual instrument hours. As was true with the.amount of total flight experience a pilot has, it appears that the accident rate is extremely high for the neophyte instru-
11
ment pilot (with less than 30 hours actual experience). Then, except for an aberration in the 30 to 59 hour bin, the accident rate per 10,000 hours decreases as a pilot becomes more experi- enced and consequently more proficient at instrument flight.
The overall proportion of SPIFR accidents which occurred in the 1976-1979 time period and reported the pilots actual instru- ment time was .37. The 95 percent confidence intervals computed for each bin for the estimated proportion of accidents occurring in that time frame all inciuded .37. Thus, we are once again forced to conclude that there were no trend changes tied to pilot instrument proficiency.
Table 13 presents the data on SPIFR accidents in terms of the pilot's time in the last 90 days. Since there was no source available to directly provide the number of pilots for each bin in terms of the last 90 days' flight hours, the numbers were de- rived from the tables in the Ohio State survey that provided total time for the past 12 months. Those hours were assumed to be distributed normally so were divided by four. Once again, although total hours are not necessarily proportional to instru- ment hours, if the absolute accuracy is affected, the trend information should still be valid.
In terms of accidents per 10,000 hours, the same trend of the rate decreasing with additional experience is again evident. However, as one might expect, there is a slight reversal of the decreasing rate when a pilot has flown over 300 hours in the past 90 days. Amassing flight time at that rate would equate to fly- ing 100 hours per month or at least 3.3 hours per day, 7 days a week. Such a sustained level of operations would be extremely taxing regardless of how the hours were actually distributed. Sooner or later fatigue is bound to have some impact upon the pilot's judgment and/or decision making process. The role fa- tigue plays in aviation has long been respected by the airlines as is evidenced by the rules and regulations in effect concerning maximum amounts of time crew members may log over given time intervals.
The 95 percent confidence interval tests for the propor- tional changes in accidents from Reference A failed to identify any changes for the accidents that reported time in the last 90 days, nor were any new trends identified for accidents in terms of time in type. The data for the latter is presented in Table 14. No attempt was made to identify or associate an acci- dent rate with time in type since there is no known source for finding how much time the average pilot has in any specific air- craft type. One would expect the number of accidents to decrease to some extent with experience. Thus, the behavior described in the previous NASA report continues to be true as is the apparent requirement suggested by that report that pilots adjust their
12

weather minimums to offset lack of total and/or recent experience in type. Justification of the need for this adjustment is rein- forced later in the report when time in type is related to uncon- trolled collisions.
Summary on Trends. The overall conclusion of the authors after compiling and analyzing the data to update the charts from the Reference A, is that SPIFR accident frequency, totals, causes, and trends have undergone little overall change since the previ- ous study. Thus, the conclusions, conjecture, and recommenda- tions of the original work remain as valid today as they did when written. With this in mind, conjecture on small nuances has been held to a minimum so that maximum effort could be devoted to more detailed analysis of factors associated with controlled and uncontrolled collisions with the ground/water.
13
PILOT PROFILES
In an effort to determine if those pilots involved in SPIFR accidents differ from the entire general aviation population, a comparison of pilot instrument and total times between the two groups was performed. Characteristics of the typical general aviation pilot were obtained from reference C, "Study to Deter- mine the IFR Operational Profile of the General Aviation Single Pilot". Data available from that survey and the SPIFR accidents enabled a comparison to be made of four areas which relate pilot experience and capabilities. The areas compared are total simu- lated instrument time, total actual instrument time, pilot time in the last 90 days, and total pilot time. For each of these areas, statistics are presented which compare the distribution of pilot experience in each category for the two populations.
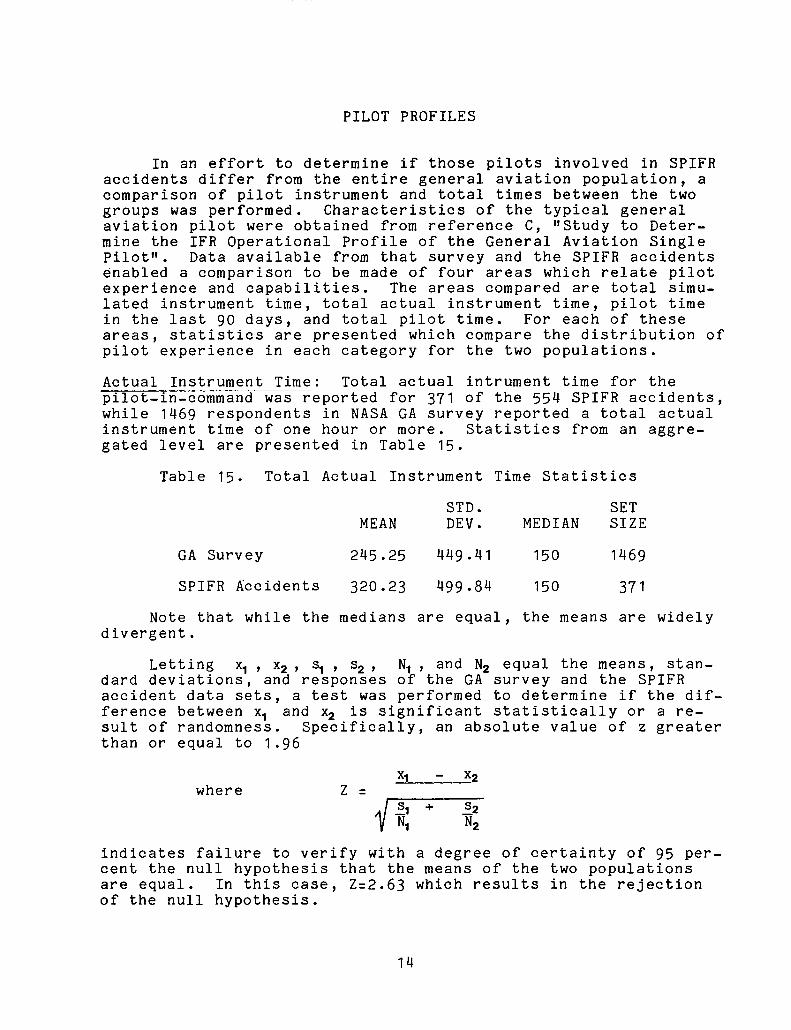
Actual Instrument Time: Total actual intrument time for the pilot-in-command was reported for 371 of the 554 SPIFR accidents, while 1469 respondents in NASA GA survey reported a total actual instrument time of one hour or more. Statistics from an aggre- gated level are presented in Table 15.
Table 15. Total Actual Instrument Time Statistics
STD. SET MEAN DEV. MEDIAN SIZE
GA Survey 245.25 449.41 150 1469
SPIFR Accidents 320.23 499 -84 150 371
Note that while the medians are equal, the means are widely divergent.
Letting 3 ’ X2 ’ Sl 9 S2 9 N, , and N, equal the means, stan- dard deviations, and responses of the GA survey and the SPIFR accident data sets, a test was performed to determine if the dif- ference between x, and x2 is significant statistically or a re- sult of randomness. Specifically, an absolute value of z greater than or equal to 1.96
where
indicates failure to verify with a degree of certainty of 95 per- cent the null hypothesis that the means of the two populations are equal. In this case, 2~2.63 which results in the rejection of the null hypothesis.
14

The unequal distribution of times between the groups is more clearly depicted in Table 16. The percentage of pilots with actual instrument times less than 60 hours is consistently lower for the SPIFR accident data set. For more than 60 hours of time, the percentage of pilots for the SPIFR accident data set is equal to or greater than the general aviation population set. This results in the SPIFR accident group on average having a larger percentage of total actual instrument time.
Simulated Instrument Time: Simulated instrument time was re- ported for 294 or 53 percent of the SPIFR accident data set, while 1439 responses of greater than zero were reported in GA survey. The aggregated statistics are presented in Table 17 be- low.
Table 17. Total Simulated Instrument Time
STD. SET MEAN DEV. MEDIAN SIZE
GA Survey 166.04 280.28 75 1439
SPIFR Accidents 95.66 164.80 61 294
In this case, both the mean and median of the SPIFR accidents are lower. than the same estimates of the general avia- tion population characteristics. Again let x, , x2 , s, , s2 , N, , and N2represent the means, standard deviations, and sample sizes for the NASA GA survey and the SPIFR accident data sets. Testing the null hypothesis that the two sample sizes are equal against the alternative that they are not, the value of Z as. previously defined is equal to 5.80. this exceeds the critical value of 1.96 and the null hypothesis must be rejected at a confidence level of 95 percent.
Table 18 presents the actual distribution of respondents. Note that for less than 100 hours, the percentage of respondents for the SPIFR accident data set is consistently larger than the corresponding set for the GA survey. For more than 100 hours the reverse is true. Consequently, this results in the typical SPIFR accident characteristically having a smaller amount of total sim- ulated instrument time associated with the pilot than for the general aviation population.
Pilot Time Last 90 Days: Pilot time over the last 90 days was reported for 447 or 81 percent of the SPIFR accidents. Pilot time for the general aviation population was estimated by taking one-fourth of the pilot total time in the last twelve months from the GA survey. The basic attributes of the two sets of data are delineated in Table lg.
15

Table 19. Pilot Time Last 90 Days
STD. SET MEAN DEV. MEDIAN SIZE
GA Survey 97.92 119.2 56.7 1551
SPIFR Accidents 98.47 85.9 71 447
The mean and median of the SPIFR accidents are greater than those of the GA Survey, although the relative magnitudes are not as great as those found in the previous two comparisons. Testing the null hypothesis that the difference between the two means is equal to zero against the alternative that their difference is not equal to zero, the Z value (as previously defined) is equal to . 108558 which is less than the critical value of 1.96. This indicates that the difference between the two means is not sta- tistically significant.
Table 20 presents a breakdown of the responses. At less than sixty hours, the SPIFR accident set percentage of responses was less than or equal to the GA Survey responses. At more than sixty hours the opposite is true. This indicates that the pilot involved in the SPIFR accident had more time in the last 90 days relative to those indicated by the GA Survey. The problem is that the percentage differences between the two groups within each time range is not large, and this lowers the level of confi- dence which may be made concerning significant deviations or trends between the distribution of respondents.
Total Pilot Time: The final category examined concerned the total time of the pilot for each of the two groups. For the SPI FR accident group, 549 or 99 percent of the accidents had a total time reported for the pilot. The GA Survey had 1578 respondents of total time greater than zero. Table 21 shows the aggregate statistics for the two groups under consideration.
Table 21. Total Pilot Time
STD. SET MEAN DEV. MEDIAN SIZE
GA Survey 3814.35 4961.08 2050 1578
SPIFR Accidents 3867.74 4456.86 2394 549
While the SPIFR accident mean and median are larger than the general aviation estimate, the degree of difference is not large. Testing the null hypothesis that the difference between the two means is equal to zero could not be rejected. An abso- lute value of Z greater than 1.96 was needed to reject the null
16

hypothesis, and when Z was computed as previously defined, its value was .00103. Table 22 further emphasizes the similarity between the two groups. Note that the percentage of respondents for the two groups in each of the time bins showed no consistent trend between the bins. As a result, it is difficult to argue that the total time response distribution differs significantly between the two groups.
Summary: Based upon the results of this section, the indica- tions are that the SPIFR pilot involved in one more more acci- dents (i.e. from the NTSB data) has comparable amounts of total flight hours and is as current in flight time over the previous 90 days as is the typical GA pilot. However, there appears to be statistically significant differences in the amount of instrument experience each of the two groups have. One logically would expect the differences between the groups to both be off in the same direction for simulated and actual instrument hours, but such is not the case. The actual instrument experience of the typical NTSB SPIFR pilot is greater than that of the general population GA pilot while the latter's simulated instrument ex- perience is higher than the NTSB representative.
The authors are unable to explain the apparent dichotomy in the two categories of instrument hours. However, the subject is addressed in more detail later in this report in the discus- sion of pilot experience in day and night controlled collisions.
17

ACCIDENT TYPES AND RELATIONSHIP TO AIRCRAFT TYPE, NUMBER OF PILOTS, AND TYPE OF TERRAIN
Type Aircraft Versus Accident Type: In an effort to determine if any one particular type of aircraft was particularly suscep- tible to a category of accident in SPIFR operations, Table 23 was compiled. Each accident type and its respective number of occur- rences is broken down by aircraft type. Four aircraft types were used and are presented with their respective percentages of total accidents below:
Table 24. Aircraft Type and Percentage of Total SPIFR Accidents
Aircraft Type % of Total Accidents
Single engine fixed gear 16 Single engine retractable gear 22 Multi-engine piston 57 Turbo-prop 5
Reference A presented a discussion on the fact that from 1964 to 1975, there were a disproportionately large number of twin engine aircraft SPIFR accidents relative to the percentage of twins involved in SPIFR operations. The conclusion in that report was that approximately 58 percent of SPIFR accidents oc- curred in twins although that class of aircraft was only involved in 45 percent of the SPIFR operations. If we logically include turbo-prop in the twin engine class and use the entire 16 years of NTSB data, we see that 62 percent of pilot caused SPIFR acci- dents have occurred in twins. However, not only has the percen- tage gone up 4 points, but according to the recent NASA GA sur- vey, currently only 29.5 percent of the GA pilots fly in twin engine aircraft as an IFR single pilot. According to the FAA Statistical Handbook on Aviation for Calendar Year 1980 (refer- ence B), there were 30.3 million single engine GA hours flown in 1979 as opposed to 8.6 million twin engine hours. Although those figures cover all GA operations, the proportion of twin time is 0.22 which certainly lends credence to the results of the NASA GA survey. Some of the problems of single versus twin engine acci- dent rates and relevant factors are addressed in-depth in the discussion of collisions with the ground/water later in this re- port.
Using the data in Table 23, tests were performed to deter- mine for each accident type whether or not the differences in the proportions of aircraft types involved in each category of acci- dent are significant or whether they can be attributed to chance. A chi-square test of the null hypothesis that the proportions of aircraft types involved in a particular type of accident are statistically equal was performed. Four accident types failed
18

the test at a significance level of 95 percent, indicating that the proportion of accidents by aircraft types are not statisti- cally equal. The four categories that failed are gear col- lapsed, nose over/down, uncontrolled collisions and overshoot. The percentage of occurrence for each aircraft type of these ac- cidents is presented below.
Table 25. Percentage of Total Accidents for Aircraft and Accident Types Failing
Chi-Square Test
GEAR NOSE UNCONTROLLED OVER- COLLAPSED OVER/DOWN COLLISION SHOOT
% of Single Engine Fixed Gear 1.15 3.45 11.49 10.34
% of Single Engine Retractable Gear 0 0 10.57 .81
% of Multi-Engine Piston 1.25 0 5.35 6.60
% of Turbo-Prop 7.70 0 0 0
For the gear collapsed accident type, the number of turbo-prop accidents is disproportionately high. Single engine fixed gear aircraft in the nose over/down type of accident have a larger proportion than expected. For the overshoot type of accident, single engine retractable gear and turbo-props have low proportions and single engine fixed gear and multi-engine piston have higher proportions. Finally, for uncontrolled collisions, single engine aircraft are more susceptible than multi-engine aircraft. Speculation on the reason for the anomalies in this data would all center around the proficiency of the pilots in- volved with the exception of the landing gear failures and nose- avers/downs. The section of this report on Collisions with the Ground/Water addresses proficiency. The landing gear failures in turbo-props reflects only two occurrences and the nose-overs are possibly related to single engine aircraft by the sheer number that have conventional as opposed to tricycle landing gear.
Single versus Dual Piloted Accident Types: In an effort to determine whether or not the number of pilots in an aircraft in- fluences the type of accident, Table 26 was compiled. A chi- square test was performed to see if the differences between the two proportions for each accident type is statistically signifi- cant at a 95 percent confidence level or is due to chance. The right hand columns of Table 26 present the differences in the percentages between the two types of configurations. At the 95 percent confidence level, the chi-squared tests revealed that none of the proportions are statistically significant. Thus, we
19

are forced to assume that aircraft accident categories are inde- pendent of whether the aircraft involved is single or dual pilo- ted. This was further verified in the investigation of uncon- trolled collisions with the ground and is addressed later in this report-.
Type of Terrain Versus Accident Type: Of the 554 SPIFR acci- dents considered, 313 (or 56 percent) reported the type of ter- rain in which the accident occurred. As can be seen from Table 27 below, only 27 (or 9 percent) of the 313 accidents occurred in mountainous terrain.
Table 27.
Mountainous
Non-Mountainous
Unfortunately, a determination to
Total Mountainous and Non-Mountainous Accidents VS Accident Types
Engine Controlled Uncontrolled Failure/ Collision Collision Malfunction Other
24 1 1 1
164 36 39 47
source could not be located which would allow a be made on the amount of IFR activity that oc-
curs in mountainous terrain. That fact coupled with the magni- tude of the figures in row one of Table 27 made it impossible to conduct any statistical analysis of the relationship of terrain to accident types. As shown by the data in Table 27, the num- ber of controlled collisions in proportion to the total number of accidents in mountainous terrain is obviously significant. (i.e. In mountainous terrain, 89 percent of the SPIFR pilot error acci- dents were controlled collisions as opposed to 57 percent for that proportion in nonmountainous terrain.)
20
DAY VS NIGHT GENERAL AVIATION OPERATIONS
Introduction. A pilot who has sat at the controls of an air- craft while cruising over sparsely populated countryside on a moonless night knows that it is not the same as being in the same situation on a bright sunny day. The feeling can be compounded by real or sometimes imagined "night noises" from the power plant or by the briefest flicker of a warning light on the instrument console. However, many of the differences in a pilot's psycholo- gical outlook between day and night VFR are easily explainable in terms of security. The potential of a controlled ditching in the daytime does not have quite the trauma of a night ditching, nor does a well defined day horizon pose the additional workload that a pilot encounters on a hazy moonless night. There are other differences between day and night VFR, and most are just as easi- ly explained as the foregoing. However, when one addresses the differences between day and night IFR operations, they are not as easily explainable. When a pilot is in actual instrument condi- tions in clouds whose bases are two or three hundred feet above the ground, his visual cues as well as options in emergency con- ditions are theoretically not a great deal different whether it is day or night. There is no horizon and he is at the mercy of fate in an emergency ditching regardless of whether it is day- light or dark. Psychologically, there are differences between day and night IFR, but based strictly on the simplistic physical aspects, one logically would expect comparable day and night ac- cident statistics in the low ceiling/visibility environment.
The initial comparison between day and night accidents revealed a rather startling disparity between their absolute ac- cident rates. Analysis efforts were directed towards determining what factors are predominant in specific types of night accidents and/or which factors produce such relatively high night accident rates. The discussion that follows is divided into three major sections. The first addresses how objective rates were calcula- ted, and compares them between day, night, single, and dual pi- loted operations. The next two sections present the results of the data reduction and analysis concerning controlled and uncon- trolled collisions with the ground.
Day Versus Night Rates: A previous section discussed the fact ---___ that the absolute number of night SPIFR accidents involving pilot error has increased over the past four years at essentially the same rate as that of day and total accidents. The significance of the numbers involved does not become very meaningful however, until they are converted to rates in the context of overall day and night activity. Unfortunately, there are not a large number of sources available which describe how many successful IFR flights or hours are flown in the day and/or night. Although the FAA maintains data on gross numbers of instrument approaches flown, the time of day and condition of light are not recorded.
21

However, during a literature review at the FAA's Technical Libra- ry in Washington, D.C., a report was found which provides a breakdown of hourly general aviation activity. This report, "General Aviation Pilot and Aircraft Activity Survey" (GAPAAS) by Susan J. Pinciaro (reference D) was produced by the FAA Office of Management Systems Information and Statistics Division. GAPAAS presents the results of a survey which was conducted by the FAA with the assistance of the Civil Air Patrol (CAP) for the purpose of acquiring current 1978 data on a wide range of general aviation characteristics. The survey was conducted at a statis- tically designed sample of 220 airports which are open to the public, and which represent a cross-section of airports with re- spect to FAA region and airport type. Although GAPAAS addressed many other general aviation topics, the results of the traffic activity efforts were specifically extracted and used by the au- thors of this report as a basis for estimating general aviation IFR activity in terms of approaches flown. The following para- graph provides a brief summary of the method used to convert the activity data from the FAA work to data germane to this project.
The GAPAAS activity tables are divided into three categories based on airport type. These are towered airports, non-towered airports with paved lighted runways, and unlighted and private airports. The GAPAAS estimates for the percentage of overall general aviation activity at the three airport types are:
TOWERED NON-TOWERED OTHER 29.61% 50.81% 19.58%
Although there may be a small amount of activity at non-lighted airports during darkness using flare pots and/or aircraft landing lights, the,authors assumed that nighttime activity only occurs at airports of the first two categories.
GAPAAS provides hourly estimates of activity during the time frame 0600-2059 for all public airports. The activity during the hours of 2100 to 0559 was given as 7 percent of the total activ- ity during the period 0600-2059 for towered airports and 3 per- cent for airports in the non-towered paved lighted runway catego- ry. A determination of the hours constituting day and night operations was based upon the average sunset time over a calendar year (taking into account daylight savings time) as being 1850 which was rounded to 1900 hours. Daylight operations were then defined as those occurring between the hours of 0600 and 1859, and nighttime operations, those that occur between the hours of 1900 and 0559.
GAPAAS provides hourly estimates for the typical weekday and weekend. These were combined by a weighted average reflec- ting five weekdays and two weekend days in the week. From this, a breakdown by percentage of day versus night activity was ob- tained for each airport type and is presented in the following
22

table.
Table 28. Percentage of Total General Aviation Activity
Towered Non-Towered Day Night Day Night
Other
24.39 5.22 43.53 7.28 19.58
These total estimates include air taxi and commuter air carrier. The following table breaks out flying in three broad categories in terms of purpose.
Table 29. Percentage of General Aviation, Air Taxi, and Commuter Air Carrier Activity from GAPAAS
Towered Non-Towered Other
General Aviation Day 22.98 41.01 19.58 General Aviation Night 4.917 6.86 Air Taxi Day 1.0 1.784 Air Taxi Night .214 .214 Commuter Air Carrier Day ,415 l 74 Commuter Air Carrier Night .089 . 124
Since the percentage of day versus night activity was desired for general aviation and air taxi only, the commuter air carrier ac- tivity was disregarded and the resulting overall levels of acti- vity are as follows.
Table 30. General Aviation and Air Taxi Activity Percentage by Day and Night
Day Night
General Aviation 87.6 12.4 Air Taxi 84.4 15.6
These figures were applied to total instrument approaches flown (reference B) to estimate day versus night figures for the two categories. Prior to 1972, air taxi figures were included in those for general aviation. Where applicable, general aviation data over the 1964-1971 time frame were adjusted to remove the air taxi influence. This was done by assuming that air taxi operations constituted the same percentage of general aviation operations over the 1964-1971 period as in the known 1972-1979 period. Thus, the end result used as the estimator for day ver- sus night activity for this report is the assumption that 87.6 percent of general aviation approaches are flown during the day.
23

Based upon an activity ratio of 87.6 to 12.4, tables were compiled to provide direct comparisons between day and night ac- cident rates in terms of thousands of IFR approaches flown. Na- turally, there is room for debate upon the absolute accuracy of the day/night estimator. Sampling methods used in the GAPAAS survey, assumptions that IFR operations remain proportional to combined VFR and IFR operations, and the propensity to fly in night IFR conditions alluded to in the NASA GA survey are but a few of the factors that may bias the estimator one way or the other. However, the important point is that the accident rates were analyzed on an annual basis, so that even if bias exists, it should remain constant so that trends are realistically re- flected.
In order to compare single piloted to dual piloted rates, another estimator was required. In this case, the results of the NASA GA survey were used. Respondents who did most of their fly- ing with two qualified pilots on board were considered to be dual piloted and the remainder considered to be single piloted. The percentages in each category were 72% single piloted and 28% dual piloted.
Accident rates were calculated for IFR landing phase accidents involving pilot error in terms of the number of instru- ment approaches flown each year as reported in the "FAA Statisti- cal Handbook of Aviation" series. The rates are broken down into single and dual piloted operations by day and night using the ratios described in the preceding paragraphs. The basic data and accident rates are presented in Tables 31 and 32 for single and dual piloted aircraft, respectively. The magnitude of night lan- ding accident rates when compared to daytime rates accentuates the severity of the problems involved with night IFR operations. Table 33 presents a matrix of ratios between the various types of accident rates. As can be seen by the average ratios, the dis- proportionate number of night accidents is not -peculiar to single piloted aircraft as both dual and single piloted aircraft have experienced slightly over 10 times as many accidents at night in terms of approaches flown as have occurred during the day over the 16 years studied. There have been relatively more SPIFR ac- cidents overall as can be seen again by the average ratios in Table 33. (i.e. The SPIFR rates have been on the average 1.26 and 1.67 times higher than DPIFR rates for day and night, respec- tively.)
In an effort to determine whether the problem is getting better or worse, a linear regression was used to fit each of the accident rate sets to straight lines. The plotted regression lines were purposely omitted from this report since the majority of the fits were very poor. For the full sixteen years of data, the SPIFR and DPIFR lines had negative slopes for night rates C-.025 and -.013, respectively) and practically a 0 slope C.0007 for both) when day rates were fitted. The value of R squared
24

never exceeded . 16 indicating the lack of fit between data. How- ever, when the data were broken down into two segments which co- vered the periods. of 1964-75 and 1976-79, there was a significant change in the picture. Although rates for the earlier time peri- od continued to correlate poorly, the curves for both single and dual piloted night rates over the later time frame reflected a very definite increase in rates with relatively better fits. From 1976 through 1979, the curves reflected positive slopes of
.026 and .041 for SPIFR and DPIFR night rates with R squared be- ing .56 and .70, respectively. The daytime rates again reflected poor fits with R squared less than . 1 in both cases and slopes of
.003 in both cases. Table 34 contains the values for the slopes and R squared for all cases.
Regardless of how much credence one gives to the statistics discussed above, or to the methodology used to derive the actual accident rates, there is no doubt that night IFR operations pose some very serious problems. In an effort to Itzero in" on some of the problems associated with night IFR approaches, a detailed analysis was conducted on two sub-sets of those accidents in hopes of determining what unique phenomenon is or are responsible for the night rate being over 10 times the day rate when theore- tically the circumstances are the same but for the amount of am- bient light. Detailed analyses were conducted on controlled col- lisions with the ground and/or objects on the ground and on un- controlled collisions with the ground/water. The analyses and results are discussed in the following section of this report.
The NASA GA survey hypothesized that operational problems experienced by the SPIFR pilot are independent of experience level. Prior to breaking down the data for specific accident types, an overall tabulation was made to see if total flight ex- perience is related to night landing phase SPIFR pilot error ac- cidents any differently than to day and/or all SPIFR pilot error landing phase accidents. Table 35 presents the tabulated results of that effort. Although the problems encountered by all pilots may be similar, indications are that the less experienced pilot has slightly more difficulty handling the night environment.
As can be seen from Table 35, pilots with 1000 or more hours of total flight experience have almost exactly half of this type mishap in the day and half at night. (The fact that expo- sure time is less at night and absolute rates are higher does not affect the proportion of day vs night occurrences so was disre- garded in this table.) Pilots with less than 1000 hours seem to have slightly more accidents at night than in the daylight. Spe- cific proportions are 51 and 56 percent, respectively, for night compared to day accidents for the group with over 1000 and less than 1000 hours, respectively.
25

Ideally, one should consider the proportion of day to night accidents in terms of accumulated night time. However, the amount of night time a pilot has is seldom reported upon in the NTSB data base for daylight accidents. Thus, a meaningful pro- portion of day to night accidents could not be established based on accumulated night time. However, the fact that the group of pilots with 600 to 1000 total hours had 61 percent of their acci- dents at night opens the door to an interesting hypothesis as explained below.
Generally speaking, a pilot with a new instrument rating is not likely to start right into challenging night IFR weather until he has built his confidence on day VFR and IFR instrument experience. Thus, one could hypothesize that the group in Table 35 with less than 400 hours is likely exposed to very few night IFR operations. If we then consider the next two groups (400-999) as representative of the low end of the experience spectrum, we find that almost 60 percent of their accidents in- volving pilot factor in the landing SPIFR environment occur at night. Thus, we can hypothesize that although the problems en- countered remain the same, total flight experience does in fact influence a pilot's ability to cope with the additional burdens of night IFR operations.
Ideally, the findings above should be verified by comparing pilot's instrument and night time for day versus night accidents. Those figures were tabulated but had to be disregarded due to the high number of accident reports that did not include that data. Night time was seldom included in a day accident report, and to- tal instrument time was included in 10 percent more night than day accident reports. In short, the best that can be done is the above hypothesis based upon total flight time which was reported for all accidents.
26

CONTROLLED/UNCONTROLLED COLLISIONS
Introduction: Of the 554 accidents that occurred between 1964 and 1979 that involved pilot error in a landing phase SPIFR envi- ronment, 255 were classified as a controlled collision with the ground/water or some other object growing from or resting on the ground. Additionally, there were 40 uncontrolled collisions with the ground/water and 48 stall accidents. Together, these three types of accidents made up 62 percent of the mishaps in the de- fined subset. This group of accidents was segregated from the . data base and analyzed in detail in an attempt to correlate a cause and/or pilot characteristic with the accident type, but more specifically, to try to determine factors that may be unique to night accidents. All controlled collisions with the ground/ water, trees, or any other stationary object were put into a group that is henceforth referred to simply as controlled colli- sions. All stall type accidents were reviewed on a case by case basis, and those that involved a spin or uncontrolled flight and/ or uncontrolled collision with the ground were grouped with the other uncontrolled collisions. Only 27 of the 48 stall accidents were used as the remainder fell into the stall-mush category which occurred almost exclusively in the latter stages of final approach and/or landing when airspeed became too low to sustain flight due to unfamiliarity with the aircraft, icing, inatten- tion, etc. The assumption that most occurred after visual con- tact was made led the authors to exclude those from both con- trolled and uncontrolled collisions.
Uncontrolled Collisions: The initial subset of accidents considered for this part of the analysis was a group of 67 acci- dents which met the criteria used previously in this report. (i.e. SPIFR landing phase with pilot error as one of the cause factors.) However, it soon became apparent that to do the analy- sis justice, other data should be compared to the initial analy- sis results. Thus, two additional groups of accident statistics were analyzed and used for comparison. One group contained all dual pilot accidents which met the same criteria as the single piloted subset, and the second group included all SPIFR take-off and enroute accidents that listed spatial disorientation and/or icing as a cause factor and resulted in an uncontrolled collision with the ground/water. For purposes of the following discussion, the three groups will be addressed as SPIFR landing, DPIFR lan- ding, and SPIFR enroute.
As was discussed in Ref. A, the major causes of uncontrolled collisions continues to be spatial disorientation (vertigo) and/ or icing. For analysis purposes, the uncontrolled collision ac- cidents were grouped into three subsets; vertigo, icing, and other. The latter was used when neither of the former were lis- ted as cause factors even through one or the other was insinua- ted. (There were repeated occurrences of reports that simply
27

said the pilot lost control at too low an altitude to effect a recovery.) When spatial disorientation was listed as a cause fac- tor along with icing and/or turbulence, the accident was not included as a vertigo caused accident. This method of accounta- bility was used in an attempt to keep the vertigo subset as a reflection of situations where there were minimal external influ- encing factors.
Of the 67 SPIFR landing phase accidents, 26 (38.8 percent) were attributed to vertigo, 23 (34.3 percent) to icing, and the remaining 18 (26.9 percent) to other causes. Table 36 presents the breakdown of those figures along with the same data for SPIFR enroute and DPIFR landing phase accidents.
Vertigo Caused Uncontrolled Collisions: As can be extracted from Table 36,
_---~~ ~ i vertigo as the primary cause factor accounts for
43.4 percent of all SPIFR uncontrolled collisions with the ground when pilot error is a factor. Enroute DPIFR data were not available but it can be seen that over half of the DPIFR uncon- trolled collisions are due to vertigo. This class of accident warranted detailed analysis for two very disturbing reasons. First, the accident is generally pimarily caused by human er- ror, so should be correctable to some extent. The second cause for concern is the sad injury statistics associated with this set of accidents. Of the 56 SPIFR accidents, there was only one ac- cident without fatalities and that outcome appears to be the re- sult of extreme luck or good fortune. (i.e. The pilot hit a hil- lside in the fog while experiencing vertigo and all 4 aircraft occupants escaped injury.) In the remaining 55 accidents, there were only 3 with survivors, with the overall statistics being 142 fatalities and 6 serious injuries. A detailed examination of factors involved revealed the following facts/statistics on ver- tigo caused uncontrolled collisions.
Note: DPIFR vertigo related accidents were omitted from most of the discussion in the remainder of this subsection due to the small sample size. i.e. 9 landing phase accidents over 16 years.
1. Condition of .Light: As presented in Table 37, 73 percent of the SPIFR landing phase vertigo accidents occurred at night while 60 percent of the DPIFR accidents in that category occurred at night. However, during climb-out and enroute opera- tions, only 35 percent of the vertigo accidents occurred at night.
2. Total Instrument Time Versus Condition of Light: As presented in Table 38, of the 14 SPIFR vertigo induced night ac- cidents in the landing phase with recorded total instrument time, 10 involved pilots with less than 60 hours of actual instrument time. Only 2 of the 5 day mishaps in that category involved pi- lots with less than 60 hours of actual instrument time. For the
28

enroute accidents, 5 of the 6 reported instrument times for the night mishaps fell in the less than 60 actual instrument hour category. The day enroute SPIFR accidents were more evenly dis- tributed but still had 5 of the 11 occurring in the less than 60 hour category.
39 Time in Type Versus Condition of Light: As shown by Table 39, 4 of the 6 night enroute mishaps reporting time in type for enroute accidents involved pilots with less than 50 hours in type. Day time landing phase mishaps tended to reflect slightly more time in type, but all 9 reported involved pilots with less than 200 hours in type. Pilots with more than 500 hours in type accounted for 5 day enroute mishaps and 5 night landing mishaps. There were no day landing mishaps nor night enroute mishaps in- volving the over 500 hours in type group.
4. Total Flight Time Versus Condition of Light: Table 40 presents the tabulation of total flight hours accumulated by the pilots involved in day and night mishaps. Occurrences seem to be relatively evenly distributed over the spectrum of experience levels over the first 3000 hours of flight experience.
5. Total Night Time Versus Night Mishaps: Table 41 pre- sents the distribution of pilot night time for those mishaps which occurred at night. Once again, the lower experience ranges have more occurrences than the higher experience ranges. (12 had less than 100 hours of night time and 4 between 100 and 200 out of the 22 incidents which reported night time.)
6. Experience Profile: Table 42 presents a comparison be- tween experience levels of the typical pilot from the GA pilot survey, the NTSB SPIFR landing phase pilot factor accident population, the SPIFR vertigo landing phase population, and the SPIFR vertigo enroute population. As would be expected from the data presented in paragraphs 1 through 5 above, the average pilot involved in vertigo induced accidents is less experienced than the overall populations. The most significant differ- ence in pilot experience appears in the realm of total actual instrument time. Where the median for both of the larger popu- lations is 150 hours, the median for both of the vertigo popula- tions is slightly less than one-third as much experience in actu- al instrument conditions. (i.e. Just under 50 hours versus 150.) The proportions of simulated time indicate that simulated instru- ment experience is less important since the medians are fairly consistent except for the fact that all three populations based upon the accident data base are reflecting less time than the GA survey average simulated median. The total flight time medi- ans indicate that the pilot involved in the vertigo accident have roughly half the number of hours that their contemporaries have in the other two populations. Finally, time in the last 90 days appears to be more independent although the vertigo medians are again lower than those in the larger populations.
29
Vertigo Accident Discussion and Conclusions: The statistics summarized in paragraphs 1 through 6 above-and presented in Ta- bles 37 through 42 indicate that pilot experience levels in gene- ral are definitely related to the occurrence of vertigo induced accidents. Actual instrument experience and total flight hours appear to be the most critical experience factors when compared to other populations. Indications are that night time and time in type are also important factors in vertigo induced accidents, especially those that occur at night. However, the data for the last categories were not available from the general population of general aviation for comparison.
An important point for the reader to remember is that the statistics and tables relevant to this discussion on vertigo are based on the NTSB data base and consequently are subject to some amount of inaccuracy based upon unknown and/or unreported data. An additional point is the fact that pilots of different experi- ence levels are exposed to the elements at different rates based upon total experience and their propensity to fly under more de- manding instrument conditions. The effect'of experience is graphically illustrated in Table 42. All of the means in that table are significantly greater than the medians. This reflects the fact that there are more pilots in the lower experience levels than in the higher levels and that the former naturally have more accidents. But it also indicates that in terms of to- tal hours of exposure, the inexperienced pilot has more accidents than the experienced pilot. The reader is invited to use the data to address theories that are not addressed elsewhere in this report.
In addition to tabulating and analyzing the numbers involved in this section, the accident brief for every SPIFR vertigo caused mishap was reviewed for the contents of investigator com- ments. Since those comments are sometimes of a speculative na- ture and purely subjective, tabulation was not attempted. How- ever, there were areas that warrant comment and provide substance for future investigation. Thus, the authors offer the following comments for the reader's evaluation and consideration.
1. A large number of accidents contained a comment alluding to the fact that the pilot continued flight into conditions that exceeded his capabilities. It seems rather obvious that an acci- dent would not have occurred if this were not the case, so on the surface the comment does not appear to add anything to an acci- dent brief. The point to ponder is not whether or not the remark is redundant, but more importantly, how does a pilot know when he is about to exceed his capabilities? Obviously, the only way to answer such a question is after the fact. Whether or not there is a mishap is the only real measure of whether one has over- stepped their capabilities. Education of the GA pilot appears to be a continuing need in the area of statistics which will more
30

concretely marry experience levels to accident conditions.
2. A second area where education and reinforcement could be used is on the subject of physiology connected with vertigo. There were repeated cases of vertigo being induced when the pilot was temporarily distracted from his instrument scan. Two specif- ic cases concerned pilots having to change transponder settings. In both cases the pilot lost control of the aircraft and became fatalities of their own error. The GA pilot should be reminded on a continuing basis of the effects of sudden and/or rapid head movements when there is no visual reference to the horizon.
39 Of particular concern to this author are those accidents where the pilot reported his attitude gyro becoming unreliable. One cannot help but speculate that in many cases where a pilot reported his gyro becoming unreliable (as opposed to it failing completely) whether in fact the situation existed where the pilot was beginning to pay more heed to erroneous signals from his in- ner ear than to the total picture his instruments provided. Most gyros have an OFF flag that appears when the instrument loses power or is not providing reliable information. A short case history of an incident that fell short of being an accident should illustrate this point.
A relatively new military aviator in a single engine single seat jet commenced a GCA at NAS Oceana, Virginia. The GCA was required due to a fog bank which had formed with the base at 300 feet and tops at 1500 feet. The attitude gyro in the aircraft had a history of tending to precess in long extended turns. The aircraft gear and flaps were lowered while simul- taneously beginning a descent from 1500 to 1200 feet. As the aircraft entered the clouds, the gyro indicated a slow roll commencing to the left while the pilot's "inner ear" was re- porting wings level or a slow roll to the right. The pilot's reaction was to assume the gyro was in the process of fail- ing. A transition to partial panel instrument flying was unsuccessful due to the needleball and directional gyro now giving erratic indications. The aircraft broke out of the bottom of the 300 foot overcast nose low and in a steep bank. A recovery was made short of the tree tops and the aircraft reentered the cloud layer at 100 percent power and climbing. Almost immediately, the aircraft came out the top of the overcast with the rudder-shaker (stall-warning device) shud- dering, indicating an impending stall. Fortunately, there was no weather above the fog bank and the aviator had time to cross check the gyro horizon with the visual horizon and to see that there was absolutely nothing wrong with the instru- ment. A relatively uneventful GCA was completed by a shaken, but much wiser aviator.
31
Since that aviator happens to be one of the authors of this re- port I he cannot help but wonder how many other neophyte aviators have naively written off a gyro as inoperative because they did not understand the mechanics of the instrument and/or its built-in safety features. Food for thought is how should a con- troller react to a pilot report that their gyro is "becoming unreliable?t, Or how do we educate the new GA aviator to heed his instruments and their operational indications?
4. Other miscellaneous comments relative to vertigo related accidents not surprisingly included indications that the pilot lost control when making the transition from VFR to IFR condi- tions, was terminating an extended flight (12 hours in one case and 10 hours in another), and a case where the pilot was flying in night IFR conditions without having flown for six months.
5. It is the opinion of the authors that the problem is most likely more severe than accident rates indicate. The basis for this statement is that weather conditions at the scene of the reported accidents had to be IFR (less than 1000 foot ceiling and/or less than 3 miles visibility) to be included in the repor- ted subset. One cannot help but wonder how many cases of vertigo end in a visual recovery beneath a cloud layer.
Icing Caused Uncontrolled Collisions: After vertigo as a cause factor for SPIFR accidents involving pilot error comes icing. As can be seen in Table 36, icing is a primary cause factor in about one-third of the landing phase uncontrolled collisions and about 17 percent of the enroute accidents of this type. The same set of variables as was discussed in the previous section on vertigo was examined to see if icing accidents might be related to speci- fic levels of pilot experience. The experience levels in general are much more evenly distributed for icing related uncontrolled collision, but the sample sizes are much smaller and consequently statistical inferences become less meaningful.
Table 43 presents the experience level statistics for pilots involved in icing related uncontrolled collisions by landing and enroute phases. The statistics for the NASA GA pilot survey and overall SPIFR landing phase populations are repeated in Table 43 for comparitive purposes. The reader is cautioned to note the sample sizes before assigning too much weight to the results.
Table 44 is a summary of pilot experience levels for the SPIFR uncontrolled collisions in the landing phase which is structured for a comparison between vertigo and icing related mishaps. The impact of actual instrument and night time is dif- ficult to compare due to the large number of unreported amounts of night time in the icing area. Time in type and total flight hours appear to have relatively equal distributions with the icing incidents in general occurring to pilots with slightly more experience in both categories.
32

An interesting observation in the review of data was that only 2 of the 23 icing caused accidents involved single engine fixed gear aircraft as opposed to 9 of 26 vertigo landing acci- dents occurring in that aircraft class. Retractable gear single engine accounted for 9 icing incidents but only 5 vertigo inci- dents. Twin engine incidents were roughly the same with 11 icing and 10 vertigo incidents. As would be expected, the jet engine classes accounted for only 1 incident in each category which could in part be explained by the altitudes at which they cruise, the better instrumentation in the more expensive aircraft, and fewer aircraft in the GA community. Graphically, the breakdown of aircraft types was:
Icing Vertigo
Single Engine Fixed Gear Single Engine Retractable Gear Twin Engine Piston Turboprop/Jet
A review of the icing uncontrolled collision accident briefs confirmed that the vast majority of the accidents were attributed to poor judgment of the pilot. In 18 of the 23 incidents, the weather was classified as "substantially the same as briefed." In two cases, it was classified as "considerably worse than briefed" but the pilot continued to press on in both situations with no de-icing equipment.
In general, it appears that the severest of accidents caused by icing (i.e. uncontrolled collisions with the ground) are preventable mainly through pilot education and the development of low cost deicing equipment.
Controlled Collisions: As was discussed in the introduction to this section, controlled collisions with the ground, trees, or other objects on the ground account for the largest single group of accidents in the SPIFR landing phase with pilot error as a factor. This section of the report explores the circumstances peculiar to various types of accidents within this group, concen- trating on the SPIFR night controlled collisions to isolate trends and/or pertinent contributory factors. The tables related to this section, 45 through 54, not only contain the data to sup- port the discussion in this section, but also contain some ampli- fying data that is not directly addressed. The latter are pro- vided so that others may conduct independent analysis of some of the relationships that the authors either judged as statistically unsupportable or that were not within the scope of the project.
33

Rather than presenting a broad brush analysis of all uncontrolled collisions and attempting to relate patterns between day, night, single pilot, and dual pilot operation, efforts were concentrated on determining in more detail what factors are the most germane and/or critical in night SPIFR uncontrolled colli- sions in the landing phase which involve pilot error. Based upon the results of the earlier NASA SPIFR report (reference A) along with the tables and discussion presented in this section of the report, it appears safe to assume that night SPIFR operations in the landing phase are the most demanding with which most general aviation pilots have to contend. Intuitively, it seems logical to assume that the problems faced in the night SPIFR instrument approach are simply an extension of the same evolution during day light. However, the fact that breaking out between layers of clouds and/or beneath an overcast at night does not provide a visual reference to lessen the pressures on the pilot demands higher levels of performance and concentration. Additional prob- lems with vertigo inducing aircraft and/or ground lighting re- flections in clouds as well as the problems associated with cock- pit lighting, trying to read an approach plate, dial in frequen- cies on poorly lit dials, etc. all contribute to higher physical and psychological demands at night. There are other factors such as the effects of darkness on depth perception and peripheral vision. Due to these burdens and complications, it seems logical that problems which may be simply an irritant or potential acci- dent cause in the day light should be magnified and easier'to detect in an analysis of night time operations. The serious day light problems should be all the more prevalent in the more de- manding night time environment.
If the above assumptions are true, we might expect to find some of the same trends and patterns in daylight mishaps as we do at night, but the experience levels of the pilots involved in similar situations should be lower in daylight. i.e. The more demanding night environment will overcome higher experience levels that would keep a pilot out of trouble in daylight. Table 45 presents a summary of the medians of various measures of pilot experience for SPIFR and DPIFR accidents that involved pilot er- ror in the landing phase of operations. Medians were used for the comparison to try to minimize the effect of the exceptionally high experience levels that bias the means.
The results of Table 45 are by no means conclusive evidence that all of the assumptions made in the preceding two paragraphs are absolute truths. However, the indications are sufficient enough in the authors' opinions to justify a more in-depth analy- sis of the controlled collision at night in hopes of identifying significant problem areas.
34

SPIFR Night Controlled Collisions: There were 173 SPIFR lan- ding phase night controlled collisions involving pilot error in the NTSB data base for the period 1964-1979. Although the pro- portion of this type of accidents that occurred since 1975 is 3 percent lower than that for the total set of SPIFR accidents con- sidered, the distribution of those accidents does not provide cause for optimism. During the years 1976 through 1979, the num- bers of SPIFR night controlled collisions were 6, 12, 21 and 23, respectively. Table 46 presents these numbers in terms of acci- dents per 1000 night approaches flown (from Table 31) and com- pares those rates to overall night SPIFR rates. Our earlier dis- cussion on day versus night rates indicated the night accident rate was increasing, and as can be seen in Table 46, the propor- tions of the night accidents that are classified as controlled collisions are also increasing.
In an attempt to identify which factors are significant and/or inter-related, each night controlled collision accident brief was reviewed and a cause factor was assigned based upon a combination of the formal cause factor assigned by the accident investigator and a review of the secondary causes and investiga- tor comments. The cause factors into which all accidents were divided are:
1. Improper IFR procedures 2. Icing related
43: Pilot distracted/diverted attention Suspect instruments misread
5. Faulty instrument 6. Descended below minimums 7. Misjudged altitude
;: Aircraft not properly equipped Did not fly published approach
10. Conditions exceeded pilot's capabilities 11. Pilot incapacitated 12. Vertigo
Subjective assignments to a category were necessary in some instances. For instance, if a plane crashed due to ice on the windshield because the windshield de-icers were inoperative, the incident could be assigned to either category 2 or 8. To facili- tate an analysis of the interaction of pilot experience and wea- ther conditions with cause factors, subjective classifications were made based upon which factor appeared to be of the most sig- nificance by the facts and comments in the accident brief.
The right most columns of Table 47 provide a simple tabula- tion of all of the night controlled collisions by cause factor along with the way the accidents were distributed for the 1964- 1975 and 1976-1979 time periods. There are four very significant changes in the data for the two time periods which are reflected in cause factor categories 3, 4, 6 and 10. (i.e. Distracted/Di-
35
verted Attention, Suspect Misread Instrument, Descended Below Minimums, and Pilot Exceeded Capabilities) Before addressing the significance of those changes, it should be mentioned that the major cause of the changes could relate to a combination of the way the accidents were classified and a possible change in NTSB investigator philosophies about comments on their accident brief. More specifically, practically all of the accidents reviewed were attributed to improper IFR procedures as the primary cause. If the comment section exlained the improper procedure or operation in terms such as the pilot momentarily being distracted or flying below minimums, that incident was classified in categories 3 or 6, respectively. Thus, category 1 (Improper IFR Procedures) is more generic and was used when the brief lacked secondary causes and comments.
In light of the cause factor classification methodology, we can only speculate about the large changes in categories 3, 4, 6 and 10. Using the most conservative approach, let us hypothe- size that trends remained constant after 1975, and that those accidents that were caused by one of the four categories (3, 4, 6 or 10) simply were not so annotated in the comments section by the investigator. If our hypothesis is correct, the sums of cat- egories 1, 3, 4, 6 and 10 for the two time periods should have a ratio similar to the ratio for the total accidents for the same periods, assuming also that trends have continued unchanged. In fact, the ratios are .339 and .358 for the sums and totals, re- spectively. The acceptance range at a confidence level of 95 percent for the overall proportional occurrences of accidents is
.25 to .42. Since .358 falls well inside of this range, indica- tions are that,there has been no change in the relative number of occurrences of the combined categories. To identify if any actu- al trends are actually occurring in the causes of night con- trolled collisions, and to relate those trends to pilot charac- teristics, the cause factors in question were re-examined and then regrouped to allow for the probable change in the accident brief comments. (i.e. The reticence of investigators in later years to include remarks about the pilot continuing below mini- mums.)
The four categories 3, 4, 6 and 10 (distracted/diverted attention, suspect misread instruments, descended below minimums, and pilot exceeded capability) all lend themselves to speculative comments after an aircraft has crashed in below minimums weather, especially if there are no indications of mechanical or other human failure. Therefore, two additional tests were made to gain more information on the change in the number of accidents attri- buted to "descending below minimums". The first test involved relating the occurrences of this group of causes to accidents where the weather was known to be below minimums and the second test was made relative to fatal accidents.
36
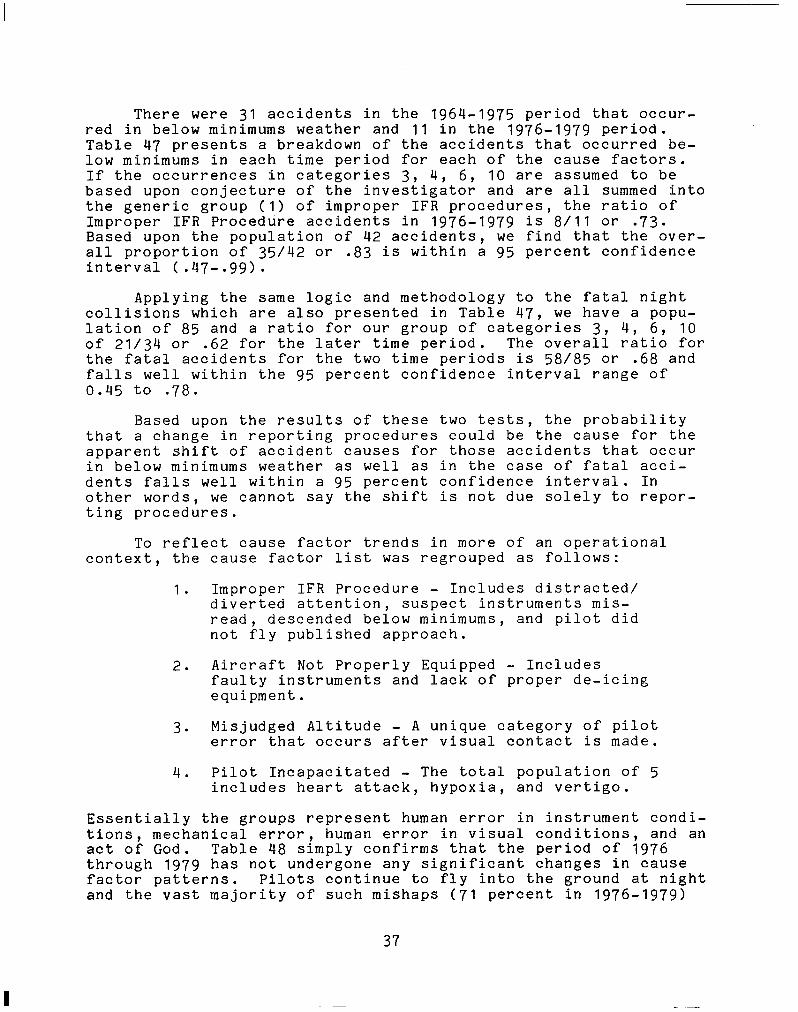
There were 31 accidents in the 1964-.I975 period that occur- red in below minimums weather and 11 in the 1976-1979 period. Table 47 presents a breakdown of the accidents that occurred be- low minimums in each time period for each of the cause factors. If the occurrences in categories 3, 4, 6, IO are assumed to be based upon conjecture of the investigator and are all summed into the generic group (I) of improper IFR procedures, the ratio of Improper IFR Procedure accidents in 1976-1979 is 8/11 or .73. Based upon the population of 42 accidents, we find that the over- all proportion of 35/42 or .83 is within a 95 percent confidence interval (.47-.qq).
Applying the same logic and methodology to the fatal night collisions which are also presented in Table 47, we have a popu- lation of 85 and a ratio for our group of categories 3, 4, 6, 10 of 21/34 or .62 for the later time period. The overall ratio for the fatal accidents for the two time periods is 58/85 or .68 and falls well within the 95 percent confidence interval range of 0.45 to .78.
Based upon the results of these two tests, the probability that a change in reporting procedures could be the cause for the apparent shift of accident causes for those accidents that occur in below minimums weather as well as in the case of fatal acci- dents falls well within a 95 percent confidence interval. In other words, we cannot say the shift is not due solely to repor- ting procedures.
To reflect cause factor trends in more of an operational context, the cause factor list was regrouped as follows:
1. Improper IFR Procedure - Includes distracted/ diverted attention, suspect instruments mis- read, descended below minimums, and pilot did not fly published approach.
2. Aircraft Not Properly Equipped - Includes faulty instruments and lack of proper de-icing equipment.
3. Misjudged Altitude - A unique category of pilot error that occurs after visual contact is made.
4. Pilot Incapacitated - The total population of 5 includes heart attack, hypoxia, and vertigo.
Essentially the groups represent human error in instrument condi- tions, mechanical error, human error in visual conditions, and an act of God. Table 48 simply confirms that the period of 1976 through 1979 has not undergone any significant changes in cause factor patterns. Pilots continue to fly into the ground at night and the vast majority of such mishaps (71 percent in 1976-1979)
37

, ,,. , ,, -.-,,.. . _,-. --_-.. .-..-
remain attributable to improper IFR procedures which cover a wide variety of sins. Although there appears to have been a major shift in accident reporting procedures, the actual causes do not appear to have changed significantly any from the 1964-1975 peri- od. It is difficult to say for sure that descending below mini- mums continues as the leading element within the improper proce- dures category. However, based upon the fact that to contact the ground, a pilot would have to descend below minimums when the weather is below minimums, and since 5 accidents in those condi- tions were attributed solely to improper procedure (Table 47), it is fairly safe to assume that such was the case.
Pilot Experience vs Night/Day Controlled Collisions: Table 49 wafthe number of nTght-controlled collisions in terms of various measures of a pilot's proficiency or experi- ence. Table 50 provides the same data for day controlled colli- sions. Table 51 presents a combination of 49 and 50 in percen- tages of accidents reported. There are many nuances in the data presented in these particular tables about which one could do a great deal of speculating. The reader is cautioned to pay parti- cular attention to the range of hours covered by each of the bins before drawing any hasty conclusions. Table 46 and 47 present the first 100 hours of experience in 4 bins to see how the figures on the very inexperienced pilot behave, and at the high end of the tables, figures include thousands of hours. Two points the authors of this report felt worthy of comments are:
1. Simulated Instrument Experience: As shown in Table 51, 85 percent of the night uncontrolled collisions upon which simulated instrument time was reported fell in the O-100 hours bin as did 73 percent of the day mishaps. Within that 100 hours, both day and night accident rates peaked out in the 40 to 60 hour bracket. In Table 52, which presents a comparison of pilot profiles for day and night uncontrolled collisions, it can be seen that the median simulated times for pilots involved in day and night uncontrolled collisions are equal at 59. This is down slightly from the entire SPIFR data base, and down significantly for the "typical GA pilot,, derived from the GA survey data base. Even though the relationship of simulated hours to uncontrolled collision rates is not that far out of line from the GA profile, it appears as though the hours of simulated instruments is dispropor- tionately small when compared to actual actual instrument hours.
Table 53 was compiled to compare simulated instrument ex- perience with aircraft types. The authors hypothesized that perhaps the small single engine aircraft would skew the distribution of simulated hours possibly due to many solo flights and/or the passenger seat(s) not situated well for look-out purposes. As can be seen in Table 53,
38

2.
twin engine pilots, in general, did not have any more simulated time than the single engine pilots..
Time in Type for Single Engine versus Twin Engine: Ac- cording to the data in Reference C, 70.5 percent of the GA pilots fly in single engine aircraft as IFR pilots. Over the 16 years represented in the NTSB data, 151 of the 239 controlled collisions occurred in twin engine aircraft. That means that twin aircraft (includes turbo- prop) accounted for 63.2 percent of this type of SPIFR mishap, or rephrased 29.5 percent of the aircraft account for 63.2 percent of the controlled collisions attribu- ted to pilot factor in the landing phase. Upon arriving at this percentage, the authors hypothesized that this was attributable to the higher workload demanded from the SPIFR pilot in twins as suggested by the previous NASA research. (Reference A) If this were the'case, one would expect the accident rate at night to be higher than in the day, particularly if our earlier hypothesis on night demands being an important factor in higher rates holds true.
Interestingly, the proportion of twin controlled colli- sion accidents decreases at night. Whether the propor- tion changes due to relatively more single engine acci- dents at night or due to less twin accidents is not clear, but the figures are consistent. The proportion of controlled collisions that occurred in single and twin engine aircraft is as shown below in Table 54. The
Table 54. Proportion of Twin Uncontrolled Collisions
1964-1979 1976-1979
Twin Day/All Day -71 -72 Twin Night/All Night .60 .61
proportion of overall accidents in all phases and all light conditions for twins was demonstrated to be .62. Table 55 presents the distribution of the time in type for experience levels for day and night controlled colli- sions by single and twin engine aircraft. There is a definite increase in the proportion of single engine mis- haps at experience levels of less than 100 hours and the distribution of time in type for twins remains fairly consistent from day to night. However the best we can do is speculate that the apparent decrease in the overall ratio of night twin engine mishaps is due more to an in- crease in inexperienced pilots in single engine mishaps. (Based upon the proportions of single and twin day acci- dents, computing 95 percent confidence intervals against
39

which to check the night proportions give us ranges of .60 to .82 and .18 to .40 for the respective proportions of .60 and .39 which does not help in the determination of which has what impact.)
Visibility in Controlled Collisions: Table 56 presents a sum- mary of the reported visibility broken down for day and night single and dual piloted controlled collision accidents. The first four rows of the table present the absolute number of acci- dents for each reported visibility while the bottom four rows tabulate the occurrences by percentages. Except for day dual piloted accidents, the percentage of accidents that occur when the existing visibility is 2 miles is greater than the number that occur with 1 mile reported visibility. The cumulative num- ber that occur with less than one mile visibility approaches 50 percent for all of the categories except night SPIFR controlled collisions. The latter happen most frequently with 1 to 2 miles visibility as do night DPIFR mishaps.
In an attempt to establish a relationship between the crash site and the location of the airport, a table was compiled to see how many controlled collisions occur within sight of the destina- tion airport. Table 57 provides a comparison of the number of day and night SPIFR accidents where the visibility is greater or less than the distance of the crash from the airport. One would logically expect relatively few pilots to fly into the ground if the airport were in sight. When the visibility is less than 1 mile, 28 percent of day and 31 percent of night controlled colli- sions occur with the distance of the crash from the airport being less than the visibility, i.e., within visual range of the air- port. At visibilities of 1 mile and greater, 57 percent of the day and 62 percent of the night controlled collisions occur with- in theoretical sight of the airport.
The reasons for flying into the ground with the airport in sight are explainable in some instances where there was icing involved or the pilot misjudged his altitude after transitioning to visual flight. Other possibilities may be gleened from table 58 which presents a matrix of accident causes and approach types for night controlled collisions.
A possible contributing factor to those occurrences where the aircraft is within visual range of the airport could be the type of lighting for night instrument approaches. Unfortunately, few accident reports contained data on lighting. Seventy-one accidents after 1975 included runway lighting information. The data prior to 1975 were discarded since if lighting data were included at all, they included only the intensity of the lights and not the type. None of the reports included data on approach lighting. The only correlation that could be made for certain about the effects of runway lighting is when it was a cause fac- tor. There were two cases where the pilot could not or failed to
40

actuate the pilot actuated runway lights, 3 cases of the aircraft crashing into the lights, and 2 cases where the lights were covered by a snow bank. Of the 15 aircraft that flew into trees and had reports that included data on the runway lights, 8 were outside of visual range of the airport, and of the rest, only 3 aircraft unexplainably flew into the trees with no influencing factor such as icing or the pilot misjudging his altitude. One of the 3 had medium intensity runway lights in addition to high intensity. The remaining two had high intensity lighting only.
41

CLOSING COMMENTS
Ideally, one would like to close a report with a list of im- portant conclusions and recommendations. However, the authors feel that the nature of the results of this analysis do not lend themselves to objective stand-alone.statements. This report cov- ers a wide range of topics, and has identified many factors and experience traits that are indicative of trends and/or patterns which relate to accident types and causes. However, we feel that the reader should interpret identified trends and factors within the context of the analysis and related topics with which they are presented. The following paragraphs present some of the gen- eral findings of this effort.
Of the 554 SPIFR pilot error landing accidents which were analyzed in detail, 39 percent occurred after Reference A was published. However, there were no significant changes from the original findings in the relationships of mission variables to the accidents in the later time period. The absolute number of accidents is increasing but when compared to the higher numbers of activity, the rate is decreasing. Worthy of note is the fact that this accident rate over the last four years of data has been decreasing more slowly. (i.e. The overall picture is brighter each year but the gains being made are smaller.)
In an analysis of these accidents by phase of landing, it was found that there were statistically fewer accidents in the the initial approach phase after 1975 which is most likely attri- butable to fewer non-precision approaches being flown. The final approach phase still accounts for most landing phase SPIFR acci- dents with three times as many occurring at night as do in the daylight.
The fact that so many more final approach accidents occur at night rather than in the daylight led to a concerted effort to quantify day and night accident rates. The aviation community has long known that the number of accidents that occur during day and night has been about the same over the years. However, it was found that 87.6 percent of GA activity occurs during daylight and 12.4 percent in darkness. The startling conclusion of this report is that the night accident rates for both single and dual piloted aircraft are over 10 times greater than the day rates.
Statistical profiles were compiled for the typical GA pilot in the NASA Survey and the typical pilot involved in the 554 ac- cidents analyzed. These profiles were compared to profiles of the pilots involved in sub-sets of accidents to determine the importance of experience levels. Essentially, these efforts ended up documenting the intuitive assumption that the lesser experienced pilot is more likely to be involved in a SPIFR pilot error accident. The degree to which this is true was especially
42
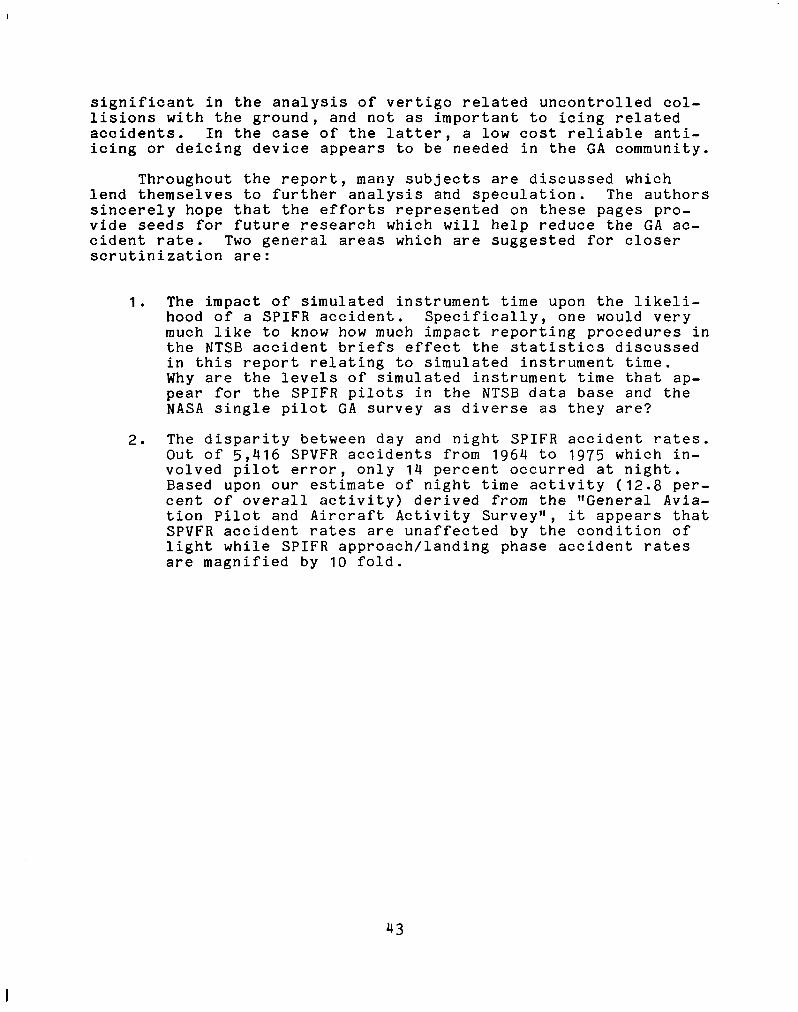
significant in the analysis of vertigo related uncontrolled col- lisions with the ground, and not as important to icing related accidents. In the case of the latter, a low cost reliable anti- icing or deicing device appears to be needed in the GA community.
Throughout the report, many subjects are discussed which lend themselves to further analysis and speculation. The authors sincerely hope that the efforts represented on these pages pro- vide seeds for future research which will help reduce the GA ac- cident rate. Two general areas which are suggested for closer scrutinization are:
1. The impact of simulated instrument time upon the likeli- hood of a SPIFR accident. Specifically, one would very much like to know how much impact reporting procedures in the NTSB accident briefs effect the statistics discussed in this report relating to simulated instrument time. Why are the levels of simulated instrument time that ap- pear for the SPIFR pilots in the NTSB data base and the NASA single pilot GA survey as diverse as they are?
2. The disparity between day and night SPIFR accident rates. Out of 5,416 SPVFR accidents from 1964 to 1975 which in- volved pilot error, only 14 percent occurred at night. Based upon our estimate of night time activity (12.8 per- cent of overall activity) derived from the IfGeneral Avia- tion Pilot and Aircraft Activity Surveyl', it appears that SPVFR accident rates are unaffected by the condition of light while SPIFR approach/landing phase accident rates are magnified by 10 fold.
43

National Transportation Safety Board general aviation (GA) aircraft accident data for the years 1964 to 1979 were examined for single pilot instrument flight rule (SPIFR) accidents caused by pilot error. The 1396 accidents found were analysed to determine the relationship of SPIFR accident types to phase of flight, pilot experience, and mission variables such as condition of light,ceiling, visibility, and type of approach. An estimate of GA day and night activity was made in order to estimate actual day and night accident rates.
The results of the data analysis indicate that about 50 percent of the SPIFR accidents occurred during the landing phase of flight, 40 percent occurred during the enroute phase, and 10 percent occurred during the taxi/ takeoff phases. Fog was present in 72 percent of the landing phase accidents and of those accidents 54 percent occurred in visibilities of 1 mile or less.
Experienced pilots tended to have a lower accident rate than less experienced pilots. This trend was expecially significant with vertigo related accidents and much less significant with icing related accidents.
The estimate of day GA activity was 87.6 percent of all GA activity and night activity was 12.4 percent. Based on these estimates and the number of day and night accidents the night accident rate was judged to be 10 times the day accident rate.
When approach types were examined 33 percent of the landing phase accidents occurred during VOR or VOR/DME approaches, 8 percent occurred during NDB approaches. Over twice as many accidents occurred during straight in ILS approaches with no radar advisories available as during straight in ILS approaches with radar advisories.
44

APPENDIX A
FIGURES l-5
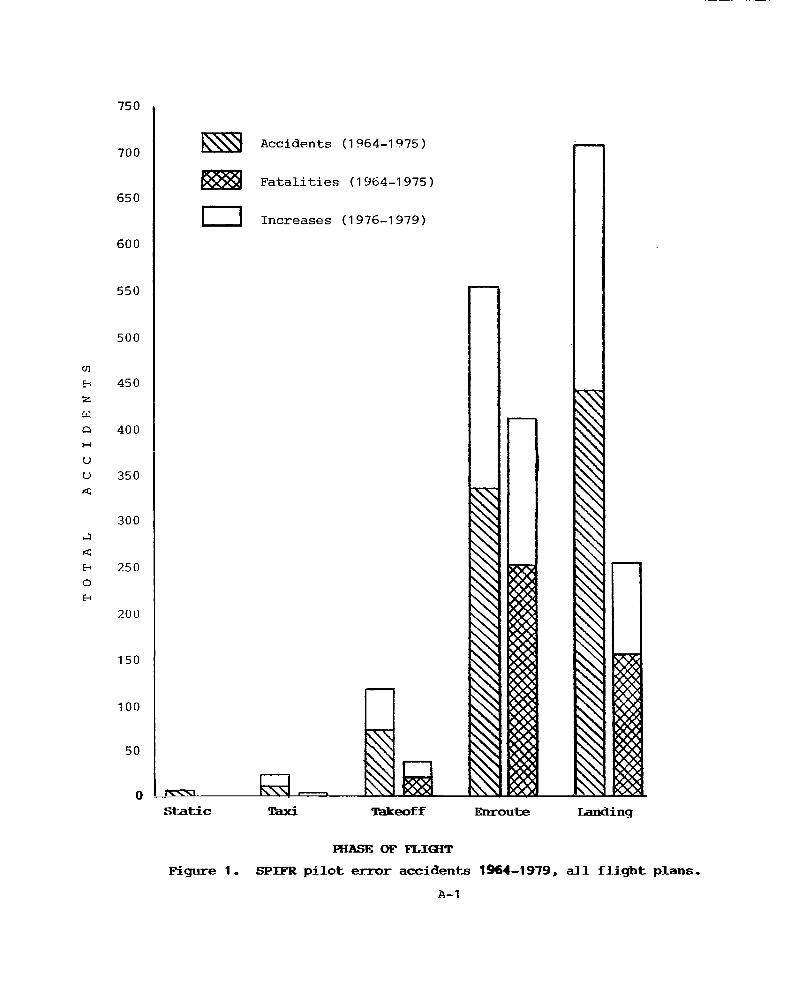
750
700
650
600
550
500
450
400
350
300
250
20 u
IS0
100
50
0
lTsl Accidents (1964-1975)
Fatalities (I 964-1975)
0 Increases (1976-1979)
StatiC Taxi Takeoff BlI-OUte
AiAsEOF FL.IQiT
Jkmdinq
Figure 1, SPIFR pilot error accidents 1%4-1979, all flight plans,
A-l

x Taxi phase accidents
0 Takeoff phase accidents A Enroute phase accidents 0 Landing phase accidents 0 Total IFR approaches
Takeoff phase accidents
? Figure 2. WIFR Pilot error accidents and IFR approaches fitted with linear rearession linea
0
1500
1400
1300
1200
600
500
$00
100
'00

x Taxi phase A Enrou,te phase
0 Takeoff phase 0 Landing phase
cl
A
A A A A
al
2- 0 O 0 Takeoff phase O 0
/\ 0 rc 0 n 0
x x " 1 - x 0 e
r-l #
Taxi phase Q 0
A Ir Y X Y I V V Y I V v Y , V I I
”
64 65 66 67 68 69 70 71 72 73 74 75 76 77 78 79 > I '53 Figure 3. Single and dual piloted, pilot error accidents/lOO,OOO approaches.

0 Single-pilot, pilot error Cl Dual-pilot, non-pilot error
0 Single-pilot, non-pilot error
A Dual-pilot, pilot error
0
A
A f+ingle-pilot, non-pi10 0 -
b w A A
l.\ n n WI W d
4%) V U Y w el
9 70 71 72 73 74 75 76 77 78 79 64 65 66 67 68 6
Figure 4. Total IFR flight plan landing phase accidents.

11 cl 0 0 Single-pilot, pilot error
a Dual-pilot, pilot error
1.0 0 Single-pilot, non-pilot error
A Dual-pilot, non-pilot error
9 Cl 0 0
0 8 0 0 Single-pilot, pilot error
cn j 7;
Q
0
0 U
v 0
p: q 0 0
0 Dual-pilot, pilot error 0
0 fi v
l.J
0
O- 64 65 66 67 68 69 70 71 72 73 74 7.5 76 77 78 79
? Figure 5. IFR flight rlan landing phase accidents/lOO,OOO general aviat.ion IFR approaches. u

APPENDIX B
TABLES 6-58

TABLE 6 SPIFR LANDING ACCIDENTS IN TERMS OF OBSTRUCTION TO VISION
AT THE ACCIDENT SITE AND SELECTED MISSION VARIABLES
OBSTRUCTION
TOTAL 398
INJURY INDEX NONE 108 MINOR SERIOUS 5'; FATAL 183
VISIBILITY ZERO l/4 MILE l/2 MILE 3/4 MILE 1 MILE 2 MILES 3 MILES 4 MILES
11
2
ii2 112
52 10
PRECIPITATION RAIN/DRIZZLE SNOW FREEZING RAIN
AND DRIZZLE OTHER (INCL NONE)
161 23
29 185
TERRAIN MOUNTAINS HILLY ROLLING LEVEL DENSE W/TREES
: 2 2 5 1
2 ~ 4' 1 1 j 7 6 ;
I 10
24 2
1 1 17 :, 21
1 3 2 2
ii 4 1 l 1 4
36
9’ 184
E 16 I 222
1 2
z 5
10 4 2
3 35 27 256 z;
192 71 ;7’
2: 42 18
2 tg 86 23

TABLE 7 SPIFR LANDING ACCIDENTS IN TERMS OF CONDITION OF LIGHT
AND SELECTED MISSION VARIABLES
DAWN DAY DUSK DARK TOTAL
TOTAL
INJURY INDEX NONE MINOR SERIOUS FATAL
VISIBILITY ZERO l/4 MILE l/2 MILE 3/4 MILE 1 MILE 2 MILES 3 MILES OVER 4 MILES
OBSTRUCT. TO VISION FOG NONE
PRECIPITATION RAIN & DRIZZLE SNOW FREEZING RAIN OTHER
TERRAIN MOUNTAINS HILLY ROLLING LEVEL DENSE W/TREES
PERCENT 1976-79
10 223 27 294 554 39
2 22 76
12
z 8
69 45 47
133
184
8; 222
38 44
E
1: 13
2 64
3: 32
li 70 40 43
16 54 48
;: 143
71 77
t; 29 42 34 40
z;
8 154 20 216 398 40 1 30 3 32 66 39
81 33
if
10 4 1
12
99 34
1:;
192 71
2%
36 46
:;
4 3
19 14 18
196
9 25
31
:; 84 86
42
:; 43

TABLE 8 SPIFR LANDING ACCIDENTS IN TERMS OF PHASE OF LANDING
AND SELECTED MISSION VARIABLES
GO AROUND
VFR PERCENT 1976-79
\ -.\ PHASE OF
.._ FLIGHI
\ MISSION VARIABLES
\
TOTAL
TRAFFIC PATTERN CIRCLING
VL OFF TOUCH-
DOWN FINAL
VFR 'INAL IFR
INITIAL IFR
MISSED APPRCH ROLL OTHER TOTAL
26 224
26 34 40
124
3: 25
z-: 52 27 16
16 554
184
E 222
16
5:
;"6 143
71 77
8
53 25
84 16
5 2
E 38 40
INJURY INDEX NONE MINOR SERIOUS FATAL
42 4
10 6
11 48
: 8 7
10 14
9 14
1 2
11
1 1 1
:
; 2
VISIBILITY ZERO l/4 MILE
62 43
c;
43;
E 2
14 44 14 18
1 1
93 16
z
l/2 MILE 3/4 MILE 1 MILE 2 MILES 3 MILES OVER 4 MILES
COND. OF LIGHT NIGHT DAY DUSK & DAWN
160 53 11
20 23
3
294 ) 39 223 ~ 41
40 / 38
17 20
4
36 1
8 4
61 19
OBSTRUCT. TO VIS. FOG NONE
TERRAIN MOUNTAINS HILLY ROLLING LEVEL DENSE W/TREES
BELOW MINS
191 12
12 23 24
:;
60
13 1
2 1 2 2 1
ti 42 20
2 4': 86 23
6

TABLE 9 SPIFR LANDING ACCIDENTS AND RATIOS RELATING TO
TO PHASE OF INSTRUMENT APPROACH
PHASE OF FINAL INITIAL MISSED PATTRN LEVEL ROLL FINAL GO-RND OTHER TOTAL FLIGHT IFR IFR APPR CIRC TCHDWN VFR VFR
TOTALS 1964-1975" 139 59 20 7 59 27 16 7 335 1964-1979 224 75 41 16 107 46 26 : 14 554
PROPORTION OC- CURRED 1964-79 -38 .21 -51 956 .45 .41 -38 .80 l 50 -39
NIGHT/DAY 1964-1975 3.30 1.20 .42 -75 -36 6.50 1.00 0.00 2.00 1.40
m 1964-1979 3.00 1 .oo .85 -78 -38 -87 1.40 4.00 3*30 1.30
A I
NOTE: Data extracted from original NASA SPIFR study (reference A)

TABLE 10 ACCIDENTS IN TERMS OF TYPE OF APPROACH EXECUTED
AND SELECTED MISSION VARIABLES SPIFR LANDING
-f PRECISION I NON-PRECISION 1
STRAIGHT-IN IICIRCLING I STRAIGHT-IN CIRCLING
? A- l-
PAR hLS ILS (ILS I DNLY'/ASR ONLYi/ASR
ILS hOR 0NLY:ONL
IOR 'DMI
IDB INL!
.oc r1.S ' OTH )NLI - -
~LNK /TOT % '6-71
16 +- 104 5 ] 6 75 --
--r---l '
12 -
3 2
:
31 -
ii 3
17
10 I
6) 36 TOTAL
INJURY INDEX NONE MINOR SERIOUS FATAL
15
5" 22
9 6 2
19
75 13 14 .l 9
la4
2 222
2 21 6
10 28 a
I7 17 14
5 2 2 1
2: : , ;; 34 j 45
VISIBILITY ZERO l/4 MILE l/2 MILE 3/4 MILE 1 MILE 2 MILES 3 MILES OVER 4 MILES
I
2 1
2 2 2 1
1
: 3 1
7 3 1
12 2
1 4 1
1 : 1
1
1 1
I 'I 2 2 i :
2 4 2 : 1
15
' a8 13 i 11
5 13 '13 22
1 12 20
A-
10 1 : 9
i !l
1: 1 I :: : / 1
1 ! ',
12 6
I 3 1 20 11
1 ! 10 11
:
; 9
15 11
3
2
6'
: 12
53
I-
i ,-
1
I-
2, 41 3' 31 1' 3 1
COND. OF LIGHT NIGHT DAY DUSK/DAWN
294 223
37
39
::
3 1 1
23 7 1
2 1
-
7 1
-
1
9
22 23
3
40 65 2 17 28
~ 2 11
2 42 85 a, 11
16 10 22
1 1 :i f :
1 3; :8" 7 12
16 8 5
: 5
7 I: 4
J-
OBS. TO VISION FOG NONE
4
-
1 4
13 ‘0 2 1
2 1
; 2
9 :
i
i : 3 3 1 1 2
:
1 67 26 -
3 12
do” 1 1 7'
3 4 24
2
t
19 l5
1
s 1 2
9 1
-
:
2
25 1 -
53 6
17
34 1
:: 4”:
TERRAIN MOUNTAINS HILLY/ROLLING LEVEL OTHERS
83 2:
PHASE OF LANDIN INITIAL FINAL IFR LEVELOFF TRAFFIC PTRN MISSED APP. ROLL OTHER
7 17
3
:
1
2:
55 2 2 7
11 10 42
5 9
26 18
75 !24 107
16
2 45

TABLE 11 SPIFR LANDING ACCIDENTS AND ACCIDENT RATES
IN TERMS OF PILOT'S TOTAL TIME
, TOTAL
FLIGHT HRS 200-399 400-599 600-999 lK-1.9K 2K-2.9K 3K-4.9K 5K-9.9K IO-15K >15K TOTAL
NO. OF ACCIDENTS 1964-1979 35 40 57 113 82 94 77 34 20 552
NO. OF ACCIDENTS 1976-1979 18 16 22 53 31 31 28 13 6 218
CL' b PERCENT OCCURRED
1976-1975 -51 .40 039 l 47 -38 -33 -36 -38 l 30 -39
IFR RATED PILOTS AS OF 12/31/79 15852 23303 34400 49460 30437 32927 38522 12682 11255 248838
j;;E:":::,,"4:,, 1 .074 1 .034 / .021 1 .015 .Oll .007 J -003 1 -002 1 -001 1;
NOTE: 7769 Pilots not categorized to accomodate non-respondents and those with less than 200 hours.

TABLE 12 SPIFR LANDING ACCIDENTS AND ACCIDENT RATES IN TERMS OF PILOT'S ACTUAL INSTRUMENT TIME
* ACTUAL I INST. HRS 01-29 30-59 60-99 100-199 200-299 300-599 >599 TOTAL
NO. OF ACCIDENTS 1964-1979 70 36 37 71 54 51 52 371
NO. OF ACCIDENTS 1976-1979 26 16 19 25 18 19 15 138
1 PERCENT OCCURRED F9i'6-1979 -37 .44 .53 -35 .33 .37 l 29 l 37
IFR RATED PILOTS AS OF 12/31/79 57704 43118 13000 41535 24732 31071 21718 232878
ACCIDENT RATE (PER 10000 HRS) .809 .I88 .358 .I14 .088 -037 .028
NOTE: 23779 Pilots not categorized to accomodate non-respondents.

TABLE 13 SPIFR LANDING ACCIDENTS AND ACCIDENT RATES IN TERMS OF PILOT TIME IN THE PAST 90 DAYS
NO. OF ACCIDENTS 1976-1979
O-24 25-49 50-99 100-149 150-199 200-299 >300 TOTAL
73 95 112 65 I I 38 48 16 447
34 46 48 22 16 18 4 188
!i PERCENT OCCURRED 1976-1979 -47 .48
I I
IFR RATED PILOTS AS OF 12/31/79 68320 58334 52627 26314 / 19814 1 17595 1 2853 1 245878
ACCIDENT RATE (PER 10000 HRS) -85 l 43 029
-43 l 34 .42 037 -25 .42
.20 / .ll 1 l ll 1 014 1
NOTE: 10779 Pilots not categorized to accomodate non-respondents.

TABLE 14 SPIFR LANDING ACCIDENTS IN TERMS OF
PILOT'S TIME IN TYPE OF AIRCRAFT
I
TIME IN TYPE (HRS) O-19 20-49 50-99 100-299 300-600 >600 ' TOTAL
NO. OF ACCIDENTS 1964-1979 29 51 49 122 103 137 491
NO. OF ACCIDENTS 1976-1979 9 19 22 55 32 58 195
PERCENT OCCURRED 1976-1979 031 -37 -45 045 031 .42
1.
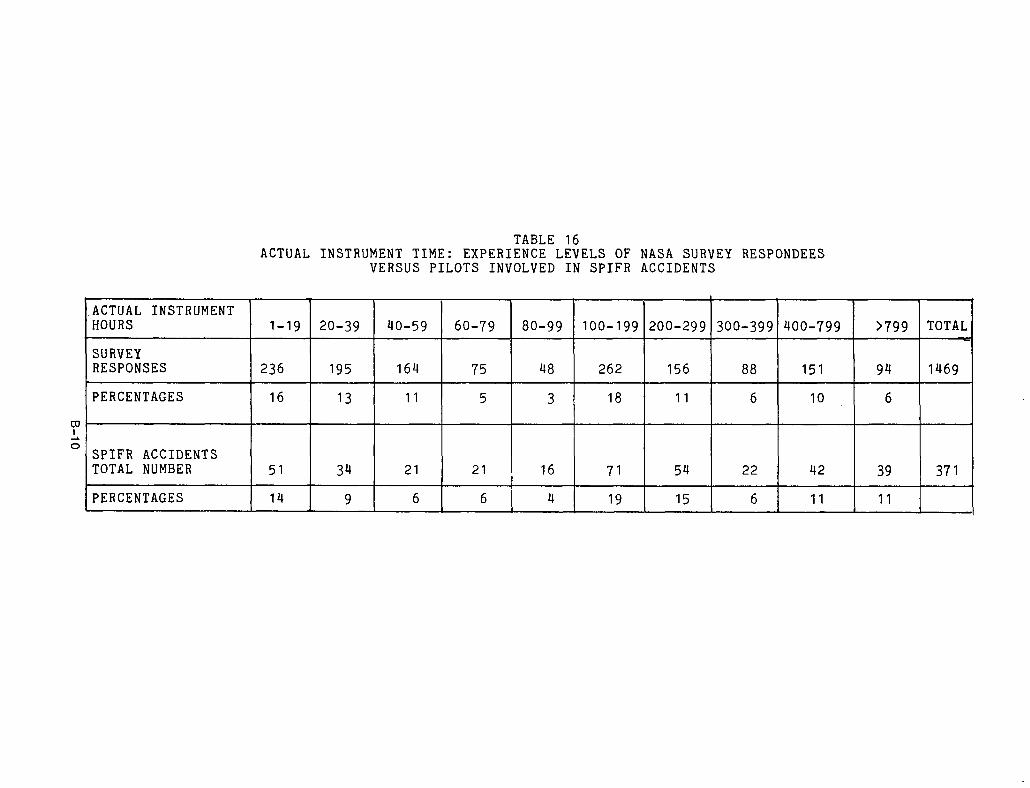
TABLE 16 ACTUAL INSTRUMENT TIME: EXPERIENCE LEVELS OF NASA SURVEY RESPONDEES
VERSUS PILOTS INVOLVED IN SPIFR ACCIDENTS
ACTUAL INSTRUMENT HOURS I-19 m-39 40-59 60-79 80-99 loo-199 200-299 3oo-399 400-799 >799 TOTAL
SURVEY RESPONSES 236 195 164 75 48 262 156 88 151 94 1469
PERCENTAGES 16 13 11 5 3 18 11 6 10 6
SPIFR ACCIDENTS TOTAL NUMBER 51 34 21 21 16 71 54 22 42 39 371
PERCENTAGES 14 9 6 6 4 19 15 6 11 11 I

TABLE 18 SIMULATED INSTRUMENT TIME: EXPERIENCE LEVELS OF NASA SURVEY RESPONDEES
VERSUS PILOTS INVOLVED IN SPIFR ACCIDENTS
SIMULATED INSTRUMENT I HOURS l-19 20-39 40-59 60-79 80-99 loo-199 200-299 300-399 400-799 >799 ; TOTAL
SURVEY RESPONSES 63 155 328 232 93 284 116 55 66 47 1439
PERCENTAGES 4 11 23 16 7 20 8 4 5 3
Y 2
SPIFR ACCIDENTS TOTAL NUMBER 26 35 80 59 34 36 10 4 7 3 294
I PERCENTAGES 9 12 27 20 12 12 3 1 2 1
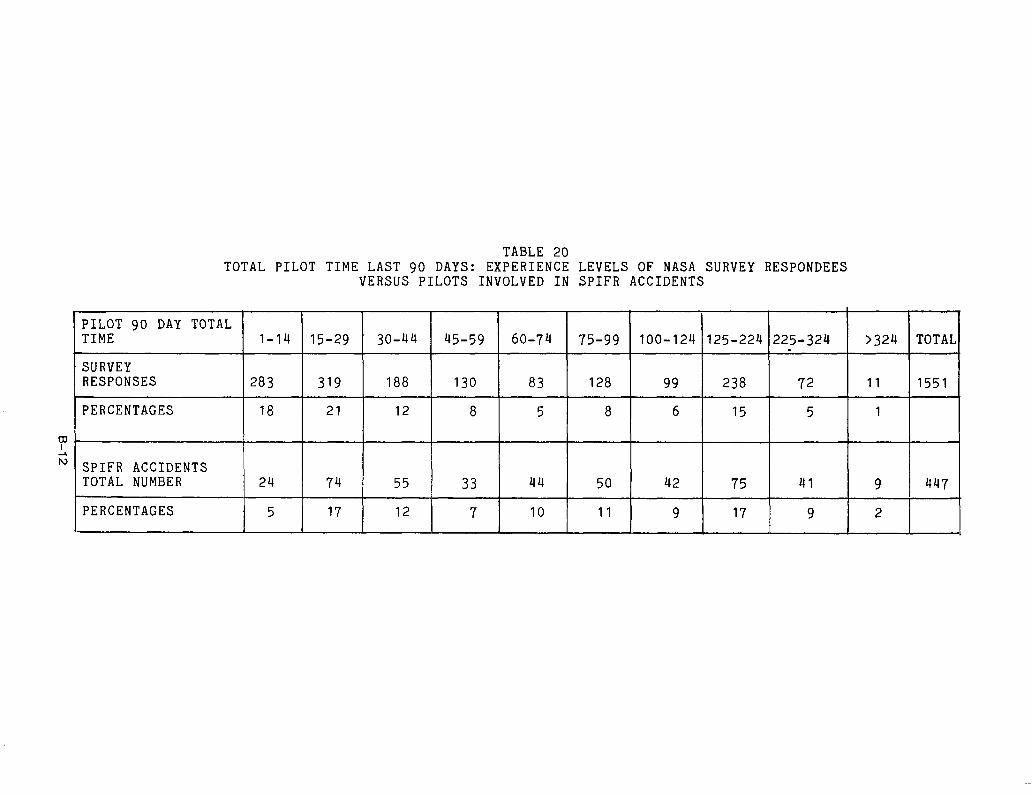
TABLE 20 TOTAL PILOT TIME LAST 90 DAYS: EXPERIENCE LEVELS OF NASA SURVEY RESPONDEES
VERSUS PILOTS INVOLVED IN SPIFR ACCIDENTS
PILOT 90 DAY TOTAL TIME 1-14 15-29 30-44 45-59 60-74 75-99 loo-124 125-224 225-324 >324 TOTAL
SURVEY RESPONSES 283 319 188 130 83 128 99 238 72 11 1551
PERCENTAGES 18 21 12 I
8 5 8 6 I
15 5 1
7 2 r" SPIFR ACCIDENTS
TOTAL NUMBER 24 74 55 33 44 50 42 75 41 9 447
I PERCENTAGES 5 17 12 7 10 11 9 17 9 2 I
I

TABLE 22 TOTAL PILOT TIME: EXPERIENCE LEVELS OF NASA SURVEY RESPONDEES
VERSUS PILOTS INVOLVED IN SPIFR ACCIDENTS
I
PILOT TOTAL 49;
500- ; IK- 4K- 6K- 7.9K l;:;K
12K- >15.9K TOTAL TIME 999 1.4K 5.9K 15.9K
SURVEY RESPONSES 180 292 161 151 329 147 113 87 63 55 1578
PERCENTAGES 11 19 10 10 21 9 7 6 4 4
P 2
SPIFR ACCIDENTS TOTAL NUMBER 53 77 63 47 144 66 32 30 20 17 549
PERCENTAGES 10 14 12 9 26 12 6 5 4 3
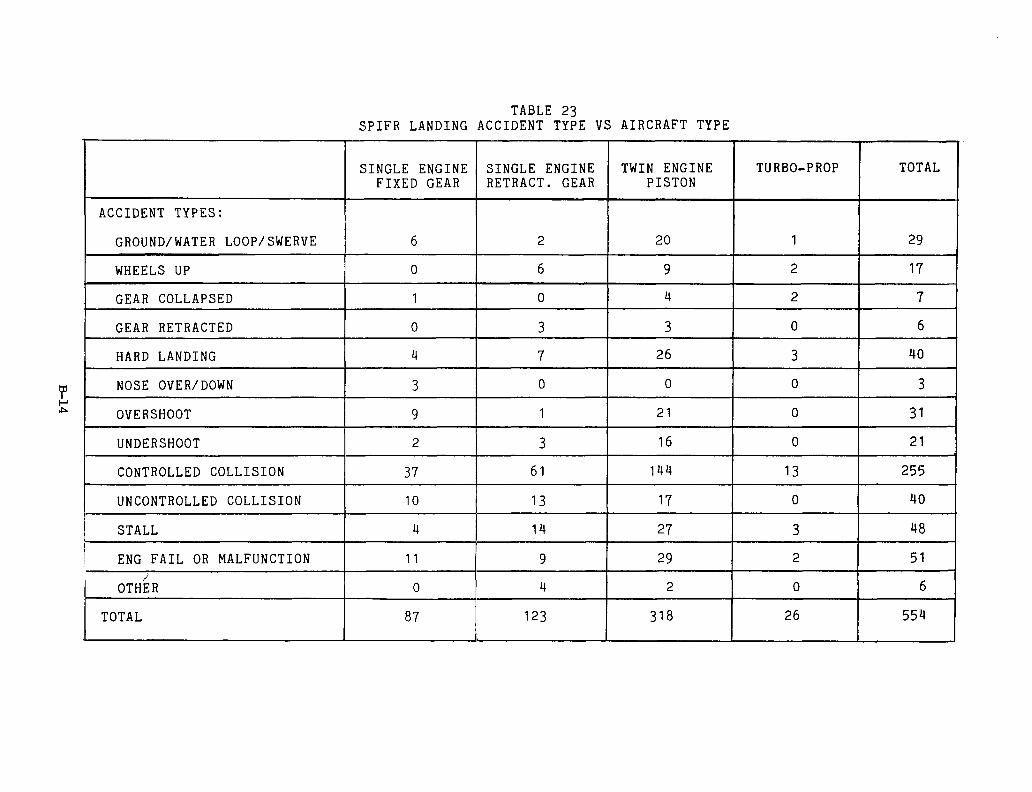
TABLE 23 SPIFR LANDING ACCIDENT TYPE VS AIRCRAFT TYPE
I
SINGLE ENGINE SINGLE ENGINE TWIN ENGINE TURBO-PROP TOTAL FIXED GEAR RETRACT. GEAR PISTON
ACCIDENT TYPES:
GROUND/WATER LOOP/SWERVE 6 2 20 1 29
WHEELS UP 0 6 9 2 17
GEAR COLLAPSED 1 0 4 2 7
GEAR RETRACTED 0 3 3 0 6
HARD LANDING 4 7 26 3 40
Y NOSE OVER/DOWN 3 0 0 0 3
E OVERSHOOT 9 1 21 0 31
UNDERSHOOT 2 3 16 0 21 I
CONTROLLED COLLISION 37 61 144 13 255
UNCONTROLLED COLLISION 10 13 17 0 40
STALL 4 14 27 3 48
ENG FAIL OR MALFUNCTION 11 9 29 2 51
OTHER 0 4 2 0 6
TOTAL 87 123 318 26 554 I

TABLE 26 SPIFR LANDING ACCIDENT TYPE VS SINGLE OR DUAL PILOTED
TOTAL ACCIDENTS SINGLE PILOT
ACCIDENT TYPES:
I I
GROUND/WATER LOOP/SWERVE j
I WHEELS UP
I GEAR COLLAPSED I 7 I 3 I
1 i 2 I
GEAR RETRACTED 6 0
HARD LANDING 40 14 P E NOSE OVER/DOWN 3 2
OVERSHOOT 31 12 -
UNDERSHOOT 21 13
I CONTROLLED COLLISION 255 74
UNCONTROLLED COLLISION 40 9 7 5
48 17 9 10
ENG FAIL OR MALFUNCTION 51 12 9 7
OTHER 6 3 1 1
TOTAL 554 179 - 1

TABLE 31 SINGLE PILOT LANDING PHASE ACCIDENT RATES IN TERMS OF
ACCIDENTS PER 1000 INSTRUMENT APPROACHES FLOWN
ACCIDENTS APPROACHES ACCIDENT RATE
YEAR: TOTAL DAY NIGHT TOTAL DAY NIGHT TOTAL DAY NIGHT
1964 9 2 7 148760 129373 19387 .061 .015 .361
1965 9 2 7 190910 166030 24880 .047 .012 .281
1966 16 7 9 235135 204492 30643 .068 .034 .294
1967 17 6 11 28290 1 246033 36868 ,060 .024 .298
1968 15 8 7 339266 295053 44213 .044 .027 -158
1969 27 12 15 423288 368125 55163 .064 DO33 .272 I I
1970 34 17 17 439212 382061 57251 .077 .044 -297 '
1971 29 16 13 458095 399699 58396 .063 .041 ,223
. 1972 49 19 30 572669 499599 73070 .086 -039 .411
1973 35 13 22 625880 544419 81461 .056 .024 .270
1974 36 17 19 666440 579740 86700 .054 .029 .219
1975 40 17 23 695592 604861 90731 -058 .028 -253
1976 31 16 15 635921 553049 82872 .049 .029 .181 -
1977 47 20 27 725730 631318 94412 .065 ,031 .286
1978 56 19 37 908117 789015 119102 .062 .024 .311
1979 72 37 35 1023700 889576 134124 .070 .042 .261
TOTAL 522 228 294 8371716 7282443 1089273 .062 .031 .270 1
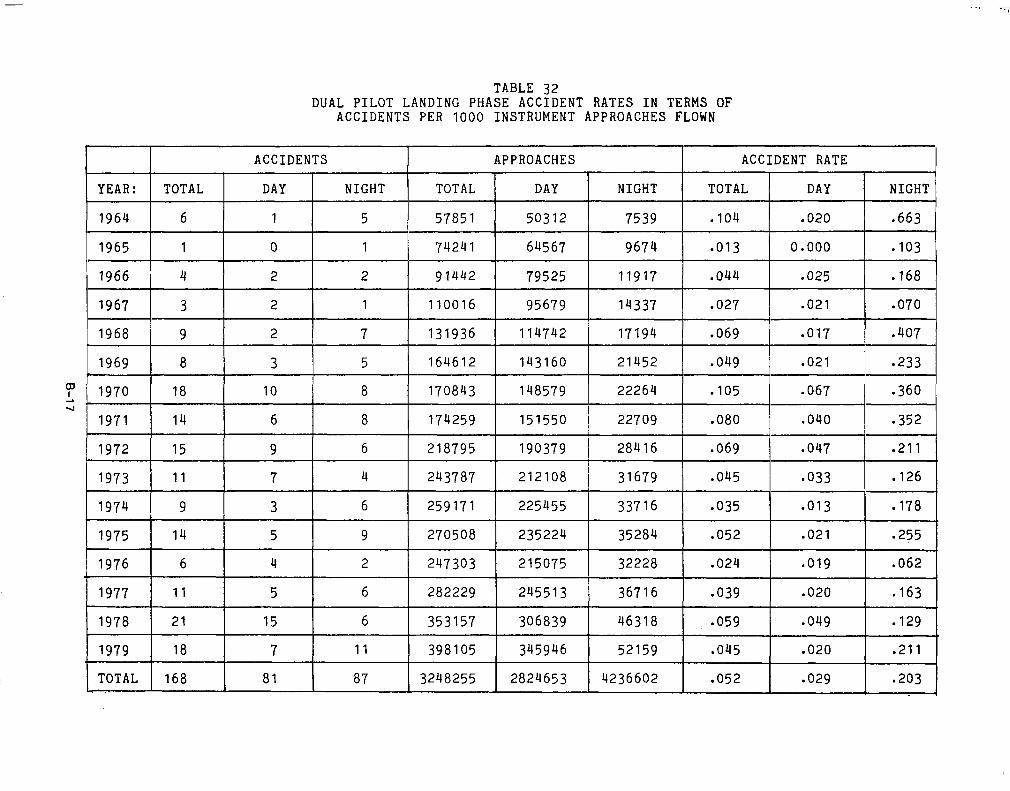
TABLE 32 DUAL PILOT LANDING PHASE ACCIDENT RATES IN TERMS OF
ACCIDENTS PER 1000 INSTRUMENT APPROACHES FLOWN
ACCIDENTS
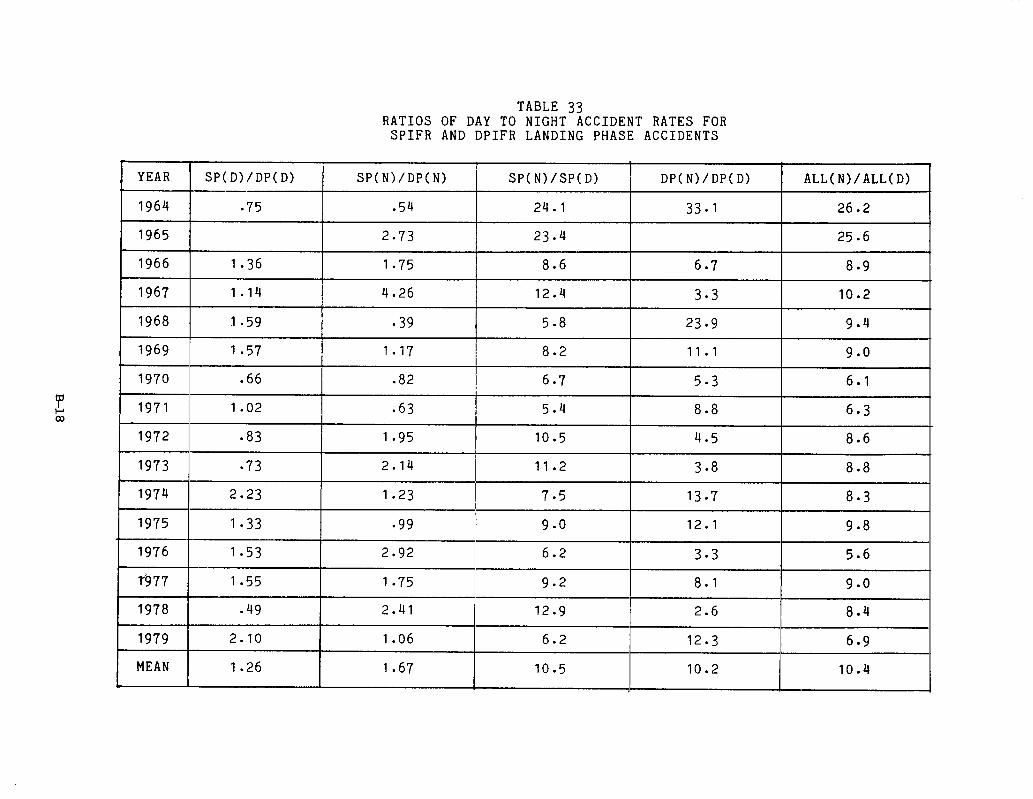
TABLE 33 RATIOS OF DAY TO NIGHT ACCIDENT RATES FOR
SPIFR AND DPIFR LANDING PHASE ACCIDENTS
YEAR SP(D)/DP(D) SP(N)/DP(N) SP(N)/SP(D) DP(N)/DP(D) ALL(N)/ALL(D) -
1964 .75 054 24.1 33.1 26.2
1965 2.73 23.4 25.6
1966 1.36 1.75 8.6 6.7 8.9
1967 1.14 4.26 12.4 3.3 10.2
1968 1 I .59 -39 5.8 23.9 9*4
1969 ~ 1.57 1.17 8.2 11.1 9.0
1970 .66 .82 6.7 5.3 6.1
r 1971 1.02 -63 5.4 8.8 co
6-3
1972 -83 1.95 10.5 4.5 8.6
1973 11 -73 2.14 I 1.1.2 3.8 I 8.8
1974 2.23 1.23 7.5 13.7 8.3
1975 I-33 -99 9.0 12.1 9-8
1976 1.53 2.92 I 6.2 3*3 5.6
f977 1.55 1.75 9.2 8.1 9.0
1978 .49 2.41 12.9 2.6 8.4 1979 2.10 1.06 6.2 12.3 6.9
MEAN 1.26 1.67 10.5 10.2 10.4 *

z W
TABLE 34 SUMMARY OF REGRESSION LINE SLOPES AND R-SQUARED VALUES FOR
DAY AND NIGHT ACCIDENT RATES IN TERMS OF 1000 APPROACHES
ALL YEARS 1964-1975
SLOPE R-SQUARED 1 SLOPE 1 I
SPIFR DAY ACCIDENTS PER 1000 APPROACHES .OOl i . 147 ( .OOl , f SPIFR NIGHT ACCIDENTS PER 1000 APPROACHES -.025 0037 I -.004 / , .050 ,026 0350 I DPIFR DAY ACCIDENTS PER 1000 APPROACHES .OOl .030 .003 .070 ,002 .ogo
DPIFR NIGHT ACCIDENTS PER 1000 APPROACHES -.013 . 159 -.012 .070 .041 ,720

TABLE 35 NUMBER OF TOTAL NIGHT ACCIDENTS IN TERMS OF
PILOT'S TOTAL FLIGHT HOURS
PILOT TOTAL 200- 400- 600- IK- 2K- FLIGHT HOURS 399 599 999 l.gK 2.9K
NIGHT ACCIDENTS 1969-1975 1 11 9 13 23 29
NIGHT ACCIDENTS 1976-1979 1 5 13 22 33 18
OTHER (DAY/DAWN/; DUSK) ACCIDENTS 1
-;'R;;;;OCCURRED'[y[ 1; / 1; 1 1; j 1; 1 1;
?,K ;",, I;!;, >15K TOTAL
32 23 11 6 158
18 14 6 4 134
45 40 17 10 265
52 48 50 50 ’ 52 /

TABLE 36 UNCONTROLLED COLLISIONS WITH GROUND/WATER IN TERMS
OF VERTIGO AND ICING AS PRIMARY CAUSE FACTORS
DPIFR LANDING PHASE 9 3 4 16
SPIFR ENROUTE PHASE 30 11 21 62
TOTAL 65 37 43 145

TABLE 37 VERTIGO INDUCED UNCONTROLLED COLLISIONS
WITH GROUND/WATER CONDITION OF LIGHT VS. VARIOUS PHASES
DAY DUSK/DAWN
I NO. PERCENT I NO. PERCENT I
SPIFR LANDING PHASE I I 5.0 19.2 / 19.0 / 73.1
DPIFR LANDING PHASE 6.0 40.0 9.0 60.0
SPIFR ENROUTE PHASE 17.0 58.6 10.0 34.5
TOTAL 28.0 40.0 38.0 54.3
PERCENT
‘1 2.0 I 6*9
4.0 I
TOTAL
26.0
15.0
29.0
70.0

I
I
z W
TABLE 38 SPIFR VERTIGO INDUCED UNCONTROLLED COLLISIONS
WITH GROUND/WATER CONDITION OF LIGHT VS. ACTUAL INSTRUMENT TIME
* ACTUAL INSTR. TIME 0-g 10-19 20-39 40-59 60-99 100-199 200-299 300-499
LANDING PHASE DAY 1 1 0 0 1 2 0 0 0 0
NIGHT 4 2 2 2 0 0 3 0 1 5
ENROUTE PHASE DAY 2 1 1 1 0 3 0 2 1 6
NIGHT 0 2 2 1 0 1 0 0 0 4 F

TABLE 39 SPIFR VERTIGO INDUCED UNCONTROLLED COLLISIONS
WITH GROUND/WATER CONDITION OF LIGHT VS. TIME IN TYPE
TOTAL TIME IN TYPE O-49 50-74 75-100 101-199 200-299 300-499 500-999 >lOOO
LANDING PHASE DAY 0 2 0 7 1 1 0 0
NIGHT 1 3 0 1 0 1 0 5
ENROUTE PHASE DAY 2 2 1
NIGHT 4 0 0

-r .- ,-.-‘-
TABLE 40 SPIFR VERTIGO INDUCED UNCONTROLLED COLLISIONS
WITH GROUND/WATER CONDITION OF LIGHT VS. TOTAL HOURS
/ TOTAL TIME I-199 / 200-399 400-599 600-999 I-1.9K 2-2.9K >3..OK
LANDING PHASE I DAY 0 1 0 1 2 1 1
NIGHT 0 1 3 2 5 5 2
ENROUTE PHASE DAY 0 0 2 5 3 2 4
NIGHT 1 0 2 3 1 1 1

TABLE 41 SPIFR VERTIGO INDUCED UNCONTROLLED COLLISIONS
WITH GROUND/WATER NIGHT ACCIDENTS VS. TOTAL NIGHT TIME
-r TOTAL NIGHT TIME l-19 20-39 40-59 60-99 100-199 200-299 300-399 >400
LANDING PHASE 2 3 0 2 4 0 3 2
ENROUTE PHASE 0 3 1 1 0 0 1 0
TOTAL- 2 6 1 3 4 0 4 2

TABLE 42 SPIFR VERTIGO INDUCED UNCONTROLLED COLLISIONS WITH GROUND/WATER
STATISTICAL PROFILES
GA SURVEY RESPONSE PROFILE
MEAN STD. DEVIATION MEDIAN
SPIFR TOTAL ACCIDENT PROFILE
MEAN STD. DEVIATION MEDIAN
SPIFR LANDING PHASE VERTIGO
MEAN STD. DEVIATION MEDIAN SAMPLE SIZE
SPIFR ENROUTE PHASE VERTIGO
MEAN STD. DEVIATION MEDIAN SAMPLE SIZE
TOTAL TIME LAST ! ACTUAL I SIMULATED HOURS 90 DAYS < INSTRUMENT : INSTRUMENT
, /
3814 98 I 245 166 4961 119 / 449 280 I 2051 57 I II 150 75
3868 2
I 320 95 4457 499 164 2394 71 I 150 61
I
2582 73 189 101 3405 73 430 116 1399 53 48 66
26 20 20 16
2802 59 128 63
4282 51 230 gi; 38 19 48 19
z: 17

TABLE 43 SPIFR ICING INDUCED UNCONTROLLED COLLISIONS WITH GROUND/WATER
STATISTICAL PROFILES
I
TOTAL TIME LAST ACTUAL SIMULATED HOURS 90 DAYS INSTRUMENT INSTRUMENT
GA SURVEY RESPONSE PROFILE
MEAN 3814 98 245 166 STD. DEVIATION 4961 119 449 280 MEDIAN 2051 57 150 75
SPIFR TOTAL ACCIDENT PROFILE
Y MEAN 3868 98: 320 95
E STD. DEVIATION
4457 499 164
MEDIAN 2394 71 150 61
SPIFR LANDING PHASE ICING
MEAN 2413 79 168 70 STD. DEVIATION 2332 69 204 62 MEDIAN 1672 65 114 62 SAMPLE SIZE 22 17 13 8
1 SPIFR ENROUTE i PHASE ICING I
1 MEAN 2229 265 67 I STD. DEVIATION 2240
MEDIAN :
;i 223
1367 : 27 219 1 SAMPLE SIZE j 11 7 6

-
TABLE 44 SPIFR UNCONTROLLED COLLISIONS WITH GROUND/WATER IN THE
LANDING PHASE IN TERMS OF PILOT EXPERIENCE
1
~ HOURS o-49 50-99 100-199 2'0-299 >500 UNK
TIME IN TYPE ICING 3 0 2 0 VERTIGO 1 1 1 1 :
--- ACTUAL INST HOURS
ICING 5 4 1 0 1 10 VERTIGO 10 2 0 1 1 5
NIGHT HOURS ICING 1 0 0 1 17 VERTIGO 2 ; 1 1 1 5
TOTAL HOURS ** ICING VERTIGO 2
6 4 6 0 0 4 1 5 7 5 2 0 3 0
1
**Total hours is in IO's of hours.

TABLE 45 SPIFR CONTROLLED COLLISIONS - MEDIANS
SPIFR DPIFR DAY I NIGHT DAY I NIGHT
CEILING HEIGHT 500 300 400 300 I I I
VISIBILITY
ACTUAL INSTRUMENT HOURS I 191.5 208.5 I SIM. INSTRUMENT HOURS 59 59 105 72
TOTAL NIGHT HOURS 403 300 635 703
I TIME LAST 24 HOURS 2 2
TIME LAST 90 DAYS 116.0 I TOTAL FLIGHT HOURS 3800 I TIME IN TYPE 250
PROXIMITY TO AIRPORT 2.00

TABLE 46 SPIFR NIGHT CONTROLLED COLLISIONS DURING
LANDING PHASE FOR 1976-1979
1976 1977
NIGHT APPROACHES FLOWN 82872 94412 11g102
NIGHT CONTROLLED COLISIONS 6 12 21 23 16
RATE PER 1000 APPROACHES .072 .I27 . 176 .I71 . 144
OVERALL NIGHT ACCIDENT m RATE/l000 APPROACHES . 181 ,286 .311 .261 l 259 242 -L CONTROLLED COLLISION
RATE/NIGHT RATE -398 .444 .566 -655 0556

TABLE 47 SPIFR NIGHT CONTROLLED COLLISIONS, LANDING PHASE
CAUSE FACTOR COMPARISON
4
WEATHER BELOW MINIMUMS FATAL ACCIDENTS ALL ACCIDENTS CAUSE FACTOR: 1964-1975 1976-1979 1964-1975 1976-1979 1964-1975 1976-1979
1 IMPROPER IFR PROC. 5 5 9 19 16 29
2 AIRCRAFT ICING 0 0 3 2 9 6
3 DISTRACTED/DIVERTED ATTN 0 0 1 0 7 0
4 SUSPECT MISREAD INST. 2 1 4 0 9 1
5 FAULTY INSTRUMENT 3 1 2 5 9 7
7 iz 6 DESCENDED BELOW MINS 20 1 21 0 44 4 -
7 MISJUDGED ALTITUDE I 0 0 1 2 5 2
8 A/C NOT PROPERLY EQUIPPED 1 1 0 1 2 1
9 DIDN'T FLY PUB APPROACH 0 1 :5 3 5 4
10 PILOT EXCEEDED CAPABIL. 0 1 i 2 2
11 PILOT INCAPACITATED 0 0 2 1
; 12 VERTIGO 0 0 1 1
TOTAL 31 11 51 36
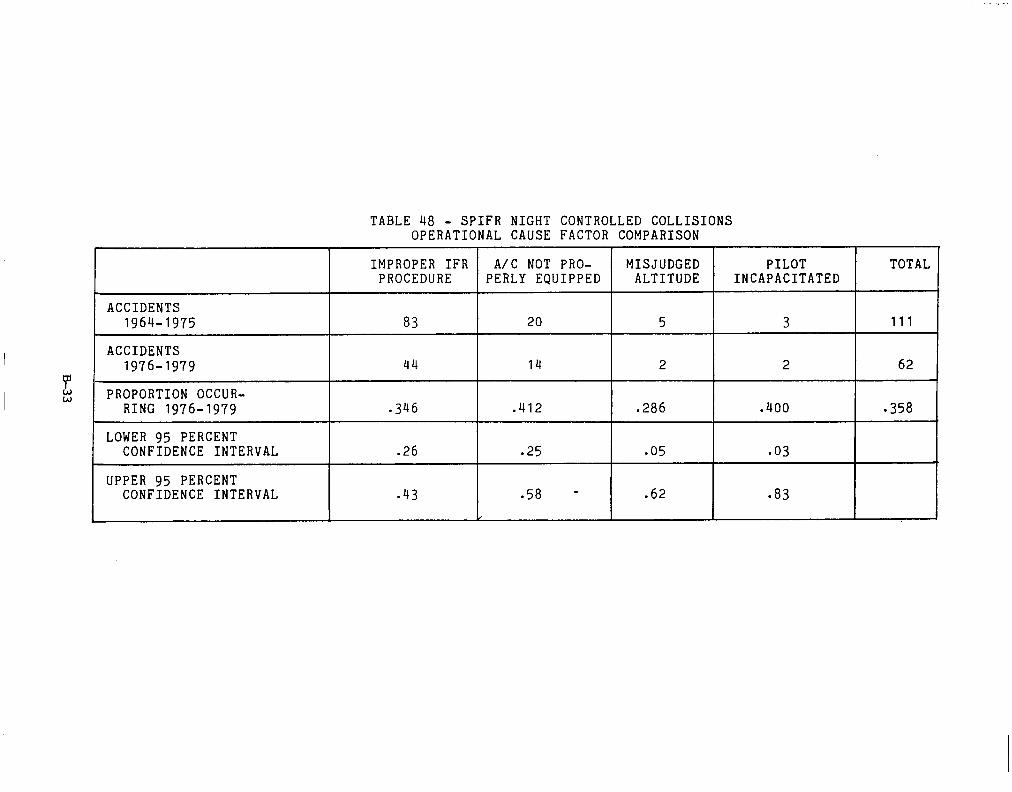
TABLE 48 - SPIFR NIGHT CONTRO OPERATIONAL CAUSE FACTOR
ACCIDENTS 1964-1975
IMPROPER IFR A/C NOT PRO- PROCEDURE PERLY EQUIPPED
83 20
ACCIDENTS 1976-1979 44 14
Y ti PROPORTION OCCUR-
RING 1976-1979 .346 ,412
LOWER 95 PERCENT CONFIDENCE INTERVAL .26 .25
UPPER 95 PERCENT CONFIDENCE INTERVAL .43 .58 -
aLED COLLISIONS COMPARISON
I MISJUDGED PILOT TOTAL
ALTITUDE INCAPACITATED
5 3 111
2 2 62
.286 -358
005 l 03
.62 083
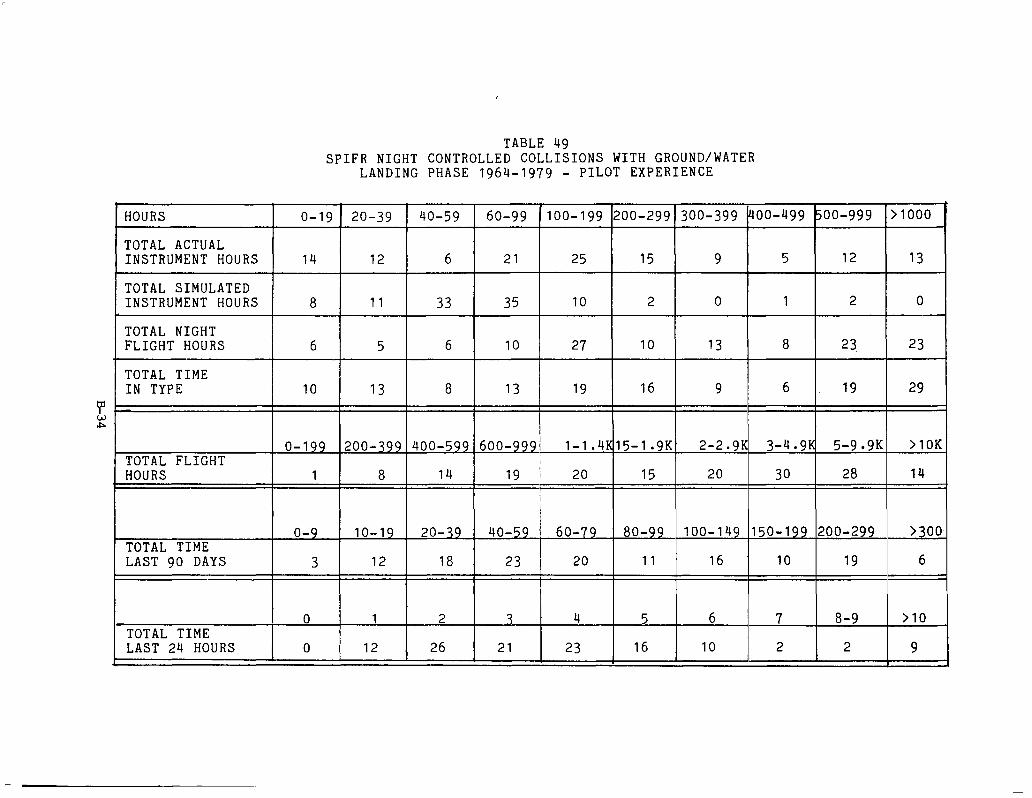
TABLE 49 SPIFR NIGHT CONTROLLED COLLIiIONS WITH GROUND/WATER
LANDING PHASE 1964-1979 - PILOT EXPERIENCE
I +
HOURS O-19 20-39 40-59 60-99 100-199 200-299 300-399 400-499 500-999 >1000
TOTAL ACTUAL INSTRUMENT HOURS 14 12 6 21 25 15 9 5 12 13
TOTAL SIMULATED INSTRUMENT HOURS 8 11 33 35 10 2 0 1 2 0
TOTAL NIGHT FLIGHT HOURS 6 5 6 10 27 10 13 8 23 23
TOTAL TIME IN TYPE 10 13 8 13 19 16 9 6 19 29
E bP

TABLE 50 - SPIFR DAY CONTROLLED COLLISIONS WITH GROUND/WATER LANDING PHASE 1964-1979
LAST 90 DAYS
LAST 24 HOURS

TABLE 51 COMPARISON OF DAY AND NIGHT CONTROLLED COLLISIONS (C/C>
IN PERCENTAGES OF ACCIDENTS BY EXPERIENCE LEVEL.
o-99 100-199 200-299 300-399 400-499 500-999 >I000 ACCDNTS
ACTUAL INST HOURS NIGHT C/C .40 l ‘9 11 DAY C/C .38 .I2 :17
.07 .04 -09 .I0 132.00 -09 .09 .07 007 42.00
SIMULATED INST HOURS NIGHT C/C -85 10
:15 .02 0.00 .Ol .02 0.00 102.00
DAY C/C -73 -03 .06 .03 0.00 0.00 33.00
TIME IN TYPE NIGHT C/C l 31 -13 .I1 .06 .04 -13 .20 142.00 DAY C/C .I9 .I7 ~ .I1 l 09 .06 .I7 .21 I 1 53.00
L
o- 200- 400- 600- l.OK- 1.5K- 2.OK- 3.OK- 5.OK- TOTAL ; 199 399 599 999 1.4K 1.9K 2.9K 4.9K 9.9K >lOK ACCDNTS
TOTAL HOURS NIGHT C/C .Ol 005 .08 11 12 .09 12 18 l 17 .08 DAY C/C 0.00 0.00 009 :05 :09 .05 :17 :17 .24 . 12
169.00 66.00
1
TIME LAST 90 DAYS NIGHT C/C D/AY C/C
TIME LAST 24 HOURS NIGHT C/C DAY C/C
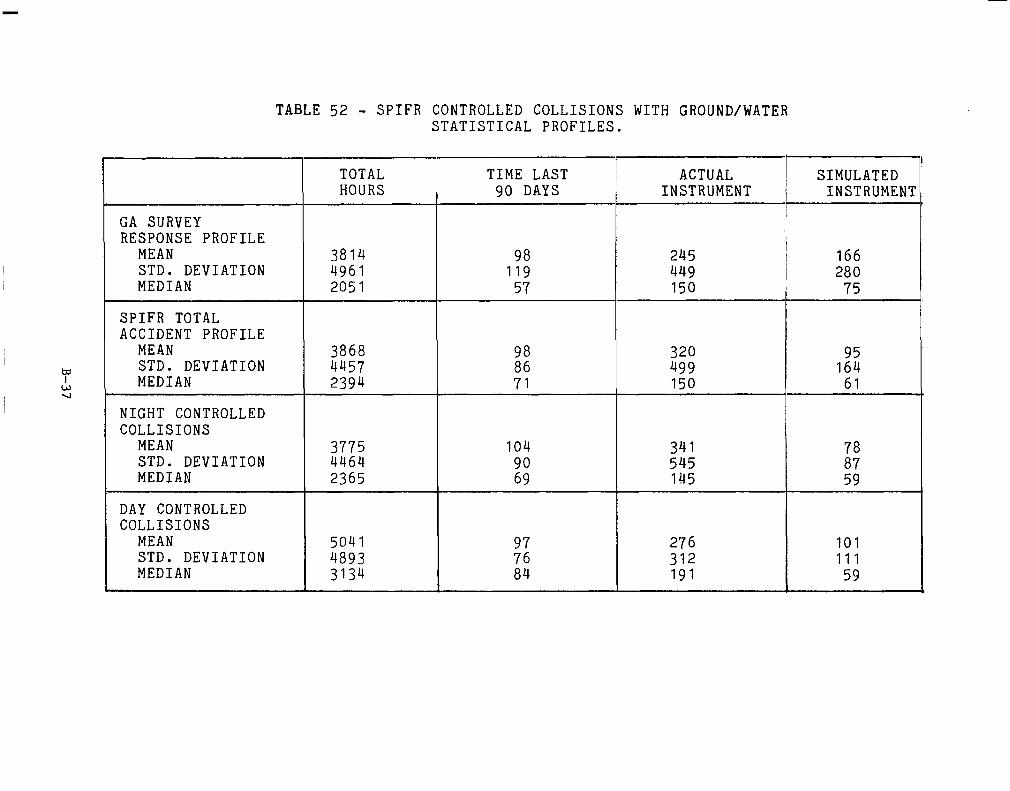
TABLE 52 - SPIFR CONTROLLED COLLISIONS WITH GROUND/WATER STATISTICAL PROFILES.
TOTAL HOURS
GA SURVEY RESPONSE PROFILE
MEAN STD. DEVIATION MEDIAN
3814 98 4961 1'9 2051 57
SPIFR TOTAL ACCIDENT PROFILE
MEAN 3868
5" STD. DEVIATION 4457
w MEDIAN 2394
NIGHT CONTROLLED COLLISIONS
MEAN 3775 STD. DEVIATION 4464 MEDIAN 2365
DAY CONTROLLED COLLISIONS
MEAN STD. DEVIATION MEDIAN
5041 4893 3134
I L
TIME LAST ! ACTUAL SIMULATED ~ 90 DAYS INSTRUMENT INSTRUMENT
245 449 150
166 ~/ 280 ~ II I/ 75
;: 71
320 499 150
1:: 61
104 341 90 545 69 145
2 276 312 101 111 a4 '91 59

TABLE 53 - SPIFR SIMULATED INSTRUMENT HOURS VS TYPE OF AIRCRAFT (CONTROLLED COLLISIONS DAY AND NIGHT).
SIMULATED INSTRUMENT TIME O-19 20-39 40-59 60-99 loo-199 200-299 300-399 400-499 >500 TOTAL
SINGLE ENGINE FIXED GEAR 2 2 8 6 0 0 1 0 0 19
SINGLE ENGINE RETRACTABLE GEAR
4 3 14 14 2 2 0 0 0 39
TWIN ENGINE PISTON
TURBO-PROP
TOTAL PERCENTAGE

TABLE 55 - CONTROLLED COLLISIONS: DAY/NIGHT SINGLE VERSUS TWIN ENGINE AIRCRAFT BY TIME IN TYPE
HOURS O-19 20-39 40-59 60-99 loo-199 200-299 300-399 400-499 500-999 >lOOO REPORTED
DAYTIME SINGLE ENGINE ; 0.00 .I1 0.00 .06 .28 .06 .I7 0.00 .06 .28 18.00 TWIN ENGINE .03 .I0 0.00 .08 .I5 -13 -05 .08 .21 .18, 39.00
NIGHTTIME SINGLE ENGINE l 07 .13 10 10 11 -13 .07 003 .I1 .I5 61.00 TWIN ENGINE l 07 .06 :03 :08 :14 .I0 .07 l 05 -15 .24 86.00
HOURS o-99 100-299 300-499 500-999 >I000
DAYTIME SINGLE ENGINE .I7 -34 .I7 .06 .28 TWIN ENGINE .21 .28 . 13 .21 . 18
NIGHTTIME SINGLE ENGINE .40 .24 .I0 11 .I5 TWIN ENGINE .24 .24 . 12 :15 .24

TABLE 56: SPIFR NIGHT CONTROLLED COLLISIONS DURING THE LANDING PHASE VERSUS VISIBILITY
VISIBILITY (MI) 0 -25 .5 .75 1 2 3 4 5 >5 TOTAL
NIGHT SPIFR 7 20 24 13 35 38 15 17 1 3 173
DAY SPIFR 5 14 6 5 10 14 9 0 0 2 65
NIGHT DPIFR 2 7 3 6 I
9 11 1 2 ) 2 0 1 43 _---
3 3 3 2 6 2 2 1 2 0 24
NIGHT SPIFR % .04 .I2 .14 -07 .20 .22 .og .I0 .Ol .02
b DAY SPIFR % .08 .22 -09 .08 .I5 .22 .I4 0.00 0.00 -03 0 \ I
NIGHT DPIFR % .05 .I9 .08 .I6 .24 -30 -03 -05 -05 0.00
DAY DPIFR % .I2 .I2 .I2 .08 -25 -08 -08 .04 .08 0.00 i

TABLE 57 SPIFR NIGHT CONTROLLED COLLISIONS DURING THE LANDING PHASE
VISIBILITY VERSUS PROXIMITY TO AIRPORT
ETY (MI) [ 0 1 .25 j -5 1 .75 1 1 2 3 I4 I
DAY SPIFR WITHIN AIRPORT SIGHT 1 2 3 2
DAY SPIFR VISIBILITY LESS THAN DISTANCE 4 12 3 3
F- ;r= NIGHT SPIFR
WITHIN AIRPORT SIGHT 1 8 6 5
NIGHT SPIFR VISIBILITY LESS THAN DISTANCE 1 6 / 12 118 1 8
-L 8 7 3 0 0 2 28 4-l O 137 I 6 0 0
10 4 8 1 87
5 5 0 2 85

TABLE 58 SPIFR NIGHT CONTROLLED COLLISIONS DURING THE LANDING PHASE
CAUSE FACTOR VERSUS TYPE OF APPROACH
CAUSE FACTOR: 12 3 4 5 6 7 8 9 1011 12 TOTAL
VOR/TVOR STRAIGHT-IN 2 3 1 2 3 13 1 0 2 2 0 0 29
VOR/TVOR CIRCLING 2 1 1 2 14 10 10 0 013
VOR/DME STRAIGHT-IN 1 10 0 0 2 0 0 0 10 0 5
VOR/DME CIRCLING 2 0 0 0 10 10 0 0 0 0 4
ADF STRAIGHT-IN 6 0 0 0 0 4 10 11 0 0 13
m b N
CAUSE FACTOR CODES: 1. Improper IFR procedures 7. Misjudged altitude
Icing related 8. A/c not properly equipped :: Pilot distracted/diverted attention 9. Did not fly published approach 4. Suspect instrument misread 10. Conditions exceeded pilot's capabilites 5. Faulty instrument 11. Pilot incapacitated 6. Descended below minimums 12. Spatial disorientation (Vertigo)
APPENDIX C
REFERENCES

REFERENCES
A. Forsyth, Donna L. and John D. Shaughnessy: Single Pilot IFR Operating Problems Determined from Accident Data Analysis. NASA.mTR;78773 ;~ig73,--
B. Federal Aviation Agency: Statistical Handbook of Aviation, Calender years 1964-1980; -~.U.S. Department of Transportation.
C. Weislogel, G. S. and G. C. Chapman: Study to Determine the IFR Operational Profile of the General Aviation Single ~ ?-"-^--~---- _ -.____=- Pilot. NASA CR-165805,1982.
D. Federal Aviation Agency: General Aviation Pilot and Aircraft Activity Summary--1979,. U.S. Department of Transportation.
E. Federal Aviation Agency: General Aviation Activity and Avionics Survey; Annual Summary Report 1977-80. U.S. - Department of Transportation.
F. Weislogel, G. S. and ASRS Office Staff: Operational Problems ---------. Experienced by Single Pilots in Instrument Meteorological Conditions. NASA CR-168837,1981.
G. Federal Aviation Agency: Palo Alto Airport Tower Operations; March 1977; lJ-.t of Transportation; FAA-AVP-77-21.
H. Goldman, Donald: Development of a Technique for Estimating ~- -- Annual Instrument- Approaches (AIA's); June 1976;Mii%--- FporationT--MeClean, Virginia; MTR-7265.
I. Benjamin, Henry: Pilot Accident Potential as Related to Total Flight ExpeF-'ifence---and~Recency~~~d Frequency of Fly- --.-- ---.- -~..-~_-~-~__ __ _ wz; 1974; Naval Postgraduate School, Monterey, California.
J. Newman, R. L. and D. L. Quam: Pilot Reaction to Attitude Gyro Failure - a Flight ExperiKTy CanadianAeronautics and Space Journal, Vol 26, 1980, pp. 303-310.
K. Quinby, G. F .: General Aviation Operating Requirements for the 1980's; Soc-ieXmfdAXAutive Enginis, International Air Transportation Meeting; Cincinatti, Ohio; May 20-22,lgSG.
L. Toepel, W. 0.: Requirements for Short Instrument Runways; Ortung and Navigation (German); No. 2, 1979, pp. 266-271.
C-l
M. Finnegan, J. P.: Transfer of a Computer Assisted Instrument Procedures Trainer to Flight; Human Factors Society, Annu- al Meeting, San Francisco, California; October 17-20, 1977.
N. Brunner, D.: Measures for Enhancing Safety in General Aviation in the Areas of Air Traffic Control, Navigation, and Meteorology; Ortung and Navigation (German); No. 4,
1976, PP. 9%if%
0. Allen, R. and W. Roberts: Aspects of Structural Safety in General Aviation Airplanes; Society of Automotive Engineers National Business Aircraft Meeting; Wichita, Kansas; March 15-17, 1972.
P. Colomy, J. R .: Meteorological Input to General Aviation Pilot Training. Proceedings, 3rd Annual Workshop on Meteorlogical and Environmental Inputs to Aviation Systems, D.W. Camp and W. Frost, eds., NASA CP-2104, FAA-RD-79-49, 1979, PP. 30-36.
Q. Bolz, E. H. and J. E. Eisele: General Aviation IFR Opera- tional Problems. NASA CR-159022,1979.
c-2

SINGLE PILOT IFR ACCIDENT DATA ANALYSIS
Virginia Beach, VA 23451 NASl-16920
National Aeronautics and Space Administration Washington, D.C. 20546
15. Supplementary Notes
Langley technical monitor: David A. Hinton Final Report
6. Abstract The aircraft accident data recorded and maintained by the National Transpor-
tation Safety Board (NTSB) for 1964-1979 were analyzed to determine what problems exist in the general aviation (GA) single pilot instrument flight rules (SPIFR) environment. A previous study conducted in 1978 for the years 1964-1975 provided a basis for comparison.
The purpose of the research and analysis upon which this report is based was to determine what changes, if any, have occurred in trends and cause-effect rela- tionships reported in the earlier study. The increasing numbers have been tied to measures of activity to produce accident rates which in turn were analyzed in terms of change. Where anomalies or unusually high accident rates were encountered, further analysis was conducted to isolate pertinent patterns of cause factors and/or experience levels of involved pilots. The bulk of the effort addresses accidents in the landing phase of operations.
Detailed analysis was performed on controlled/uncontrolled collisions and their unique attributes delineated. Estimates of day vs. night general aviation activity and accident rates were obtained.
1. Key Words (Suggested by Author(s))
IFR General Aviation Accident Analysis
18. Distribution Statement
Unclassified - Unlimited
Subject Category 03
3. Security Classif. (of this report) 20. Security Classif. (of this page)
Unclassified Unclassified
21. No. of Pages
108
22. Rice
A06
For Sale by the National Technical information Service, Springfield, Virginia 22161 NASA-Langley, 1982