single group solvency and financial ... - royal london
TRANSCRIPT

Single Group Solvency and Financial Condition Reportfor the year ended 31 December 2019
A STRONG CAPITAL BASE

Contents
04 Executive summary12 Basis of preparation 14 Directors’ approval statement 15 Independent auditor’s opinion
A. Business and performance20 A.1. Business 23 A.2. Underwriting performance 25 A.3. Investment performance 26 A.4. Performance of other activities 26 A.5. Any other information
B. System of governance27 B.1. General information on the system of governance 32 B.2. Fit and Proper requirements 33 B.3. Risk management system including the Own Risk and Solvency Assessment38 B.4. Internal control system 40 B.5. Internal audit function 41 B.6. Actuarial function 41 B.7. Outsourcing 43 B.8. Any other information
C. Risk profile45 C.1. Underwriting risk 47 C.2. Market risk 49 C.3. Credit risk 51 C.4. Liquidity risk 52 C.5. Operational risk 53 C.6. Other material risks 54 C.7. Any other information
D. Valuation for solvency purposes57 D.1. Assets 65 D.2. Technical provisions 74 D.3. Other liabilities 74 D.4. Alternative methods for valuation 76 D.5. Any other information
E. Capital management78 E.1. Own funds 85 E.2. Solvency Capital Requirement and Minimum Capital Requirement86 E.3. Use of a duration-based equity risk sub-module in the calculation of the Solvency Capital Requirement86 E.4. Differences between the Standard Formula and any Internal Model used90 E.5. Non-compliance with the Minimum Capital Requirement and Solvency Capital Requirement90 E.6. Any other information
91 Glossary 96 Appendix 1 – Summary of Quantitative Reporting Templates97 Appendix 2 – Quantitative Reporting Templates – Group115 Appendix 3 – Quantitative Reporting Templates – RLMIS
2Single Group Solvency and Financial Condition Report 2019
EXECU
TIVE SUM
MAR
YA –
BU
SINESS
AN
D PER
FOR
MAN
CE
B –
SYSTEM
OF G
OVER
NAN
CE
C –
RISK
PRO
FILED
– VALU
ATION
FOR
SO
LVENC
Y PUR
POSES
E – C
APITAL M
ANAG
EMEN
TG
LOSSAR
YAPPEN
DIC
ES

Capital position at a glance
Capital cover ratio (Regulatory View)
Solvency surplus (Regulatory View)
154%1,2 162%1159% 167%
138%1,2 140%1
50% 50%
125% 132%
520%1,2561%1
80% 80%
1 January 2019
1 January 2019
1 January 2019
1 January 2019
31 December 2018
31 December 2018
31 December 2018
31 December 2018
31 December 2019
31 December 2019
31 December 2019
31 December 2019
31 December 2019
31 December 2019
31 December 2019
31 December 2019
489%527%
£2.1bn1,2 £2.3bn1£2.6bn
£2.9bn
Group
Group
Group
Group
RLMIS
RLMIS
RLMIS
RLMIS
Tier 1 capital (coverage of Solvency Capital Requirement)
Tier 1 capital (coverage of Minimum Capital Requirement)
1. The comparative metrics have been restated to reflect the move to a Partial Internal Model for calculating capital requirements. These metrics are unaudited. 2. Comparative figures at 31 December 2018 are not available for the Group capital position as The Royal London Mutual Insurance Society Limited only became an insurance Group for SII purposes with effect from 1 January 2019 and therefore Group figures have been restated at this date.
3Single Group Solvency and Financial Condition Report 2019
EXECU
TIVE SUM
MAR
YA –
BU
SINESS
AN
D PER
FOR
MAN
CE
B –
SYSTEM
OF G
OVER
NAN
CE
C –
RISK
PRO
FILED
– VALU
ATION
FOR
SO
LVENC
Y PUR
POSES
E – C
APITAL M
ANAG
EMEN
TG
LOSSAR
YAPPEN
DIC
ES

Executive summary
IntroductionThis report relates to The Royal London Mutual Insurance Society Limited (RLMIS), and all of its subsidiary undertakings, together referred to as ‘Royal London’ or ‘the Group’. Royal London is the largest mutual life insurance, pensions and investment company in the United Kingdom (UK), with assets under management of £139bn at 31 December 2019, around 8.6 million policies in force and 4,126 employees. Royal London was founded in 1861, initially as a friendly society, and became a mutual life insurance company in 1908. The Group is authorised by the Prudential Regulation Authority (PRA) and jointly regulated by the Financial Conduct Authority (FCA) and the PRA.
The insurance entities of the Group are:
RLMIS; and
Royal London Insurance Designated Activity Company (RLI DAC).
The purpose of the Solvency and Financial Condition Report (SFCR) is to provide information required by the Solvency II (SII) regulations at 31 December 2019. The Group has approval from the PRA to produce a Single Group SFCR. This removes the requirement to publish separate SFCRs for the Group and RLMIS. Further details are included in the basis of preparation. Information on RLI DAC has been provided throughout this report and is included within the Group result. A separate Solo SFCR for RLI DAC is also available on our website: visit royallondon.com and search ‘investor relations’.
This report sets out aspects of the Group’s business and performance, system of governance, risk profile, valuation methods used for solvency purposes and its capital management practices.
Impact from coronavirus (Covid-19)2020 has begun with the spread of a new strain of coronavirus, with confirmed cases in almost every country in the world. The virus has caused disruption to businesses and economic activity which has precipitated substantial daily fluctuations in global stock and bond markets. This has reduced the Group Regulatory View capital cover ratio to an estimated 152% from 159%, with the Group Investor View capital cover ratio estimated to increase to 233% from 231% as at 27 March 2020. The Group Regulatory View solvency surplus has reduced to an estimated £2.3bn from £2.6bn, whilst the Group Investor View solvency surplus increased to an estimated £5.9bn from £5.8bn as at 27 March 2020. Our capital management approach ensures that our solvency surplus remains stable in times of markets falling. The Group remains very well capitalised and we will continue to take action to protect our capital position as appropriate.
Business and performanceSection A describes our business performance and significant events during the year, our legal structure and regulation. Financial highlights for 2019 are:
European Embedded Value (EEV) operating profit before tax increased to £416m (2018: £396m), an increase of 5%, driven by a continued strong new business contribution of £319m (2018: £301m);
International Financial Reporting Standards (IFRS) profit before tax increased to £436m (2018: loss before tax £111m) helped by positive investment returns;
ProfitShare (after tax) distribution to eligible customers of £140m (2018: £150m), bringing total ProfitShare payments to over £1bn since 2007;
new business sales (Present Value of New Business Premiums (PVNBP) basis) decreased to £10,699m (2018: £11,308m). The expected decrease resulted from a reduction in individual pension sales primarily due to a reduced level of defined benefit transfer activity across the market;
assets under management (AUM) reached a record high of £139bn (2018: £114bn), due to a combination of investment growth and net inflows of £9,892m (2018: £7,652m); and
outstanding investment performance with 98% (2018: 54%) of active funds outperforming their benchmark over a three-year period.
Further information on our business and performance is included in section A of this report.
4Single Group Solvency and Financial Condition Report 2019
EXECU
TIVE SUM
MAR
YA –
BU
SINESS
AN
D PER
FOR
MAN
CE
B –
SYSTEM
OF G
OVER
NAN
CE
C –
RISK
PRO
FILED
– VALU
ATION
FOR
SO
LVENC
Y PUR
POSES
E – C
APITAL M
ANAG
EMEN
TG
LOSSAR
YAPPEN
DIC
ES
Executive summary

System of governanceSection B outlines our system of governance and risk management, and how we are directed and controlled. We also describe our remuneration policy and practices, our adherence to the ‘Fit and Proper Requirements’, which are the standards required by the regulators when appointing employees who effectively run the business or have other key functions.
The Administrative, Management or Supervisory Body (AMSB) (defined as the Board and its Committees) is responsible for the system of governance, as well as for reviewing its effectiveness. The Board is committed to effective governance, sound risk management and a robust control environment – attributes that are critical to business integrity and performance.
Our system of governance comprises:
governance structure – the role of the Board and its Committees in directing and controlling the Group, which includes setting the strategy and risk appetite, and promoting a culture of effective risk management;
organisational structure – the reporting lines, roles and responsibilities of the directors and senior management to support the delivery of the Group’s strategy and implement appropriate risk policies and controls;
Risk Management System (RMS) – provides assurance that risks are being appropriately identified and managed in accordance with policies and within risk appetite. This helps to ensure that the achievement of the Group’s performance and objectives is not undermined by unexpected events resulting in significant financial loss or damage to the Group’s reputation; and
Internal Control System (ICS) – methods and processes put in place to achieve effectiveness and efficiency of operations, reliability of financial reporting, and compliance with applicable laws and regulations.
Key changes to our system of governance Our new insurance subsidiary, RLI DAC, was authorised to transact life insurance business in the Republic of Ireland with effect from 1 January 2019. RLI DAC has its own Board of Directors, which includes non-executive directors, and has also established audit and risk sub-committees.
Changes to key management personnel are included in section B.1.3. of this report.
Further information on the system of governance is included in section B of this report.
5Single Group Solvency and Financial Condition Report 2019
EXECU
TIVE SUM
MAR
YA –
BU
SINESS
AN
D PER
FOR
MAN
CE
B –
SYSTEM
OF G
OVER
NAN
CE
C –
RISK
PRO
FILED
– VALU
ATION
FOR
SO
LVENC
Y PUR
POSES
E – C
APITAL M
ANAG
EMEN
TG
LOSSAR
YAPPEN
DIC
ES
Executive summary (continued)

Risk profileSection C describes our risk profile, including risk exposures, concentrations, mitigation and sensitivity. Risk can sometimes be seen as negative; however, as part of our business we are specialists at taking on enough ‘good’ risk which provides value, and not excessive risk that may be detrimental to members or policyholders. We call this balancing act our ‘risk appetite’. The work we do to mitigate and manage risk is enhanced and strengthened each year.
The chart below shows the composition of the Solvency Capital Requirement (SCR) for the Group, calculated using a Partial Internal Model as at 31 December 2019.
Our risk profile and capital requirements are stable between 2018 and 2019, reflecting effective risk management through our RMS.
The definitions of the risk categories are provided in section C, with more details on the SCR set out in section E.
Group – Solvency Capital Requirement as at 31 December 20191
Market risk Credit (counterparty default) risk Underwriting risk – Life Non-insurance entities Operational risk
37%
2%
51%
2%2
8%
1. The chart shows the undiversified SCR. 2. This is the Group’s capital requirements relating to the non-insurance entities.
6Single Group Solvency and Financial Condition Report 2019
EXECU
TIVE SUM
MAR
YA –
BU
SINESS
AN
D PER
FOR
MAN
CE
B –
SYSTEM
OF G
OVER
NAN
CE
C –
RISK
PRO
FILED
– VALU
ATION
FOR
SO
LVENC
Y PUR
POSES
E – C
APITAL M
ANAG
EMEN
TG
LOSSAR
YAPPEN
DIC
ES
Executive summary (continued)

SensitivitiesOur capital position varies depending on economic and non-economic conditions. However, even in the face of market uncertainty, our capital position remains strong, and if equity values (the FTSE 100, for example) dropped 25% our Group Regulatory View solvency surplus at 31 December 2019 would reduce by £259m (from £2,632m to £2,373m) and the Group capital cover ratio would drop by 3% points from 159% to 156%. In this scenario, it means that our own funds held would still be well in excess of our SCR. The following table sets out various sensitivities for the Group and RLMIS based on different possible scenarios.
Group RLMIS
Scenario Solvency surplus
(Regulatory View) (£m)
Capital cover ratio
(Regulatory View)
(% points)
Solvency surplus
(Regulatory View) (£m)
Capital cover ratio
(Regulatory View)
(% points)
Base: 31 December 2019 2,632 159 2,861 167
Economic1:
25% decrease in all equity investments2 (259) (3) (259) (3)
15% decrease in property prices (commercial and residential)
(77) (2) (77) (2)
100bps rise in interest rate (parallel shift) 2, 3 12 14 12 17
100bps fall in interest rate (parallel shift) 2, 3 (47) (15) (47) (18)
25bps increase in government bond yields4 (62) (2) (62) (2)
200bps widening in credit spreads (all ratings)5 (117) 1 (117) 2
15% fall in GBP exchange rates (against all other currencies)6 209 2 209 2
Non-economic1:
20% increase in Guaranteed Annuity Option take-up rate7 (84) (5) (84) (5)
Two-year increase in future life expectancy8 (275) (14) (275) (15)
35% increase in future persistency rates9 (34) 2 (34) 3
12.5% one-off increase in surrender/transfer rates10 (242) (4) (242) (3)
15% increase in maintenance expenses (220) (5) (220) (6)
1. These sensitivities assume a recalculation of the Transitional Measure on Technical Provisions (TMTP).2. Sensitivity consistent with the PRA’s SS7/17: Solvency II: Data collection of market risk sensitivities, which is available at bankofengland.co.uk/pra/Documents/publications/ss/2017/ss717.pdf. The remaining market risk sensitivities presented have been updated to be the equivalent to a 1-in-20 year event. 3. Interest rate sensitivities assume government and other bond yields and risk-free rates all move by the same amount. Interest rates are allowed to be negative.4. The government bond yield sensitivity assumes risk-free rates and other yields remain constant.5. The widening in credit spreads stress assumes a widening in all ratings and assume an associated increase in the IAS19 discount rate for the Royal London Group Pension Scheme (RLGPS)/Liver Group Pension Scheme at 25% of the asset spread stress. 6. The fall in GBP exchange rates stress assumes an increase to the value of assets held in currencies other than GBP by 17.5% in GBP terms.7. The calibration of the 20% increase in Guaranteed Annuity Option (GAO) take-up rates stress is based on the RL Open Fund. For other funds, a proportionate stress will be applied to reflect the 1-in-20 risk specific to that fund.8. The two-year increase in future life expectancy stress assumes males aged 65 live for another two years and proportionate changes apply to other ages.9. The persistency stress assumes adverse movement in future lapse rates and Paid Up Policy (PUP) rates.10. This stress assumes additional lapses/PUPs in the first year after the valuation date, but only where it is advantageous for the policyholder to surrender/transfer.
7Single Group Solvency and Financial Condition Report 2019
EXECU
TIVE SUM
MAR
YA –
BU
SINESS
AN
D PER
FOR
MAN
CE
B –
SYSTEM
OF G
OVER
NAN
CE
C –
RISK
PRO
FILED
– VALU
ATION
FOR
SO
LVENC
Y PUR
POSES
E – C
APITAL M
ANAG
EMEN
TG
LOSSAR
YAPPEN
DIC
ES
Executive summary (continued)

Valuation for solvency purposes Section D describes the valuation of our assets, technical provisions and other liabilities, and material differences between the SII valuations and the IFRS valuations used in the 2019 ARA.
The following chart illustrates the relative size of the funds within the Group. Figures quoted are asset balances within the funds as at 31 December 2019.
Group – Total assets by fund
£105,447m£65,199m
£1m
Total Group Assets
RL Open Fund1
Royal London
(CIS) Fund (RL (CIS))
Scottish Life Fund
(SL)
Royal Liver Assurance
Fund (Liver)
PLAL With-Profits
(PLAL)
United Friendly
Ordinary Branch
Fund (UF OB)
RLI DAC Open Fund
United Friendly
Industrial Branch
Fund (UF IB)
Ireland Liver Fund
Refuge Assurance Industrial
Branch Fund
(RA IB)
German Bond Fund
1. The assets in the RL Open Fund reflect the impact of Group consolidation adjustments.
RLMIS RLI DAC
£30,994m
£2,294m £2,067m £543m £2,829m £1,142m £234m £79m £65m
The following chart illustrates the type of business written by the Group, and the relative size of the insurance liabilities (referred to as technical provisions under SII) held at 31 December 2019.
Group – Total technical provisions by line of business
Insurance with profit participation Index-linked and unit-linked insurance Health insurance1
Other life insurance
£29,216m
£53,639m
£(185)m£5,193m
1. Negative technical provisions arise in health business as initial commission and expenses are paid out at the start of the contract, but are recovered from future premium income. This means that the value of future cash inflows exceeds the value of future cash outflows over the remaining life of the contract. SII rules require negative technical provisions to be recorded as a negative liability rather than an asset.
There has been no material change in the valuation of assets and liabilities during 2019.
Executive summary (continued)
8Single Group Solvency and Financial Condition Report 2019
EXECU
TIVE SUM
MAR
YA –
BU
SINESS
AN
D PER
FOR
MAN
CE
B –
SYSTEM
OF G
OVER
NAN
CE
C –
RISK
PRO
FILED
– VALU
ATION
FOR
SO
LVENC
Y PUR
POSES
E – C
APITAL M
ANAG
EMEN
TG
LOSSAR
YAPPEN
DIC
ES

Recalculation of Transitional Measure on Technical ProvisionsTMTP smooths the transition from the previous solvency regime (Solvency I) to the SII regime, and spreads the capital impact over a 16-year period from 1 January 2016, so that it reduces to nil by 1 January 2032 and provides no benefit at that point. This is included within the valuation of technical provisions.
The TMTP is recalculated at least every two years, with additional recalculations triggered on material changes to the risk profile. TMTP was last recalculated in 2017 and therefore has been recalculated in 2019.
At 31 December 2019, TMTP contributed 67% to the Investor View capital cover ratio and 18% to the Regulatory View capital cover ratio for the Group.
At 31 December 2019, TMTP contributed 70% to the Investor View capital cover ratio and 18% to the Regulatory View capital cover ratio for RLMIS.
Volatility AdjustmentThe Volatility Adjustment (VA) also forms part of the calculation of technical provisions, and is made to ensure the appropriate treatment of insurance products with long-term guarantees under SII.
At 31 December 2019, VA contributed 11% to the Investor View capital cover ratio and 2% to the Regulatory View capital cover ratio for the Group.
At 31 December 2019, VA contributed 12% to the Investor View capital cover ratio and 2% to the Regulatory View capital cover ratio for RLMIS.
Capital managementSection E includes information on the amount and quality of our own funds and the SCR and Minimum Capital Requirement (MCR). This section also describes our approach to capital management.
There are three tiers of capital defined by SII. The quality of capital is important, as the higher the quality, the more likely it will be available in the event that it is needed, for example, to be able to pay out claims. The three tiers of capital are presented in the order of highest quality (Tier 1 capital) to lowest quality (Tier 3 capital).
Subordinated debt issueOn 7 October 2019, RL Finance Bonds No. 4 plc, a wholly owned entity of the Group, issued the Fixed Rate Reset Callable Guaranteed Subordinated Notes due 2049 (the 2049 Notes). The nominal value at the date of issue was £600m. The fair value at the date of issue was £585m, which takes into account the discount and costs incurred on the issue. Interest is payable on the 2049 Notes at a fixed rate of 4.875% per annum for the period to 7 April 2039, payable annually in arrears on 7 October each year. The 2049 Notes are classified as Tier 2 for SII capital tiering purposes.
At 31 December 2019, the Group has subordinated loan notes in issue with a fair value of £1,508m (31 December 2018: £806m).
Internal Model approval The SCR is the amount of capital needed to pay all liabilities in a very extreme scenario (a 1-in-200 year event). Under the SII regime, there are two bases for calculating the SCR: the Standard Formula and the Internal Model.
In September 2019, the PRA approved the use of our Partial Internal Model (Internal Model) to calculate the capital requirements of the Group and RLMIS with effect from 1 October 2019. The capital requirements of RLI DAC at 31 December 2019 remain on a Standard Formula basis.
The use of our Internal Model makes our capital requirements more reflective of the nature of our business and how we manage risk and capital.
Executive summary (continued)
9Single Group Solvency and Financial Condition Report 2019
EXECU
TIVE SUM
MAR
YA –
BU
SINESS
AN
D PER
FOR
MAN
CE
B –
SYSTEM
OF G
OVER
NAN
CE
C –
RISK
PRO
FILED
– VALU
ATION
FOR
SO
LVENC
Y PUR
POSES
E – C
APITAL M
ANAG
EMEN
TG
LOSSAR
YAPPEN
DIC
ES

Solvency surplus and capital cover ratioSolvency surplus is the amount by which our capital position, referred to as own funds, exceeds the SCR.
Capital cover ratio is the ratio of our capital position (own funds) compared to the SCR. The capital cover ratio is a good indicator of the ability to withstand tough economic conditions, with a higher ratio indicating more available capital. The ratio should not, however, be too high, as it is important that we continue to return value to our policyholders and members.
We present two views of our capital position: an Investor View for analysts and investors in our subordinated debt (which does not restrict the surplus in the closed funds), and a Regulatory View where the closed funds’ surplus is treated as a liability.
Our capital position is well in excess of the SCR and the strong capital cover ratio in both the Open Fund and closed funds, underlines our financial strength and ability to meet our commitments (even in an extreme scenario that occurs once every 200 years) to settle claims and pay-outs for all of our policyholders and support them through unexpected future events.
The following table sets out the capital position and SII metrics for the Group at 31 December 2019.
31 December 2019 £m
Open Fund1 Closed funds
Total Group (Investor
View)
Closed fund restriction
Total Group (Regulatory
View)
Own funds:
Tier 1 3,337 5,403 8,740 - 8,740
Tier 2 1,508 - 1,508 - 1,508
Tier 32 6 - 6 - 6
Total own funds 4,851 5,403 10,254 - 10,254
Closed funds restriction - - - (3,178) (3,178)
Deferred tax asset restriction2 (6) - (6) - (6)
Adjusted own funds (A) 4,845 5,403 10,248 (3,178) 7,070
SCR (B) 2,213 2,225 4,438 - 4,438
Solvency surplus (A-B) – 31 December 2019 2,632 3,178 5,810 (3,178) 2,632
Solvency surplus3 – 1 January 2019 2,094 2,832 4,926 (2,832) 2,094
Capital cover ratio4 (A/B) – 31 December 2019 219% 243% 231% n/a 159%
Capital cover ratio3,4 – 1 January 2019 201% 259% 228% n/a 154%
1. The Open Fund consists of the RL Open Fund and the impact of Group consolidation adjustments. Excluding the impact of Group consolidation adjustments, the RL Open Fund has a capital cover ratio of 240% at 31 December 2019.2. The Group has deferred tax assets which are classified as Tier 3 capital. The deferred tax assets do not count towards our solvency position as they are recognised and restricted in accordance with the SII regulations. 3. The 1 January 2019 figures have been restated to reflect the move to an Internal Model for calculating capital requirements. Final solvency surplus and capital cover ratios for the Group were presented in the 2018 RLMIS SFCR on a Standard Formula basis in April 2019, being an Investor View solvency surplus and capital cover ratio of £4,411m and 197% respectively, and a Regulatory View solvency surplus and capital cover ratio of £1,761m and 139% respectively. 4. Figures presented in the table are rounded, and the capital cover ratio is calculated based on exact figures.
Executive summary (continued)
10Single Group Solvency and Financial Condition Report 2019
EXECU
TIVE SUM
MAR
YA –
BU
SINESS
AN
D PER
FOR
MAN
CE
B –
SYSTEM
OF G
OVER
NAN
CE
C –
RISK
PRO
FILED
– VALU
ATION
FOR
SO
LVENC
Y PUR
POSES
E – C
APITAL M
ANAG
EMEN
TG
LOSSAR
YAPPEN
DIC
ES

The following diagram sets out an analysis of the movement in the Group Regulatory View solvency surplus between 1 January 2019 and 31 December 2019.
The Group solvency surplus (Regulatory View) at 1 January 2019 has been restated from £1,761m (disclosed in the 2018 SFCR) to £2,094m to reflect:
a revised capital add-on that would have been recalculated on the Standard Formula capital position; and
the move to preparing our capital requirements on an Internal Model basis, from the previous Standard Formula basis.
The Group solvency surplus (Regulatory View) at 1 January 2019 (restated) has increased from £2,094m to £2,632m at 31 December 2019. The increase is primarily from positive economic experience, due to strong performance in global and UK equity and bond markets, partially offset by a reduction in the risk-free rate, and a capital benefit from the run-off of existing business.
Our remaining capital is strong. As a result, whilst still maintaining target solvency levels, we have been able to use available capital to:
write new business during 2019;
progress with one-off projects and strategic investment in the business, including pensions system development and Legacy simplification (to improve service, flexibility and distributions to our customers in the closed funds); and
deliver £140m of ProfitShare to eligible customers.
The Group and RLMIS have maintained own funds in excess of the MCR and the SCR throughout 2019.
There have been no other significant changes to the way we manage our capital in 2019.
Further information on the Group and RLMIS capital position and capital management, the amount and quality of our own funds and our capital requirements are set out in section E of this report.
Movement in Group Regulatory View solvency surplus (£m)
2,094 11
178
2,632585
Solvency surplus (1 January 2019
restated)
Non-economic assumption
changes and experience variances
Economic assumption
changes and experience variances,
including financing costs
Existing business New business One-off projects and investment in
the business
ProfitShare Subordinated debt issuance
Solvency surplus (31 December
2019)
Capital cover ratio
154%
Capital cover ratio
159%
1,500
2,500
2,000
132 (123)
(106)
(140)
Sources of capital Uses of capital
Executive summary (continued)
11Single Group Solvency and Financial Condition Report 2019
EXECU
TIVE SUM
MAR
YA –
BU
SINESS
AN
D PER
FOR
MAN
CE
B –
SYSTEM
OF G
OVER
NAN
CE
C –
RISK
PRO
FILED
– VALU
ATION
FOR
SO
LVENC
Y PUR
POSES
E – C
APITAL M
ANAG
EMEN
TG
LOSSAR
YAPPEN
DIC
ES

Basis of preparation
12
Basis of preparation The estimated impact of Covid-19 to the solvency position of the Group as at 27 March 2020 is shown on page 4 of the Executive Summary. Further information on the impact on the risk profile is included in section C.6. The remainder of the Single Group SFCR and related Quantitative Reporting Templates (QRTs) have been prepared as at 31 December 2019 and hence do not reflect this impact. The Group continues to monitor the situation closely and is taking appropriate action to prepare for the potential impacts from financial markets, insurance exposures and operations. Following the authorisation of RLI DAC with effect from 1 January 2019, Royal London became an insurance Group for SII purposes from that date. The Group applied for a modification of rule 18.1 of the PRA rulebook; which was granted by the PRA to produce a Single Group SFCR covering the Group and its main insurance entity, RLMIS, from the year ended 31 December 2019. The disclosures in the Single Group SFCR, and the QRTs in the Appendices, have been prepared in accordance with the SII regulations and the PRA rules, hereafter referred to as ‘the regulations’. Certain financial information in the Single Group SFCR (excluding financial information in the QRTs) has been rounded. This may result in some presentational differences between the disclosures in the report and the QRTs. Certain disclosures required by the regulations are not relevant to the Group and have been excluded from this report:
� The Group and RLMIS have no non-life business.
� The Group and RLMIS have no special purpose vehicles.
� The Group and RLMIS do not apply matching adjustment or the transitional risk-free interest rate term structure.
� The Group and RLMIS do not have any ancillary own funds.
� No basic own fund items for the Group and RLMIS were subject to transitional arrangements.
� Information on the standard formula approach to calculating the SCR. The Group and RLMIS use an Internal Model to calculate the SCR at 31 December 2019. The capital requirement of RLI DAC is on a Standard Formula basis and further information on the Standard Formula approach is included in the RLI DAC Solo SFCR.
Comparatives Comparatives for the Group are not presented throughout this report, as it only became a Group for SII purposes from 1 January 2019. However, where Group SII metrics (i.e. solvency surplus and capital cover ratio) were included in the post balance sheet event note, in the 2018 RLMIS SFCR, these metrics are included in this document. Comparatives for RLMIS at 31 December 2018 have been included in this document when required by the SII regulations, or where deemed useful to the reader of the document. Previously reported capital positions and SII metrics for the Group and RLMIS were based on the Standard Formula approach. The Group capital position at 1 January 2019 and RLMIS capital position at 31 December 2018 have been restated to reflect the move to an Internal Model for calculating capital requirements. RLI DAC Information on RLI DAC has been provided throughout this report and is included within the Group result; however RLI DAC produces a separate Solo SFCR. The narrative and figures in relation to RLI DAC Solo amounts provided are not the subject of the audit opinion expressed in this SFCR but rather are subject to audit at a company level. Valuation for solvency purposes The regulations require that assets and liabilities are valued for solvency purposes at fair value, unless a specific rule requires otherwise. Fair value is essentially what would be received if an asset was sold or a liability was settled in an arm’s length transaction between willing parties. This is equivalent to the IFRS fair value used in the 2019 ARA and therefore the majority of assets and liabilities are held at the same value on the IFRS and SII balance sheets. Where there are differences in valuation between the IFRS and SII values, these have been separately presented in section D.1.3 (assets and other liabilities) and D.2 (technical provisions). There have been no material changes affecting the methodology used in the valuation of assets, technical provisions and other liabilities in the SII balance sheet in 2019. Key assumption changes impacting technical provisions are included in section D.2.7. The Group and its insurance entities use materially the same bases, methods and main assumptions for its assets, technical provisions and other liabilities.

Basis of preparation (continued)
13
Transitional Measure on Technical Provisions
The PRA has authorised the use of TMTP, and it is included in the solvency surplus figures throughout this document. The TMTP provides a capital benefit, however the Group and RLMIS are not reliant on it to meet the capital requirements. Volatility Adjustment The VA forms part of the calculation of technical provisions, and is made to ensure the appropriate treatment of insurance products with long-term guarantees under SII. The use of the VA has been approved by the PRA for the Group and RLMIS, and is included in the capital information presented throughout this document. Capital management Calculation of Group own funds and solvency capital requirement Group own funds and consolidated Group SCR are calculated using the default consolidation approach, referred to as ‘method 1’ in the SII regulations. Under method 1, insurance undertakings and insurance holding undertakings are consolidated on a line-by-line basis, with balances between group entities eliminated on consolidation. RLMIS, RLI DAC and the management service company, Royal London Management Services Limited (RLMS) are consolidated in this manner. All other entities (non-insurance subsidiaries) are not consolidated on a line-by-line basis, but remain within one line of the SII balance sheet, ‘Holdings in related undertakings, including participations’. Material terms and conditions attached to own funds
The material terms and conditions of the three subordinated debt issues on the balance sheet at 31 December 2019 are set out in page 199 of the 2019 ARA. Other own funds items (surplus funds, reconciliation reserve and deferred tax asset) do not have explicit terms and conditions attached to them. Forward-looking statement This document may contain ‘forward-looking statements’ with respect to certain of the Group’s plans, its current goals and expectations relating to its future financial position. By their nature, forward-looking statements involve risk and uncertainty because they relate to future events and circumstances which are beyond the Group’s control. These include, among others, the development of the situation pertaining to Covid-19, UK economic and business conditions, market-related risks such as fluctuations in interest rates, the policies and actions of governmental and regulatory authorities, the impact of competition, the timing, impact and other uncertainties of future mergers or combinations within relevant industries. As a result, the Group’s actual future financial condition, performance and results may differ materially from the plans, goals and expectations set forth in the Group’s forward-looking statements. The Group undertakes no obligation to update the forward-looking statements.

Directors’ approval statement
14
Directors’ approval statement The Royal London Mutual Insurance Society Limited Approval by the Board of Directors of the Single Group SFCR
Financial year ended 31 December 2019 We acknowledge our responsibility for preparing the Single Group SFCR in all material respects in accordance with the PRA rules and the Solvency II Regulations. We are satisfied that:
a) throughout the financial year in question, the Group has complied in all material respects with the requirements of the PRA rules and the Solvency II Regulations as applicable to the Group; and
b) it is reasonable to believe that the Group has continued so to comply subsequently and will continue so to comply in future.
For and on behalf of the Board of The Royal London Mutual Insurance Society Limited 3 April 2020
Barry O’Dwyer Group Chief Executive

Independent auditors’ opinion
15
Independent auditors’ opinion Report of the external independent auditors to the Directors of The Royal London Mutual Insurance Society Limited (‘the Company’) pursuant to Rule 4.1 (2) of the External Audit Part of the PRA Rulebook applicable to Solvency II firms Report on the Audit of the relevant elements of the Single Group Solvency and Financial Condition Report. Opinion Except as stated below, we have audited the following documents prepared by the Company as at 31 December 2019:
� The ‘Valuation for solvency purposes’ and ‘Capital Management’ sections of the Single Group Solvency and Financial Condition Report of the Company as at 31 December 2019, (‘the Narrative Disclosures subject to audit’); and
� Group templates S.02.01.02, S.22.01.22, S.23.01.22 and S.32.01.22 (‘the Group Templates subject to audit’).
� Company templates S.02.01.02, S.12.01.02, S.22.01.21, S.23.01.01 and S.28.01.01 in respect of The Royal London Mutual Insurance Society (‘the Company Templates subject to audit’).
The Narrative Disclosures subject to audit, the Group Templates subject to audit and the Company Templates subject to audit are collectively referred to as the ‘relevant elements of the Single Group Solvency and Financial Condition Report’. We are not required to audit, nor have we audited, and as a consequence do not express an opinion on the Other Information which comprises:
� Information contained within the relevant elements of the Single Group Solvency and Financial Condition Report set out above which is, or derives from the Solvency Capital Requirement, as identified in the Appendix to this report;
� The ‘Executive Summary’, ‘Business and performance’, ‘System of governance’ and ‘Risk profile’ elements of the Single Group Solvency and Financial Condition Report;
� Group templates S.05.01.02 and S.25.02.22;
� Company templates S.05.01.02, and S.25.02.21;
� Information calculated in accordance with the previous regime used in the calculation of the transitional measure on technical provisions, and as a consequence all information relating to the transitional measure on technical provisions as set out in the Appendix to this report;
� The written acknowledgement by management of their responsibilities, including for the preparation of the Single Group Solvency and Financial Condition Report (‘the Responsibility Statement’);
To the extent the information subject to audit in the relevant elements of the Single Group Solvency and Financial Condition Report includes amounts that are totals, sub-totals or calculations derived from the Other Information, we have relied without verification on the Other Information.
In our opinion, the information subject to audit in the relevant elements of the Single Group Solvency and Financial Condition Report of the Company as at 31 December 2019 is prepared, in all material respects, in accordance with the financial reporting provisions of the PRA Rules and Solvency II regulations on which they are based, as modified by relevant supervisory modifications, and as supplemented by supervisory approvals.
Basis for opinion We conducted our audit in accordance with International Standards on Auditing (UK) (ISAs (UK)) including ISA (UK) 800 and ISA (UK) 805, and applicable law. Our responsibilities under those standards are further described in the Auditors’ Responsibilities for
the Audit of the relevant elements of the Single Group Solvency and Financial Condition Report section of our report. We are independent of the Company in accordance with the ethical requirements that are relevant to our audit of the Single Group Solvency and Financial Condition Report in the UK, including the FRC’s Ethical Standard as applied to public interest entities, and we have fulfilled our other ethical responsibilities in accordance with these requirements. We believe that the audit evidence we have obtained is sufficient and appropriate to provide a basis for our opinion.

Independent auditors’ opinion (continued)
16
Conclusions relating to going concern We have nothing to report in respect of the following matters in relation to which the ISAs (UK) require us to report to you where:
� the directors’ use of the going concern basis of accounting in the preparation of the Single Group Solvency and Financial Condition Report is not appropriate; or
� the directors have not disclosed in the Single Group Solvency and Financial Condition Report any identified material uncertainties that may cast significant doubt about the Company’s ability to continue to adopt the going concern basis of accounting for a period of at least twelve months from the date when the Single Group Solvency and Financial Condition Report is authorised for issue.
However, because not all future events or conditions can be predicted, this statement is not a guarantee as to the Company’s ability to continue as a going concern.
Emphasis of Matter – Basis of Accounting We draw attention to the ‘Valuation for solvency purposes’ and ‘Capital Management’ of the Single Group Solvency and Financial Condition Report, which describe the basis of accounting. The Single Group Solvency and Financial Condition Report is prepared in compliance with the financial reporting provisions of the PRA Rules and Solvency II regulations, and therefore in accordance with a special purpose financial reporting framework. The Single Group Solvency and Financial Condition Report is required to be published, and intended users include but are not limited to the Prudential Regulation Authority. As a result, the Single Group Solvency and Financial Condition Report may not be suitable for another purpose. Our opinion is not modified in respect of this matter.
Other Information The Directors are responsible for the Other Information. Our opinion on the relevant elements of the Single Group Solvency and Financial Condition Report does not cover the Other Information and we do not express an audit opinion or any form of assurance conclusion thereon. In connection with our audit of the Single Group Solvency and Financial Condition Report, our responsibility is to read the Other Information and, in doing so, consider whether the Other Information is materially inconsistent with the relevant elements of the Single Group Solvency and Financial Condition Report, or our knowledge obtained in the audit, or otherwise appears to be materially misstated. If we identify such material inconsistencies or apparent material misstatements, we are required to determine whether there is a material misstatement in the relevant elements of the Single Group Solvency and Financial Condition Report or a material misstatement of the Other Information. If, based on the work we have performed, we conclude that there is a material misstatement of this Other Information, we are required to report that fact. We have nothing to report in this regard.
Responsibilities of Directors for the Single Group Solvency and Financial Condition Report The Directors are responsible for the preparation of the Single Group Solvency and Financial Condition Report in accordance with the financial reporting provisions of the PRA rules and Solvency II regulations and supplemented by the approvals made by the PRA under section 138A of FSMA, the PRA Rules and Solvency II regulations on which they are based, as detailed below:
� Approval to use a Partial Internal Model
� Approval to use the volatility adjustment in the calculation of technical provisions
� Approval to use the transitional measure on technical provisions
� Permission to publish a Single Group Solvency and Financial Condition Report. The Directors are also responsible for such internal control as they determine is necessary to enable the preparation of a Single Group Solvency and Financial Condition Report that is free from material misstatement, whether due to fraud or error.

Independent auditors’ opinion (continued)
17
Auditors’ Responsibilities for the Audit of the relevant elements of the Single Group Solvency and Financial Condition Report It is our responsibility to form an independent opinion as to whether the information subject to audit in the relevant elements of the Single Group Solvency and Financial Condition Report is prepared, in all material respects, in accordance with financial reporting provisions of the PRA Rules and Solvency II regulations on which they are based. Our objectives are to obtain reasonable assurance about whether the relevant elements of the Single Group Solvency and Financial Condition Report are free from material misstatement, whether due to fraud or error, and to issue an auditors’ report that includes our opinion. Reasonable assurance is a high level of assurance, but it is not a guarantee that an audit conducted in accordance with ISAs (UK) will always detect a material misstatement when it exists. Misstatements can arise from fraud or error and are considered material if, individually or in the aggregate, they could reasonably be expected to influence the decision making or the judgement of the users taken on the basis of the Single Group Solvency and Financial Condition Report. A further description of our responsibilities for the audit is located on the Financial Reporting Council’s website at: www.frc.org.uk/auditorsresponsibilities. This description forms part of our auditors’ report. This report, including the opinion, has been prepared for the Board of Directors of the Company in accordance with External Audit rule 2.1 of the Solvency II firms Sector of the PRA Rulebook and for no other purpose. We do not, in providing this report, accept or assume responsibility for any other purpose or to any other party save where expressly agreed by our prior consent in writing.
Other Matter The Company has authority to calculate the Company and Group Solvency Capital Requirements using a Partial Internal Model (‘the Internal Model’) approved by the Prudential Regulation Authority in accordance with the Solvency II Regulations. In forming our opinion (and in accordance with PRA Rules), we are not required to audit the inputs to, design of, operating effectiveness of and outputs from the Internal Model, or whether the Internal Model is being applied in accordance with the Company's application or approval order.
Report on Other Legal and Regulatory Requirements In accordance with Rule 4.1 (3) of the External Audit Part of the PRA Rulebook for Solvency II firms we are also required to consider whether the Other Information is materially inconsistent with our knowledge obtained in the audit of the Company’s statutory financial statements. If, based on the work we have performed, we conclude that there is a material misstatement of this other information, we are required to report that fact. We have nothing to report in this regard. PricewaterhouseCoopers LLP Chartered Accountants London 3 April 2020

Independent auditors’ opinion (continued)
18
Appendix – relevant elements of the Single Group Solvency and Financial Condition Report that are not subject to audit The relevant elements of the Single Group Solvency and Financial Condition Report that are not subject to audit comprise:
� The following elements of Group template S.02.01.02:
• Row R0550: Technical provisions – non-life (excluding health) – risk margin
• Row R0590: Technical provisions – health (similar to non-life) – risk margin
• Row R0640: Technical provisions – health (similar to life) – risk margin
• Row R0680: Technical provisions – life (excluding health and index-linked and unit-linked) – risk margin
• Row R0720: Technical provisions – Index-linked and unit-linked – risk margin
� The following elements of Group template S.22.01.22
• Column C0030 – Impact of transitional on technical provisions
• Row R0010 – Technical provisions
• Row R0090 – Solvency Capital Requirement � The following elements of Group template S.23.01.22
• Row R0020: Non-available called but not paid in ordinary share capital at group level
• Row R0060: Non-available subordinated mutual member accounts at group level
• Row R0080: Non-available surplus at group level
• Row R0100: Non-available preference shares at group level
• Row R0120: Non-available share premium account related to preference shares at group level
• Row R0150: Non-available subordinated liabilities at group level
• Row R0170: The amount equal to the value of net deferred tax assets not available at the group level
• Row R0190: Non-available own funds related to other own funds items approved by supervisory authority
• Row R0210: Non-available minority interests at group level
• Row R0380: Non-available ancillary own funds at group level
• Row R0680: Group SCR
• Row R0740: Adjustment for restricted own fund items in respect of matching adjustment portfolios and ring fenced funds
• Row R0750: Other non available own funds
� The following elements of Company template S.02.01.02:
• Row R0550: Technical provisions – non-life (excluding health) – risk margin
• Row R0590: Technical provisions – health (similar to non-life) – risk margin
• Row R0640: Technical provisions – health (similar to life) – risk margin
• Row R0680: Technical provisions – life (excluding health and index-linked and unit-linked) – risk margin
• Row R0720: Technical provisions – Index-linked and unit-linked – risk margin
� The following elements of Company template S.12.01.02
• Row R0100: Technical provisions calculated as a sum of BE and RM – Risk margin
• Rows R0110 to R0130 – Amount of transitional measure on technical provisions

Independent auditors’ opinion (continued)
19
� The following elements of Company template S.22.01.21
• Column C0030 – Impact of transitional on technical provisions
• Row R0010 – Technical provisions
• Row R0090 – Solvency Capital Requirement
� The following elements of Company template S.23.01.01
• Row R0580: SCR
• Row R0740: Adjustment for restricted own fund items in respect of matching adjustment portfolios and ring fenced funds
� The following elements of Company template S.28.01.01
• Row R0310: SCR
� Elements of the Narrative Disclosures subject to audit identified as ‘unaudited’
� Elements of the Narrative Disclosures and tables in relation to ‘RLI DAC’ or ‘Other Group companies’ that provide separate solo information on those entities

Business and performance
20
A. Business and performance
Plain English introduction
In this section, we describe our business, which is the UK’s largest mutual life insurance, pensions and investment company:
� We describe our legal structure.
� We explain how we are regulated and who our external auditors are.
� We also describe how the business has performed during the year.
A.1 Business A.1.1. Name and legal form This report relates to The Royal London Mutual Insurance Society Limited (RLMIS) and all of its subsidiary undertakings, together referred to as the Group. The insurance entities of the Group are:
� RLMIS; and
� Royal London Insurance Designated Activity Company (RLI DAC). RLMIS was founded in 1861, initially as a friendly society, and became a mutual life insurance company in 1908. It is authorised by the PRA and jointly regulated by the FCA and the PRA. RLI DAC is a private company limited by shares and was incorporated, registered and domiciled in the Republic of Ireland in 2018. RLI DAC was authorised and regulated by the CBI with effect from 1 January 2019. The Group is organised and managed by business units; these reflect the level at which key strategic decisions are made, and how operating performance is reported internally. Further information on the business units is set out in section A.1.5 and A.1.6. A.1.2. Supervisory authority details The PRA, the FCA and the CBI are the supervisory authorities responsible for the regulation and financial supervision of the regulated entities in the Group. The contact details are set out in the table below: Supervisory authority Details
FCA 12 Endeavour Square,
London,
E20 1JN
+44 (0)20 7066 1000
PRA 20 Moorgate,
London,
EC2R 6DA
+44 (0)20 7601 4444
CBI New Wapping Street,
North Wall Quay,
Dublin 1
+353 1 224 6000
A.1.3. External auditors The Group external auditors are PricewaterhouseCoopers LLP (PwC), based at the following address: PricewaterhouseCoopers LLP, 7 More London Riverside, London, SE1 2RT A.1.4. Membership As a mutual society, the Group has no shareholders and is owned by its members. Membership is granted to those taking out policies that entitle the holder to participate in the profits. All members have equal voting rights and as at 31 December 2019 there were over 1.6 million members, an increase of 0.2 million members from last year.
Business and performance (continued)
21
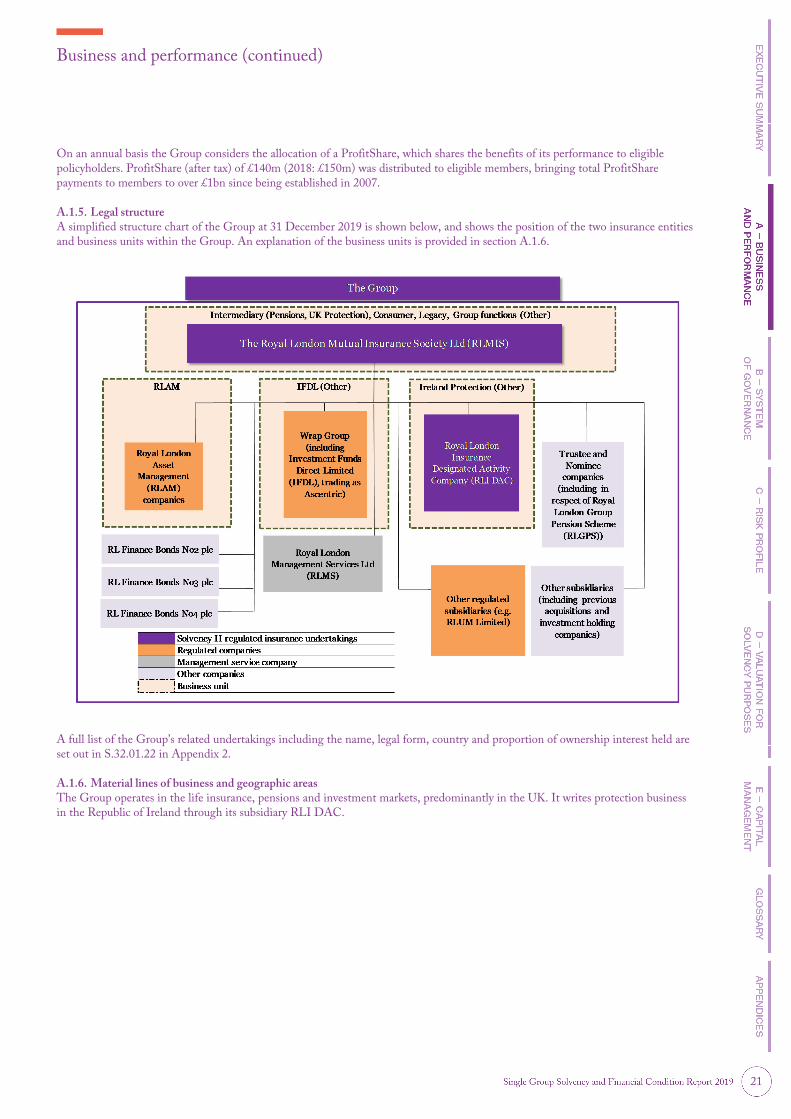
On an annual basis the Group considers the allocation of a ProfitShare, which shares the benefits of its performance to eligible policyholders. ProfitShare (after tax) of £140m (2018: £150m) was distributed to eligible members, bringing total ProfitShare payments to members to over £1bn since being established in 2007. A.1.5. Legal structure A simplified structure chart of the Group at 31 December 2019 is shown below, and shows the position of the two insurance entities and business units within the Group. An explanation of the business units is provided in section A.1.6.
A full list of the Group’s related undertakings including the name, legal form, country and proportion of ownership interest held are set out in S.32.01.22 in Appendix 2. A.1.6. Material lines of business and geographic areas The Group operates in the life insurance, pensions and investment markets, predominantly in the UK. It writes protection business in the Republic of Ireland through its subsidiary RLI DAC.

Business and performance (continued)
22
The Group is organised into the following business units: Division Description
Intermediary Intermediary distributes products via independent financial advisers to clients.
� Pensions: provides pensions and other retirement products to individuals and to employer pension schemes in the UK.
� UK Protection: provides protection products to individuals in the UK.
Consumer Consumer sells insurance and protection products direct to customers who can’t access or don’t want financial advice.
RLAM RLAM provides investment management services to the other entities within the Group and to external clients, including pension funds, local authorities, universities and charities, as well as individuals.
Legacy Legacy comprises the operations of the Group which are closed to new business.
Other Other comprises:
� RLI DAC which provides protection products to individuals in the Republic of Ireland;
� IFDL which is the wrap platform offering financial advisers a range of investments and tax wrappers; and
� centrally held items such as Group functions.
The Group operates three lines of insurance business based on the characteristics of the different products administered. The table below shows the relevant lines of business for the Group and insurance entities. Line of business Group RLMIS RLI DAC
Insurance with profit participation √ √ √
Index-linked and unit-linked insurance √ √ √
Health insurance √ √ -
A.1.7. Significant events in the reporting period Impact of the UK’s departure from the EU (Brexit) Brexit was a key focus in 2019 with the major impact for the Group being the need to convert the Irish business into a new Ireland-domiciled subsidiary. RLI DAC was authorised with effect from 1 January 2019 by the CBI to transact life insurance business in the Republic of Ireland. This results in Royal London becoming an insurance Group for SII purposes from that date. RLI DAC is wholly owned by RLMIS. On 7 February 2019, certain technical provisions and related assets and liabilities were transferred from RLMIS to RLI DAC by way of a transfer made under Part VII of the Financial Services and Markets Act 2000 (‘the Part VII transfer’), effective for accounting purposes on 1 January 2019. These changes enable us to sell new business in the Republic of Ireland and administer Irish and German life insurance business previously underwritten by RLMIS, post-Brexit. Immediately after the Part VII transfer, internal reinsurance agreements were effected between RLMIS and RLI DAC to reinsure contracts within the Liver Ireland Fund and German Bond Fund back to RLMIS, thereby maintaining the same economic position for these policyholders as if the Part VII transfer had not taken place. Some of the protection contracts have remained in RLI DAC, and where these are reinsured with external counterparties, these reinsurance agreements have been novated to RLI DAC. The Group continues to monitor events and potential business impacts and will work with the regulators to maintain a strong regulatory environment. Internal Model In September 2019, the PRA approved the use of an Internal Model to calculate the capital requirements of the Group and RLMIS with effect from 1 October 2019. The capital assessment of RLI DAC is on a Standard Formula basis. Further details of the Internal Model are included in section E.4.1.

Business and performance (continued)
23
Recalculation of Transitional Measure on Technical Provisions
TMTP smooths the transition from the previous solvency regime (Solvency I) to the SII regime, and spreads the capital impact over a 16 year period from 1 January 2016, so that it reduces to nil by 1 January 2032 and provides no benefit at that point. This is included within the valuation of technical provisions. The TMTP is recalculated at least every two years, with additional recalculations triggered on material changes to the risk profile. TMTP was last recalculated in 2017 and therefore has been recalculated in 2019. At 31 December 2019, the TMTP for the Group contributed 67% to the Investor View capital cover ratio and 18% to the Regulatory View capital cover ratio. At 31 December 2019, the TMTP for RLMIS contributed 70% to the Investor View capital cover ratio and 18% to the Regulatory View capital cover ratio. Further details on the TMTP are included in section D.2.8. Subordinated debt issuance On 7 October 2019, RL Finance Bonds No. 4 plc, a wholly owned subsidiary of the Group, issued the Fixed Rate Reset Callable Guaranteed Subordinated Notes due 2049 (the 2049 Notes). The nominal value at the date of issue was £600m. Interest is payable on the 2049 Notes at a fixed rate of 4.875% per annum for the period to 7 April 2039, payable annually in arrears on 7 October each year. At 31 December 2019, the Group has subordinated loan notes in issue with a fair value of £1,508m (31 December 2018: £806m). Further details on the subordinated debt are included in section E.1.2.2. Rating agencies In July 2019, Standard and Poor’s affirmed Royal London’s counterparty credit rating of A, with a stable outlook. Moody’s rates Royal London A2 for insurance financial strength rating with a stable outlook. A.2 Underwriting performance A.2.1. Underwriting performance The performance of the business for 2019 and 2018 was primarily measured using EEV. EEV operating profit before tax is used to demonstrate the underwriting performance of the business. Further details on EEV operating profit are outlined in note (g) on pages 228 and 231 of the 2019 ARA. Alongside EEV reporting, the Group and RLMIS also report its results under IFRS. The key differences are outlined in notes (l) and (j) on page 233 of the 2019 ARA. The Group and RLMIS have decided that UK GAAP is a more suitable financial reporting basis for a UK mutual than IFRS and will transition to UK GAAP with effect from 1 January 2020. Accordingly the key performance indicator EEV operating profit will be replaced by UK GAAP operating profit, and the 2020 interim results announcement will provide further information about the transitional changes.

Business and performance (continued)
24
The EEV operating profit by business unit is shown in the following table. EEV operating profit by business unit
£m 2019 Restated
20181
Intermediary
� Pensions 245 388
� UK Protection 76 (16)
Consumer 16 25
Legacy 89 80
Other2 (154) (160)
Total RLMIS EEV operating profit before tax 272 317
RLAM 157 105
Other3 (13) (26)
Total Group EEV operating profit before tax 416 396
1 2018 figures have been reclassified into the 2019 operating segments, following the transfer of RLI DAC from Intermediary division into Other items, with no change
to EEV operating profit before tax.
2 Other comprises mainly centrally held items such as Group functions.
3 Other comprises Ireland Protection and IFDL.
EEV operating profit before tax increased to £416m during 2019 (2018: £396m). This rise in EEV operating profit was driven by a higher new business contribution of £319m (2018: £301m), through record external net inflows of £6,696m (2018: £4,100m) in RLAM and positive assumption changes of £72m (2018: £90m). The following table provides a reconciliation of the total Group EEV operating profit before tax to the Group IFRS transfer to the unallocated divisible surplus (UDS). As a mutual, the transfer to the UDS is a key measure of accumulation of funds available for us to share, at our discretion, with eligible members. Reconciliation of EEV operating profit before tax to Group IFRS transfer to the UDS £m 2019 2018
EEV operating profit before tax 416 396
Amortisation of intangibles - (7)
Valuation differences between EEV and IFRS (221) (71)
Economic assumption changes and investment return variances 473 (204)
Pension scheme’s costs recognised in profit (36) (27)
Financing costs (56) (48)
ProfitShare (140) (150)
IFRS result before tax and before (deduction from)/transfer to the UDS 436 (111)
Tax (charge)/credit (211) 63
Transfer to/(deduction from) the UDS 225 (48)
(Deduction from)/transfer to the UDS (other comprehensive income) (40) 53
IFRS profit before tax was £436m (2018: loss before tax of £111m), with IFRS total transfer to UDS, including other comprehensive income (OCI) increasing to £185m (2018: £5m). The large increase from 2018 was a result of positive investment returns, primarily due to strong performance in global and UK bond and equity markets, partially offset by an increase in the value of policyholder benefits and claims driven by a fall in yields used to discount liabilities. Premiums, claims and expenses by SII line of business for the Group and RLMIS are included in S.05.01.02 in Appendix 2 and Appendix 3 respectively. The QRT provides details of premiums, claims and changes in technical provisions, which are components of underwriting performance, by SII line of business.

Business and performance (continued)
25
A.3 Investment performance A.3.1. Investment return split by asset class The Group and RLMIS use investment return as a measure of investment performance. The investment return is measured both in absolute terms and against benchmarks looking at different asset returns, such as property, equities and bonds. High levels of uncertainty continued to drive volatility in investment returns throughout 2019, driven by global factors such as US-China trade disputes as well as UK-specific issues such as Brexit and the general election late in the year. Despite this level of volatility, 2019 returns on key asset classes such as equities and bonds (and other financial investments which track those indices, such as collectives) were positive following negative returns in 2018. These were caused by the increased level of volatility, driven by political and economic uncertainty, as well as the talk of trade wars. The following tables show investment return, including income and expense components for the Group and RLMIS by SII asset class, for the year ended 31 December 2019. Investment return – Group
Bonds
£m Equities
£m
Investment property
£m
Other financial
investments1 £m
Total 2019
£m
Dividends - 391 - 835 1,226
Interest 710 3 - 151 864
Net realised gains/(losses) 904 151 - 972 2,027
Net unrealised gains/(losses) 792 905 (132) 5,485 7,050
Rental income - - 206 - 206
Total investment return 2,406 1,450 74 7,443 11,373
Investment expenses (392)
Net investment return after deduction of investment management expenses 10,981
1 Other financial investments include unit trusts and collectives, derivatives, deposits with credit institutions and other investments.
Investment return – RLMIS
Bonds
£m Equities
£m
Investment property
£m
Other financial
investments1 £m
Total 2019
£m
Total 2018
£m
Dividends - 391 - 835 1,226 1,137
Interest 710 3 - 151 864 679
Net realised gains/(losses) 904 151 - 972 2,027 (441)
Net unrealised gains/(losses) 792 923 (132) 5,485 7,068 (4,144)
Rental income - - 206 - 206 178
Total investment return 2,406 1,468 74 7,443 11,391 (2,591)
Investment expenses (98) (112)
Net investment return after deduction of investment management expenses 11,293 (2,703)
1 Other financial investments include unit trusts and collectives, derivatives, deposits with credit institutions and other investments.
There were no gains or losses recognised directly in equity (i.e. UDS) during the reporting period.

Business and performance (continued)
26
A.3.2. Information on securitisations Securitisations are where various types of contractual debt (including for example commercial mortgages) are pooled together and the related cash flows are sold to third-party investors, with repayments made from the principal and interest cash flows. There are two main categories of securitisations that are defined in the SII regulations: Type 1 and Type 2 securities. Type 1 securities are deemed less risky due to the fact that they are listed on a regulated market in the European Economic Area (EEA) or Organization for Economic Co-operation and Development (OECD). Type 2 assets are higher risk; the difference in risk is reflected in their impact on the SCR. At 31 December 2019, the Group and RLMIS held £427m of collateralised securities, representing approximately 3% of the total bonds on the Group balance sheet. Of this total, 38% was in Type 2 securities, which relates to mortgage bonds considered to have higher risk. The remaining amount is all held in Type 1 securities and these are considered to be higher quality. A.4 Performance of other activities A.4.1. Other income and expenses The EEV consolidated income statement on page 224 of the 2019 ARA includes ‘strategic development costs and other items’ of £173m for the Group. These items comprise:
� strategic development costs representing investments that are important for future competitiveness and expected to deliver good returns in the future;
� corporate costs and other development costs, which are typically investments made to improve future EEV profits (for example, by reducing ongoing expense levels or increasing new business volumes); and
� other non-recurring items. As an example, this would include the impact of any changes in the way the business is modelled and improvements to valuation techniques.
A breakdown of other income and expenses by business unit is shown in the table below. Strategic development costs and other items by business unit
£m 2019 Restated
20181
Intermediary
� Pensions 5 9
� UK Protection 2 7
Consumer 1 21
Legacy 5 44
Other2 (171) (182)
Total RLMIS (158) (101)
RLAM (19) (11)
Other3 4 1
Total Group (173) (111)
1 2018 figures have been reclassified into the 2019 operating segments, following the transfer of RLI DAC from Intermediary division into Other items, with no change
to EEV operating profit before tax.
2 Other comprises mainly centrally held items such as Group functions.
3 Other comprises Ireland Protection and IFDL.
A.4.2. Leasing arrangements The Group and RLMIS do not have any leasing arrangements which are individually material. The most material lease arrangements for the Group and RLMIS are in relation to leasehold investment properties. Further details of the lease arrangements for the Group and RLMIS are set out in detail in note 15 and 24 of the 2019 ARA on page 157 and 188 respectively. A.5 Any other information A.5.1. Other disclosures The intra-group transactions for the Group and RLMIS are set out in detail in note 39 of the 2019 ARA on pages 204 to 206.

System of governance
27
B. System of governance
Plain English introduction
In this section, we describe how we run our business (our system of governance). Our Board of Directors (the Board) is ultimately responsible for the financial position of the Group. The Board is answerable to its owners; the members.
We also describe our approach to paying our people (our remuneration policies and practices), as well as how we meet our regulator’s ‘Fit and Proper Requirements’. These standards apply to employees who effectively run the Group or perform other key roles.
Our Board is committed to high standards of corporate governance and risk management. It believes these processes are fundamental to achieving a safe and stable business which delivers against its objectives. We describe how this works in detail in this section of the report.
Unless otherwise stated, the system of governance, risk management system and internal control system is consistent across the Group and its subsidiary undertakings, including RLMIS.
B.1 General information on the system of governance B.1.1. Governance structure The Board is committed to effective governance, sound risk management and a robust control environment, attributes that are critical to business integrity and performance. The Board sets the Group’s strategic aims, ensures that the necessary resources are in place for the Group to meet its objectives and reviews management performance. The Board sets the Group’s values and standards so that its obligations are understood and met. The Board and its Committees have certain matters reserved for its consideration and delegate other matters to the Group Chief Executive. There is a clear allocation of responsibilities among executive directors and senior managers so that the business of the Group can be effectively managed and reported. The Board’s most important duties, which are fulfilled either directly or after taking advice from its Committees and/or executive management, include:
� determining the Group’s values, standards and ethics;
� setting and leading the Group’s culture;
� setting long-term strategic direction and objectives;
� reviewing the operating and financial performance;
� determining the Group’s risk appetite;
� ensuring the effectiveness of risk and controls;
� ensuring the workforce policies and practices are consistent with the Group’s values;
� approving the organisational structure; and
� quantifying the remuneration of employees consistent with the approved policy. A description of the Board’s composition and an assessment of the Board’s effectiveness, together with professional biographies of all the directors, can be found in the 2019 ARA on pages 81 to 82 and pages 75 to 77 respectively.

System of governance (continued)
28
B.1.2. Board and Board Committee structure The following diagram illustrates the Board and the Board Committees as at 31 December 2019.
1 There are a number of executive management committees which support executive management decision-making. The Internal Model Governance Committee
(IMGC) is responsible for reviewing, challenging and approving the overall design, implementation and performance of the Internal Model including its scope and
application. The IMGC will escalate risks and/or issues to the Board Risk Committee where appropriate.
2 The RLI DAC Board will take note of Group Board strategy but will otherwise be autonomous in managing company affairs.
3 The Executive Committee has no authority delegated to it. The authority is derived from the individuals present at the meeting making decisions within their own
personal delegated authorities.
Board Committees Each Board Committee performs a function on behalf of the Board, with key responsibilities summarised in the table below. Further details on the Board Committee membership and significant matters considered by the Committees in 2019 can be found in the 2019 ARA on pages 86 to 103. Board Committee Key responsibilities
Audit Committee
� monitoring the content, integrity and quality of the Group’s financial statements, annual regulatory reporting and external announcements relating to the financial performance of the Group;
� reviewing accounting matters requiring the exercise of judgement, including the valuation of actuarial liabilities for statutory and regulatory reporting;
� reviewing the valuation of assets and particularly areas of valuation uncertainty;
� monitoring and reviewing the effectiveness of the Group’s internal controls over financial reporting;
� reviewing the effectiveness of Group Internal Audit and its reports on an ongoing basis;
� overseeing the relationship with PwC, including assessing their independence and effectiveness, monitoring and approving non-audit services in accordance with the Group’s policy, agreeing the external audit fee, conducting any external audit tenders and recommending appointment of external auditors to the Board where appropriate; and
� appointment and removal of the Group Audit Director.

System of governance (continued)
29
Board Committee Key responsibilities
Board Risk Committee
� overseeing and challenging the control, development, use and ongoing appropriateness of the Internal Model, and scrutinising and challenging the key underpinning expert judgements;
� advising the Board on the Group’s overall RMS including the oversight of current risk exposures of the Group, by reviewing and recommending to the Board actions on significant risk issues, trends, practices, litigation and loss events that have implications for the Group;
� reviewing and making recommendations to the Board on the Group’s capital management framework and monitoring the availability and use of capital in the Group so as to ensure that it is optimally structured to meet ratings and regulatory and risk benchmarks through ongoing review and independent assurance;
� overseeing and challenging the design and execution of stress and scenario tests and reverse stress tests and ensuring the adequacy of the recovery and resolution plans within the Group;
� overseeing both the management of conduct risk to ensure the Group’s customers receive the best experience/outcomes and any material breaches of risk limits, compliance and material incidents, including the implementation of remedial actions where these have Group-wide implications;
� reviewing the procedures for handling allegations from whistle-blowers and the arrangements for employees to raise concerns about financial improprieties, as set out in the Group’s whistle-blowing policy; and
� making recommendations to the Board on the appointment and removal of the Chief Risk Officer (CRO), including reviewing the adequacy/quality of the risk and compliance function and on the Group’s overall risk strategy, risk appetite and risk preferences, the Internal Model and Own Risk and Solvency Assessment (ORSA).
Investment Committee
� overseeing the investment strategy for the Group’s assets;
� overseeing the asset managers (including RLAM as a provider of investment management services to the Group); and
� areas requested by the Board such as reviewing significant proposals concerning investment ideas for the Group.
Nomination & Governance Committee
� reviewing the structure, size and composition (including the skills, knowledge and experience) of the Board and its committees and making recommendations for any changes;
� nominating for Board approval candidates to fill vacancies on the Board and its committees and the Group’s subsidiaries;
� succession planning, taking into account the challenges and opportunities facing the Group and the skills and expertise needed on the Board in the future;
� keeping under review the leadership needs of the organisation, both executive and non-executive, so as to ensure the continued ability of the organisation to compete effectively in the marketplace;
� ensuring all directors commit sufficient time to the Group; and
� ensuring the terms of reference of the Board and its committees are appropriate.
Remuneration Committee
� establishment of and regular review of the general remuneration policy and framework;
� determination of remuneration packages for each director; and
� ensuring the compensation paid to executives is fair and reasonable and linked to the long-term strategy and success of the business.
With-Profits Committee
� considering the interests of all policyholders who are entitled to share in the profits of the Group (including ProfitShare) and exercising independent judgement in advising the Board on how to allocate profits to them fairly;
� assessing compliance with each with-profits fund’s Principles and Practice of Financial Management (PPFM);
� assessing investment performance reports and providing clear advice regarding the way in which with-profits funds are invested and managed;
� assessing whether the interests of with-profits policyholders, and the respective interests of different groups of with-profits policyholders, are fairly reflected in the management of the funds and PPFM; and
� providing an independent opinion and oversight on a range of matters that affect with-profits policyholders.
Independent Governance Committee
� assessing the ongoing value for money for relevant policyholders delivered by relevant schemes;
� reporting on and escalating issues which are identified;
� assessing whether all the investment choices available to relevant policyholders are regularly reviewed; and
� providing an annual report to the Board on the Committee opinion and concerns raised.
Disclosure Committee
� approving all announcements on new business performance, subject to the authority granted by the Board;
� approving the quarterly QRTs (including the Financial Stability templates) before submission to the relevant supervisory authority, including ad-hoc reporting to the PRA;
� approving the gender pay gap reporting; and
� approving any material non-financial announcement where approval is not already reserved to the Board.

System of governance (continued)
30
Executive Management committees The Group Chief Executive delegates certain responsibilities to his direct reports. The Group Executive Committee (GEC) has been put in place by the Group Chief Executive to support him in the discharge of his responsibilities. A number of committees have been created to assist the Group Chief Executive in his decision-making or to monitor certain activities. In turn the Group Chief Executive’s direct reports may delegate authority to their direct reports and so on. These responsibilities are in their role profiles as well as being part of the role they hold within the Group. The Group Chief Executive and his direct reports may choose to form a committee to assist them in their respective decision-making. The authority for these ‘Executive’ committees comes from the individuals themselves. RLI DAC Board and Board committees RLI DAC was incorporated during 2018 and was authorised to write new life insurance business in the Republic of Ireland by the CBI with effect from 1 January 2019. RLI DAC has its own board of directors, which includes executive and non-executive directors. The matters reserved for the RLI DAC Board are consistent with the approach taken across the Group, including RLMIS. RLI DAC has established board committees, which aim to provide stand-alone governance and oversight within the Group governance framework. Further details of RLI DAC’s governance structure can be found in section B of the RLI DAC SFCR for the year ended 31 December 2019. B.1.3. Material changes in the governance structure There was significant change in the composition of the Board in 2019. Jon MacDonald, the CRO; Tim Harris, the Deputy Group Chief Executive and Group Finance Director (GFD); the Group Chief Executive, Phil Loney; and the Chairman Rupert Pennant-Rea all departed. Following the appointment of Kevin Parry as Chairman, Barry O’Dwyer was appointed as Group Chief Executive. James McCourt also transitioned to become CRO and David Rush was appointed as Interim GFD. Further details of the names and biographies of the current directors are on pages 75 to 77 in the 2019 ARA, together with summaries of their experience and a note of their other significant commitments. In January 2020, the Group appointed Kal Atwal as a non-executive director to the Board. The Group is currently in the process of appointing a new GFD, new Audit Committee Chair and an additional non-executive director. B.1.4. Key functions The regulations consider risk management, compliance, the actuarial and the internal audit function to be key functions. The PRA’s definition of key functions extends beyond risk, compliance, actuarial and internal audit. The Group’s system of governance also includes additional functions that are considered of specific importance to the sound and prudent management of the Group. These include Group Finance, Legal & Company Secretarial, Group Operations, Group Technology & Change, Intermediary business unit, Consumer business unit and Group People & Corporate Affairs. They are recorded on the responsibilities map. The functions may be identified as having one or more of the following characteristics:
� essential for the Group’s proper functioning, taking account of its business activities and risks;
� is responsible for material financial risks within the Group;
� contains a competence that is difficult to replace; and
� may pose a serious threat to the interests of the Group or policyholders if ineffective.

System of governance (continued)
31
The main roles and responsibilities for each of the SII key functions are summarised below: Key Function Main roles and responsibilities
Risk � As the second line of defence, provides independent oversight and challenge over the identification, assessment and management of all significant risks. This supports the Group to operate within agreed risk appetite.
� Designs and maintains the RMS, facilitating and overseeing its embedding.
� Supports the Board in its ownership of the Internal Model including testing and validation.
See sections B.3 and B.4.1 for more detail.
Compliance � Provides second line oversight and monitoring of regulatory compliance, which supports the business in managing its regulatory risk exposures appropriately.
See section B.4.2 for more detail.
Actuarial � The actuarial function coordinates the calculation of technical provisions, provides opinions on the underwriting policy and reinsurance arrangements, and contributes to the effectiveness of the RMS.
See section B.6 for detail.
Internal audit � Acts as the third line of defence in assessing the adequacy and effectiveness of the RMS and ICS.
� Reviews Group Risk & Compliance (GR&C) activity to assess its capability as a second line of defence.
See section B.5 for detail.
B.1.5. Remuneration policy and practices The Group’s remuneration policy aims to:
� align executives’ interests with those of members and customers;
� support the delivery of the Group strategy within the Group’s risk appetite;
� ensure remuneration is competitive to enable the Group to attract and retain talent; and
� ensure fair outcomes for its employees, members and customers. The Group has a Remuneration Committee (Remco). The Remco’s primary role is to ensure that the pay structure is fully aligned with these aims. The Remco members are all non-executive directors, who are advised by independent remuneration consultants. The Committee fully understands its obligations in respect of the appropriate balance between risk and reward and oversees the development of the remuneration policies and practices. Full details of the principles of the Group’s remuneration policy and practices, including the pay structure and components for the Board, are included in the directors’ remuneration report on pages 104 to 125 of the 2019 ARA, together with the contents of executive and non-executive director remuneration with comparatives for the prior year.
B.1.6. Transactions with shareholders and/or management There were no material transactions between the Group and members of the Board or senior management, other than remuneration. As a mutual, the Group has no shareholders. Value is returned to members and policyholders in the following ways:
� positive investment returns on policies;
� payouts made to maturing policies during the year; and
� ProfitShare. ProfitShare allows us to share the financial success with eligible policyholders. ProfitShare is allocated by an enhancement to the asset shares and unit fund values of eligible policies. The allocation of ProfitShare each year is at the discretion of the Board. The amount and timing of each ProfitShare allocation to eligible members will depend on the Board’s view on matters such as the financial performance, capital position and the risks and volatility in financial markets. This year’s ProfitShare allocation to eligible members was £140m (2018: £150m). There were no other transactions with the members or management of the Group, other than in their capacity as policyholders, during 2019.

System of governance (continued)
32
B.2 Fit and Proper requirements B.2.1. Skills, knowledge and expertise The Senior Managers & Certification Regime (SM&CR) aims to strengthen individual accountability in regulated UK financial services firms. The Group’s SM&CR policy sets out the approach to managing and assessing those employees who govern and run the Group and minimum standards to be adhered to within the Group, including the Fit & Proper (F&P) assessment. The Group is fully compliant with this Regime and a responsibilities map containing Senior Management Functions (SMF) and Key Function Holders (KFH) has been produced and provided to the PRA and the FCA. The specific requirements within the policy in respect of skills and experience can be summarised as follows:
� Senior Management and Certified Functions must meet the standards of fitness and propriety set out in the policy prior to commencing their role and at least annually thereafter.
� The chair of each Group entity is accountable for ensuring that the Board (of their entity) has the relevant skills and training to exercise their duty, including ensuring that non-executive directors are fit and proper to perform their role on an ongoing basis.
� Each SMF role holder is accountable for understanding their role and accountabilities under SM&CR, including compliance with the individual and senior manager Conduct Rules, completion of required training and ensuring they have documented reasonable steps and frameworks.
� Certified function role holders are responsible for ensuring that they have an up-to-date certificate at all times, informing the People function of relevant changes.
� Where applicable, employees must comply with related policies and procedures to ensure competence, Group standards are maintained and performance is managed appropriately.
RLI DAC is required to comply with the detailed rules and standards pertaining to the Fitness and Probity Regime set out by the CBI. The Fitness and Probity Regime applies to persons in senior positions, referred to as Controlled Functions (CF) and Pre-Approval Controlled Functions (PCF). The Fitness and Probity Regime requires all persons in scope to satisfy, on taking up the role and on an ongoing basis, minimum criteria in the areas of competence and capability, acting honestly, ethically and with integrity, and being financially sound. B.2.2. Assessing fitness and propriety The Group adopts appropriate systems and controls for the recruitment and ongoing assessment of any individual in the Group to meet the PRA’s and FCA’s F&P criteria. The processes include assessing the required qualities of a person, both in terms of professional competence and personal propriety. Professional competence is based on the person’s experience, knowledge and professional qualifications and also whether this person has demonstrated due skill, care, diligence and compliance with relevant standards in the area in which he/she has worked. Such a person should also be of good repute and the assessment includes obtaining relevant regulatory references. The Group also seeks external evidence to demonstrate an employee is financially sound and does not have any unacceptable criminal convictions. At Board level, the Nomination & Governance Committee ensures there is a rigorous procedure for appointment to the Board and is responsible for evaluating the skills, knowledge and experience of the Board. The responsibilities of the Nomination & Governance Committee are set out on page 90 of the Corporate Governance statement in the 2019 ARA. At a functional level, an appropriate recruitment process for all roles, including senior management roles, is adhered to within the processes outlined above. The processes that operate before and during a person’s employment include, but are not restricted to:
� identity checks;
� previous employment references;
� financial checks;
� criminal record checks;
� politically exposed persons (PEPs) and sanctions checks; and
� verification of qualifications and satisfactory personal and professional references.

System of governance (continued)
33
In addition, the Group carries out continual assessment: at functional and local levels there are performance appraisal processes in place to assess the F&P requirements on an ongoing basis. In line with the Fitness and Probity Regime, RLI DAC follows set procedures relating to the appointment of individuals to CFs. These include a number of checks to ensure that the person possesses the level of competence, knowledge and experience and appropriate qualifications for their roles. These procedures are carried out at the point of recruitment and annually to ensure that they remain fit and proper for their role. B.3 Risk management system including the Own Risk and Solvency Assessment B.3.1. Risk management strategies and processes The Board ensures that senior management implement risk policies, deliver the business plan within risk appetite and manage the risk profile. This is achieved by implementing robust risk management and internal control systems. These are described in detail on pages 62 to 68 of the 2019 ARA. The RMS enables the Board to gain assurance that the risks faced by the Group are being appropriately identified and managed within risk appetite, and that risks that may result in significant financial loss or reputational damage are being mitigated. This helps to ensure that the achievement of its performance and objectives is not undermined by unexpected events. The Group operates a ‘three lines of defence’ model that clearly defines the ownership of and responsibilities for risk management. Primary responsibility for risk management lies with the business units and specialist operational process functions. A second line of defence is provided by the independent Risk and Compliance function, a specialist function which undertakes monitoring, challenge and policy setting. The third line of defence is provided by Group Internal Audit (GIA), which provides independent assurance. The diagram below provides an overall view of the RMS and its interaction with the capital management framework.

System of governance (continued)
34
These RMS components and their integration into the organisational structure are further explained below. (1) Risk governance Risk governance is the application of sound corporate governance principles to the identification, assessment, management, monitoring and reporting of risks within the risk appetite determined by the Board. (2) Risk culture People at all levels of the organisation are engaged in the management of risk. This is realised through a strong ‘tone from the top’ which emphasises the importance of effective risk management in day-to-day activities and decision-making. Management is accountable for their management of risk and of the embedding of risk management in their business units. (3) Risk strategy The risk strategy sets out how the Group approaches and manages the risks that it is exposed to in the pursuit of its business objectives. These principles, along with the business strategy, help define the risk preferences. Risk preferences articulate the extent to which the Group views certain risks as being desirable or undesirable to take on and manage, or is neutral towards, providing structure to the decision-making processes. The risk strategy and risk preferences are used to provide direction and assistance in making key decisions relating to risk and capital management, including business planning, acquisitions, project/resource prioritisation, product design and pricing, risk management and performance. (4) Risk appetite statements The Board recognises that a well-defined risk appetite supports business decision-making and business planning. It helps establish the framework for defining the Group’s strategy, planning and risk management. Together with risk preferences it provides guidance to management on balancing risk and reward in making key decisions. The risk appetite framework consists of the risk strategy, risk appetite statements, metrics and tolerances. The Board sets and approves the Group risk appetite framework on the recommendation of the Board Risk Committee (BRC). The risk appetite framework and the high-level risk categories under which the Board-approved risk appetite statements are constructed are set out on pages 95 to 97 of the 2019 ARA. RLI DAC has a locally defined risk appetite framework, which is set and approved by the RLI DAC Board. RLI DAC’s risk appetite framework is tailored to provide context for day-to-day monitoring of risk exposure and maintains its risk appetite in line with that of the Group. The key metrics and associated tolerances, which form the basis for risk reporting, help the Group and its business units monitor their risk profile and assess their position against risk appetite. The regular management information (MI) received by the Board and BRC, including the RLI DAC Board and RLI DAC Risk Committee, includes a risk appetite dashboard setting out actual risk positions relative to the targets and limits set in the risk appetite. (5) Group policies Group policies set out the standards to be maintained in order to manage risk effectively. The Board ensures that policies are regularly reviewed to reflect the changing commercial and regulatory environments as well as the organisational structure. The principal risks facing the Group are set out on pages 65 to 68 of the 2019 ARA. The Group has established strategies for managing insurance, market, credit, liquidity, operational, conduct, strategic and Medium-Term Plan (MTP), and emerging risks. Formal policies define the approach to risk management and the minimum control standards that should be applied in managing significant risk exposures. This is explained further in section C – Risk Profile. RLI DAC maintains its own set of risk management policies. It is obliged under the CBI Corporate Governance Requirements and the governance requirements of SII to review these on an annual basis. Its policies align to Group policies subject to tailoring to reflect local regulatory and business requirements. (6) Risk and control cycle a) Risk universe
A key element of effective risk management is to ensure that the business has a complete and robust understanding of the risks it faces. The risk universe is a common categorisation of risks, split into three levels, with each level providing a deeper level of detail than the previous one.
System of governance (continued)
35
b) Risk identification and assessment
The Group operates a risk identification and assessment process under which business units regularly consider changes in the profile of existing and emerging risks. The assessment process evaluates the risks that are inherent in products as well as those that are caused by changes in the environments in which it operates. The Group’s risk identification and assessment process forms part of its broader ORSA process designed to evaluate the resilience of the Group’s balance sheet to a range of market conditions and external events and to monitor target levels of capital. c) Key processes The common categorisation of key processes ensures the business has a consistent understanding of the key processes that it operates. This also supports the Group in identifying key risks and controls specific to these processes and assigning them to appropriate owners. d) Risk management and monitoring Key risk indicators (KRIs) at Group and business unit level are developed to assess performance against the risk appetite. Legal entity or business unit-specific KRIs are used, allowing different risk profiles to be monitored effectively. KRIs provide beneficial information to management about whether a risk has crystallised or the probability of it crystallising is decreasing or increasing. This information allows management to take early mitigating actions. A range of risk management techniques is deployed to manage and mitigate risks, thereby controlling risk exposures in line with risk limits. These mitigating techniques are described in more detail in section C – Risk Profile. e) Risk management information and reporting
The Group’s MI is structured to enable all significant risk positions to be monitored: actual risk exposures and capital positions are compared to targets/limits and those tolerances which have been established as part of the risk appetite framework. (7) Risk implementation and assurance The Group operates a ‘three lines of defence’ model in line with industry standards as described on pages 62 to 64 of the 2019 ARA. This provides assurance to the Board that the RMS, together with the internal control system (see section B.4), has been designed, adhered to and maintained to the highest standard. Risk assurance activities also help to identify deficiencies or limitations which require mitigating actions so that the RMS is aligned with external best practice. In order to demonstrate that the RMS has been designed and is operating effectively, and to identify potential improvements, a programme of risk assurance is in place. This includes several components that involve all three lines of defence.
� Risk and business control policy owners are required to review the extent to which their policies have been properly embedded.
� The Risk and Control Self-Assessment (RCSA) process requires first line managers to assess their own risk management and control processes.
� The Financial Reporting Data & Control Framework (FRDCF) requires certain staff to assess their financial controls, and management to certify the adequacy of the internal controls over the financial reporting data and financial reporting risks.
� The risk and control attestation process requires executive management and their direct reports across the Group’s functions and business units to certify the adequacy of the risk and control data maintained, and the effectiveness of the RMS operated.
� First line independent control testing is planned using a risk-based approach and carried out on risks and respective controls.
� GR&C carries out independent reviews on the operation of embedding activities and maturity across the Group, reviewing specific risk-related matters that are both thematic and business unit or function specific.
� The CRO works closely with the BRC and the Board on articulating acceptable risk-taking and ensuring the effective operation of the risk and capital framework. GR&C provides objective advice and guidance on a range of risk matters to business managers, including matters such as product development and business transactions. GR&C also plans and carries out structured reviews of compliance with regulatory requirements.
� GIA reviews GR&C activity to assess its capability as a second line of defence in addition to reviewing the adequacy of risk management and associated internal control activity.

System of governance (continued)
36
(8) Stress and scenario testing In order to understand the nature of the risks better and identify weaknesses in the management of risk, various stress and scenario tests are performed. This may involve specialist areas such as GR&C and the actuarial function to assist in providing test scenarios and metrics. These range from simple sensitivity analysis where the impact of a change in an individual assumption is assessed, through more complicated stress tests involving a combination of different changes to the consideration of scenarios that have more wide-ranging impacts. These include reverse stress tests, which consider circumstances that could result in failure of the Group’s business model. Stress testing and scenario analysis are described further in section C – Risk profile. (9) Internal Model The Internal Model reflects processes, systems and calculations that together allow the Group and RLMIS to control the risks they face and quantify the capital needed to support those risks. It includes a calculation engine to quantify capital requirements. The Internal Model is already used for internal capital management purposes and was approved by the PRA for use for regulatory reporting from 1 October 2019. GR&C plays a key role in the validation activity performed over the Internal Model. Further details of the validation activity are presented in section B.3.3. (10) Own Risk and Solvency Assessment The ORSA is described in section B.3.2. (11) Risk-based decision-making The role of the ORSA in informing decision-making is described in section B.3.2. To support the Board and Committees with risk based decision-making, risk information must be provided by the business, using the Internal Model to quantify it where possible for making key decisions. B.3.2. Own Risk and Solvency Assessment The ORSA process is connected to the business planning process and is conducted as part of the overall governance and control system. A separate ORSA is produced for the Group and each of its insurance entities. The ORSA process tests the business strategy, as articulated by the Group’s business plan, against the agreed risk and capital appetite and limits through rigorous and business-relevant stress and scenario testing. The results are then fed back into decision-making processes so that the residual risk remains within the risk appetite. The ORSA is based on a range of inputs, processes and outputs as illustrated in the diagram below.
The key findings, results and conclusions are combined to form reports to the Board. The ORSA is reviewed and approved by the Board on an annual basis. Consideration of any distributions (i.e. to policyholders or movements in own funds to be paid by the Group) will have regard to the actual level of capital compared to target, which is set by reference to the Capital Management Framework.

System of governance (continued)
37
The ORSA is governed by the ORSA policy which is reviewed annually so that it remains fit for purpose and complies with relevant requirements. All elements of the ORSA were considered during the course of the year and the most recent ORSA document was submitted to the PRA in December 2019. The stages below describe how the ORSA is conducted and how it is integrated into the organisational structure by engaging key people in assessing and challenging its key findings.
� Each key function or area provides key data required for the ORSA process. The data inputs are required to be consistent with the Financial Reporting Data Quality Standards (part of the Data Quality Framework), which stipulates that the data supplied must be appropriate, complete and accurate, and meet SII data quality requirements.
� Six main steps are performed to assess the inputs and complete the ORSA. The business units and functions complete elements of these which feed into the overall assessment. Each process needs to be documented in full, both providing a record of the process followed and supporting the drafting of the ORSA report.
� The key findings, results and conclusions are combined to form reports to the BRC and the Board for their challenge and sign-off. The report is also distributed to the various key stakeholders. In addition, a record of the ORSA process is maintained to provide evidence of the process performed.
The conclusions of the ORSA report address/cover the following key themes:
� Evaluation of the risk profile, taking into account emerging risks relative to the Group’s risk appetite framework and capital management framework which is approved by the Board.
� Review of the appropriateness of the risk and capital management frameworks and actions/recommendations where improvements have been identified.
� Verification of whether the Group has operated within its risk appetite and capital requirements.
� Informing the Board and management committees of areas where actions are required in the decision-making processes. B.3.3. Internal Model governance An Internal Model governance policy is in place which details the activities undertaken so that the Internal Model is adequately integrated into the system of governance, is widely used and plays an important role in the business. Key roles and responsibilities are set out in the table below. Role Key responsibilities
Board � put in place systems to ensure that the Internal Model operates properly on a continuous basis;
� ensure the ongoing appropriateness of the design and operation of the Internal Model;
� ensure that the Internal Model continues to appropriately reflect the risk profile of the business; and
� approve the application of any major changes or extensions of scope to the Internal Model.
Board Risk
Committee
� annual review of methodology and assumptions used in reported results, together with the associated outputs;
� use of outputs from the Internal Model as an integral part of risk-based decision-making;
� monitor ongoing compliance with the requirements for model approval, assessment of material non-compliance, approval of any plans required to restore compliance and communication of any such plans to the PRA; and
� independent review procedures, including oversight and challenge of validation (internal and external) and internal audit function assurance.
Chief Risk Officer � Management of the Internal Model, including its design and operation, ensuring that the Internal Model appropriately reflects the Group’s risk profile.
Group Finance
Director
� Financial and actuarial modelling used in the model and the underlying systems.

System of governance (continued)
38
The following committees support these roles and responsibilities: Role Key responsibilities
Internal Model
Governance
Committee
� forum for CRO to discuss, and make decisions within delegated authority, all aspects of the Internal Model; and
� review, challenge and approve overall design, implementation and performance of the Internal Model, including scope and application, and escalate risks and/or issues to BRC where appropriate.
Internal Model
Change Committee
� forum for the Group Chief Actuary to discuss, and make decisions within delegated authority, changes to the Internal Model in line with the Internal Model change policy; and
� review risk calibrations, address feedback from Internal Model validation and review SCR results.
Pillar 2 Review
Committee
� Forum for Head of Financial Risk to review and approve Pillar 2 documentation, to address feedback from Internal Model validation on Pillar 2 matters and to carry out the specific duties set out in the Internal Model change policy.
Validation is carried out on an annual cycle. The validation activity is owned and performed by GR&C. Further details of the validation activity are described in the diagram below.
B.4 Internal control system B.4.1. Internal control system The ICS is designed to provide reasonable assurance to the Board and Senior Management over the effectiveness and efficiency of the Group’s internal control environment. The ICS supports the RMS by putting methods and processes in place to achieve effectiveness and efficiency of operations, reliability of financial reporting, and compliance with applicable laws and regulations. The following diagram illustrates the key elements of the ICS:

System of governance (continued)
39
The ICS is supported by the internal control policy and its components are explained further below: Component Description
RCSA RCSA is an ongoing process performed by first line business management across the Group. It provides a systematic approach for the identification and assessment of risks, contributing factors to weaknesses that could prevent achievement of process, business and Group objectives, and clear oversight of the control environment to enable the Group to operate and evidence effective controls.
In conjunction with control assurance testing and attestation, the RCSA validates processes are operating effectively, and enables timely identification and addressing of any potential failure to control risk as well as potential gaps or inaccurate data in the ICS. The RCSA forms an input to the annual review by the Board and Audit Committee on the effectiveness of internal controls.
Financial processes Finance is responsible for the regular assessment of the adequacy and appropriateness of the control environment over Finance and Actuarial activities that could have an impact on the financial position of the Group. FRDCF and RCSA provide assurance over this regular assessment. This includes internal and external financial reporting, management of payments and receipts, tax management, valuation of assets and liabilities, and compliance with relevant regulatory standards and law.
Finance activities include establishing appropriate controls over:
� the production of accurate and timely financial MI, reports and the monitoring of these both within Finance and from the appropriate data sources;
� the calculation, use and reporting of technical provisions and capital numbers;
� the distribution of surplus; and
� actuarial models including valuation models.
Finance is also responsible for monitoring required and available Group-wide capital levels on both regulatory and internal bases, and reporting on these.
Policy self-assessment The policy self-assessment is performed by first line management across the Group over how well each policy has been embedded and their compliance with each of the policy requirements. As part of the annual assessment all business units are required to:
� have action plans in place to address gaps against requirements;
� provide a self-assessment rating (red, amber or green) based on prescribed criteria; and
� justify the rating, supported by appropriate evidence/documentation.
Executive policy owners, supported by policy content owners (subject matter experts) are responsible for reviewing and challenging the self-assessment and reporting findings to the Executive Risk Committee (ERC).
Delegation of authority Executive management of the Group is delegated by the Board to the Group Chief Executive, who may further delegate to his direct reports. Authority delegated in this way is detailed in the role profiles of the individuals, as well as being inherent in the position which they hold within the Group.
The Group Chief Executive and his direct reports may choose to form Executive Committees to assist them in their respective decision-making. The authority for these committees comes from the individuals themselves and the committees have no executive powers delegated to them.
Levels of delegation principles are set out in the role profiles and monetary authority limits.
Risk events and escalations As part of the Group’s risk event process, an escalation process is in place to capture, communicate and respond to the most significant issues facing the Group at any one time.
These cover events where a breakdown in controls has led to significant loss, customer impact, regulatory censure and/or reputational damage.
The significance of each breach and escalation is assessed in terms of the number of customers impacted and the potential or actual customer detriment. If this is a material breach then the details are notified to the appropriate regulator.
Compliance framework The compliance framework is in place to safeguard the Group, its customers, members, reputation and assets and help the business achieve its objectives by creating a culture of compliance with regulatory requirements, and identifying and mitigating regulatory risk. See section B.4.2 for further detail on the compliance framework and function.

System of governance (continued)
40
GR&C acts as a second line of defence by providing independent oversight and challenge of the RCSA and policy self-assessment so that the Group is operating within agreed risk appetite. GIA performs independent assurance activity by testing and validating the internal controls and informs the Board of the effectiveness of the ICS. The Audit Committee and BRC perform an annual joint review of the GIA and GR&C assurance plans. B.4.2. Compliance function The financial risk team within GR&C performs a second line of defence role to oversee and monitor SII compliance. This forms part of GR&C’s overall responsibilities for overseeing and monitoring compliance with all applicable laws and regulations, including the conduct responsibilities, with the first line having responsibility for implementing controls to manage and mitigate regulatory risks. Under SM&CR, the CRO, with the support of the Head of Compliance, is responsible for overseeing compliance with SII requirements. In overseeing and monitoring compliance with SII requirements, the financial risk team manages a plan of activity so that the Group manages its regulatory risk exposures appropriately and has effective controls in place. This includes the assessment of the adequacy of measures adopted to prevent noncompliance. The Group Compliance Function (GCF) works within an agreed regulatory footprint and is the key point of liaison with all regulators. All monitoring and oversight processes, whether covering prudential or conduct regulatory requirements, follow established and consistent practices. RLI DAC has a dedicated CRO who is responsible for the Company’s compliance function and for monitoring compliance with the Company’s regulatory obligations in the Republic of Ireland, including SII requirements. This responsibility was assumed from the GCF from the date of authorisation of RLI DAC (1 January 2019). The RLI DAC CRO is also the key point of liaison with the CBI in the Republic of Ireland and other relevant Irish and EEA regulatory authorities. B.5 Internal audit function B.5.1. Overview The Group operates a Group-wide Internal Audit function. The primary role of GIA is to help the Board protect the assets, reputation and sustainability of the organisation. GIA operates as the third line in the ‘Three Lines of Defence’ Model. They provide independent assurance that the Group’s risk management, governance and internal control processes are operating effectively. GIA reports to the Group Audit Committee and relevant subsidiary designated Board Committees throughout the year. In doing so they summarise the results and analysis of audit activity in the preceding period. GIA also provides an annual assessment of the adequacy and effectiveness of the ICS and other elements of the System of Governance, including the RMS. The internal audit function of RLI DAC is outsourced to GIA, which reports directly to the RLI DAC Audit Committee. B.5.2. Independence and objectivity GIA is independent of all of the Group’s functions, including Group Risk, Compliance and Finance. All functions may be subject to internal audit. The following diagram illustrates GIA’s organisational structure and reporting lines.
System of governance (continued)
41
The primary reporting line for the GAD is to the Chair of the Group Audit Committee, who is responsible for the appointment and removal of the GAD. The Chair of the Group Audit Committee sets objectives for the GAD and recommends their remuneration to the Remuneration Committee. The remuneration of the GAD and GIA staff is structured in a manner that avoids conflicts of interest, does not impair GIA independence and objectivity, and is not directly or exclusively linked to the short-term performance of the Group. The GAD’s performance is appraised at least annually and as part of this appraisal the GAD’s independence, objectivity and tenure are also considered. In addition, the GAD confirms to the Group Audit Committee the organisational independence of the GIA team. GIA also has a process for managing and reporting conflicts of interest and safeguards exist to limit any impairment to independence or objectivity. B.6 Actuarial function The actuarial function (as defined by SII) for the Group and RLMIS, led by the Group Chief Actuary (GCA), sits within the Finance function and the GCA reports to the GFD. The actuarial function is responsible for the following key tasks:
� oversight of the calculation of technical provisions;
� expressing an opinion on the adequacy of reinsurance arrangements;
� expressing an opinion on the overall underwriting policy; and
� contributing to the RMS. The actuarial function for RLI DAC performs similar key tasks as previously mentioned for Group and RLMIS. This ensures that RLI DAC has access to all the relevant expertise within the Group. RLI DAC’s Head of Actuarial Function, referred to as the Chief Actuary, reports to the RLI DAC CFO and RLI DAC Board. B.7 Outsourcing B.7.1. Outsourcing of critical operational functions In line with other large financial services organisations, the Group has a number of material relationships with outsourcers and suppliers. An outsourcer is a third party hired by the Group to perform a service, process or activity (excluding short-term engagements of less than a year) that would or could realistically be performed in-house by the Company’s own employees and staff. Supplier is the term given to all “non-outsourcer” third parties that the Group procures services or products from. The Group’s material outsourcers and suppliers include those providing services relating to back office policy and investment administration, customer support and complaints handling, IT application support and hosting, actuarial modelling, underwriting, and printing/mailing services. These partners have scaled and common processes, often across multiple clients, which provide several benefits for the Group. This includes minimising fixed costs as policies run off and improving the technology used within the Group’s administrative capability. Whilst processing or specialist work is undertaken by these organisations, which is an effective use of Group resources, the Group remains fully responsible for the oversight, management and performance of the activity. Key roles such as finance, actuarial, risk and compliance, and oversight of these partners are retained in house. This enables the Group to retain full control over the core capabilities necessary to manage its business objectives effectively. The framework for the governance and oversight of material outsourcer and supplier arrangements (categorised as ‘Tier 1 and Tier 2’) is set out on page 68 of the 2019 ARA.

System of governance (continued)
42
The following is a list of the material outsourcer and supplier arrangements within the Group and the jurisdiction in which they are incorporated. Service provider company name Description of services Jurisdiction
Capita Life and Pensions Life and pensions policy administration and transfer agency administration for unit trust business.
UK
HUB Financial Solutions Specialist annuity brokering service for Royal London Legacy customers. UK
Dataspace Storage of physical copies of customer data/commercial data. UK
APS Printing of customer documentation. UK
Fujitsu Data hosting and IT application support services. UK
Milliman Actuarial modelling solution. UK/US
Sopra Steria IT application support and maintenance. UK
IBM IT mainframe services. UK
Oracle Provide application and hosting services for Financial Services and managed cloud services.
UK
UnderwriteMe Underwriting for Intermediary protection. UK
BT Telecoms and associated networks/services. UK
Cognizant IT consulting and Business Process Services. UK
HSBC Investment assets administration and investment accounting. UK
DST UK Transfer Agency, maintaining records for investment transactions. UK
Bravura Design and provisions of the pensions systems for #thinkbeyond and wrap platform for IFDL.
UK/Australia
Blue Circle Life Provision of Actuarial application/code for RLI Protection diabetes product and servicing of end to end sales journey.
UK (parent company in South Africa)
XPS Actuarial consulting and pension administrative services. UK
Equinix Designs and operates network-neutral datacentres in the UK. UK
Virgin Media Provider of communication services. UK
NTT Software development, coding and testing. UK/India
Accenture Contracted resource to undertake software development in connection with programme management.
UK
Tibco Provision of system integration software, hosted services and associated support services.
Ireland
B.7.2. Outsourcing policy The Group has developed a Group Outsourcing & Supplier Management Policy (GOSMP) that applies to the management of all material (Tier 1 and Tier 2) outsourcers and suppliers across the Group. The purpose of the policy is to ensure that the Group is effectively managing its material relationships in a manner that minimises risk and cost and maximises value to the Group and its members. It supports the Group in meeting its outsourcing risk appetite by providing a standardised framework for the oversight and monitoring of supplier performance across the following three key areas:
� contract governance;
� risk management; and
� business continuity. The policy requirements include key controls that have been designed to satisfy FCA rules and SII regulations. The business relationship owners for all material outsourcers or suppliers are accountable for ensuring that these controls are effectively implemented. They must provide evidence to support the attestation of compliance with the policy on an annual basis. The Group has developed a segmentation tool which uses a scoring mechanism to identify all material relationships. The segmentation tool scores all of the Group’s outsourcers and suppliers against spend, value generation, risk and business criticality criteria. The outputs of the exercise enable the Group to categorise all of its outsourcers and suppliers into four Tiers, with all those aligned to Tier 1 and Tier 2 requiring full compliance to the GOSMP.

System of governance (continued)
43
The segmentation process is undertaken at the start of the sourcing cycle before the Group enters into a new tender exercise, in the event of a change to the arrangement/contract and on an annual basis thereafter. Examples of material (i.e. high risk and business critical) outsourcer or supplier services are:
� back office policy and investment administration;
� customer support and complaints handling;
� IT application support and hosting;
� actuarial modelling;
� underwriting; and
� printing/mailing services. Intra-group outsourcing arrangements Within the Group there are various intra-group outsourcing arrangements. The most significant of these include:
� RLAM provides asset management services to the Group; and
� RLMS provides administration services to the Group. Given the entities are wholly within the Group’s control they are covered directly by the same governance, risk management framework and control environment as the wider Group. For the intra-group outsourcing services the Group takes full responsibility for oversight and control of the function, and the service or activity is managed in a robust manner. A project is currently under way to assess the arrangements relating to intra-group agreements and oversight models. This includes policy requirements and controls to oversee these arrangements. B.8 Any other information The Group monitors and assesses its system of governance on an ongoing basis as described in the above sections. The Board is responsible for oversight of the system of governance and considers it to be effectively providing for the sound and prudent management of the business and that is adequate to meet the requirements of the SII Directive as described in the above sections. There is no other material information on the system of governance to be disclosed.

Risk profile
44
C. Risk profile
Plain English introduction
Managing risk is fundamental to the business activities to generate returns for policyholders. We have a system in place to identify, manage, monitor and report risks, supported by risk tools and processes such as contingency planning, escalation of events, assessing scenarios and reverse stress tests.
In this section we describe our risk profile, including separately for each category of risk:
� risk exposure;
� risk concentration;
� risk mitigation; and
� risk sensitivity.
Our risk profile is stable and generally changes only gradually from year to year.
Unless otherwise stated, the risk profile is consistent across the Group and RLMIS.
As a financial service provider, the Group’s business is the managed acceptance of risk which operates within a RMS. The Group has a set of risk preferences which defines the types of risk the Group views as being desirable, neutral or undesirable. This forms the direction of the Group’s RMS and control approach. The system is designed to manage and mitigate the risks of failure to achieve business objectives, so that the Group is well capitalised. The material risks faced by the Group are:
� underwriting risk;
� market risk;
� credit risk;
� liquidity risk;
� operational risk; and
� other material risks, including strategic, medium term planning and emerging risks. The undiversified SCR of the Group and insurance entities as at 31 December 2019 is shown below. Undiversified SCR by insurance entity Risk profile Section reference Group RLMIS RLI DAC
Underwriting risk1 C.1 51% 52% 74%
Market risk C.2 37% 38% 10%
Credit risk C.3 2% 2% 11%
Operational risk C.5 8% 8% 5%
Other risks2 C.6 2% - -
Total 100% 100% 100%
1 The Group uses the term ‘insurance risk’ to refer to ‘underwriting risk’. This term is used throughout section C.
2 This is the Group’s capital requirements relating to the non-insurance entities.
The Group does not hold SCR for liquidity risk for the reasons explained in section C.4. The Group and insurance entities are exposed to similar risks although the extent of exposures varies depending on the nature of business written by each insurance entity and the associated assets held. Sections C.1 to C.6 set out a description of the material risks that the Group and the insurance entities are exposed to. This includes the risk concentrations, risk mitigation techniques and sensitivity analysis for each material risk. There have been no material changes to the risk profile during 2019.
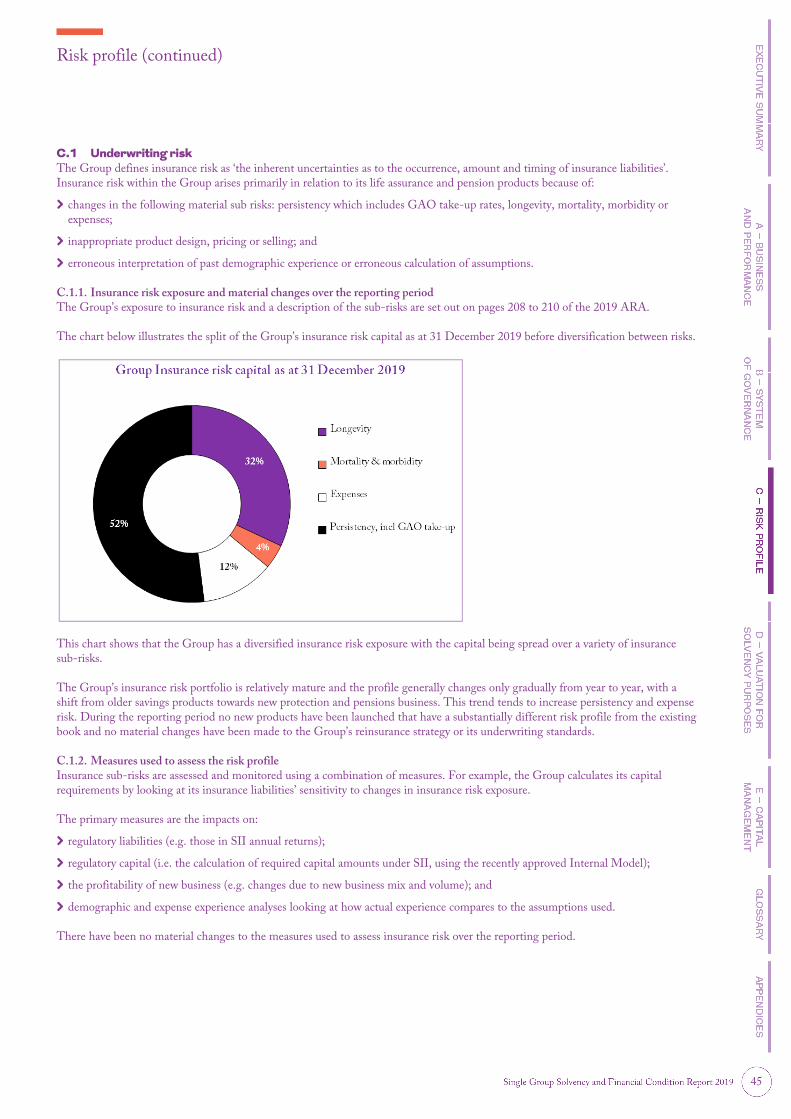
Risk profile (continued)
45
C.1 Underwriting risk The Group defines insurance risk as ‘the inherent uncertainties as to the occurrence, amount and timing of insurance liabilities’. Insurance risk within the Group arises primarily in relation to its life assurance and pension products because of:
� changes in the following material sub risks: persistency which includes GAO take-up rates, longevity, mortality, morbidity or expenses;
� inappropriate product design, pricing or selling; and
� erroneous interpretation of past demographic experience or erroneous calculation of assumptions. C.1.1. Insurance risk exposure and material changes over the reporting period The Group’s exposure to insurance risk and a description of the sub-risks are set out on pages 208 to 210 of the 2019 ARA. The chart below illustrates the split of the Group’s insurance risk capital as at 31 December 2019 before diversification between risks.
This chart shows that the Group has a diversified insurance risk exposure with the capital being spread over a variety of insurance sub-risks. The Group’s insurance risk portfolio is relatively mature and the profile generally changes only gradually from year to year, with a shift from older savings products towards new protection and pensions business. This trend tends to increase persistency and expense risk. During the reporting period no new products have been launched that have a substantially different risk profile from the existing book and no material changes have been made to the Group’s reinsurance strategy or its underwriting standards. C.1.2. Measures used to assess the risk profile Insurance sub-risks are assessed and monitored using a combination of measures. For example, the Group calculates its capital requirements by looking at its insurance liabilities’ sensitivity to changes in insurance risk exposure. The primary measures are the impacts on:
� regulatory liabilities (e.g. those in SII annual returns);
� regulatory capital (i.e. the calculation of required capital amounts under SII, using the recently approved Internal Model);
� the profitability of new business (e.g. changes due to new business mix and volume); and
� demographic and expense experience analyses looking at how actual experience compares to the assumptions used. There have been no material changes to the measures used to assess insurance risk over the reporting period.

Risk profile (continued)
46
C.1.3. Insurance risk concentration The Group’s approach to concentration risk is outlined on page 209 of the 2019 ARA. In summary the Group seeks to mitigate the risk of excess concentrations of risk through the use of reinsurance, portfolio analysis and risk limits. Although the Group’s portfolio of employer-sponsored pension schemes includes some large schemes, none of these represent an excessive percentage of the relevant portfolio. The Group’s diverse portfolio of business helps mitigate concentration risk across sectors (pensions, protection, intermediated, direct). There is some concentration risk within sectors, for example to the extent that legislative changes affecting pensions business could result in a marked worsening in persistency. Due to the nature of the UK market, another potential area of concentration is the reliance of the Group on new business from key adviser networks, but this is not considered to be material. C.1.4. Management and mitigation of insurance risk Insurance risk is largely mitigated, monitored and managed by the various business units, in particular Pensions, UK and Ireland Protection, and Consumer. Risk relating to the Group’s final salary pension schemes is managed separately by a specialist area in the People function, supported by external advisers. Insurance risks are managed through:
� the use of the policy framework, guidelines, limits and authority levels for concluding insurance contracts, assuming insurance risks and handling insurance claims;
� regular monitoring of actual exposures compared to agreed limits so that the insurance risk accepted remains within risk appetite;
� the use of reinsurance to mitigate exposures in excess of risk appetite, to limit the exposure to large single claims and catastrophes and to alleviate the impact of new business strain;
� the diversification of business over several classes of insurance and over large numbers of individual risks to reduce variability in loss experience; and
� control over product development and pricing. Further detail is set out on pages 208 to 209 of the 2019 ARA. The effectiveness of these risk-mitigation techniques is also monitored through the Group’s Insurance Risk policy review process. The policy provides guidelines around the management approach, governance arrangements and the minimum standards to be adhered to within the Group for managing insurance risk. The policy owner must make sure that the policy is reviewed and implemented appropriately within the Group. Reinsurance is used to mitigate insurance risk exposures in excess of risk appetite. This limits the Group’s exposure to large single claims/catastrophes and alleviates the impact of new business strain. The Group does not make use of Special Purpose Vehicles to mitigate insurance risk. The Group has long term relationships with large reinsurers active in the UK and has ceded large volumes of mortality, morbidity, disability and longevity risk into the reinsurance market. The Group monitors the effectiveness of its reinsurance arrangements via the management of:
� Counterparty risk: covering limits on exposure to reinsurance entities or groups as well as current and prospective reinsurers meeting minimum financial strength criteria.
� Contracts in existence: covering contractual amendments, the adherence to existing treaties and the production of reinsurance MI. In relation to the management of existing contracts, the Group benefits from having experienced professionals who have worked for both insurers and reinsurers.
� New reinsurance transactions: covering the governance approving all new reinsurance contracts, the type and rationale for entering into an arrangement, whether to facilitate competitive new business pricing and/or more efficient capital usage or to extract value on existing business through reducing reserves and/or reducing risks on the Group’s balance sheet.
C.1.5. Insurance risk sensitivities The Group routinely assesses the sensitivity of its best estimate liability (BEL) to changes in various insurance risks. The liabilities are recalculated by changing each assumption in isolation. The Group also considers the impact of a number of insurance risk scenarios on the SCR. Further details of the results of the stress testing and sensitivity analysis are provided in section C.7.2.

Risk profile (continued)
47
C.2 Market risk The Group defines market risk as the risk that fluctuations in asset values, income from assets, interest rates or exchange rates cause a divergence in the value of the Group’s assets and liabilities. Where policy benefits are linked to the value of investments, the majority of this risk rests with the customer. C.2.1. Market risk exposure and material changes over the reporting period The Group’s exposure to market risk arises principally from the following sub-risks: equity, property, interest rate, credit spread, currency and concentration. The Group’s exposure to market risk, the sub-risks and associated and management strategies are set out in more detail on pages 211 to 213 of the 2019 ARA. The Group uses derivatives to mitigate certain market risks, in particular equity and interest rate risk. This reduces the overall market risk exposure as the values of the derivatives and associated liabilities move more consistently with each other than if other assets were held. The Group makes very little use of derivatives for other purposes. The use of derivatives generates other types of risk, for example counterparty risk, but this additional risk is outweighed by the reduction in overall market risk. The chart below illustrates the split of the Group’s market risk capital as at 31 December 2019, before diversification between risks.
The chart shows that the Group has a diversified market risk exposure with the capital being spread over a variety of market sub-risks. C.2.2. Measures used to assess the risk profile Market risk is assessed using several measures. The impact on Value at Risk (measuring the capital required to withstand a 1-in-200-year event) is assessed in respect of the different major types of market risk, as is the impact on the Group’s excess capital. Sensitivity testing and scenario analysis are used to assess the impact on these measures of movements in equity values, interest rates and other variables, both in isolation and in combination. We manage market risk by the use of derivatives amongst other things. The market risk associated with derivatives is also assessed using sensitivities to changes in the underlying economic variables, such as interest rates and interest rate volatility, as appropriate to the derivative. Value at Risk analysis over short-term periods is also used. The average duration of the fixed interest portfolios is monitored as part of asset liability management practice. The amount of divergence of the actual asset allocation percentages from the benchmark percentages is also used to measure market risk. Within the equity investment portfolios, market risk is assessed by reference to the divergence of actual stock weightings from the benchmark (or index) weightings. The sector profile of the UK equity portfolio is also used to assess market risk. There were no material changes to the measures used to assess market risk during 2019.

Risk profile (continued)
48
C.2.3. Market risk concentrations The Group’s liabilities are predominantly UK based and so a high proportion of its assets are also UK based. As such, the market risk profile is heavily dependent on the state of, and outlook for, the UK and global economy, particularly in relation to equity and property values. The Group has material liabilities in respect of GAOs and is therefore exposed to changes in interest rates. However, such liabilities are extensively hedged against this risk meaning that each fund’s solvency surplus is currently relatively insensitive to changes in interest rates. The assets within each investment portfolio are well diversified and so there is no material concentration risk. C.2.4. Management and mitigation of market risk The principal techniques employed to manage market risk are asset-liability matching and the establishment of asset allocation and performance benchmarks consistent with the Group’s risk appetite. The Group’s management of market risk is described in more detail on page 211 of the 2019 ARA. The investment management agreement (IMA) in place between the Group and its asset management company, RLAM, specifies the limits for holdings in certain asset categories. The agreement also requires that asset holdings are within the regulatory limits that restrict excessive concentrations within particular asset classes. A comprehensive system of limits is in place to control exposure to market risk within the equity portfolios. In particular, risk appetite limits for different types of market risk are set by reference to the potential impact on capital. The Group has a robust framework in place relating to the use of derivatives. This includes a derivatives risk management policy that requires sufficiently knowledgeable individuals to be involved in the management of derivatives and the approval of hedging strategies at Board level. It also details the legal, collateral and valuation requirements. The risks associated with the use of derivatives, both before and after they are transacted, are identified and closely monitored. Exposures to market risk are monitored by the Capital Management Committee (CMC) and are included in the MI prepared for the BRC. The Group uses derivatives as a risk-mitigation technique for certain types of market risk. Risk type Description
Equity risk and property risk
The Group hedges equity risk arising from investment guarantees and from variations in future annual management charges on unit-linked business. This risk is hedged using options and swaps.
Interest rate risk The Group manages interest rate risk using performance benchmarks with appropriate durations and in some instances, derivatives to achieve a closer cash flow match. The Group uses interest-rate swap overlays to provide interest-rate sensitivity hedging in the RL Open Fund, the SL Fund, the PLAL Fund, the RL (CIS) Fund and its defined benefit pension schemes.
Inflation risk The Group mitigates some inflation risk in its defined benefit pension schemes and in the RL Open Fund and RL (CIS) Fund by the use of inflation swap derivatives.
Currency risk The Liver Fund and its defined benefit pension schemes use a programme of currency forward derivative contracts to manage its euro exposure.
The CMC and the BRC monitor the effectiveness of the various processes in place to manage market risk, in particular by reviewing the continuing appropriateness of the hedges that are in place and of the asset allocation benchmarks. C.2.5. Market risk sensitivities The Group routinely assesses the sensitivity of its BEL to changes in various market risks. The liabilities are recalculated by changing each assumption in isolation. The Group considers the impact of a number of market risk scenarios on the SCR. Further details of the results of the stress testing and sensitivity analysis are provided in section C.7.2. MI provided to the Board and CMC includes the sensitivity of surplus capital to changes in equity values, risk free interest rates, the gilt yield curve and credit spreads.

Risk profile (continued)
49
C.3 Credit risk The Group defines credit risk as the risk of loss if a counterparty fails to perform its obligations or fails to perform them in a timely fashion. Exposure to credit risk may arise in connection with a single transaction or an aggregation of transactions (not necessarily of the same type) with a single counterparty. C.3.1. Credit risk exposure and material changes over the reporting period The Group’s exposure to credit risk, its management and mitigation techniques used are set out on pages 213 to 215 of the 2019 ARA. The majority of the exposure derives from the Group’s holdings of government and corporate bonds. The exposure in respect of the reinsurers’ share of insurance liabilities mostly relates to the annuity reinsurance arrangements of the Group. During 2019 the total amount of non-linked assets subject to credit risk increased, however there was an increase in assets with a higher credit rating, i.e. AAA. C.3.2. Measures used to assess the risk profile Credit risks are assessed and monitored using a combination of measures. The primary measure is the gross amount of the exposure with no allowance made for any expected recoveries in the event of default. The gross amount takes into account exposure arising from different sources of credit risk, in particular from sovereign debt and corporate bonds, cash and derivatives. Exposure in respect of equity holdings is also taken into account, but not treated as credit risk, in order to help assess the overall risk to the Group of a failure of the counterparty. The credit rating of the counterparty is also used to assess the risks based on available ratings from external rating agencies and an internal view of the credit rating. Further due diligence of counterparties is carried out where deemed advisable in order to assess the risk with more confidence. The Group also assesses the risk based on its capital requirements for such risk. Capital requirements for credit risk are calculated using a combination of:
� separately identifiable amount held in respect of failure of a reinsurer or a derivative counterparty; and
� an amount that represents the impact of an overall economic stress that affects bond credit spreads and other factors such as equity movements.
C.3.3. Credit risk concentrations The material credit risk concentrations which the Group and RLMIS are exposed to through direct holdings are set out in the table below. Concentration Description
UK sovereign debt The largest exposure is to UK sovereign debt, of which the Group and RLMIS held £16,334m and £13,249m as at 31 December 2019 respectively. These fixed interest and index-linked stocks are held primarily to back liabilities, in particular guaranteed liabilities.
Eurozone sovereign debt The Group and RLMIS held £595m and £447m of sovereign debt of other European countries as at 31 December 2019 respectively, almost all of which are in the Eurozone. This was largely concentrated in the largest and highest rated countries, in particular Germany and France. Investment in lower graded countries is very limited and not material.
HSBC HSBC acts as custodian for the investment assets and certain amounts of cash deposits. The latter are subject to credit risk in the event of default by HSBC. The Group and RLMIS have market risk exposure to HSBC through investment in equity and corporate bonds issued by HSBC and they hold a £2,689m loan note at 31 December 2019 with HSBC which is fully collateralised. The loan note is held as part of a reinsurance arrangement, and its value is exactly matched by a financial liability to Swiss Re.
UK and European banking sector
Although the Group mitigates concentration risk by diversifying its counterparties for cash and amounts held on deposit and by investing a high proportion in Global Systemically Important Financial Institutions, the Group has a material combined exposure to the UK and European banks in which it holds cash and deposits.
Reinsurance arrangements
The Group has large reinsurance arrangements with certain counterparties. There are significant exposures arising from various annuity reinsurance arrangements, which are collateralised or subject to a floating charge.

Risk profile (continued)
50
The Group is exposed to credit risk in respect of its reinsurance arrangements. The largest reinsurance exposures, borne directly by the Group, are referenced above. Mortality and morbidity reinsurance exposures represent the reduction in the value of future profits from a failure of the reinsurer and claims recoverable from the reinsurer. In each case of exposure to credit risk the risk of loss is perceived to be extremely low due to the collateral arrangements and in view of the external ratings, supported by internal analysis. All exposures are consistent with the Group’s business model and strategy, the Group’s risk appetite and limits. Minor breaches occur from time to time, which are reviewed and decisions taken as to corrective action or to accept the position. Any losses arising would not impact on short-term liquidity. The Group has access to a large amount of readily realisable assets and does not rely on any single counterparty to provide liquid funds. The failure of HSBC as a counterparty would, however, create major operational challenges and could cause the Group’s contingency funding plan to be invoked in order to provide liquid funds at short notice. C.3.4. Management and mitigation of credit counterparty risk In order to reduce its exposure to credit risk, the Group limits exposure primarily to counterparties with a long-term rating of at least BBB. Where possible, significant counterparty exposures, particularly in respect of stock lending and derivatives are mitigated by the use of collateral. A comprehensive system of limits is in place in order to control exposure to credit risk. The one exception is exposure to the UK government. Investment in government debt is a key part of the Group’s investment and asset-liability management strategies and it has been decided that no limit should be set. If the UK’s credit standing were to deteriorate however, this decision would need to be reviewed. Exposures arising in respect of cash holdings, deposits, derivatives and sovereign debt are monitored against the agreed limits by the Credit, Counterparty and Liquidity Risk Committee (CCLRC), which reports to the CMC. The CCLRC may recommend changes to specific exposure limits to the CMC. Where external ratings are not available, the Group uses an internal rating process as described on page 214 of the 2019 ARA. The Group mitigates certain credit risk exposures, in particular those arising through its holdings of derivatives and its largest reinsurance arrangements, through the use of collateral. The Group does not use collateral as a means of mitigating other risks. The Group does not use derivatives for the purpose of mitigating credit risk. C.3.5. Credit risk sensitivities The main method used to assess sensitivity to credit risk is scenario analysis whereby a counterparty (to which there is a large exposure) defaults on its obligations. The Group has a significant counterparty exposure to HSBC, meaning a default of its obligations is a material sensitivity to analyse. For this purpose it is assumed that HSBC is in default and that there is no recovery of any amounts due to the Group in respect of cash held on deposit and corporate bond holdings, and that the equity investments would have no value. The analysis shows that the Group would remain sufficiently liquid and that management actions could be taken to reduce the impact on solvency to an acceptable level. This does not consider wider operational and financial impacts on the UK or global financial system as a whole. The Group also considers the impact of credit spreads widening on the SCR. Further details of the results of the stress testing and sensitivity analysis are included in section C.7.2.

Risk profile (continued)
51
C.4 Liquidity risk The Group defines liquidity risk as the risk that the Group, though solvent, either does not have sufficient financial resources available to enable it to meet its obligations as they fall due or can secure them only at excessive cost. C.4.1. Liquidity risk exposure and material changes over the reporting period The Group has limited exposure to liquidity risk primarily due to its financial strength and availability of liquid assets. However, it is recognised that extreme liquidity issues could have a serious impact on the Group. The Group’s exposure to liquidity risk is described in further detail on pages 215 to 216 of the 2019 ARA. The Group does not hold risk capital against liquidity risk. The longer-term matching of assets and liabilities is covered within market risk in section C.2. As a result of the policies and procedures in place for managing its exposure to liquidity risk, the Group considers the residual liquidity risk arising from its activities to be well controlled. There have been no material changes to the Group’s liquidity risks over the reporting period. C.4.2. Measures used to assess the risk profile The Group uses liquidity coverage ratios to measure the exposure of its long-term life funds to short-term liquidity risk. The ratios are calculated based on 3-month forecast cash outflows after applying a 50% stress. Two ratios are calculated:
� cash and UK gilts as liquidity and a target of 100%; and
� cash only ratio with a target of 33%, equivalent to one month’s stressed cash outflow, with no allowance for income from premiums or investments.
The Group also assesses its long-term liquidity risk profile by considering the relationship between when assets might be able to be sold even in stressed conditions and when the liabilities in each long-term fund become due. The Group assesses the liquidity risk within its least liquid unit-linked funds, specifically those linked to property, by measuring the proportion of the funds’ assets invested in cash and deposits. C.4.3. Liquidity risk concentrations Generally, the Group is not exposed to material concentrations of residual liquidity risk. There is concentration of liquidity risk through the Group’s reliance on two banks:
� NatWest for processing payments to its customers, suppliers and employees; and
� HSBC for investment activities. If either bank were to fail or have a major IT problem, then the Group may not be able to meet its obligations as they fall due for a period. C.4.4. Management and mitigation of liquidity risk The Group does not hold risk capital against liquidity risk. The Group’s liquidity management process is set out on pages 215 to 216 of the 2019 ARA. The Group does not use risk mitigation techniques to transfer liquidity risk to third parties. C.4.5. Liquidity risk sensitivities Liquidity coverage ratios compare the assets that could be realised for cash by the end of the following business day with projected stressed gross outflow during a period of three months, with no allowance for any income from premiums or investments or undertaking actions to source additional liquidity. The measure therefore allows for an element of sensitivity above the expected cash flows and the calculated ratios still show a liquidity position well within risk appetite for all funds. C.4.6. Expected Profit Included in Future Premiums The total amount of expected profit included in future premiums (EPIFP) as at 31 December 2019 was £1,252m and £1,177m for the Group and RLMIS respectively. EPIFP is calculated for each homogeneous risk group (HRG) within each long-term fund.

Risk profile (continued)
52
C.5 Operational risk Operational risk is the risk of loss resulting from inadequate or failed internal processes, people and systems, or from external events (excluding market events, which are included in market risk in section C.2). The aim of operational risk management is to manage operational risks in line with defined appetites, and to protect both policyholders and the Group, whilst delivering sustainable growth. The Group’s operational risk framework is the method by which operational risks are managed in terms of setting risk appetite, evaluating key exposures, measuring risk, mitigating risk, and monitoring risks on an ongoing basis, as set out in this section. C.5.1. Operational risk exposure and material changes over the reporting period The principal operational risks that the Group is exposed to are listed below. The impact arising from all operational risks could be on the Group’s members, customers, people, processes and systems. Operational risk Description
Conduct The risk of unfair outcomes to the end customer.
Processing The risk associated with the Group’s operational processes, for example incorrect or poorly designed processes, data entry or loading errors, accounting and attribution errors or incorrect use of models.
Information security The risk associated with protecting the Group’s customers, MI and information processing facilities from threats.
Outsourcing The risk arising from outsourcing processes or obtaining key goods or services from third–party providers. This includes the management of the contract and/or relationship and ongoing monitoring of the third-party provider.
Change The risk arising from the Group’s change management processes and programmes.
Business continuity / Disaster recovery
The risk associated with business continuity management and disaster recovery processes and plans.
Information Technology The risk arising from development, delivery and maintenance activity for the Group’s IT infrastructure.
Legal and regulatory The risk of a poor level of regulatory compliance and the materialisation of breaches which would pose a risk to the regulator’s objectives and the Group’s relationship with them.
Financial crime The risk that the Group’s customers or assets are subject to any kind of criminal conduct relating to money, data or to financial services.
People The risk associated with the Group’s processes to attract and retain capable people and provide an appropriate performance-based culture.
During 2019, the Group’s operational risk profile remained stable while activities continue to deliver a programme of control enhancements and strengthening control standards. The Group has continued to manage its exposure to risks arising from change management, following the conscious decision in 2016 to operate a significantly larger change portfolio. The most significant strategic transformation and change programmes continue to be closely monitored, with quality assurance processes built into the internal management and governance approach. They are also subject to independent oversight by the GIA and GR&C functions. C.5.2. Measures used to assess the risk profile Operational risk is managed within the Group’s RMS, as set out in section B.3. A variety of measures are used, such as scoring of impact and likelihood, KRI thresholds aligned to its risk appetite statements, assessing control effectiveness and monitoring of events and losses by size. The Group’s operational risks are assessed using a risk scoring system that considers the worst case occurring for each operational risk and the likelihood of this worst case occurring within the next 12 months. Stress and scenario testing is also used to get a better understanding of the significant risks that the Group may face under extreme conditions, including the level of capital it needs to hold to protect against these risks. The scenarios and sensitivity are described in section C.5.5.

Risk profile (continued)
53
C.5.3. Operational risk concentrations The primary source of concentration risk for the Group’s operations is its reliance upon material outsourcers to provide a broad range of services to key businesses. Further details of how this is managed are set out in section B.7. C.5.4. Management and mitigation of operational risk The Group makes limited use of techniques that transfer operational risk to third parties. The main risk-mitigation technique used is to effect insurance against some risks, in particular of loss to its buildings and contents, and of loss arising from legal claims against its directors and managers. Legal agreements with outsourcers transfer some risks to the outsourcers, for example those arising from errors in servicing customers. However, the outsourcing arrangements themselves generate different types of risk which would not otherwise exist. C.5.5. Operational risk sensitivities Operational risk stresses and scenarios are completed to calculate the operational risk capital requirement. The stresses allow an assessment of the extreme impacts arising from a given risk by way of assessment of the frequency of occurrence and the distribution of impacts. Scenarios are largely bottom up but can be top down. Top-down scenarios concern the analysis of a number of macro or corporate-level events, whereas bottom-up scenarios link to risks within the risk register and refer to single, but potentially severe, events. A wide variety of operational risk scenarios are assessed, providing coverage across specified risk categories. Separately, expert judgement is used to derive the degree of interdependence between different types of operational risk.
In addition to the scenarios that are carried out to support the calculation of operational risk capital, specific scenarios are carried out to consider the Group’s resilience to different types of operational risk. As well as regular scenario testing of how business continuity events would be handled, there is also consideration of operational risk when constructing broad-based scenarios such as a pandemic or a major change in pensions legislation. C.6 Other material risks C.6.1. Other material risk exposure and material changes over the reporting period The following table describes the other material risks faced by the Group. Risk Description
Strategic risk Risks that arise from the Group’s choice of strategy, deficient planning processes and inappropriate or misapplied decisions. This type of risk could directly impact the Group’s future, its position in the market, its profitability, and its solvency or capital adequacy.
MTP execution risk Risks to business plans (including budgets and resource allocations) that potentially prevent the firm from achieving its business objectives.
Emerging risk Newly developing or changing risks which are difficult to quantify and which may have a major impact on the Group. Typically the drivers for these risks are socio-political, technological, economic or regulatory.
Examples of the risks in the table above are contained within the principal risks and uncertainties set out in the 2019 ARA on pages 65 to 68. During 2019, the Internal Model Application Process risk was removed following submission and subsequent PRA approval of the Partial Internal Model. There were no other material changes to the risk profiles for strategic and MTP execution risks. Climate change risk is also being reviewed by the Group. Climate change risk has the potential to adversely impact the Group across multiple risk categories, and could crystallise in a number of different ways given the complex nature of the risk and the different time horizons for impacts. Consideration of these potential risks and their impacts has been brought into the RMS and the consideration of climate change is also being incorporated into existing strategic risk monitoring activity. The Group now considers a broad range of environmental, social and governance factors in their selection and management of its investments. The Group continues to consider the requirements of consultations associated with the risks of climate change and to engage with industry bodies on the Group’s response where appropriate. An emerging risk following Brexit remains. Brexit is not expected to have a materially detrimental impact on the strategy and risk profile of the Group due to the vast majority of the business being written in the UK. In February 2019, the existing contracts written in the Republic of Ireland and Germany were transferred from RLMIS to RLI DAC by way of a Part VII transfer, effective from 1 January 2019 for accounting purposes, to allow the Group to continue to service existing policyholders. The Group does not believe there will be a significant impact to the operations or capital strength, and will continue to monitor and respond to ongoing developments relating to Brexit as they occur, particularly in relation to regulation and legislation.

Risk profile (continued)
54
Recently, there is the risk of a significant global pandemic and economic disruption emerging from the coronavirus. The emergence of the coronavirus has the potential to:
� slow manufacturing, disrupt supply chains, impact the travel and tourism industry and slow global growth rates, impacting markets and investment values;
� have a significant impact on the insurance sector from volatility in financial markets; and
� impact on organisational change delivery, increasing the risk of operational loss and/or reputational damage. During periods of market volatility the Group increases the frequency of monitoring its capital and liquidity positions. The Group also carries out stress and scenario testing and as part of its ORSA process it ran a qualitative pandemic scenario to better understand the impacts on the wider business as well as capital. The Group also holds capital for mortality catastrophe events within its Internal Model capital requirement. The Group keeps its operational resilience under regular review, with plans and contingencies in place around any potential operational impacts relating to the coronavirus. C.6.2. Measures used to assess the risk profile Strategic, MTP execution and emerging risks are scored using the combination of impact and probability as described in section C.5.2. C.6.3. Other material risk concentrations There are no other material risk concentrations. C.6.4. Management and mitigation of other material risks The management of the Group’s strategic, MTP execution and emerging risks are managed in a similar manner to all the other risk types that the Group faces, this includes:
� the use of the policy framework, guidelines, limits and authority levels. Senior management has primary responsibility for the management of other material risks. This includes developing policies, procedures and controls across the different products, activities, processes and systems in their area and the allocation of responsibilities;
� regular monitoring of actual exposures by accountable executives and their teams and review on an aggregated basis by the ERC and BRC; and
� risk details on an inherent (before controls) and residual (after controls) basis are maintained on risk and control registers. These registers and the MI reported from them are used as a basis for review and challenge by senior management, risk committees and the Board.
Independent oversight and assurance is performed by GR&C and GIA to assess the effectiveness of risk mitigation and management activity. The Group does not use risk mitigation techniques to transfer other material risks to third parties. C.6.5. Other material risk sensitivities The methods and assumptions used for sensitivity analysis include the impact on profit of upside and downside commercial scenarios. These are set at a business unit level so they consider the risks that would lead to positive and negative changes to the competitive position faced by each particular business unit. These include changes in direct competition, re-pricing activity or changes to the regulatory landscape. C.7 Any other information C.7.1. Prudent person principle requirements Under the prudent person principle (PPP), firms are expected to understand fully the risks involved with their investments, make proper provision for them via the SCR and ensure that investment decisions are made in the best interests of policyholders. All investment risks must be properly identified, measured, monitored, managed, controlled and reported. Investment risks are managed and overseen across the Group including the Investment Office, investment proposition owners, finance operations and actuarial areas. The Group invests its assets in accordance with PPP by way of a robust investment governance structure. Oversight is provided by the Investment Committee (IC) in their role to assist the Board in the discharge of its responsibilities in respect of investment-related matters. The With Profits Committee (WPC) exercise independent judgement in advising the Board on the achievement of the fair treatment of all with-profits and unit-linked with-profits policyholders, including where appropriate, investment-related matters.

Risk profile (continued)
55
The agreed investment philosophy is developed by the Investment Office and approved by the Board. It is used to set the Group’s investment strategy. The asset allocations developed are consistent with the Group’s investment strategy, policyholders’ best interests and the specific investment objectives of each product and fund. The strategy in turn is supported by IMAs between the Group and the asset manager, and policies covering market, credit, liquidity, derivatives, proposition development and review and conflicts of interest risk management. The Group’s assets are largely, but not exclusively, managed by RLAM. The investment strategy sets out the investment categories in which assets may be invested, supported by asset allocation and performance benchmarks consistent with the Group’s risk appetite (as guided by the Group’s Capital Management Framework) and asset liability matching. This balances the risks relating to the liabilities under the Group’s insurance contracts against the risks inherent in its assets and the capital available. The Group has established approaches for matching assets and liabilities, including hedging. Where appropriate matching cannot be achieved, management actions are in place to manage the market risk resulting from the mismatch. The asset allocation benchmarks ensure that each fund has an appropriate mix of assets and is not over- or under-exposed to a particular asset category or specific investment. In addition, there are limits to the exposures of non-government bonds in terms of their external credit rating and also to the overall exposure to unrated bonds. C.7.2. Sensitivity analysis The Group conducts a range of sensitivity analysis and stress and scenario testing to help it understand its risk profile and assess and manage its risks. This is a key element of the RMS, as well as being a regulatory requirement. Stress testing is embedded in the planning process of the Group and is applied to the base case five-year MTP. Rigorous stress testing exercises are carried out to assess the impact of a range of adverse scenarios with different probabilities and severities. These are provided as input to the ORSA and are used to inform strategic planning. This allows senior management and the Board to assess the base case plan in adverse circumstances and to adjust strategies and propose mitigating actions if the plan does not meet risk appetite in a stressed scenario. The following types of sensitivity analysis and stress and scenario activities were carried out during 2019:
� Sensitivity analysis, stress tests or scenarios.
� Broad-based scenarios (covering multiple events and/or a sequence of events).
� Recovery plans.
� Business model analysis.
� Reverse stress tests. More details on each of these can be found on pages 217 to 218 of the 2019 ARA. The SCR, solvency surplus and capital cover ratio are sensitive to changes in economic and non-economic assumptions. The most significant market risk sensitivities arise from interest rate risk. The most significant non-economic assumptions arise from improvements in GAO take-up rates and longevity improvements which apply predominantly to the closed funds. These stresses increase the BEL value of the GAOs, reducing own funds and increasing capital requirements. On a Regulatory View decreases in solvency surplus for the affected closed funds are offset by an equivalent reduction in the closed funds restriction. The Regulatory View capital cover ratio falls because overall capital requirements increase for the closed fund, but with no increase to their contribution to solvency surplus. This reduction in Regulatory capital cover ratio is dampened relative to the Investor View, because of the reduction in the closed funds restriction. GAO take-up risk was mitigated through the 2018 GAO Compromise Scheme for the SL Fund which allowed eligible policyholders an uplift to their retirement savings without the restriction of having to take an annuity. Options to mitigate this GAO-related risk for other funds, along with the associated longevity risk, are considered on an ongoing basis taking into account the cost-effectiveness of potential solutions. The Group also tries to mitigate the impact of mortality risk (in particular, mortality catastrophe events such as pandemics) via the use of reinsurance. Typically the rate of reinsurance is high (up to 90%). Expense risk arises predominantly within the RL Open Fund on its significant block of unit-linked and non-profit business. Rising expenses causes an increase to the BEL and associated capital requirements, both of which reduce the solvency surplus. The Group actively manages its cost base to limit this particular risk.

Risk profile (continued)
56
The sensitivities in the following table have been selected to reflect the key risks to which the Group is exposed for a 1-in-20-year event. Sensitivity analysis Group RLMIS
Scenario SCR
£m
Solvency surplus
(Investor View)
£m
Capital cover
ratio (Investor
View) %
Solvency surplus
(Regulatory View)
£m
Capital cover ratio
(Regulatory View)
% SCR
£m
Solvency surplus
(Investor View)
£m
Capital cover
ratio (Investor
View) %
Solvency surplus
(Regulatory View)
£m
Capital cover ratio
(Regulatory View)
%
31 December 2019 4,438 5,810 231 2,632 159 4,262 6,037 242 2,861 167
Market risk1
25% decrease in equity investments2 (212) (406) (3) (259) (3) (212) (406) (3) (259) (3)
15% decrease in property prices (14) (81) (2) (77) (2) (14) (81) (1) (77) (2)
100bps rise in interest rates2, 3 (827) 50 31 12 14 (827) 50 36 12 17
100bps fall in interest rates2, 3 1,417 (87) (33) (47) (15) 1,417 (87) (37) (47) (18)
25bps increase in government bond yields4 18 (121) (3) (62) (2) 18 (121) (3) (62) (2)
200bps widening in credit spreads5 (293) (124) 6 (117) 1 (293) (124) 7 (117) 2
15% fall in GBP exchange rates6 161 256 1 209 2 161 256 1 209 2
Insurance risk1
20% increase in GAO take-up rate7 237 (1,066) (30) (84) (5) 237 (1,066) (31) (84) (5)
Two-year increase in future life expectancy8 708 (1,860) (54) (275) (14) 708 (1,860) (58) (275) (15)
35% increase in future persistency rates9 (230) (242) 1 (34) 2 (230) (242) 2 (34) 3
12.5% one-off increase in surrender/transfer rate10 (153) (269) (2) (242) (4) (153) (269) (1) (242) (3)
15% increase in maintenance expenses 25 (389) (10) (220) (5) 25 (389) (10) (220) (6)
1 These sensitivities assume a recalculation of the TMTP.
2 Sensitivity consistent with the PRA’s SS7/17: Solvency II: Data collection of market risk sensitivities, which is available at
http://www.bankofengland.co.uk/pra/Documents/publications/ss/2017/ss717.pdf. The remaining market risk sensitivities presented have been updated to be the
equivalent to a 1-in-20-year event.
3 Interest rate sensitivities assume government and other bond yields and risk-free rates all move by the same amount. Interest rates are allowed to be negative.
4 The government bond yield sensitivity assumes risk-free rates and other yields remain constant.
5 The widening in credit spreads stress assumes a widening in all ratings and assumes an associated increase in the IAS19 discount rate for the RLGPS/Liver GPS
Schemes at 25% of the asset spread stress.
6 The fall in GBP exchange rates stress assumes an increase to the value of assets held in currencies other than GBP by 17.5% in GBP terms.
7 The calibration of the 20% increase in GAO take-up rates stress is based on the RL Open Fund. For other funds, a proportionate stress will be applied to reflect the 1-
in-20 risk specific to that fund.
8 The two-year increase in future life expectancy stress assumes males aged 65 live for another two years and proportionate changes apply to other ages.
9 The persistency stress assumes adverse movement in future lapse rates and Paid Up Policy (PUP) rates.
10 This stress assumes additional lapses/PUPs in the first year after the valuation date, but only where it is advantageous for the policyholder to surrender/transfer.

Valuation for solvency purposes
57
D. Valuation for solvency purposes
Plain English introduction
In this section we provide a reconciliation between the SII balance sheet and IFRS basis used in the preparation of our ARA.
We also describe the methodology used for the valuation of our:
� assets (D.1);
� technical provisions (D.2); and
� other liabilities (D.3).
D.1 Assets D.1.1. Balance sheet Differences between an IFRS and SII balance sheet can be summarised into one of the following three categories: Consolidation adjustments The SII balance sheet for the Group has been prepared using method 1. The key difference between the consolidation approach under SII and IFRS is that other entities that are fully consolidated in the Group IFRS balance sheet are accounted for as ‘Holdings in related undertakings, including participations’, gross of intra-group transactions on the SII balance sheet. These other entities are listed in note 23 on page 180 to 183 of the 2019 ARA. Presentation adjustments Under the SII regulations, certain assets and liabilities are categorised differently from their classification under IFRS. Presentation adjustments therefore align the IFRS balance sheet in the 2019 ARA to the prescribed format of the SII balance sheet. Further information on the SII presentation adjustments is included in section D.1.2. Valuation differences Where there are differences in valuation between the IFRS and SII values, these have been separately presented in the following tables. A description of the valuation differences is presented in sections D.1.3 (assets and other liabilities) and D.2 (technical provisions). The following tables reconcile IFRS assets and liabilities for the Group and RLMIS, reported in the 2019 ARA, to amounts reported in the SII balance sheet as at 31 December 2019. The IFRS figures are presented in the SII balance sheet format where possible and therefore do not directly correspond to the line items in the 2019 ARA.

Valuation for solvency purposes (continued)
58
Balance sheet – Group
31 December 2019 £m IFRS value
Consolidation adjustments
Presentation adjustments
(D.1.2)
Valuation differences
(D1.3, D.2.3) SII value
SFCR note
Assets
Goodwill 229 - - (229) - D.1.3(a)
Other intangible assets 114 - - (114) - D.1.3(a)
Deferred acquisition costs 283 - - (283) - D.1.3(b)
Deferred tax assets - - 6 - 6 -
Pension benefit surplus 169 - - - 169 -
Property, plant & equipment held for own use 105 1 1 107
Property (other than for own use) 7,248 (2,808) (4,343) - 97 -
Holdings in related undertakings, including participations - 42,301 (29,514) (93) 12,694 D.1.3(c)
Equities 33,193 (25,216) (1,098) - 6,879 -
Bonds1 45,607 (17,087) (11,515) - 17,005 -
Collective Investment Undertakings 10,797 (1,160) (8,138) - 1,499 -
Derivatives 4,229 (4) (52) - 4,173 -
Deposits other than cash equivalents2 6,980 (4,964) (558) - 1,458 -
Assets held for index-linked and unit-linked contracts - - 55,590 - 55,590 -
Loans and mortgages 2 1 - - 3 -
Reinsurance recoverables 5,007 (17) (84) (184) 4,722 D.1.3(d)
Insurance, reinsurance and intermediaries receivables3 143 (80) 112 (6) 169 D.1.3(e)
Receivables (trade, not insurance)3 801 (156) (263) - 382 D.1.3(e)
Cash and cash equivalents 1,835 (1,105) (256) - 474 -
Any other assets, not elsewhere shown3 37 (17) - - 20 -
Total assets 116,779 (10,311) (112) (909) 105,447
Liabilities
Technical provisions 93,777 - (326) (5,588) 87,863 D.2.3
Provisions other than technical provisions4 448 (43) (45) (242) 118 D.1.3(f)
Deferred tax liabilities 179 11 6 9 205 D.1.3(g)
Derivatives 1,596 (5) (72) - 1,519 -
Debts owed to credit institutions5 647 - - - 647 -
Financial liabilities other than debts owed to credit institutions 33 (8) (3) - 22 -
Insurance and intermediaries payables5 294 (14) 336 - 616 -
Reinsurance payables 2,729 3 (3) - 2,729 -
Payables (trade, not insurance)5 1,610 (173) (6) (12) 1,419 D.1.3(i)
Subordinated liabilities 1,331 - - 177 1,508 D.1.3(h)
Any other liabilities, not elsewhere shown6 14,135 (10,082) (3,998) - 55 -
Total liabilities 116,779 (10,311) (4,111) (5,656) 96,701
Excess of assets over liabilities - - 3,999 4,747 8,746
Total liabilities plus excess of assets over liabilities 116,779 (10,311) (112) (909) 105,447
1 Bonds presented include government bonds of £17,908m, other quoted bonds of £24,659m, other unquoted bonds of £2,919m in note 21(a), plus short-dated debt of
£121m in note 25 of the 2019 ARA.
2 Deposits other than cash equivalents include deposits with credit institutions of £5,611m in note 21(a) and short-term bank deposits of £1,368m in note 25 of the 2019 ARA.
3 The total of insurance, reinsurance and intermediaries receivables (£143m), receivables (trade, not insurance) (£799m) and any other assets, not elsewhere shown (£37m) is equal to
£979m, which equates to the sum of trade and other receivables (£969m) in note 24 of the 2019 ARA plus the current tax asset (£12m) on the 2019 IFRS balance sheet.
4 Provisions other than technical provisions include provisions of £286m in note 33 of the 2019 ARA, deferred fee income of £90m and other liabilities of £72m in note
34 of the 2019 ARA.
5 The total of debts owed to credit institutions (£647m), insurance and intermediaries payable (£294m) and payables (trade, not insurance) (£1,610m) is equal to £2,551m,
which equates to sum of amounts due to customers (£217m), amounts due to brokers (£235m), cash collateral (£1,825m), bank overdrafts (£67m) and other payables (£204m)
in note 32 of the 2019 ARA and current tax liability of £2m in the IFRS balance sheet within the 2019 ARA.
6 Any other liabilities of £14,135m is equal to liability to external unit holders £10,068m, unallocated divisible surplus £3,998m and accrued expenses of £68m in note 34 of the
2019 ARA.

Valuation for solvency purposes (continued)
59
Balance sheet – RLMIS
31 December 2019 £m IFRS value
Presentation adjustments
(D.1.2)
Valuation differences
(D1.3, D.2.3) SII value
SII value 31 December
2018 SFCR note
Assets
Goodwill 229 - (229) - D.1.3(a)
Other intangible assets 113 - (113) - D.1.3(a)
Deferred acquisition costs 283 - (283) - D.1.3(b)
Pension benefit surplus 168 - - 168 213 -
Property, plant & equipment held for own use 13 (13) - -
Property (other than for own use) 4,512 (4,330) - 182 163 -
Holdings in related undertakings, including participations
42,774 (29,611) (282) 12,881 11,976 D.1.3(c)
Equities 7,977 (1,098) - 6,879 6,436 -
Bonds1 28,515 (11,515) - 17,000 16,221 -
Collective Investment Undertakings 9,561 (8,061) - 1,500 1,423 -
Derivatives 4,226 (52) - 4,174 3,168 -
Deposits other than cash equivalents2 2,015 (558) - 1,457 877 -
Assets held for index-linked and unit-linked contracts - 55,590 - 55,590 44,360 -
Loans and mortgages 3 - - 3 3 -
Reinsurance recoverables 4,966 (80) (194) 4,692 4,721 D.1.3(d)
Insurance, reinsurance and intermediaries receivables3 58 101 - 159 174 D.1.3(e)
Receivables (trade, not insurance)3 543 (249) (2) 292 432 D.1.3(e)
Cash and cash equivalents 633 (256) - 377 572 -
Any other assets, not elsewhere shown3 - - - - 1 -
Total assets 106,589 (132) (1,103) 105,354 90,740
Liabilities
Technical provisions 93,820 (307) (5,581) 87,932 75,163 D.2.3
Provisions other than technical provisions4 405 (45) (242) 118 118 D.1.3(f)
Deferred tax liabilities 192 - 9 201 145 D.1.3(g)
Derivatives 1,591 (72) - 1,519 1,375 -
Debts owed to credit institutions5 636 - - 636 558 -
Financial liabilities other than debts owed to credit institutions 22 (5) - 17 - -
Insurance and intermediaries payables5 220 317 - 537 527 -
Reinsurance payables 2,721 - - 2,721 2,796 -
Payables (trade, not insurance)5 1,407 (21) (12) 1,374 1,040 D.1.3(i)
Subordinated liabilities 1,331 - 177 1,508 806 D.1.3(h)
Any other liabilities, not elsewhere shown 4,244 (4,244) - - - -
Total liabilities 106,589 (4,377) (5,649) 96,563 82,528
Excess of assets over liabilities - 4,245 4,546 8,791 8,212
Total liabilities plus excess of assets over liabilities 106,589 (132) (1,103) 105,354 90,740
1 Bonds presented include government bonds of £14,283m, other quoted bonds of £11,192m, other unquoted bonds of £2,919m in note 21(a), plus short-dated debt of
£121m in note 25 of the 2019 ARA.
2 Deposits other than cash equivalents include deposits with credit institutions of £1,437m in note 21(a) and short-term bank deposits of £578m in note 25 of the 2019 ARA.
3 The total of insurance, reinsurance and intermediaries receivables (£58m) and receivables (trade, not insurance) (£543m) is equal to £601m, which equates to the sum of
trade and other receivables (£588m) in note 24 of the 2019 ARA plus the current tax asset (£12m) on the 2019 IFRS balance sheet.
4 Provisions other than technical provisions include provisions of £270m in note 33 and other liabilities of £136m in note 34 of the 2019 ARA.
5 The total of debts owed to credit institutions (£636m), insurance and intermediaries payable (£220m) and payables (trade, not insurance) (£1,403m) is equal to £2,259m,
which equates to sum of amounts due to customers (£207m), amounts due to brokers (£62m), cash collateral (£1,825m), amounts due to other group entities (£56m), bank
overdrafts (£56m) and other payables (£55m) in note 32 of the 2019 ARA and current tax liability of £2m in the IFRS balance sheet within the 2019 ARA.

Valuation for solvency purposes (continued)
60
D.1.2. SII presentation adjustments The structure of the SII balance sheet is different to the IFRS balance sheet presented in the 2019 ARA. The table below sets out the presentation adjustments as at 31 December 2019 for the Group and RLMIS which reconcile the IFRS assets and liabilities reported in the ARA with the presentation of assets and liabilities in the SII balance sheet. Presentation adjustments – Group
31 December 2019 £m
Total SII presentation
adjustment
Assets held for index & unit-linked
contracts (Note 1)
Participations(Note 2)
Investment classification
(Note 3) UDS
(Note 4) Other
(Note 5)
Assets
Deferred tax assets 6 - - - - 6
Property, plant & equipment held for own use
1 - - - - 1
Property (other than for own use) (4,343) (4,343) - - - -
Holdings in related undertakings, including participations
(29,514) (30,642) 1,137 - - (9)
Equities (1,098) (639) - (459) - -
Bonds (11,515) (11,821) - 306 - -
Collective Investment Undertakings (8,138) (7,447) (1,137) 460 - (14)
Derivatives (52) (52) - - - -
Deposits other than cash equivalents (558) (211) - (347) - -
Assets held for index-linked and unit-linked contracts
55,590 55,591 - - - (1)
Reinsurance recoverables (84) - - - - (84)
Insurance, reinsurance and intermediaries receivables
112 - - - - 112
Receivables (trade, not insurance) (263) (532) - - - 269
Cash and cash equivalents (256) (296) - 40 - -
Total assets (112) (392) - - - 280
Liabilities
Technical provisions (326) - - - - (326)
Provisions other than technical provisions (45) (45) - - - -
Deferred tax liabilities 6 6
Derivatives (72) (72) - - - -
Financial liabilities other than debts owed to credit institutions
(3) (4) - - - 1
Insurance and intermediaries payables 336 - - - - 336
Reinsurance payables (3) - - - - (3)
Payables (trade, not insurance) (6) (269) - - - 263
Any other liabilities, not elsewhere shown (3,998) (2) - - (3,998) 2
Total liabilities (4,111) (392) - - (3,998) 279
Excess of assets over liabilities 3,999 - - - (3,998) (1)
Total liabilities plus excess of assets over liabilities
(112) (392) - - - 280

Valuation for solvency purposes (continued)
61
Presentation adjustments – RLMIS
31 December 2019 £m
Total SII presentation
adjustment
Assets held for index & unit-linked
contracts (Note 1)
Participations (Note 2)
Investment classification
(Note 3) UDS
(Note 4) Other
(Note 5)
Assets
Property, plant & equipment held for own use
(13) - - - - (13)
Property (other than for own use) (4,330) (4,343) - - - 13
Holdings in related undertakings, including participations
(29,611) (30,641) 1,060 - - (30)
Equities (1,098) (639) - (459) - -
Bonds (11,515) (11,821) - 306 - -
Collective Investment Undertakings (8,061) (7,447) (1,060) 460 - (14)
Derivatives (52) (52) - - - -
Deposits other than cash equivalents (558) (211) - (347) - -
Assets held for index-linked and unit-linked contracts
55,590 55,591 - - - (1)
Reinsurance recoverables (80) - - - - (80)
Insurance, reinsurance and intermediaries receivables
101 - - - - 101
Receivables (trade, not insurance) (249) (532) - - - 283
Cash and cash equivalents (256) (296) - 40 - -
Total assets (132) (391) - - - 259
Liabilities
Technical provisions (307) - - - - (307)
Provisions other than technical provisions (45) (45) - - - -
Derivatives (72) (72) - - - -
Financial liabilities other than debts owed to credit institutions
(5) (5) - - - -
Insurance and intermediaries payables 317 - - - - 317
Payables (trade, not insurance) (21) (269) - - - 248
Any other liabilities, not elsewhere shown (4,244) - - - (4,244) -
Total liabilities (4,377) (391) - - (4,244) 258
Excess of assets over liabilities 4,245 - - - 4,244 1
Total liabilities plus excess of assets over liabilities
(132) (391) - - - 259
Note 1 – Assets held for index-linked and unit-linked contracts Under IFRS, assets and liabilities relating to index-linked and unit-linked contracts are reported on a separate line. For SII, all assets and liabilities relating to index-linked and unit-linked contracts are reported in a single line within ‘assets held for index-linked and unit-linked contracts’. Note 2 – Participations Under SII, a participation exists when there is ownership, directly or indirectly, of 20% or more of the voting rights or capital of an undertaking. Investment holdings, primarily within Collective Investment Undertakings under IFRS, which are greater than 20%, are therefore reclassified as participations for SII purposes.

Valuation for solvency purposes (continued)
62
Note 3 – Investment classification Presentation adjustments are required to reclassify certain investment assets within the IFRS balance sheet to the appropriate balance sheet line items for SII purposes. For example, certain equity securities held as equities on the IFRS balance sheet are required under the regulations to be classified as ‘collective investment undertakings’ on the SII balance sheet. Additionally, certificate of deposits which are classified as ‘deposits with credit institutions’ under IFRS are required to be classified as ‘bonds’ on the SII balance sheet. Note 4 – UDS The UDS is the amount of IFRS surplus which is attributable to the RL Open Fund that has not been allocated to policyholders. For the IFRS accounts this value is included in the balance sheet as a liability. For SII the equivalent item is the excess of assets over liabilities in the RL Open Fund. The presentation adjustment therefore reallocates the UDS from ‘any other liabilities, not elsewhere shown’ to ‘excess of assets over liabilities’ on the SII balance sheet. Note 5 – Other Other presentation adjustments primarily relate to interfunding, policyholder claims and reinsurance adjustments. The interfunding adjustment primarily relates to balances owed between funds within RLMIS. Under IFRS these amounts are eliminated on consolidation. However SII reporting is at ring-fenced fund level and therefore interfunding balances are presented gross on the balance sheet. The remaining two adjustments are required to reclassify policyholder claims liabilities from technical provisions to insurance and intermediaries payables and from reinsurance assets to insurance and intermediaries receivables, in accordance with prescribed SII balance sheet classifications. D.1.3. Valuation bases, methods and assumptions The description of valuation differences between SII and IFRS balance sheets, by material asset class, are provided in the table below. Valuation differences
31 December 2019
£m Note Balance sheet item Group RLMIS Valuation principles
a Goodwill and other intangible assets
343 342 Goodwill is always valued at zero under the SII valuation rules. Under IFRS, goodwill is carried on the balance sheet at the amount initially recognised less accumulated impairment.
For SII, other intangible assets can only be valued at an amount other than zero if they could be sold separately and the Group is able to demonstrate that there is a value for the same or similar assets that has been derived from quoted prices in active markets. This is not the case for the other intangible assets recognised in the Group and RLMIS’s IFRS statutory accounts, therefore these are valued at zero in the SII balance sheet.
b Deferred acquisition costs 283 283 The valuation difference between the SII and IFRS balance sheets is due to deferred acquisition costs which are not recognised in SII. Under the SII valuation the cash flows that underpin these assets are included within the calculation of the BEL and therefore are included within the SII technical provisions.

Valuation for solvency purposes (continued)
63
31 December 2019
£m Note Balance sheet item Group RLMIS Valuation principles
c Holdings in related undertakings, including participations
93 282 The valuation difference between the SII and IFRS balance sheets relates to participations valued using the adjusted equity method.
Under IFRS the value of the participations is the amount at which the participation can be expected to be sold. This is estimated using a combination of net asset value (NAV), applying a price earnings (PE) multiple and discounted cash flow techniques. The IFRS valuations therefore include an element of goodwill, other intangible assets and fair value adjustments. For the SII balance sheet these participations are valued using the adjusted equity method, which is the net assets of the participations valued on an SII basis excluding goodwill, other intangible assets and fair value adjustments.
d Reinsurance recoverables 184 194 These differences are due to the recalculation of the reinsurance recoverable balance using the SII requirements for technical provisions within Articles 76 to 86 of the SII Directive, as opposed to IFRS rules. Further information is included in section D.2.9.
e Insurance, reinsurance and intermediaries receivables and receivables (trade, not insurance)
6 2 There is no observable market for these specific assets or any similar assets that could be regarded as a suitable basis for the valuation. The SII value is therefore based on an estimate of the potential cash flows with reductions made for anticipated bad debts, i.e. the settlement value. No account has been taken of the effect of discounting short-dated receivables as the effect is immaterial. This produces a value equal to the IFRS amortised cost.
f Provisions, other than technical provisions
242 242 The total valuation difference is due to provisions for renewal commission and deferred fee income which are not recognised in SII. Under the SII valuation the cash flows that underpin these liabilities are included within the calculation of the BEL and therefore are included within the SII technical provisions.
The remaining balance relates to provisions recognised in the SII balance sheet which are the same value under SII and IFRS, determined by discounting the expected cash flows required to settle the obligation. The provisions mainly relate to regulatory projects and rectification programmes.
g Deferred tax liabilities 9 9 The treatment of deferred tax liabilities in the IFRS and SII balance sheet is included in section c within the table. Further information on the differences between IFRS and SII are included in section D.1.4.

Valuation for solvency purposes (continued)
64
31 December 2019
£m Note Balance sheet item Group RLMIS Valuation principles
h Subordinated liabilities 177 177 Subordinated liabilities (also known as subordinated debt) are recognised at their fair value under SII whereas in the IFRS balance sheet they are valued at amortised cost, resulting in a valuation difference. The SII fair value is based on the quoted price and includes accrued interest. The SII value excludes material changes in the issuer’s own credit rating if contained within the quoted price.
Further details of the new subordinated debt issued in 2019 is included in section E.1.2.2.
i Payables (trade, not insurance) 12 12 Payables (trade, not insurance) are measured at amortised cost for IFRS and are valued at fair value for SII, resulting in a valuation difference. The valuation difference relates to interest on subordinated liabilities, which is included within payables under IFRS but is already included in the fair value of subordinated liabilities for SII. No account has been taken of the effect of discounting short-dated payables as the effect is deemed to be immaterial.
D.1.4. Analysis of deferred tax The deferred tax balances in the SII balance sheet are recognised on the same basis as under IFRS, are calculated using the balance sheet liability method and have been provided for on the basis of the expected realisation/settlement of the carrying amount of assets and liabilities. The IFRS basis for recognising deferred tax is reported in note 36 on pages 202 to 203 of the 2019 ARA. Differences in the deferred tax balances arise where balance sheet items have different carrying amounts under SII and IFRS. The Group has deferred tax assets of £6m at 31 December 2019, relating to its management service company, RLMS. Under IFRS, the Group and RLMIS recognise deferred tax assets of £nil. The Group did not recognise deferred tax assets of £4m at 31 December 2019, of which £nil relate to RLMIS. These unused losses and allowances can be carried forward and utilised as long as the company in which they arose is active or trading. The table below summarises the SII deferred tax liabilities compared with the IFRS value. Deferred tax liabilities 31 December 2019 £m RLMIS RLI DAC
Other Group companies Group
Unrealised gains on investments 196 4 - 200
Deferred acquisition costs (12) - - (12)
Other temporary differences 17 - - 17
Total SII deferred tax liabilities 201 4 - 205
Consolidation adjustments - - (6) (6)
Presentation adjustments - - (11) (11)
Valuation adjustments (9) - - (9)
Total IFRS deferred tax liabilities 192 4 (17) 179
D.1.5. Asset valuation methodology All investment assets are measured at fair value for SII in accordance with a fair value hierarchy (see table below), with quoted market prices in an active market being the default valuation. Active markets are determined by trading volumes and analysis is carried out to prove that an active market exists.

Valuation for solvency purposes (continued)
65
The following table sets out the SII valuation methods used when valuing assets: Hierarchy Level Valuation Method
1 Quoted market price in active markets for the same assets
2 Quoted market price in active markets for similar assets
3 Alternative valuation methods
4 Adjusted equity methods (applicable for the valuation of participations)
5 IFRS equity methods (applicable for the valuation of participations)
Where quoted prices are not available, alternative valuation methods are used making maximum use of market inputs (refer to section D.4). D.2 Technical provisions D.2.1. Introduction Technical provisions are the sum of BEL and Risk Margin (RM). For the unit liability part of unit-linked business, the technical provisions are calculated as a whole (referred to as technical provisions calculated as a whole (TPCAW)), rather than as the sum of BEL and RM. The BEL is the probability-weighted value of future cash flows required to fulfil obligations to policyholders under existing contracts, without allowance for cash flows associated with reinsurance arrangements. A negative BEL is allowed if the present value of the future cash flows is negative (i.e. future income exceeds future outflows). The RM is an addition to the BEL to ensure that the technical provisions as a whole are equivalent to the amount that third party insurance undertakings would be expected to require in order to meet the insurance obligations. The RM is calculated as the amount of capital needed to support the SCR over the lifetime of the business at a prescribed cost of capital rate of 6% per annum. D.2.2. Technical provisions by line of business The tables below provide the technical provisions for the Group and RLMIS split by SII lines of business. Technical provisions by line of business – Group
31 December 2019 £m BEL
RM – unaudited TPCAW
TMTP – unaudited Total technical provisions BEL RM
Insurance with profit participation 29,658 1,694 – (477) (1,659) 29,216
Index-linked and unit-linked insurance (1,919) 565 55,470 (3) (474) 53,639
Health insurance (190) 20 – – (15) (185)
Other life insurance 5,175 358 – (26) (314) 5,193
Total 32,724 2,637 55,470 (506) (2,462) 87,863
Technical provisions by line of business – RLMIS
31 December 2019 £m BEL
RM – unaudited TPCAW
TMTP – unaudited Total technical provisions BEL RM
Insurance with profit participation 29,679 1,692 – (477) (1,659) 29,235
Index-linked and unit-linked insurance (1,919) 564 55,470 (3) (474) 53,638
Health insurance (177) 17 – – (15) (175)
Other life insurance 5,237 337 – (26) (314) 5,234
Total 32,820 2,610 55,470 (506) (2,462) 87,932

Valuation for solvency purposes (continued)
66
Key movements in the year are shown in the table below: Technical provisions £m £m
31 December 2018 75,163
BEL and TPCAW increased due to:
� New business sold during 2019
� Expected changes1
� Economic experience
� Economic assumption changes
� Demographic experience
� Demographic assumption changes
� Methodology changes
� Other management actions
� ProfitShare
� Other
7,079 (4,096) 8,034 1,238
548 (278)
9 249 140
(129)
Increase in BEL and TPCAW 12,794
RM increased due to:
� Restatement to Internal Model basis
� Methodology changes
� Change in discount rates
� Other
109 195 405
(24)
Increase in RM – unaudited 685
TMTP increased (reducing technical provisions) due to:
� Restatement to Internal Model basis 90
� Methodology changes due to recalculation (425)
� Changes in discount rates (542)
� Amortisation of TMTP 167
Decrease through higher TMTP – unaudited (710)
31 December 2019 87,932
1 Expected changes are the reduction in technical provisions, including claims paid, based on opening assumptions set at the start of the year, including demographic and
economic assumptions and the unwind of the risk-free rate.
D.2.3. Material differences between IFRS and SII technical provisions The table below analyses the difference between the total technical provisions under SII and the IFRS value for the Group and RLMIS by SII lines of business; explanation of the material differences is also included.
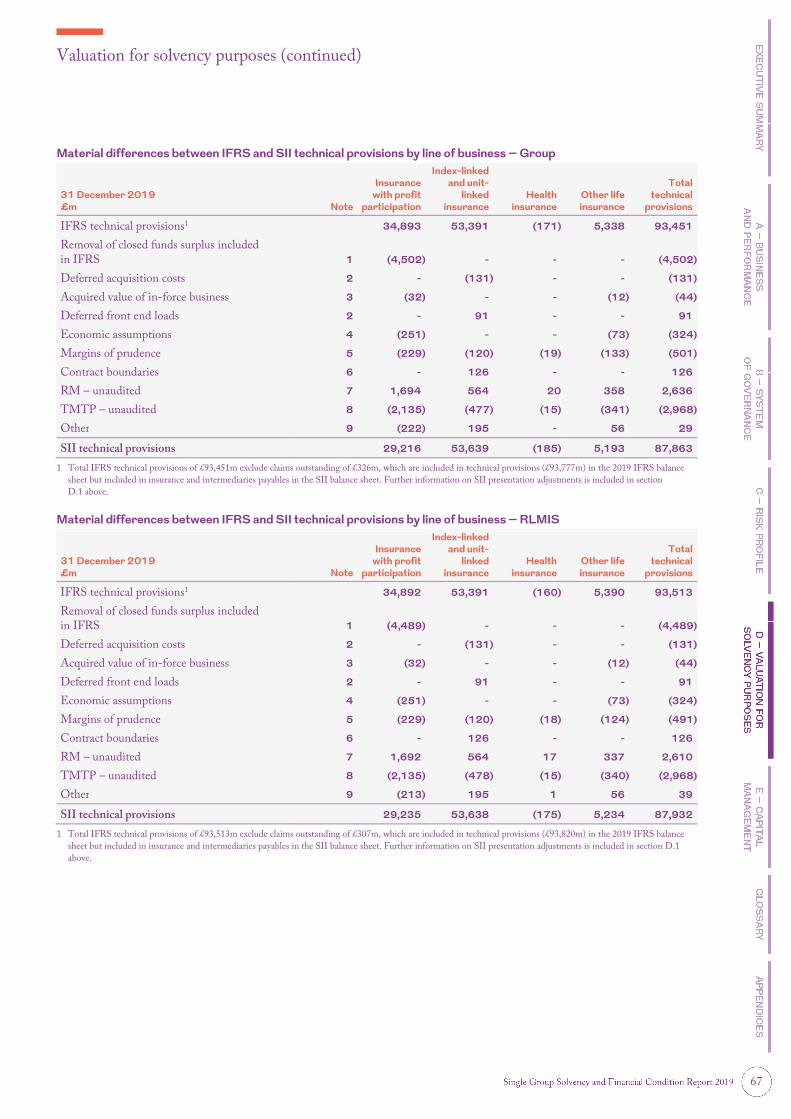
Valuation for solvency purposes (continued)
67
Material differences between IFRS and SII technical provisions by line of business – Group
31 December 2019 £m Note
Insurance with profit
participation
Index-linked and unit-
linked insurance
Health insurance
Other life insurance
Total technical
provisions
IFRS technical provisions1 34,893 53,391 (171) 5,338 93,451
Removal of closed funds surplus included in IFRS 1 (4,502) - - - (4,502)
Deferred acquisition costs 2 - (131) - - (131)
Acquired value of in-force business 3 (32) - - (12) (44)
Deferred front end loads 2 - 91 - - 91
Economic assumptions 4 (251) - - (73) (324)
Margins of prudence 5 (229) (120) (19) (133) (501)
Contract boundaries 6 - 126 - - 126
RM – unaudited 7 1,694 564 20 358 2,636
TMTP – unaudited 8 (2,135) (477) (15) (341) (2,968)
Other 9 (222) 195 - 56 29
SII technical provisions 29,216 53,639 (185) 5,193 87,863
1 Total IFRS technical provisions of £93,451m exclude claims outstanding of £326m, which are included in technical provisions (£93,777m) in the 2019 IFRS balance
sheet but included in insurance and intermediaries payables in the SII balance sheet. Further information on SII presentation adjustments is included in section
D.1 above.
Material differences between IFRS and SII technical provisions by line of business – RLMIS
31 December 2019 £m Note
Insurance with profit
participation
Index-linked and unit-
linked insurance
Health insurance
Other life insurance
Total technical
provisions
IFRS technical provisions1 34,892 53,391 (160) 5,390 93,513
Removal of closed funds surplus included in IFRS 1 (4,489) - - - (4,489)
Deferred acquisition costs 2 - (131) - - (131)
Acquired value of in-force business 3 (32) - - (12) (44)
Deferred front end loads 2 - 91 - - 91
Economic assumptions 4 (251) - - (73) (324)
Margins of prudence 5 (229) (120) (18) (124) (491)
Contract boundaries 6 - 126 - - 126
RM – unaudited 7 1,692 564 17 337 2,610
TMTP – unaudited 8 (2,135) (478) (15) (340) (2,968)
Other 9 (213) 195 1 56 39
SII technical provisions 29,235 53,638 (175) 5,234 87,932
1 Total IFRS technical provisions of £93,513m exclude claims outstanding of £307m, which are included in technical provisions (£93,820m) in the 2019 IFRS balance
sheet but included in insurance and intermediaries payables in the SII balance sheet. Further information on SII presentation adjustments is included in section D.1
above.

Valuation for solvency purposes (continued)
68
Note Item Information
1 Removal of closed fund surplus included in IFRS
IFRS treats the surplus in closed funds as a liability whereas under SII it is an adjustment to own funds.
2 Deferred acquisition costs Deferred front end loads (DFEL)
IFRS for investment business uses a fair value principle whereas SII uses a discounted cash flow methodology.
3 Acquired value of in-force (VIF) business
IFRS for insurance business uses a fair value principle whereas SII uses a discounted cash flow methodology.
4 Economic assumptions Both IFRS and SII use the underlying discounted cash flow methodology, however the discount rate used in the SII balance sheet is higher than that used in the IFRS balance sheet due to the use of the VA for appropriate lines of business.
5 Margins of prudence SII balance sheet uses best estimate demographic assumptions whereas the IFRS assumptions contain margins for adverse deviation.
6 Contract boundaries IFRS values all future premiums due on each contract whereas SII only takes credit for future premiums where there is a future discernible benefit arising from their payment. Further information is provided in section D.2.4.
7 RM – unaudited RM is not included in the IFRS balance sheet.
8 TMTP – unaudited TMTP is not included in the IFRS balance sheet.
9 Other Other relates to product reclassification differences and different treatment of shareholder transfers in closed funds in the IFRS and SII balance sheet.
D.2.4. Bases, methodology and assumptions Segmentation The Group’s life business products are segmented into lines of business on the basis of the nature of the underlying risks as described in the SII guidance. The following table sets out how products are mapped to lines of business. Line of business Products
Health insurance Stand-alone critical illness
Waiver of premium
Income protection
Permanent health insurance
Insurance with profit participation Traditional with-profits
Deposit administration
Unitised with-profits
Accumulating with-profits
Index-linked and unit-linked insurance Property-linked
Other life insurance Non-profit
Accelerated critical illness
Index-linked where the policyholder does not bear the risk
With-profits business that has been converted to or re-classified as non-profit

Valuation for solvency purposes (continued)
69
Unbundling across lines of business The following types of contract are unbundled on the basis that different benefits within the same policy fall under different SII lines of business. Main product Components SII line of business
Unit-linked Unit-linked Index-linked and unit-linked
Unitised with-profits* Insurance with-profits participation
Non unit-linked rider** Other life insurance or health business
Unitised with-profits Unitised with-profits Insurance with-profits participation
Unit-linked* Index-linked and unit-linked
Non-profit rider Other life insurance or health business
Conventional with-profits Conventional with-profits Insurance with-profits participation
Non-profit rider Other life insurance or health business
Conventional non-profit Conventional non-profit Other life insurance or health business
Non-profit rider Other life insurance or health business
* Hybrid products consisting of unitised with-profits and unit-linked funds are unbundled.
** Not unbundled where the non unit-linked riders are embedded within the contract e.g. paid for from deduction from units.
Contract boundary The term ‘contract boundary’ under SII defines:
� when a policy is first included within technical provisions (inception);
� which premiums should be included within the technical provisions calculation; and
� when the policy ends and is excluded from technical provisions (payment of final benefit or policy expiry or lapse). Future regular premiums are included in the technical provisions calculation in the following cases:
� all conventional non-profit business;
� all with-profits policies; and
� unit-linked policies where a waiver of premium benefit is provided, or if there is a death, disability, accident or sickness benefit which is equal to or more than 101% of the unit fund or there is a cap on potential expense charges. Future premiums are excluded for unit-linked policies that do not contain these risk benefits.
The contract end boundary is determined as follows:
� For policies with no renewal dates, the end boundary is based on the contract term or retirement date selected by the policyholder. Early and late retirements are reflected based on best estimate assumptions for future experience.
� Certain contracts such as annuities, pensions with GAOs and whole of life products have no specific contract end date.
� Where there are premium review dates on business providing risk benefits and the Group does not have the option to re-underwrite at the premium review date, the end boundary is based on the contract term. Where the Group has the option to amend premiums and/or benefits to fully reflect the risks, the boundary is the first review date.
� For reviewable reinsurance ceded, the reinsurance contract end boundary is the same as for the underlying reinsured policies, as the reinsurers do not have a unilateral right to amend the premiums.
Data quality There are data quality standards which set out the management approach, governance arrangements and the minimum standards used to ensure that data used for financial reporting is appropriate, complete and accurate. The standards are part of FRDCF and assume a proportionate and risk-based approach. They are in line with the principles of SII and are also consistent with the overarching risk management policy. There are no known limitations or inaccuracies in data that materially impact the technical provisions. In case of such limitations or inaccuracies, an adequate additional provision would be held.

Valuation for solvency purposes (continued)
70
D.2.5. Calculation of best estimate liabilities The following sections outline how BEL is valued for each line of SII business. BEL for with-profits insurance For the majority of with-profits business, the BEL is calculated as the sum of:
� asset shares; and
� value of future policy-related liabilities. Asset shares are an accumulation, to the valuation date, of premiums paid allowing for investment returns, expenses and/or charges, and any enhancements from miscellaneous surplus. Principles and practices underlying the asset share methodology are set out in the PPFMs. Asset shares for some products are calculated using prospective (or other methods) rather than retrospective methods, for example for some whole life policies and paid-up policies. The value of future policy-related liabilities is calculated as follows:
� the cost of providing financial guarantees (costs and other benefits not reflected in the asset share) determined using a stochastic valuation. A stochastic valuation is derived from estimating probability distributions of potential outcomes, when one or more of the variables are random;
� plus or minus the cost of smoothing payouts to policyholders determined using a stochastic valuation in accordance with the smoothing rules;
� plus the cost of providing financial options determined using a stochastic valuation;
� minus the value of policy charges for providing options and guarantees using a stochastic valuation;
� minus the value of other charges deducted from asset shares net of future expenses;
� for UF OB, UF IB and RA IB funds only, minus the value of 1/9th cost of bonus transfers (this deduction is to comply with guideline 8 of the EIOPA Guidelines on ring-fenced funds as the transfers, being future charges from asset shares (above), would otherwise be treated as a liability); and
� for RL Open Fund only, minus the value of expense charging arrangements in respect of the SL, PLAL, Liver and RL (CIS) Funds in RLMIS, and the Liver Ireland Fund in RLI DAC.
BEL for index-linked and unit-linked insurance With the exception of the unit fund liability part of unit-linked liabilities (which are classified as TPCAW), the BEL for linked life insurance business is calculated from a prospective deterministic valuation, as the present value of future cash flows. Cash flows are projected based on product terms, a set of demographic assumptions and assumed returns on unit-linked funds reflecting risk-free returns and fund charges. This leads to the BEL corresponding to the probability-weighted average of future cash flows. For linked insurance business with options and guarantees, the BEL is calculated as the present value of cash flows for an identical contract without options and guarantees plus the cost of the options and guarantees. BEL for health insurance and other insurance The BEL for health insurance and other life insurance business is generally calculated from a prospective deterministic valuation, as the present value of future cash flows. Cash flows are projected based on a set of demographic assumptions and product features. This leads to the BEL corresponding to the probability-weighted average of future cash flows. Simplified BEL calculations The methods for calculating BEL described above are varied and simplifications are used for less material classes of business where their application would not be practical or proportionate. Simplifications used are chosen only where they are expected to produce a more prudent provision than applying the methods described above. D.2.6. Stochastic techniques Stochastic methods are used to calculate the costs of options, guarantees and smoothing, i.e. part of the BEL. A market-consistent set of economic scenarios is generated and the costs valued in each scenario using a discount curve equal to the projected future risk-free curve for that scenario (net of any I-E tax). The BEL calculation is consistent with information provided by the financial markets as a market-consistent valuation is placed on the value of options and guarantees. This requires a specific set of scenarios to be produced as an input. These scenarios are produced by an economic scenario generator (ESG). The scenarios are validated against market data at the valuation date and meet certain properties to enable a market-consistent value of the liabilities to be produced.

Valuation for solvency purposes (continued)
71
D.2.7. Assumptions used Demographic assumptions for future experience are set on a best estimate basis as described below:
� Mortality and morbidity risks are inherent in most lines of business. For protection business, an increase in mortality and morbidity rates leads to increased claim levels and hence an increase in liabilities. For annuity business the mortality risk is that policyholders live longer than expected. Reinsurance arrangements have been put in place to mitigate mortality and morbidity risks. The rates of mortality and morbidity are set in line with recent internal experience, where it is available in sufficient volume to provide reliable results. Where internal experience is not considered sufficient, rates have been set by reference to either industry experience or the terms on which the business is reinsured.
� Persistency is the extent to which policies remain in-force and are not for any reason lapsed, made paid-up, surrendered or transferred prior to maturity or expiry. The rates of persistency are set in line with recent company experience. Where appropriate, these rates are adjusted to allow for expected future experience being different from past experience. The rates vary by product line, sales channel, duration in force and for some products by fund size and age.
� GAO take-up rates, where at retirement a customer chooses to receive a guaranteed regular income rather than take the pension fund as cash, are also key assumptions set using expert judgement and recent experience.
� For the main classes of business, expense assumptions are set in accordance with management service agreements and for business transferred to RLMIS, in accordance with the appropriate scheme of transfer. Expenses for those classes of business not covered by either a management service agreement or a scheme of transfer are based on the actual expenses incurred. The Group expense assumptions ‘look through’ RLMS per policy costs and use actual expenses incurred.
� Per policy expenses are assumed to inflate in line with the change in the UK Retail Price Index or the Republic of Ireland Consumer Price Index as appropriate, plus a margin. The margin varies between open and closed books of business in each insurance entity.
The key assumption changes during 2019 relate to:
� Mortality assumptions for annuity business. The assumptions have been updated to use the 2018 projection model issued by the Continuous Mortality Investigations Bureau (CMIB). The new assumptions reflect the forecasts that future life expectancy will not improve by as much as previously predicted.
� Mortality and morbidity risks for UK protection business. The assumptions have been updated to use latest experience, and for income protection business, to use the latest IP06 tables for claims inception rates. The new assumptions reflect lower levels of morbidity than previously assumed.
� Persistency assumptions have been updated for pensions business to reflect recent experience for Pension and Legacy business units. For the Pension business unit, a Generalised Linear Model has been introduced, allowing persistency assumptions to be set at a more granular level than previously used for the most material product lines.
� GAO take-up assumptions have been updated to reflect recent experience. For business in the RL (CIS) Fund, the assumptions are now based on five fund-sized bands rather than two used previously.
� Per policy expenses on unit-linked pensions have been reduced, reflecting the latest experience following large volumes of new business sold in recent years; and
� Future expense inflation rates have also been updated in line with latest future projections of expenses following the Part VII transfer of business to RLI DAC.
Where the BEL is calculated as the sum of an asset share (whether retrospective or prospective) and future policy-related liabilities, a projection of future annual and terminal bonuses is required for the future policy-related liabilities. The level of future annual bonus is assumed to remain unchanged from the rates declared at the most recent bonus declaration. In addition, economic assumptions are used, based on:
� initial curve of risk-free rates of interest by currency as defined for SII (including VA for applicable business); and
� inflation (linked to ESG where stochastic valuation methods are used).

Valuation for solvency purposes (continued)
72
D.2.8. Transitional measures Volatility Adjustment The prescribed VAs set out in the table below have been applied to with-profits business and annuities in payment: Business VA
GBP 15bps
EUR 7bps
The impact of reducing the VA to zero on the SII balance sheets (including technical provisions, own funds and SCR) for the Group and RLMIS is set out below. Impact of reducing VA to zero – Group 31 December 2019 £m Including VA Excluding VA
Impact of removing VA
Technical provisions 87,863 88,188 325
Basic own funds1 6,785 6,871 86
Eligible own funds to meet SCR1 7,070 7,156 86
SCR – unaudited 4,438 4,548 110
MCR 1,079 1,107 28
Investor View – solvency surplus 5,810 5,462 (348)
Investor View – capital cover ratio 231% 220% (11)%
Regulatory View – solvency surplus 2,632 2,608 (24)
Regulatory View – capital cover ratio 159% 157% (2)%
1 The impact of removing the VA on basic own funds and eligible own funds does not agree to the QRT S.22.01.22 due to the QRT including the removal of both
TMTP and VA.
Impact of reducing VA to zero – RLMIS
31 December 2019 £m
Including VA £m
Excluding VA £m
Impact of removing VA
£m
Technical provisions 87,932 88,257 325
Basic own funds1 7,123 7,209 86
Eligible own funds to meet SCR1 7,123 7,209 86
SCR - unaudited 4,262 4,372 110
MCR 1,066 1,094 28
Investor View – solvency surplus 6,037 5,689 (348)
Investor View – capital cover ratio 242% 230% (12)%
Regulatory View – solvency surplus 2,861 2,837 (24)
Regulatory View – capital cover ratio 167% 165% (2)%
1 The impact of removing the VA on basic own funds and eligible own funds does not agree to the QRT S.22.01.22 due to the QRT including the removal of both
TMTP and VA.
Transitional Measure on Technical Provisions.–.unaudited The impact of reducing the TMTP to zero on the SII balance sheet (including technical provisions, own funds and SCR) for the Group and RLMIS are set out below.

Valuation for solvency purposes (continued)
73
Impact of reducing TMTP to zero – Group
31 December 2019 £m
Including TMTP
Excluding TMTP
Impact of removing
TMTP
Technical provisions 87,863 90,831 2,968
Basic own funds 6,785 6,003 (782)
Eligible own funds to meet SCR 7,070 6,288 (782)
SCR – unaudited 4,438 4,438 -
MCR 1,079 1,079 -
Investor View – solvency surplus 5,810 2,842 (2,968)
Investor View – capital cover ratio 231% 164% (67)%
Regulatory View – solvency surplus 2,632 1,850 (782)
Regulatory View – capital cover ratio 159% 142% (18)%
Impact of reducing TMTP to zero – RLMIS
31 December 2019 £m
Including TMTP
Excluding TMTP
Impact of removing
TMTP
Technical provisions 87,932 90,900 2,968
Basic own funds 7,123 6,341 (782)
Eligible own funds to meet SCR 7,123 6,341 (782)
SCR – unaudited 4,262 4,262 -
MCR 1,066 1,066 -
Investor View – solvency surplus 6,037 3,069 (2,968)
Investor View – capital cover ratio 242% 172% (70)%
Regulatory View – solvency surplus 2,861 2,079 (782)
Regulatory View – capital cover ratio 167% 149% (18)%
D.2.9. Recoverables on reinsurance contracts The Group uses reinsurance to reduce the insurance risks associated with the following material business:
� RL (CIS) Fund annuities in payment are reinsured in tranches with XL, Swiss Re and RGA. These arrangements are collateralised;
� the majority of the pre-2017 pension vestings in the RL Open Fund are reinsured with Prudential. Whilst the benefit payments are 100% reinsured, some expense risk is retained. There is a floating charge over the assets of Prudential in the event of default; and
� protection business is reinsured with a range of reinsurers. In each case, a high proportion of the insurance risk is reinsured, leaving the Group with a low retained benefit/risk.
Reinsurance is also used for some other business. These product lines are not material. The Group does not use any finite reinsurance arrangements or any special purpose vehicles to conduct its reinsurance programme. The reinsurance recoverables are calculated using the same methodology and assumptions as the gross BEL. D.2.10. Uncertainty associated with the value of best estimate liabilities Uncertainties associated with the BEL arise principally from:
� risks considered in the SCR/ORSA (including market risk, credit risk and insurance risk);
� volatility in the best estimate assumptions from year to year; and
� uncertainty that assumptions experience in the recent past can be assumed to apply over the future life of the business. The approach taken for complex risk structures (options, guarantees, policyholder behaviour and future management actions) and limitations and approximations in the methodology are detailed in section D.2.5. Technical provisions are most sensitive to persistency, mortality, expense and economic assumptions.

Valuation for solvency purposes (continued)
74
The sensitivity to key assumptions used in the calculation of technical provisions is disclosed in section C.7.2. D.2.11. Risk Margin – unaudited Methodology overview The RM has been calculated separately for RLMIS and RLI DAC. The Group’s RM is therefore the sum of the RM for RLMIS and the RM for RLI DAC. The RM calculation for each entity assumes the respective business is transferred to another insurance undertaking (reference undertaking) and represents the cost to the reference undertaking of providing capital covering its SCR over the expected lifetime of the business. The RM for RLMIS has been calculated on the basis of the Internal Model SCR, and for RLI DAC, the RM has been calculated on the basis of the Standard Formula SCR. Residual market risk in the reference undertaking is taken as zero, as it is assumed that a reference undertaking could hedge all market risk, leaving the business with no exposure to market risk. Hence the RM is calculated based on the run-off of non-market risk SCR. A risk driver approach is used to project the SCR, under which the individual risk components of the SCR are projected in line with selected risk drivers. The risk drivers are selected so as to provide a true run-off of each risk component. Uncertainty associated with the Risk Margin Uncertainties in the RM arise from future interest rates and factors affecting the methodology assumed for the run-off of SCR components. D.3 Other liabilities The 2019 IFRS to SII balance sheet reconciliation is presented in section D.1, including an explanation of the presentation adjustments required to align the IFRS balance sheet to the prescribed format of the SII balance sheet, and the valuation adjustments. D.4 Alternative methods for valuation The Group has a Valuation Oversight Committee (VOC) which is responsible for the valuations and disclosure of investment assets, including those assets within levels 3 to 5 of the SII hierarchy as detailed in section D.1.5. Due to their nature, assets within levels 3 to 5 of the SII hierarchy have the risk of a greater valuation uncertainty. Valuation uncertainty is higher in asset classes where there is no secondary source available and there is no secondary trading activity. In these instances, processes are in place to validate the valuations, such as backtesting for private equity investments and external surveyor’s transaction reviews for unquoted property. The table below provides information on key assumptions, valuation techniques and unobservable inputs for those assets measured as levels 3-5 of the SII hierarchy above (equivalent to level 3 in the IFRS fair value hierarchy shown in note 21 of the 2019 ARA). The table shows non-linked assets only but the same valuation techniques are applied to equivalent assets held within the unit-linked funds. There are no liabilities within levels 3 to 5 of the SII hierarchy at 31 December 2019.

Valuation for solvency purposes (continued)
75
Alternative valuation methods
Assets
Group 2019 SII
value £m
RLMIS 2019 SII
value £m Valuation techniques Unobservable input
Range (weighted average)
Property, plant & equipment held for own use and property (other than for own use)
204 182 Income capitalisation
Market comparison
Equivalent yield
Estimated rental value per square foot
Price per acre
5.0% – 8.3% (5.2%)
£13.68 – £22.00 (£16.29)
£2,670,000
Participations – shares - 466 Adjusted equity method, net present value of future projected cash flows and PE multiple
RLUM:
Per policy annual expenses:
Premium paying
Non-premium paying
Expense inflation
Rate card expenses:
Premium paying
Non-premium paying
Rate card expense inflation
Rate card fund expenses (%) pa
Tax
RLAM:
PE multiple
£40.54
£34.62
RPI +2.6%
£24.20
£21.82
RPI +0.5%
0.216%
Enacted corporation tax rate
15
Participations – unquoted investment funds
- 12,416 NAV provided by external fund managers/third party administrators adjusted for any cash flows occurring after the NAV date and before the reporting date
Adjustment to NAV n/a
Equities – unlisted (including unquoted private equity investments and unquoted property funds)
22 22 NAV provided by external fund managers/third party administrators adjusted for any cash flows occurring after the NAV date and before the reporting date
Adjustment to NAV n/a
Bonds 73 72 Single broker unadjusted quotes from third party prices and mark to model using a gross redemption yield
Unadjusted single broker quote n/a
Collective Investment Undertakings – unquoted
373 165 NAV provided by external fund manager/administrator
Adjustment to NAV n/a
Loans & mortgages 2 3 IFRS carrying value used as a proxy for fair value
Adjustment to carrying value n/a

Valuation for solvency purposes (continued)
76
The Group reviews the appropriateness of those valuations within levels 3 to 5 of the hierarchy as set out in the table below:
Property The valuations are obtained from external valuers and are assessed on an individual property basis. Valuation techniques include income capitalisation and market comparison and key inputs to the valuation comprise equivalent yield, estimated rental per square foot and price per acre. The principal assumptions will differ depending on the valuation technique employed. The IAS 40 revaluation model has been adopted in the IFRS statutory accounts and is a good proxy of economic value for solvency purposes.
The extent of uncertainty systemic within the valuation of investment properties has been assessed based on ranges of expected rental yields provided by several independent surveyors by property type and location. Analysis of underlying investment property tenants is also performed to understand the extent of valuation uncertainty for this asset class along with review of valuations to sales and purchases.
Participations – shares, unquoted investment funds and loans
Shares are valued using the adjusted equity method, i.e. the value of the net assets on a SII basis.
Unquoted investment funds are valued using the NAV provided by external fund managers/third party administrators, adjusted for any cash flows occurring after the NAV date and before the reporting date.
The IFRS carrying value is used as a proxy for the SII value of loans.
Equities – unlisted Private equity fund and property fund valuations are provided by the respective managers of the underlying funds and are assessed on an individual investment basis, with an adjustment made for any cash flows occurring between the date of valuation and the end of the reporting period. Sensitivities are determined by comparison to the market.
Valuation uncertainty for private equity funds has been assessed based on ranges of expected valuation movements, taking account of investment drawdowns or distributions using the latest fund manager valuations reports and valuation assumptions. Back-testing analysis is also performed to understand the retrospective extent of valuation uncertainty for this asset class.
Valuation uncertainty for property fund valuations is assessed using the same approach outlined in the Property section above.
Bonds Predominantly valued using single broker unadjusted quotes obtained from third party pricing sources. Sensitivities are determined by flexing the single quoted prices provided using a sensitivity to yield movement.
For illiquid debt securities which are marked to model, the process includes a review of the valuation methodology, periodic assessment of both observable and judgemental model inputs, as well as reviewing any secondary trading activity in the asset to assess the appropriateness of the valuation methodology.
Collective Investment Undertakings – unquoted
The value of investment funds, for which quoted prices are not available, are the NAVs provided by the third-party fund managers.
Loans & mortgages The IFRS carrying value is used as a proxy for the SII value.
D.5 Any other information There is no material information on the valuation of assets and liabilities for solvency purposes that is not already included above.

Capital management
77
E. Capital management
Plain English introduction
The Group has a strong capital position under SII and our capital is of a high quality. However, the capital position should not be too high, as it is important in such scenarios that we continue to return value to our policyholders and members.
In this section, we describe our approach to capital management. Capital (which is broadly assets minus liabilities) absorbs a firm’s losses in periods of stress and provides a buffer to increase resilience against unexpected losses. When a firm’s capital is depleted, it is less likely to be able to meet policyholder claims as they fall due. In this way, the quantity of capital a firm has on the balance sheet can be used as a tool to understand the strength and solvency position of the firm. Capital is referred to as own funds under SII.
In this section we provide information on our own funds, including:
� The objectives, policies and processes for managing our own funds;
� The amount and quality of our own funds; and
� Expected development of own funds, including the intention to redeem items or raise additional own funds.
We also provide details of our SCR and MCR. The capital (own funds) in excess of our SCR is referred to as ‘solvency surplus’.
Unless otherwise stated, the capital management approach is consistent for Group and RLMIS.
The capital position is robust, reflecting the strength of the underlying business and effective capital management strategies. In common with many in the industry, two key metrics are presented: an ‘Investor View’ for analysts and investors in the subordinated debt held in the RL Open Fund, which does not restrict the surplus in the closed funds, and a ‘Regulatory View’ where the closed funds’ surplus in excess of the SCR is excluded from total own funds and treated as a liability, which is known as the closed funds restriction. In September 2019, the PRA approved the use of an Internal Model, to calculate the SCR of the Group and RLMIS at 31 December 2019. The PRA also approved the use of the TMTP. The TMTP is included in figures throughout this section and was last reassessed at 31 December 2019. As permitted under the SII regulations, the SCR, RM and TMTP are not audited.
Key SII metrics Capital position – Group and insurance entities 31 December 2019 £m RLMIS RLI DAC Other1 Total Group
Tier 1 8,791 131 (182) 8,740
Tier 2 1,508 - - 1,508
Tier 3 - - 6 6
Total own funds (A) 10,299 131 (176) 10,254
Closed funds restriction (3,176) (4) 2 (3,178)
Deferred tax asset deduction (B) - - (6) (6)
Adjusted own funds (C) 7,123 127 (180) 7,070
SCR (D) 4,262 54 122 4,438
Solvency surplus (Investor View) (A+B-D) 6,037 77 (304) 5,810
Capital cover ratio2 (Investor View) ((A+B)/D) 242% 244% n/a 231%
Solvency surplus (Regulatory View) (C-D) 2,861 73 (279) 2,632
Capital cover ratio2 (Regulatory View) (C/D) 167% 237% n/a 159%
1 Other comprises own funds and the capital requirements of other entities within the Group and the impact of consolidation adjustments.
2 Figures presented in the table are rounded and the capital cover ratio is calculated based on exact figures.
Further details regarding the capital position of the Group and RLMIS are set out in section E.1.

Capital management (continued)
78
E.1 Own funds E.1.1. Objectives, policies and processes for managing own funds The Group manages its own funds within a Board-approved Capital Management Framework. This sets a target range for capital of being able to withstand between a 1-in-50 and a 1-in-20-year event, and still be able to meet an internal capital requirement. The capital position relative to the target acts as a guideline to inform distribution or determine if management actions are necessary. The amounts paid to policyholders, or management actions taken, are subject to Board discretion to allow wider business factors to be considered. The future progression of own funds, including the position against the target set out in the Capital Management Framework, is considered under a range of scenarios as part of the ORSA. E.1.2. Analysis of solvency position The tables below summarise the Group and RLMIS solvency position at 31 December 2019. The own funds QRTs S.23.01.22 and S.23.01.01 can be found in Appendix 2 and Appendix 3 respectively. Solvency position – Group 31 December 2019 £m Reference
Tier 1 (Unrestricted)
Tier 1 (Restricted) Tier 2 Tier 3 Total
Surplus funds E.1.2.1 8,762 - - - 8,762
Reconciliation reserve (pre closed funds restrictions) E.1.2.1 (22) - - - (22)
Deferred tax assets E.1.2.1 - - - 6 6
Excess of assets over liabilities 8,740 - - 6 8,746
Subordinated liabilities E.1.2.2 - - 1,508 - 1,508
Total own funds (A) 8,740 - 1,508 6 10,254
Closed funds restriction E.1.2.3 (3,178) - - - (3,178)
Deferred tax asset deduction (B) E.1.2.1 - - - (6) (6)
Adjusted own funds (C) 5,562 - 1,508 - 7,070
SCR (D) E.1.2.4 4,438
Solvency surplus (Investor View) (A+B-D) 5,810
Capital cover ratio1 (Investor View) ((A+B)/D) 231%
Solvency surplus (Regulatory View) (C-D) 2,632
Capital cover ratio1 (Regulatory View) (C/D) 159%
1 Figures presented in this table are rounded and the capital cover ratio is calculated based on exact figures.

Capital management (continued)
79
Solvency position – RLMIS
£m Reference Tier 1
(Unrestricted) Tier 1
(Restricted) Tier 2 Tier 3
Total 31December
2019
Restated Total
31 December 20181
Surplus funds E.1.2.1 8,781 - - - 8,781 7,870
Reconciliation reserve (pre closed funds restrictions) E.1.2.1 10 - - - 10 147
Excess of assets over liabilities 8,791 - - - 8,791 8,017
Subordinated liabilities E.1.2.2 - - 1,508 - 1,508 806
Total own funds (A) 8,791 - 1,508 - 10,299 8,823
Closed funds restriction E.1.2.3 (3,176) - - - (3,176) (2,835)
Adjusted own funds (B) 5,615 - 1,508 - 7,123 5,988
SCR (C) E.1.2.4 4,262 3,693
Solvency surplus (Investor View) (A-C)
6,037 5,130
Capital cover ratio2 (Investor View) (A/C)
242% 239%
Solvency surplus (Regulatory View) (B-C)
2,861 2,295
Capital cover ratio2 (Regulatory View) (B/C)
167% 162%
1 The 2018 solvency position for RLMIS has been restated to reflect the move to an Internal Model for calculating capital requirements.
2 Figures presented in this table are rounded and the capital cover ratio is calculated based on exact figures.
E.1.2.1 Total own funds Total Group own funds comprise surplus funds, reconciliation reserve, deferred tax assets and subordinated liabilities. Total RLMIS own funds comprise surplus funds, reconciliation reserve and subordinated liabilities. Further details regarding each own fund item are set out below. As the Group is a mutual and has no shareholders, it does not have any ordinary share capital or share premium. Therefore, there have been no distributions to shareholders impacting own funds. The Group and RLMIS do not have any ancillary own funds. Surplus funds The Group comprises the RL Open Fund, the RLI DAC Open Fund (which is consolidated into the RL Open Fund), and a number of with-profits closed funds arising from businesses that have been acquired in the past. RLMIS comprises the RL Open Fund, and a number of with-profits closed funds arising from businesses that have been acquired in the past. Surplus funds are the accumulated profits of a with-profits fund, which have not been made available for distribution to policyholders and which meet the conditions to qualify as Tier 1 own funds. Consequently, any expected discretionary benefits from future estate distributions are excluded from the BEL component of technical provisions and included in surplus funds. Surplus funds have been calculated as:
� total assets;
� minus: liabilities (other than technical provisions);
� minus: the BEL component of technical provisions (which as above excludes any benefits from future estate distributions) and TPCAW – these figures include any reduction in the BEL from TMTP; and
� minus: (for the ex-UAG funds only) the value of 1/9th of cost of bonus transfers from those funds to the RL Open Fund resulting from future discretionary benefits assumed in the BEL (as these transfers are excluded from the SII BEL in line with Guideline 8 of the ring-fenced fund guidelines). These transfers are similar to shareholder transfers described in Guideline 8 and accordingly have been accounted for in line with that Guideline.

Capital management (continued)
80
Reconciliation reserve The reconciliation reserve is the excess of assets over liabilities, adjusted for surplus funds and the closed fund surplus restriction. The reconciliation reserve is treated as Tier 1 unrestricted own funds. The reconciliation reserve is calculated as follows: Reconciliation reserve 31 December 2019 £m Group RLMIS
Excess of assets over liabilities 8,746 8,791
Less: Other basic own fund items
Surplus funds1 (8,768) (8,781)
Less: Restricted own fund items due to ring fencing (3,178) (3,176)
Total (3,200) (3,166)
1 Group surplus funds include the deferred tax asset of £6m.
The reconciliation reserve may be subject to potential volatility and further details regarding the various sensitivities on the excess of assets over liabilities which forms part of the Own Funds calculation are set out in section C.7.2. The ring-fenced fund adjustment is described further below in section E.1.2.3. Deferred tax assets A deferred tax asset of £6m is included in Tier 3 Group own funds. The deferred tax assets are described in further detail in section D.1.3. E.1.2.2 Subordinated debt The subordinated debt within the Group and RLMIS’s own funds relates to subordinated liabilities in the form of:
� the Fixed Rate Reset Callable Guaranteed Subordinated Notes due 2043 (the 2043 notes);
� the Guaranteed Subordinated Notes due 2028 (the 2028 notes); and
� the Fixed Rate Reset Callable Guaranteed Subordinated Notes due 2049 (the 2049 notes). These notes were issued by RL Finance Bonds No 2 plc, RL Finance Bonds No 3 plc and RL Finance Bonds No 4 plc respectively. These notes are treated as Tier 2 own funds after meeting the full criteria set out in the regulations to be treated as Tier 2 capital. The movement in subordinated debt in the year is presented in the table below. Movement in subordinated debt
£m 2043 Notes 2028 Notes 2049 Notes
Total subordinated
debt
Opening subordinated debt at 31 December 2018 434 372 - 806
Subordinated debt issuance - - 585 585
Interest expense 25 21 7 53
Payment of interest to bondholders (25) (21) - (46)
Fair value losses 20 49 41 110
Closing subordinated debt at 31 December 2019 454 421 633 1,508
Further information on these liabilities and the key terms and conditions of these notes is given in note 31 on page 199 of the 2019 ARA.

Capital management (continued)
81
E.1.2.3 Availability restrictions As noted above, the Group comprises the RL Open Fund, RLI DAC Open Fund (which is consolidated into the RL Open Fund) and a number of closed funds. RLMIS comprises the RL Open Fund and a number of closed funds. These closed funds are ring-fenced funds. The own funds of a ring-fenced fund are only available to absorb losses in that ring-fenced fund and are not (on a going concern basis) available to other parts of the Group. For this reason they are known as ‘restricted own funds’. The maximum amount of restricted own funds that can be recognised in the overall own funds is the value of the ring-fenced fund’s notional SCR (the notional SCR is also included in the overall capital requirement). Any restricted own funds over and above the notional SCR is deducted from the total own funds to derive the eligible own funds, which are available to cover the capital requirement as a whole. The calculation of the ring-fenced fund (RFF) deduction for the Group and RLMIS is presented in the table below. Ring-fenced fund deduction – Group
31 December 2019 £m Notional SCR Own funds RFF deduction
Deferred tax asset
deduction
Own funds eligible for
undertaking
RL Open Fund1 2,213 4,851 n/a (6) 4,845
Closed funds 2,225 5,403 (3,178) n/a 2,225
Total 4,438 10,254 (3,178) (6) 7,070
1 The RLI DAC Open Fund is consolidated into the RL Open Fund.
Ring-fenced fund deduction – RLMIS
31 December 2019 £m Notional SCR Own funds RFF deduction
Own funds eligible for
undertaking
RL Open Fund 2,045 4,906 n/a 4,906
Closed funds 2,217 5,393 (3,176) 2,217
Total 4,262 10,299 (3,176) 7,123
The Group and RLMIS have no other availability restrictions at 31 December 2019. E.1.2.4 Eligible own funds covering the Solvency Capital Requirement and Minimum Capital Requirement The SCR at 31 December 2019 is £4,438m for the Group and £4,262m for RLMIS. The Group and RLMIS SCR are calculated using an Internal Model. Further details of the methodology used to calculate the SCR are included in section E.4, including details of the undertakings which are in scope of the Internal Model. The MCR at 31 December 2019 is £1,079m for the Group and £1,066m for RLMIS. In accordance with the regulations, the MCR for the Group is the sum of the MCR for RLMIS and RLI DAC. The eligible amounts of own funds to cover the SCR and MCR for the Group and RLMIS, classified by tiers together with the solvency ratios are set out below. The ratio of the eligible own funds to SCR and MCR is calculated by dividing the total eligible own funds to meet the SCR and MCR by the value of the SCR and MCR. Eligible own funds covering the Solvency Capital Requirement and Minimum Capital Requirement
Group RLMIS 31 December 2019 £m Total
Tier 1 unrestricted Tier 2 Total
Tier 1 unrestricted Tier 2
Total eligible own funds to meet the SCR 7,070 5,562 1,508 7,123 5,615 1,508
Total eligible own funds to meet the MCR 5,494 5,278 216 5,828 5,615 213
SCR 4,438 4,262
MCR 1,079 1,066
Ratio of eligible own funds to SCR 159% 167%
Ratio of eligible own funds to MCR 509% 547%

Capital management (continued)
82
There are no Tier 1 restricted own funds at 31 December 2019 in either the Group or RLMIS. The Group has Tier 3 own funds relating to deferred tax assets of £6m at 31 December 2019, however, Tier 3 own funds are not available to cover the SCR and MCR. E.1.3. Analysis of movement in capital position The tables below set out an analysis of the movement in own funds, SCR, closed funds restriction and Investor and Regulatory View solvency surplus between 1 January 2019 and 31 December 2019 for the Group and 31 December 2018 and 31 December 2019 for RLMIS. Movement in capital position – Group
£m Note
RL Open Fund own funds
RL Open Fund
SCR Closed funds
own funds
Closed funds SCR
Solvency surplus
(Investor View)
Closed funds restriction
Solvency surplus
(Regulatory View)
1 January 2019 on a Standard Formula basis – unaudited 4,065 2,306 4,901 2,248 4,412 2,653 1,759
Capital add-on 1 1 (55) 20 (393) 469 413 56
Move to Internal Model 2 109 (170) (309) (75) 45 (234) 279
1 January 2019 (restated) –unaudited 4,175 2,081 4,612 1,780 4,926 2,832 2,094
Existing business Own Funds generation, excluding RM and TMTP from current back book 26 - 111 - 137 111 26
TMTP run-off (58) - (108) - (166) (108) (58)
Existing business RM run-off from current back book 56 - 76 - 132 76 56
Existing business SCR run-off from current back book - (109) - (59) 168 59 109
Total Existing Business Excess Capital Generation from current back book 3 24 (109) 79 (59) 271 138 133
Existing business Own Funds generation, excluding RM and TMTP from new business 174 - - - 174 - 174
Existing business RM run-off from new business (125) - - - (125) - (125)
Existing business SCR run-off from new business - 171 - - (171) - (171)
Total Existing Business Excess Capital Generation from new business 4 49 171 - - (122) - (122)
Experience variance and change in operating assumptions 5 (51) - 24 - (27) 24 (51)
Economic variance 6 336 44 545 525 312 20 292
Other (25) - 3 - (22) 3 (25)
Total Organic Excess Capital Generation 333 106 651 466 412 185 227
Excess capital generation from model changes and other management actions 7 (55) 26 325 (21) 265 346 (81)
Debt issuance 8 585 - - - 585 - 585
Interest expense 9 (53) - - - (53) - (53)
Distributions 10 (140) - (185) - (325) (185) (140)
Total Change in Excess Capital 670 132 791 445 884 346 538
31 December 2019 4,845 2,213 5,403 2,225 5,810 3,178 2,632

Capital management (continued)
83
Movement in capital position – RLMIS
£m Note
RL Open Fund own funds
RL Open Fund
SCR
Closed funds
own funds
Closed funds SCR
Solvency surplus
(Investor View)
Closed funds
restriction
Solvency surplus
(Regulatory View)
31 December 2018 on a Standard Formula basis
4,119 2,228 4,900 2,249 4,542 2,651 1,891
Capital add-on 1 1 (55) 20 (393) 469 413 56
Move to Internal Model 2 92 (256) (309) (80) 119 (229) 348
31 December 2018 (restated) – unaudited
4,212 1,917 4,611 1,776 5,130 2,835 2,295
Existing business Own Funds generation, excluding RM and TMTP from current back book 26 - 111 - 137 111 26
TMTP run-off (58) - (109) - (167) (109) (58)
Existing business RM run-off from current back book 56 - 76 - 132 76 56
Existing business SCR run-off from current back book - (109) - (59) 168 59 109
Total Existing Business Excess Capital Generation from current back book 3 24 (109) 78 (59) 270 137 133
Existing business Own Funds generation, excluding RM and TMTP from new business 174 - - - 174 - 174
Existing business RM run-off from new business (125) - - - (125) - (125)
Existing business SCR run-off from new business - 171 - - (171) - (171)
Total Existing Business Excess Capital Generation from new business 4 49 171 - - (122) - (122)
Experience variance and change in operating assumptions 5 (51) - 24 - (27) 24 (51)
Economic variance 6 360 40 536 521 335 15 320
Other (25) - 3 - (22) 3 (25)
Total Organic Excess Capital Generation 357 102 641 462 434 179 255
Excess capital generation from model changes and other management actions 7 (55) 26 325 (21) 265 346 (81)
Debt issuance 8 585 - - - 585 - 585
Interest expense 9 (53) - - - (53) - (53)
Distributions 10 (140) - (184) - (324) (184) (140)
Total Change in Excess Capital 694 128 782 441 907 341 566
31 December 2019 4,906 2,045 5,393 2,217 6,037 3,176 2,861

Capital management (continued)
84
Note Information
1 The opening solvency surplus disclosed in the 2018 SFCR has been restated to reflect a revised capital add-on that would have been applied at that date on the Standard Formula capital basis.
2 The opening solvency surplus disclosed in the 2018 SFCR has also been restated to reflect the move to preparing the capital requirements on an Internal Model basis, from the previous Standard Formula basis.
3 The run-off of existing business results in a capital benefit, primarily due to the release of the related SCR requirements. This increases solvency surplus by £133m.
4 The impact of new business written during the year decreased the solvency surplus by £122m, after allowing for contract boundary restrictions, additional RM and capital requirements. This primarily relates to the capital strain associated with volumes of new individual and group unit-linked pensions business.
5 During 2019, positive changes to non-economic best estimate assumptions have been offset by adverse experience variations including one-off project costs and investment in the business. This has led to a £51m reduction in solvency surplus.
6 The £292m and £320m increase in solvency surplus for the Group and RLMIS respectively reflects the benefit of strong market performance over the year, particularly in equity markets partially offset by falls in risk-free yields. Movements in risk-free rates impact the RL (CIS) Fund given its significant exposure to pensions business with GAOs. Falls in risk-free rates over 2019 increase BEL and associated capital requirements, which are offset by the interest rate hedging programme in place to mitigate this risk to solvency surplus.
7 The combined impact of a series of minor model changes and other management actions, covering both best estimate and capital models and includes updates to Internal Model risk calibrations, reduces solvency surplus by £81m.
8 On 7 October 2019, RL Finance Bonds No. 4 plc, a wholly owned entity of the Group, issued the 2049 Notes. The nominal value at the date of issue was £600m. The fair value at the date of issue was £585m (which takes into account the discount and costs incurred on the issue), further increasing the own funds of the RL Open Fund and solvency surplus.
9 Interest expense decreases solvency surplus by £53m, reflecting interest expense on the subordinated debt as detailed in section E.1.2.2.
10 Distributions relate to ProfitShare of £140m to eligible customers and closed funds distributions of £185m. This decreases the solvency surplus.
E.1.4. Reconciliation of IFRS unallocated divisible surplus to excess of assets over liabilities The UDS in the IFRS financial statements represents the surplus in the RL Open Fund on an IFRS basis for which the allocation between participating policyholders has yet to be determined. The UDS is effectively the net assets on an IFRS basis. The reconciliation below shows the differences between the UDS in the IFRS financial statements and the SII own funds. Reconciliation of IFRS unallocated divisible surplus to SII excess of assets over liabilities 31 December 2019 £m Notes Group RLMIS
UDS per IFRS financial statements 3,998 4,244
Adjustments to a SII basis:
Adjustment to the value of technical provisions and reinsurance assets 1 895 897
Goodwill, other intangible assets and deferred acquisition costs 2 (627) (625)
Other valuation differences 3 (22) (214)
Inclusion of closed funds surplus classified as an IFRS liability 4 4,502 4,489
Excess of assets over liabilities in SII balance sheet 8,746 8,791
Subordinated debt 5 1,508 1,508
Deferred tax adjustment 6 (6) -
Ring-fenced fund adjustment (includes TMTP which is unaudited) 7 (3,178) (3,176)
Total own funds under SII 7,070 7,123

Capital management (continued)
85
Note Information
1 The adjustment to the value of technical provisions and reinsurance assets results from the recalculation of these balances using SII requirements. This includes the removal of the margins of prudence and planned enhancements included in the IFRS values (so that assumptions are all best estimate), the inclusion of the SII RM, the use of the SII yield curve including the VA for appropriate lines of business, the adoption of SII contract boundary definitions (mainly affecting unit-linked business) and also any benefit from the SII transitional provisions.
2 Goodwill, other intangible assets and deferred acquisition costs are recognised in the IFRS balance sheet. Under the SII valuation rules, these assets are valued at nil.
3 Other valuation differences relate principally to the value of participations, renewal commission and subordinated liabilities. In the IFRS balance sheet participations are valued at fair value, and for SII the valuation equates to the value of net assets on a SII basis. Renewal commission is recognised in the IFRS balance sheet but not on a SII basis. Subordinated liabilities are held at amortised cost for IFRS and at fair value for SII.
4 For IFRS any excess of assets over liabilities within the closed funds is included within liabilities so the UDS includes amounts relating to the RL Open Fund only. For SII, the excess within the closed funds is included within total available own funds, but only up to the value of the SCR of the closed funds.
5 Subordinated liabilities in the form of the 2043 Notes, 2028 Notes and 2049 Notes are included within available own funds on a SII basis, whereas IFRS treats subordinated debt as a liability.
6 The Group has deferred tax assets which are restricted under the SII valuation rules and therefore do not form part of available own funds.
7 The ring-fenced fund adjustment is where the closed funds’ surplus in excess of the SCR is excluded from total available own funds and treated as a liability.
E.2 Solvency Capital Requirement and Minimum Capital Requirement E.2.1. Solvency Capital Requirements The Group SCR is calculated using an accounting consolidation-based method (method 1). The SCRs for non-insurance companies are added to the SCR for the insurance entities to obtain the consolidated Group SCR. The table below provides a breakdown of the Group and insurance entities SCR by risk categories at 31 December 2019. Further details on how these risks are managed, monitored and reported is included in section C. SCR by risk type and insurance entity 31 December 2019 £m Note RLMIS RLI DAC Other Total Group
Risk categories
Underwriting 4,321 50 - 4,371
Market 3,179 7 - 3,186
Counterparty default 146 8 - 154
Operational 665 3 - 668
Diversification 1 (2,508) (11) - (2,519)
Basic SCR 5,803 57 - 5,860
Loss-absorbing capacity of technical provisions 2 (1,628) - - (1,628)
Loss-absorbing capacity of deferred taxes 3 (142) (3) - (145)
Other adjustments 4 229 - 122 351
SCR 4,262 54 122 4,438

Capital management (continued)
86
Note Information
1 As risks are not perfectly correlated, a diversification benefit arises between the top-level risk categories, i.e. underwriting risk, market risk, counterparty default risk and operational risk.
2 This reflects the value of management actions recognised within the SCR. These actions comprise reducing target payout ratios to 100% of asset share; moving from annual to quarterly bonus declarations; setting annual bonuses to zero; reducing the equity backing ratio; increasing/introducing investment guarantee charges; and removing past miscellaneous surpluses.
3 The loss-absorbing capacity of deferred taxes is an adjustment which can be applied to the SCR. This adjustment reflects the potential compensation of unexpected losses through a simultaneous change in deferred taxes. It is calculated as the change in the net tax position, representing the difference between the net deferred tax asset and net deferred tax liability in the SII balance sheet, and the net deferred tax asset and net deferred tax liability in the post-stress SII balance sheet.
4 Other adjustments include elements that are outside of the individual risk categories. Specific examples within RLMIS include the floor in respect of the defined benefit staff pension schemes, such that the capital requirements in respect of these liabilities are no lower than the IAS 19 surplus and other out-of model adjustments.
The ‘Other adjustments’ row includes the capital requirements of non-insurance entities within the Group and the removal of the RLI DAC capital requirement held within RLMIS.
E.2.2. Changes in Solvency Capital Requirement A movement analysis which includes movements in the SCR for the Group and RLMIS is set out in section E.1.3. E.2.3. Minimum Capital Requirement In accordance with the regulations, the MCR for the Group is the sum of the MCR for RLMIS and RLI DAC. The components of the overall calculation of the Group MCR as at 31 December 2019 are: MCR by insurance entity 31 December 2019 £m RLMIS RLI DAC Total Group
MCR before the application of floors and caps 224 1 225
MCR cap (45% of SCR) 1,918 24 1,942
MCR floor (higher of 25% of SCR or €3.7m) 1,066 13 1,079
MCR (post application of floors and caps) 1,066 13 1,079
The MCR is calculated according to a formula prescribed by the regulations and is subject to a floor of 25% of the SCR or €3.7m, whichever is higher, and a cap of 45% of the SCR. The MCR formula is based on factors applied to the technical provisions and capital at risk as at 31 December 2019. Before any cap/collar is applied, the RLMIS MCR has been calculated at £223m as at 31 December 2019 (31 December 2018: £181m). However, SII regulations prescribe that the MCR has to fall within a range of 25% to 45% of the SCR. Hence, the value of the MCR to be reported to the regulator at 31 December 2019 is £1,066m (31 December 2018: £1,119m) consistent with the lower limit. The movement in the MCR in the year is driven by the changes in the RLMIS SCR. Before any cap/collar is applied, the RLI DAC MCR has been calculated at £1m as at 31 December 2019. However, per the SII regulations, the value of the MCR to be reported to the regulator at 31 December 2019 is £13m, consistent with the lower limit of 25%. E.3 Use of a duration-based equity risk sub-module in the calculation of the Solvency Capital Requirement This does not apply, as the Group and RLMIS use an Internal Model to derive its SCR. E.4 Differences between the Standard Formula and any Internal Model used E.4.1. Scope of Internal Model In September 2019, the PRA approved the use of a Partial Internal Model (Internal Model) to calculate the SCR of the Group and RLMIS, effective from 1 October 2019. RLI DAC calculates its SCR on a Standard Formula basis, and this remains appropriate due to its size and risks.

Capital management (continued)
87
The integration technique used is integration technique 1 as set out in Annex XVIII of the Commission Delegated Regulation (EU) 2015/35. The SCR for RLMIS is calculated as:
� the Internal Model SCR for RLMIS funds; plus
� the capital required for RLI DAC, as a participation using the Standard Formula equity Type 2 strategic participations stress. The Group SCR is calculated as:
� the Internal Model SCR for RLMIS funds; plus
� the Standard Formula SCR in respect of RLI DAC; plus
� total own sector capital requirements of the regulated non-insurance entities; plus
� total capital requirements of the non-regulated non-insurance entities, calculated in accordance with Article 336(d) of the Commission Delegated Regulation (EU) 2015/35.
The following material risks are included within the scope of the Internal Model.
� Insurance risk;
� Market risk;
� Credit counterparty risk; and
� Operational risk. Liquidity and strategic risk are not included within the scope of the Internal Model but are considered by the ORSA. E.4.2. Uses of the Internal Model The primary use of the Internal Model is to produce the SCR for regulatory reporting. The wider uses of the Internal Model can be considered under four key categories as described below: Risk management Output from the Internal Model is used to inform risk management processes, supporting the identification, measurement, management, monitoring and reporting of the in scope risks. Specific areas include consideration of the risk profile, risk limits, management information and management actions. Capital assessments The Internal Model is used as an input into the annual capital management planning cycle and other ongoing activities such as stress and scenario testing, hedging, debt capital issuance and with-profits surplus distribution. Capital allocation Outputs of the Internal Model are used to monitor business performance, helping to make decisions about how to deploy capital in the most efficient manner in accordance with risk appetite and relevant strategy. This includes business planning, investment strategy, reinsurance, staff pension scheme strategy and staff remuneration. Forward-looking assessments This includes the ORSA, corporate strategy, product development, product pricing and strategic development.

Capital management (continued)
88
E.4.3. Internal Model methodology The Internal Model uses an all-risk methodology to determine the probability distribution of change in own funds (the loss distribution). The process is summarised below:
1. A risk distribution is derived for each risk modelled within the Internal Model. 2. A dependency structure is also defined which describes how individual risks are correlated with one another. 3. A mathematical relationship known as a copula defines the relationship for all risks across the entire probability distribution. 4. The risk scenario generator uses the copula to generate an extensive set of joint risk outcome scenarios from the individual risk
distributions and dependency structure. 5. A proxy model describes the behaviour of assets and liabilities under stress and is used to avoid the need to rerun the cash flow
models for every risk outcome scenario when calculating the loss distribution. The proxy model must first be calibrated such that it is an accurate representation of the results that would be produced by running the cash flow model. Calibration involves running a large number of scenarios through the cash flow model and using mathematical techniques to convert these results into mathematical functions.
6. The proxy model is used to calculate the balance sheet impact for each of the risk outcome scenarios produced by the risk scenario generator.
7. From these impacts the loss distribution is derived. 8. The SCR is the 99.5th percentile loss from the derived distribution. As part of each valuation, we consider whether adjustments
are required to produce the reported Internal Model SCR. This may include risks not included in the derived distribution, or adjustments for observed differences between the proxy model and cash flow model.
E.4.4. Methodology and assumption differences between the Standard Formula and Internal Model The calculation of the SCR under the two approaches contains a number of differences relating to the methodology and the treatment of risks, as described below. Methodology The Standard Formula uses a capital correlation matrix methodology. This requires 1-in-200 capital requirements for a series of individual risks to be aggregated through a series of correlation matrices, as prescribed by the regulator. Operational risk is then added using a formulaic approach to produce the reported SCR. The Internal Model uses an all-risk capital methodology as summarised in section E.4.3 above. This produces a loss distribution, with the 99.5th percentile capital requirement being determined directly from that distribution, which includes operational risk. Under the Internal Model, health risks are combined with the most appropriate insurance risks. Under the Internal Model, the loss absorbing capacity of technical provisions is calculated as the value of approved management actions that would be taken in the scenario that determines the SCR. The approach under the Standard Formula is to calculate the difference between the net Basic SCR and the gross Basic SCR, where the net Basic SCR allows for changes in the value of future discretionary benefits after the stress events but the gross Basic SCR does not. The Internal Model considers whether additional SCR capital is required in respect of an additional one year’s worth of new business using latest planned volumes.

Capital management (continued)
89
Risks There are two key types of differences between the Internal Model and Standard Formula treatment of risks, as described below. Risks captured within the Internal Model, but not explicitly within the Standard Formula:
� Implied volatilities for equity, property and interest rate risk;
� Inflation risk;
� Movements in the spread between government bonds and risk free swap yields;
� GAO take-up risk and longevity trend risk; and
� Longevity (both level and trend) risks on the defined benefit staff pension schemes. Risks already captured within the Standard Formula, but enhanced within the Internal Model: For all Internal Model risk calibrations, a risk distribution of possible outcomes over a one-year period is produced. This can lead to different stresses at the 1-in-200 point to those specified by the Standard Formula. The Standard Formula implicitly assumes risks are normally distributed whereas under the Internal Model, a range of distributions are used with criteria in place to choose the most appropriate one for any given risk. Additional differences between the way specific risks are modelled in the Standard Formula and Internal Model are summarised in the table below: Risk Standard Formula Internal Model
Interest rate Prescribed duration dependent stress factors to the interest rate curve.
Three principal components, which can be characterised as ‘shift’, ‘twist’ and ‘other’ changes to the risk free curve are modelled separately to produce a risk distribution for interest rate curve.
Equity Prescribed price falls, overlaid with a “symmetric adjustment mechanism”.
Distinct risk distributions for UK equities, overseas equities and alternative assets. No symmetric adjustment mechanism is applied.
Credit Detailed prescribed asset stresses are applied on an individual holding basis. The IAS19 discount rate is assumed to rise in line with implied changes in long-dated AA spreads.
Separate calibrations are performed for asset stresses in respect of spread widening, downgrades and defaults by credit rating and term. The IAS 19 discount rate distribution for changes in the long-dated AA spread is net of a 50% haircut.
Counterparty default Detailed prescribed stress applied on an individual holding basis.
A combined stochastic default/loss model has been developed, split by key counterparty exposures and rating.
Longevity Prescribed level stress applied. Separate risk distributions are produced for level and trend risks.
Persistency Prescribed stress takes the greater of level and catastrophe risks, calculated on a per policy basis.
Individual risk calibrations set separately for level and catastrophe stresses for major product lines, e.g. separate stresses for unit-linked, non-profit and with-profits business. Capital requirements determined for these product groupings.
Expense Prescribed combined level and trend stress. Separate risk distributions set for level and trend risks.
Operational Prescribed formulaic calculation. Scenario driven analysis feeds into a stochastic loss/severity model to produce a capital risk distribution.
E.4.5. Risk measures and time periods used in the Internal Model The risk measures and time periods used in the Internal Model are in line with those set out by the regulations, i.e. the SCR is assessed by considering the capital resources required to ensure that the own funds are sufficient to meet a stress event calibrated to a 99.5% confidence level over a one-year period. Both the Internal Model and the Standard Formula assume that stress events occur instantaneously rather than over a one-year period.

Capital management (continued)
90
E.4.6. Nature and appropriateness of data The main data items used in the Internal Model to calibrate the risk calibrations and the dependency assumptions are market data and internal and external historic experience. In addition, policy and asset data feed into the BEL. The BEL and the data used to calculate it are outside the scope of the Internal Model; however stressed BEL values are inputs into the proxy model fitting process. All data used in the Internal Model is assessed for appropriateness, completeness and accuracy. To support this, controls are in place and data processes are documented in directories and data flow diagrams. These controls are set out in relevant Data Management Frameworks which outline how data is handled, managed and controlled before being used in the Internal Model. In addition, periodic controls to validate the ongoing appropriateness of the data are applied, with the results being documented. Any weaknesses and limitations are logged and prioritised for future development activity. E.5 Non-compliance with the Minimum Capital Requirement and Solvency Capital Requirement The Group and RLMIS have maintained own funds in excess of the MCR and the SCR throughout 2019. E.6 Any other information There is no additional material information regarding capital management to disclose in this section.

Glossary
91
Glossary A Adviser Someone authorised by the FCA, who is qualified by experience and examination to provide financial advice. See also Independent Financial Adviser in this glossary. Annuity An insurance policy that provides a regular income in exchange for a lump-sum payment. Enhanced annuities are sometimes offered, which provide a higher level of income to the purchaser than normal taking into account health and lifestyle. Asset share A policy’s asset share is calculated by accumulating the premiums paid, deducting all applicable expenses and tax, and adding its share of the investment returns achieved by the with-profits fund over the policy’s lifetime. Assets under management (AUM) The total of assets actively managed or administered by, or on behalf of, the Group, including funds managed on behalf of third parties.
B Best estimate liability (BEL) The expected (or probability weighted average) value of the present value of future cash flows for current obligations, projected over the expected life of the contract, taking into account all available market and other information. Board Royal London Mutual Insurance Society Board. Brexit The UK’s departure from the EU, following the UK referendum on 23 June 2016 where British citizens voted to leave the EU. Business unit A sub-division of the Group that focusses on a specific product offering, market or function. A business unit may be a statutory entity or part of one or more separate statutory entities.
C Capital cover ratio Own funds divided by Solvency Capital Requirement. Capital add-on The PRA can apply judgement to determine additional capital requirements (add-ons) to individual firms, which are included when calculating the SCR. Their judgement takes into account a variety of considerations including capital projections, the maturity of the risk management framework and peer group comparisons. CFO Forum A high-level discussion group formed and attended by the Chief Financial Officers of major European insurance companies to discuss and harmonise reporting standards. Closed funds Funds in RLMIS or RLI DAC that are closed to new business. Company The Royal London Mutual Insurance Society Limited. Consumer business unit Our business unit that sells life and pensions business directly to customers. Contract boundary The point where the insurer can unilaterally terminate the contract, refuse to accept a premium, or amend the benefit or premium without limit. Critical illness cover Cover that pays a lump sum if the insured person is diagnosed with a serious illness that meets the cover’s definition. D Deferred acquisition costs (DAC) The method of accounting whereby certain acquisition costs on long-term business are deferred and therefore appear as an asset. This leads to a smoothed recognition of acquisition costs instead of recognising the full amount in the year of acquisition.
Deferred fee income The method of accounting whereby up-front policy charges are deferred and therefore appear as a liability. This leads to a smoothed recognition of these charges instead of recognising the full amount in the year of acquisition. Defined benefit scheme A type of occupational pension scheme, where the benefits are based on the employee’s salary and service. Discounting The process of expressing a future cash transaction in terms of its present value using a discount rate which reflects the time value of money. E Economic assumptions Assumptions of future interest rates, investment returns, inflation and tax. The impact of variances in these assumptions is treated as non-operating profit or loss under EEV. European Embedded Value (EEV) The EEV basis of reporting attempts to recognise the true economic value added over a period and is calculated according to guidelines issued in April 2016 by the CFO Forum. The total profit recognised over the lifetime of a policy is the same as that recognised under the IFRS basis of reporting but the timing of the recognition is different. EEV operating profit The profit on an EEV basis resulting from our primary business operations, namely: life insurance and pensions; managing and administering investments; and acquiring and administering closed long-term insurance funds. EIOPA The European Insurance and Occupational Pensions Authority (EIOPA) is a European Union financial regulatory institution. Expected profit included in future premiums (EPIFP) Profits which result from the inclusion in technical provisions of premiums on existing (in-force) business that will be received in the future, but that have not yet been received.

Glossary (continued)
92
F Fair value The amount for which an asset could be exchanged or a liability settled between knowledgeable, willing parties in an arm’s length transaction. Financial Conduct Authority (FCA) An independent conduct of business regulator, which ensures that business is conducted in such a way that advances the interests of all users of, and participants in, the UK financial sector. Financial options and guarantees For Royal London business, ‘financial options’ refers principally to guaranteed annuity options. ‘Guarantees’ refers to with-profits business where there are guarantees that part of the benefits will not reduce in value, or are subject to a minimum value. Fit and Proper (F&P) The standard required by the regulators to be applied when appointing those employees who effectively run the Group or have other key functions, to make sure they are suitably competent and reputable. G Group The Royal London Mutual Insurance Society Limited and its subsidiaries. Guaranteed Annuity Option (GAO) or Guaranteed Annuity Rate (GAR) These primarily arise in connection with pension business as either:
� a guaranteed income rate specified in the policy; or
� guaranteed terms (option) for converting the pension fund of a policy into an income for life at the policy’s pension date.
I Intermediary business unit Our business unit that sells life and pensions business through intermediaries, primarily independent financial advisers.
Internal Model The processes, systems and calculations that together allow the Group to control the risks that it faces and quantify the capital needed to support those risks. It includes a calculation engine to quantify capital requirements, the Group’s risk management framework and its system of governance. The Internal Model is already used for internal capital management purposes and was approved by the PRA for use for regulatory reporting for the Group and RLMIS from 1 October 2019. International Financial Reporting Standards (IFRS) Accounting standards issued by the International Accounting Standards Board (IASB). M Maintenance expenses Expenses related to the servicing of the in-force book of business, including investment and termination expenses and a share of overheads. Market-consistent basis A basis of valuation in which assets and liabilities are valued in line with market prices and consistently with each other. In principle, each cash flow is valued using a discount rate consistent with that applied to such a cash flow in the capital markets. Matching adjustment An adjustment made to the risk-free interest rate when the insurer sets aside a portfolio of assets to back a predictable portion of their liabilities. Medium-Term Plan (MTP) The MTP is an internal forecast and business plan, which is approved by the Board annually. This sets out Royal London’s forecast and targets over a five year time horizon; the latest MTP was approved in December 2018 and covers the period 2019 – 2023. Minimum Capital Requirement (MCR) The minimum level of capital required by the SII regulations, below which the amount of financial resources should not fall. Mutual A company owned by its members which is not listed on the stock market. A member of a mutual company can vote at its Annual General Meeting.
N New business contribution The expected present value on the EEV basis of reporting of all cash flows arising from new business. Non-profit policy Long-term savings and insurance products other than with-profits policies. O Open-ended investment company (OEIC) Investment funds which pool together investors’ money and invest this in a broad range of shares and other assets. They are similar to unit trusts. Operating assumptions Assumptions in relation to future levels of mortality, morbidity, persistency and expenses. The impact of variances in these assumptions is included within operating profits under EEV. Operating experience variances The impact of actual mortality, morbidity, persistency and expense experience being different to that expected at the start of the period. Operating profit Operating profit is the profit resulting from our business operations. Our primary business operations are providing life assurance and pensions, managing and administering investments and acquiring and administering closed long-term insurance funds. Own funds Regulatory capital under SII. Broadly it is the excess of assets over liabilities (plus subordinated debt and less the Ring Fenced Fund restriction), as measured by the PRA’s regulatory reporting requirements under SII. Own Risk and Solvency Assessment (ORSA) The ORSA is defined as the entirety of the processes and procedures employed to identify, assess, monitor, manage and report the risks the Group faces or may face over the business planning period and to determine the own funds necessary to ensure that its overall solvency needs are met at all times over that period.

Glossary (continued)
93
P Part VII transfer The court process that enables groups of insurance policies to be moved between insurers, under Part VII of the Financial Services and Markets Act 2000. Participating Contracts which are with-profits in type. Pension A means of providing income in retirement for an individual and possibly his/her dependants. Our pension products include personal and group pensions, stakeholder pensions and income drawdown. Pension date The date at which income can be taken from a pension either through a cash lump sum or investment in an annuity. Personal pension A pension plan for an individual policyholder. Pillar 1/2/3 Solvency II regulatory reporting requirements that came into force on 1 January 2016 include three ‘Pillars’:
� Pillar 1 covers the quantitative requirements, for example calculating the amount of capital an insurer should hold.
� Pillar 2 sets out requirements for effective governance and risk management frameworks.
� Pillar 3 focuses on disclosure, reporting and transparency requirements. Insurers must produce two key reports, the Solvency and Financial Condition Report (SFCR) and the Regular Supervisory Report (RSR), in addition to other specific templates.
PLAL The business formerly written by Phoenix Life Assurance Limited. PLAL’s assets and liabilities were transferred into the Company with effect from 29 December 2008. Principles and Practices of Financial Management (PPFM) Documents detailing how we manage our with-profits funds.
Present value of in-force business (PVIF) The present value of the projected future profits after tax arising from the business in-force at the valuation date. ProfitShare ProfitShare is an allocation of part of our operating profits by means of a discretionary enhancement to asset shares or unit fund values of eligible policies. Protection A policy providing a cash sum or income on the death or critical illness of the life assured. Prudential Regulation Authority (PRA) Part of the Bank of England that is responsible for the authorisation, regulation and day-to-day supervision of all insurance firms that are subject to prudential regulation. Present value of new business premiums (PVNBP) The PVNBP is the total of new single premium sales received in the year plus the discounted value, at the point of sale, of the regular premiums we expect to receive over the term of the new contracts sold in the year. Q Quantitative Reporting Templates (QRTs) Forms required under Solvency II for regulatory reporting. They disclose detailed information including technical provisions, own funds and SCR. QRTs must follow a prescribed format. R Rating agencies A rating agency (also called a credit rating agency) is a company that assigns credit ratings, which rate a debtor’s ability to pay back debt and the likelihood of default. Regular premium A series of payments for an insurance contract, typically monthly or annually. Regular Supervisory Report (RSR) A report required under Pillar 3 of the Solvency II directive. This is a private report to the PRA and is not disclosed publicly. Life insurers in the UK are required to submit this report to the PRA in full at least every three years and in summary every year. The RSR includes
both qualitative and quantitative information. Reverse stress test Valuation simulations carried out to assess the impact of a range of scenarios that start with a business failure outcome, in order to identify potential business vulnerabilities. Ring-Fenced Fund (RFF) RLMIS contains seven ring-fenced funds (RAIB, UFOB, UFIB, SL, PLAL, Liver, and RL (CIS)). RLI DAC contains two ring-fenced funds (Liver Ireland Fund and German Bond Fund). The ring-fenced funds are closed to new business and were established when business from various acquisitions was transferred to Royal London. They are in run-off, with surplus to be distributed to policyholders in line with the PPFM for each fund.
Risk margin
Forms part of the calculation of the technical provisions, and represents the amount needed, should all surplus and capital be used up, to transfer all obligations to another insurer. The risk margin, like BEL, is sensitive to interest rate changes. Risk-free rate The theoretical rate of return of an investment with no risk of financial loss. Risk Management Framework (RMF) A disciplined and structured process that is designed to manage, rather than eliminate, the risk of failure to meet business objectives as well as to ensure that the Group is well capitalised. Risk Management System (RMS) Provides assurance that the risks to which the Group may be exposed are being appropriately identified and managed within risk appetite, and that risks that may result in significant financial loss or reputational damage are being minimised. RL Open Fund The part of the Royal London Long Term Fund into which new insurance business is written. RLI DAC Open Fund The part of RLI DAC into which new insurance business is written.

Glossary (continued)
94
Royal London Asset Management (RLAM) Royal London’s asset management business, responsible for managing the Group’s financial assets as well as funds for external clients, including multi-managers, pension funds for FTSE 250 companies, local authorities, universities, charities and individuals. Royal London The Royal London Mutual Insurance Society Limited and its subsidiaries Royal London Insurance Designated Activity Company (RLI DAC) Royal London’s regulated Irish insurance subsidiary. The Company was incorporated on 11 July 2018 with regulatory permissions effective from 1 January 2019. It is 100% owned by RLMIS. Royal London Platform Services (trading as Ascentric) Royal London’s independent wrap platform service which trades as Ascentric, providing investment administration and consolidation services to long-term investors and financial advisers through its online wrap service. Royal London Long-Term Fund The long-term business fund of Royal London, comprising the Royal London Open Fund and a number of closed funds from businesses acquired in the past. S Sales Sales represent PVNBP for life and pensions business. Securitisations Where various types of contractual debt (including for example residential and commercial mortgages) are pooled together in a ‘structure’ and the related cash-flows are sold to third party investors, with repayments made via the structure from the principal and interest cash flows. Senior Managers and Certification Regime (SM&CR) A regime introduced by the FCA and PRA which is designed to make individuals at financial firms more accountable. This applies to insurers from 10 December 2018 and replaces the Senior Insurance Managers Regime (SIMR).
Solo Solo refers to The Royal London Mutual Insurance Society Limited (RLMIS). Solvency II (SII) A European Union directive which became fully applicable to European insurers and reinsurers on 1 January 2016. It covers three main areas, related to capital requirements, risk management and supervisory rules. Solvency II Directive The Solvency II Directive (2009/138/EC) is a Directive in European Union law that codifies and harmonises the EU insurance regulation. Primarily this concerns the amount of capital that EU insurance companies must hold to reduce the risk of insolvency. This applies from 1 January 2016, and was adopted into UK national law in June 2016. Solvency Capital Requirement (SCR) The amount of capital that the PRA requires a UK Life insurer to hold, which is calculated using Solvency II requirements. This can be calculated using the Standard Formula or the Internal Model methods. Solvency and Financial Condition Report (SFCR) A report required under Pillar 3 of the Solvency II directive. Life insurers in the UK are required to disclose this report publicly and to report it to the PRA on an annual basis. The SFCR includes both qualitative and quantitative information. Solvency surplus The excess of own funds over the Solvency Capital Requirement. Standard Formula A prescribed method for calculating the Solvency Capital Requirement that aims under Solvency II to capture the material quantifiable risks that a life insurer is exposed to. If the Standard Formula is not appropriate for the risk profile of the business, a capital add-on may also be applied after agreement with the PRA. Stochastic techniques Valuation techniques that allow for the potential future variability in assumptions by the running of multiple possible scenarios.
Stress testing Valuation simulations carried out to assess the impact of a range of adverse scenarios with different probabilities and severities. Subordinated debt In the event of bankruptcy, dissolution or winding-up, the payments arising from this debt rank after the claims of other creditors. T Technical provisions The amount the Group requires to fulfil its insurance obligations and settle all expected commitments to policyholders and other beneficiaries arising over the lifetime of the portfolio of insurance contracts. Three lines of defence model The three lines of defence model can be used as the primary means to demonstrate and structure roles, responsibilities and accountability for decision-making, risk and control to achieve effective governance, risk management and assurance. Tier (of capital) There are three tiers of capital defined by SII. The quality of capital is important as the higher the quality, the more likely it will be available in the event that it is needed, for example to be able to pay out claims. Tier 1 capital primarily represents high-quality capital which is generally more secure and capable of absorbing losses; Tier 2 capital is of a lower quality and Tier 3 capital is the lowest quality of capital. Transitional Measure on Technical Provisions (TMTP) The transitional measure smooths the transition from the previous Solvency I regime to the SII regime, and spreads the capital impact over 16 years. Once approved by the PRA, this is included within the valuation of technical provisions. U UK Corporate Governance Code (the Code) This sets out guidance in the form of principles and provisions on how companies should be directed and controlled to follow good governance practice.

Glossary (continued)
95
Unallocated divisible surplus (UDS) The amount of surplus under the IFRS basis of accounting which has not been allocated to policyholders at the balance sheet date. Unit-linked policy A policy for which the premiums buy units in a chosen investment fund. Unit trust A collective investment which invests in a range of assets such as equities, fixed interest investments and cash. A unit trust might be a general fund or specialise in a particular type of asset, for example property, or in a particular geographical area, for example South East Asia. Unitised with-profits policy A policy for which the premiums buy units in a with-profits fund. V Value of in-force business (VIF) See definition of ‘Present value of in-force business (PVIF)’. Volatility adjustment (VA) An adjustment made to the risk-free interest rate. It is designed to protect insurers with long-term liabilities from the impact of volatility on the insurers’ solvency position. It is provided and updated by EIOPA and can differ for each major currency and country. W With-profits policy A policy which participates in the profits of a with-profits fund. This participation may be in the form of one or more of a cash bonus, an annual bonus or a bonus paid on the exit of the policy. Wrap platform A trading platform enabling investment funds, pensions, direct equity holdings and some life assurance contracts to be held in the same administrative account rather than as separate holdings. Wrap provider An investment company, such as Ascentric, that offers investors the opportunity to consolidate their different investments under a single administrative account.

Appendices
96
Appendix 1 – Summary of Quantitative Reporting Templates (QRTs) The following pages contain QRTs for the Group and RLMIS as at 31 December 2019. All figures are presented in thousands of pounds with the exception of ratios, which are in decimal. Please note that totals may differ from the component parts due to rounding. All items disclosed are consistent with the information provided to the regulators privately.
QRT number QRT name Group
(Appendix 2) RLMIS
(Appendix 3)
S.02.01.02 Balance sheet [audited] √ √
S.05.01.02 Premiums, claims and expenses by line of business [unaudited] √ √
S.12.01.02 Life and Health SLT technical provisions [audited] - √
S.22.01.21 Impact of long-term guarantees and transitional measures [audited] - √
S.22.01.22 Impact of long-term guarantees [audited] √ -
S.23.01.01 Own funds [audited] - √
S.23.01.22 Own funds [audited] √ -
S.25.02.21 Solvency Capital Requirement – for undertakings using the standard formula and partial internal model [unaudited]
- √
S.25.02.22 Solvency Capital Requirement – for groups using the standard formula and partial internal model [unaudited]
√ -
S.28.01.01 Minimum Capital Requirement – only life or only non-life insurance or reinsurance activity [audited]
- √
S.32.01.22 Undertakings in the scope of the Group [audited] √ -

Appendices (continued)
97
Appendix 2- Quantitative Reporting Templates (QRTs) – Group S.02.01.02 – Balance sheet [audited]
Assets Solvency II value
£000 C0010
Intangible assets R0030 -
Deferred tax assets R0040 6,099
Pension benefit surplus R0050 168,263
Property, plant & equipment held for own use R0060 106,851
Investments (other than assets held for index-linked and unit-linked contracts) R0070 43,806,489
Property (other than for own use) R0080 97,019
Holdings in related undertakings, including participations R0090 12,695,708
Equities R0100 6,878,969
Equities – listed R0110 6,857,196
Equities – unlisted R0120 21,773
Bonds R0130 17,004,714
Government Bonds R0140 8,291,008
Corporate Bonds R0150 8,410,361
Structured notes R0160 63,787
Collateralised securities R0170 239,559
Collective Investments Undertakings R0180 1,499,380
Derivatives R0190 4,173,161
Deposits other than cash equivalents R0200 1,457,539
Other investments R0210 -
Assets held for index-linked and unit-linked contracts R0220 55,589,964
Loans and mortgages R0230 2,859
Loans on policies R0240 2,549
Loans and mortgages to individuals R0250 310
Other loans and mortgages R0260 -
Reinsurance recoverables from: R0270 4,721,801
Non-life and health similar to non-life R0280 -
Non-life excluding health R0290 -
Health similar to non-life R0300 -
Life and health similar to life, excluding health and index-linked and unit-linked R0310 4,731,931
Health similar to life R0320 (50,970)
Life excluding health and index-linked and unit-linked R0330 4,782,902
Life index-linked and unit-linked R0340 (10,131)
Deposits to cedants R0350 -
Insurance and intermediaries receivables R0360 33,861
Reinsurance receivables R0370 134,686
Receivables (trade, not insurance) R0380 382,774
Own shares (held directly) R0390 -
Amounts due in respect of own fund items or initial fund called up but not yet paid in R0400 -
Cash and cash equivalents R0410 473,833
Any other assets, not elsewhere shown R0420 19,803

Appendices (continued)
98
Assets Solvency II value
£000 C0010
Total assets R0500 105,447,284
Liabilities Solvency II value
£000 C0010
Technical provisions – non-life R0510 -
Technical provisions – non-life (excluding health) R0520 -
TP calculated as a whole R0530 -
Best Estimate R0540 -
Risk margin R0550 -
Technical provisions – health (similar to non-life) R0560 -
TP calculated as a whole R0570 -
Best Estimate R0580 -
Risk margin R0590 -
Technical provisions – life (excluding index-linked and unit-linked) R0600 34,224,518
Technical provisions – health (similar to life) R0610 (185,327)
TP calculated as a whole R0620 -
Best Estimate R0630 (190,463)
Risk margin R0640 5,136
Technical provisions – life (excluding health and index-linked and unit-linked) R0650 34,409,845
TP calculated as a whole R0660 -
Best Estimate R0670 34,330,184
Risk margin R0680 79,661
Technical provisions – index-linked and unit-linked R0690 53,638,586
TP calculated as a whole R0700 55,470,394
Best Estimate R0710 (1,921,702)
Risk margin R0720 89,895
Contingent liabilities R0740 -
Provisions other than technical provisions R0750 117,919
Pension benefit obligations R0760 -
Deposits from reinsurers R0770 -
Deferred tax liabilities R0780 204,927
Derivatives R0790 1,518,744
Debts owed to credit institutions R0800 646,826
Financial liabilities other than debts owed to credit institutions R0810 21,841
Insurance & intermediaries payables R0820 616,080
Reinsurance payables R0830 2,729,046
Payables (trade, not insurance) R0840 1,419,290
Subordinated liabilities R0850 1,507,946
Subordinated liabilities not in BOF R0860 -
Subordinated liabilities in BOF R0870 1,507,946
Any other liabilities, not elsewhere shown R0880 55,358
Total liabilities R0900 96,701,083
Excess of assets over liabilities R1000 8,746,201

99
S.05.01.02 – Premiums, claims and expenses by line of business [unaudited]
Line of Business for: life insurance obligations Life reinsurance obligations Total
£000 Health insurance Insurance with
profit participation
Index-linked and unit-linked insurance Other life insurance Health reinsurance Life reinsurance
C0210 C0220 C0230 C0240 C0270 C0290 C0300
Premiums written
� Gross R1410 51,295 213,152 9,828,283 650,551 - - 10,743,281
� Reinsurers’ share R1420 20,217 40,760 27,632 261,708 - - 350,317
� Net R1500 31,079 172,392 9,800,650 388,843 - - 10,392,965
Premiums earned
� Gross R1510 51,295 213,152 9,828,283 650,551 - - 10,743,281
� Reinsurers’ share R1520 20,217 40,760 27,632 261,708 - - 350,317
� Net R1600 31,079 172,392 9,800,650 388,843 - - 10,392,965
Claims incurred
� Gross R1610 18,402 2,110,289 5,012,990 521,578 - - 7,663,259
� Reinsurers’ share R1620 10,824 27,738 23,714 450,398 - - 512,674
� Net R1700 7,578 2,082,551 4,989,276 71,180 - - 7,150,585
Changes in other technical provisions
� Gross R1710 51,972 (2,469,068) (10,697,651) (32,841) - - (13,147,589)
� Reinsurers’ share R1720 36,775 6,177 6,528 4,537 - - 54,017
� Net R1800 15,197 (2,475,245) (10,704,179) (37,378) - - (13,201,606)
Expenses incurred R1900 6,186 110,888 223,766 296,357 - - 637,196
Other expenses R2500 181,413
Total expenses R2600 818,609
Total amount of surrenders R2700 - 1,027,920 3,796,134 (16,544) - 18,864 4,826,374

Appendices (continued)
100
S.22.01.22 – Impact of long-term guarantees and transitional measures [audited]
£000
Amount with Long Term Guarantee
measures and
transitionals
Impact of transitional
on technical provisions –
unaudited
Impact of transitional on interest
rate
Impact of volatility
adjustment set to zero
Impact of matching
adjustment set to zero
C0010 C0030 C0050 C0070 C0090
Technical provisions R0010 87,863,104 2,967,636 - 324,567 -
Basic own funds R0020 6,785,490 (782,457) - 58,608 -
Eligible own funds to meet Solvency Capital Requirement
R0050 7,070,142 (782,457) - 58,608 -
Solvency Capital Requirement R0090 4,438,220 - - 110,433 -

Appendices (continued)
101
S.23.01.22 – Own funds [audited]
£000 Total Tier 1
unrestricted Tier 1
restricted Tier 2 Tier 3 C0010 C0020 C0030 C0040 C0050
Basic own funds before deduction for participations in other financial sector
Ordinary share capital (gross of own shares) R0010 - - -
Non-available called but not paid in ordinary share capital at group level
R0020 - - -
Share premium account related to ordinary share capital
R0030 - - -
Initial funds, members' contributions or the equivalent basic own-fund item for mutual and mutual-type undertakings
R0040 - - -
Subordinated mutual member accounts R0050 - - - -
Non-available subordinated mutual member accounts at group level
R0060 - - - -
Surplus funds R0070 8,761,717 8,761,717
Non-available surplus funds at group level R0080 - -
Preference shares R0090 - - - -
Non-available preference shares at group level R0100 - - - -
Share premium account related to preference shares
R0110 - - - -
Non-available share premium account related to preference shares at group level
R0120 - - - -
Reconciliation reserve R0130 (3,199,521) (3,199,521)
Subordinated liabilities R0140 1,507,946 - 1,507,946 -
Non-available subordinated liabilities at group level
R0150 - - - -
An amount equal to the value of net deferred tax assets
R0160 6,099 6,099
The amount equal to the value of net deferred tax assets not available at the group level
R0170 6,099 6,099
Other items approved by the supervisory authority as basic own funds not specified above
R0180 - - - - -
Non-available own funds related to other own funds items approved by supervisory authority
R0190 - - - - -
Minority interests (if not reported as part of a specific own fund item)
R0200 - - - - -
Non-available minority interests at group level R0210 - - - - -
Own funds from the financial statements that should not be represented by the reconciliation reserve and do not meet the criteria to be classified as Solvency II own funds
Own funds from the financial statements that should not be represented by the reconciliation reserve and do not meet the criteria to be classified as Solvency II own funds
R0220 -

Appendices (continued)
102
Deductions
Deductions for participations in financial and credit institutions
R0230 284,652 284,652 - - -
whereof deducted according to art 228 of the Directive 2009/138/EC
R0240 - - - - -
Deductions for participations where there is non-availability of information (Article 229)
R0250 - - - - -
Deduction for participations included by using D&A when a combination of methods is used
R0260 - - - - -
Total of non-available own fund items R0270 6,099 - - - 6,099
Total deductions R0280 290,751 284,652 - - 6,099
Total basic own funds after deductions R0290 6,785,490 5,277,545 - 1,507,946 -
Ancillary own funds
Unpaid and uncalled ordinary share capital callable on demand
R0300 - -
Unpaid and uncalled initial funds, members' contributions or the equivalent basic own fund item for mutual and mutual-type undertakings, callable on demand
R0310 - -
Unpaid and uncalled preference shares callable on demand
R0320 - - -
A legally binding commitment to subscribe and pay for subordinated liabilities on demand
R0330 - - -
Letters of credit and guarantees under Article 96(2) of the Directive 2009/138/EC
R0340 - -
Letters of credit and guarantees other than under Article 96(2) of the Directive 2009/138/EC
R0350 - - -
Supplementary members calls under first subparagraph of Article 96(3) of the Directive 2009/138/EC
R0360 - -
Supplementary members calls - other than under first subparagraph of Article 96(3) of the Directive 2009/138/EC
R0370 - - -
Non available ancillary own funds at group level R0380 - - -
Other ancillary own funds R0390 - - -
Total ancillary own funds R0400 - - -
Own funds of other financial sectors
Credit Institutions, investment firms, financial institutions, alternative investment fund manager, UCITs management companies
R0410 284,652 284,652 - -
Institutions for occupational retirement provision
R0420 - - - - -
Non regulated entities carrying out financial activities
R0430 - - - -
Total own funds of other financial sectors R0440 284,652 284,652 - - -
Own funds when using the D&A, exclusively or in combination of method 1
Own funds aggregated when using the D&A and combination of method
R0450 - - - - -
Own funds aggregated when using the D&A and combination of method net of IGT
R0460 - - - - -

Appendices (continued)
103
Total available own funds to meet the consolidated group SCR (excluding own funds from other financial sector and from the undertakings included via D&A)
R0520 6,785,490 5,277,545 - 1,507,946 -
Total available own funds to meet the minimum consolidated group SCR
R0530 6,785,490 5,277,545 - 1,507,946
Total eligible own funds to meet the consolidated group SCR (excluding own funds from other financial sector and from the undertakings included via D&A)
R0560 6,785,490 5,277,545 - 1,507,946 -
Total eligible own funds to meet the minimum consolidated group SCR
R0570 5,493,337 5,277,545 - 215,793
Minimum consolidated Group SCR R0610 1,078,963
Ratio of Eligible own funds to Minimum Consolidated Group SCR
R0650 509%
Total eligible own funds to meet the group SCR (including own funds from other financial sector and from the undertakings included via D&A)
R0660 7,070,142 5,562,196 - 1,507,946 -
Group SCR R0680 4,438,220
Ratio of Eligible own funds to group SCR including other financial sectors and the undertakings included via D&A
R0690 159%
C0060
Reconciliation reserve
Excess of assets over liabilities R0700 8,746,201
Own shares (held directly and indirectly) R0710 -
Foreseeable dividends, distributions and charges R0720 -
Other basic own fund items R0730 8,767,816
Adjustment for restricted own fund items in respect of matching adjustment portfolios and ring fenced funds
R0740 3,177,905
Other non available own funds R0750 -
Reconciliation reserve before deduction for participations in other financial sector
R0760 (3,199,521)
Expected profits
Expected profits included in future premiums (EPIFP) - Life business
R0770 1,251,657
Expected profits included in future premiums (EPIFP) - Non-life business
R0780 -
Total Expected profits included in future premiums (EPIFP)
R0790 1,251,657

Appendices (continued)
104
S.25.02.22 – Solvency Capital Requirement – for groups using the standard formula and partial internal model [unaudited] £000
Unique number of component Component description
Calculation of the Solvency
Capital Requirement
Amount modelled USP Simplifications
C0010 C0020 C0030 C0070 C0090 C0120
10300I Interest rate risk (within insurer) 1,711,216 1,704,615 9 -
10300P Interest rate risk (within pension schemes) (58,085) (58,085) 9 -
10400I Equity risk (within insurer) 1,303,870 1,303,855 9 -
10400P Equity risk (within pension schemes) 270,303 270,303 9 -
10600I Property risk (within insurer) 197,435 197,435 9 -
10600P Property risk (within pension schemes) 67,035 67,035 9 -
10700I Spread risk (within insurer) 937,302 937,300 9 -
10700P Spread risk (within pension schemes) (68,199) (68,199) 9 -
10900I Currency risk (within insurer) 485,741 485,660 9 -
10900P Currency risk (within pension schemes) 133,520 133,520 9 -
11010I Inflation risk (within insurer) 165,541 165,541 9 -
11010P Inflation risk (within pension schemes) 141,901 141,901 9 -
19900 Diversification within market risk (2,101,983) (2,101,914) 9 -
20300 Counterparty default risk 153,689 145,890 9 -
30100I Mortality risk (within insurer) 98,433 92,433 9 -
30200I Longevity risk (within insurer) 1,630,487 1,630,138 9 -
30200P Longevity risk (within pension schemes) 442,384 442,384 9 -
30300I Disability-morbidity risk (within insurer) 99,348 96,394 9 -
30400I Mass lapse risk (within insurer) 873,367 828,054 9 -
30500I Other lapse risk (within insurer) 2,549,990 2,549,990 9 -
30600I Expense risk (within insurer) 817,067 811,984 9 -
30800I Life catastrophe risk (within insurer) 64,400 61,299 9 -
39900 Diversification within life underwriting risk (2,204,018) (2,191,500) 9 -
70100I Operational risk (within insurer) 668,413 665,245 9 -
80200I Loss-absorbing capacity of technical provisions (within insurer)
(1,628,215) (1,628,215) 9 -
80300 Loss-absorbing capacity of deferred tax (within insurer)
(145,062) (141,606) 9 -
80401 Other adjustments – Internal Model 199,755 199,755 9 -
Calculation of the Solvency Capital Requirement C0100
Total undiversified components R0110 6,805,635
Diversification R0060 (2,518,639)
Capital requirement for business operated in accordance with Art.4 of Directive 2003/41/EC (transitional)
R0160 -
Solvency capital requirement excluding capital add-on R0200 4,286,996
Capital add-ons already set R0210 -
Solvency capital requirement for undertakings under consolidated method R0220 4,438,220
Other information on SCR
Amount/estimate of the overall loss-absorbing capacity of technical provisions R0300 (1,628,215)

Appendices (continued)
105
Calculation of the Solvency Capital Requirement C0100
Amount/estimate of the overall loss-absorbing capacity of deferred taxes R0310 (145,062)
Capital requirement for duration-based equity risk sub-module R0400 -
Total amount of Notional Solvency Capital Requirement for remaining part R0410 2,070,271
Total amount of Notional Solvency Capital Requirement for ring fenced funds R0420 2,216,724
Total amount of Notional Solvency Capital Requirement for matching adjustment portfolios
R0430 -
Diversification effects due to RFF nSCR aggregation for article 304 R0440 -
Minimum consolidated group solvency capital requirement R0470 1,078,963
Information on other entities
Capital requirement for other financial sectors (Non-insurance capital requirements) R0500 142,882
Capital requirement for other financial sectors (Non-insurance capital requirements) – Credit institutions, investment firms and financial institutions, alternative investment funds managers, UCITS management companies
R0510 142,882
Capital requirement for other financial sectors (Non-insurance capital requirements) – Institutions for occupational requirement provisions
R0520 -
Capital requirement for other financial sectors (Non-insurance capital requirements) – Capital requirement for non-regulated entities carrying out financial activities
R0530 -
Capital requirement for non-controlled participation requirements R0540 -
Capital requirement for residual undertakings R0550 8,342
Overall SCR C0100
SCR for undertakings included via D and A R0560 -
Solvency capital requirement R0570 4,438,220

106
S.32.01.22 – Undertakings in the scope of the Group [audited]
Criteria of influence Inclusion in the scope of group supervision
Group solvency calculation
Country
Identification code of the undertaking
Type of code of
the ID of the
under- taking
Legal name of the undertaking
Type of under-taking Legal form
Category (mutual/
non mutual) Super-visory Authority
% of capital share
% used for the
establishment of
consolidated accounts
% voting rights Other criteria
Level of influence
Proportional share used for group solvency
calculation Y/N
Date of decision if art. 214 is applied
Method used and under method 1,
treatment of the
undertaking
C0010 C0020 C0030 C0040 C0050 C0060 C0070 C0080 C0180 C0190 C0200 C0210 C0220 C0230 C0240 C0250 C0260
GB G8FFYFZ5TIO54GXBFZ
14
1 The Royal London Mutual
Insurance Society Limited
1 Company limited by
shares or by guarantee or
unlimited
Mutual Prudential Regulation
Authority, Financial
Conduct Authority
1 1
IE 635400CBVDWFMJQJ
DA54
1 Royal London Insurance
Designated Activity
Company
1 Incorporated company
limited by shares or by
guarantee or unlimited
Non-mutual Central Bank of Ireland 100.00% 100.00% 100.00% None 1 100.00% 1 1
GB 213800189R1SKJJOH
B88
1 RL Marketing (CIS) Limited 8 Financial Conduct
Authority
100.00% 100.00% 100.00% None 1 100.00% 1 4
GB 2138002LI3FHE8CMM
U59
1 Royal London Unit Trust
Managers Limited
15 Financial Conduct
Authority
100.00% 100.00% 100.00% None 1 100.00% 1 4
GB 2138007ZZFQS1YCKH
E58
1 Royal London Savings
Limited
8 Financial Conduct
Authority
100.00% 100.00% 100.00% None 1 100.00% 1 4
GB 213800PAVO3KNDMMJ
P39
1 Royal London Marketing
Limited
8 Financial Conduct
Authority
100.00% 100.00% 100.00% None 1 100.00% 1 4
GB 213800UTRFM2N8LM
MT64
1 RLUM Limited 14 Financial Conduct
Authority
100.00% 100.00% 100.00% None 1 100.00% 1 4
GB 213800VJ1GMACBBTY
Z14
1 Royal London Asset
Management Limited
8 Financial Conduct
Authority
100.00% 100.00% 100.00% None 1 100.00% 1 4
GB 2138003LOWVVQQTH
V146
1 Royal London Management
Services Limited
10 100.00% 100.00% 100.00% None 1 100.00% 1 1
GB 2138002KV6WLPKHJH
M45
1 Wrap IFA Services Limited 99 100.00% 100.00% 100.00% None 1 100.00% 1 3
GB 213800NZUBPU84ODP
247
1 Investment Funds Direct
Holdings Limited
99 100.00% 100.00% 100.00% None 1 100.00% 1 3
GB 213800NMZJ4ZRQQFI
D11
1 Investment Funds Direct
Group Limited
99 100.00% 100.00% 100.00% None 1 100.00% 1 3

107
GB 2138008K7KVOA2SVG
D38
1 Investment Funds Direct
Limited
8 Financial Conduct Authority 100.00% 100.00% 100.00
%
None 1 100.00% 1 4
GB 2138003ONLOLWAT5V
C22
1 Royal London Trustee
Services Limited
99 100.00% 100.00% 100.00
%
None 1 100.00% 1 3
GB 2138003P5LHHJA4I63
07
1 RL Marketing ISA Nominees
Limited
99 100.00% 100.00% 100.00
%
None 1 100.00% 1 3
IE 2138005YBS9MBWUF
W343
1 Royal Liver Trustee Services
Ireland Limited
99 100.00% 100.00% 100.00
%
None 1 100.00% 1 3
GB 2138006TIXHYODIAQ44
4
1 RLGPS Trustee Limited 99 100.00% 100.00% 100.00
%
None 1 100.00% 1 3
GB 213800NDHTJTEZ5D9
N71
1 RL Finance Bonds No.2 Plc 99 100.00% 100.00% 100.00
%
None 1 100.00% 1 3
GB 213800A838TK57XOB5
84
1 RL Finance Bonds No.3 Plc 99 100.00% 100.00% 100.00
%
None 1 100.00% 1 3
GB 21380094SBEIOBDS8O
41
1 RL Finance Bonds No.4 Plc 99 100.00% 100.00% 100.00
%
None 1 100.00% 1 3
IE 213800D7IT2IOO6YG1
62
1 RL Pensions Trustees (ROI)
Limited
99 100.00% 100.00% 100.00
%
None 1 100.00% 1 3
GB 213800FUA9MGFDNH5
780
1 Royal Liver Trustees Limited 99 100.00% 100.00% 100.00
%
None 1 100.00% 1 3
GB 213800G4QK2YV6E6JU
97
1 R.L. Pensions Trustees
Limited
99 100.00% 100.00% 100.00
%
None 1 100.00% 1 3
IM 213800L82NOWDXQM5
R25
1 Cambridge Research Park
Limited
99 100.00% 100.00% 100.00
%
None 1 100.00% 1 3
IM CRPM001 2 Cambridge Research Park
Management Company
Limited
99 69.00% 100.00% 69.00% None 1 69.00% 1 3
GB 213800RE74FP8D1SYX
58
1 Hornby Road Investments
Limited
99 100.00% 100.00% 100.00
%
None 1 100.00% 1 3
GB 213800TPIK9NKS1I8D2
3
1 Royal London (UK) Holdings 99 100.00% 100.00% 100.00
%
None 1 100.00% 1 3
GB 213800U83M7NVK2LU
810
1 Royal Liver Pension Trustee
Services Limited
99 100.00% 100.00% 100.00
%
None 1 100.00% 1 3
GB RLPPF01 2 RLPPF Abingdon Ltd 99 100.00% 100.00% 100.00
%
None 1 100.00% 1 3
GB RLC0001 2 Royal London Cambridge
Ltd
99 100.00% 100.00% 100.00
%
None 1 100.00% 1 3

108
GB 2138002XBAW3LIKUO5
80
1 Brightgrey Limited 99 100.00% 100.00% 100.00
%
None 1 100.00% 1 3
GB 213800KMXFGEFVWF4
116
1 Capitol Way Commercial No
1 Limited
99 100.00% 100.00% 100.00
%
None 1 100.00% 1 3
GB 2138006LE3XJ8FS9SV
18
1 Capitol Way Commercial No
2 Limited
99 100.00% 100.00% 100.00
%
None 1 100.00% 1 3
GB 213800VPG3WT5R4CA
K81
1 Capitol Way Estate No 1
Limited
99 100.00% 100.00% 100.00
%
None 1 100.00% 1 3
GB 213800B2GJOOCS6RT
P32
1 Capitol Way Estate No 2
Limited
99 100.00% 100.00% 100.00
%
None 1 100.00% 1 3
GB 2138003QIRDXTHTV86
39
1 Leyburn Developments
Limited
99 100.00% 100.00% 100.00
%
None 1 100.00% 1 3
GB 2138006GBLCWRSYXI8
88
1 Refuge Life Assurance
Consultants Limited
99 100.00% 100.00% 100.00
%
None 1 100.00% 1 3
GB 213800SZ65YOK14JPJ
24
1 Refuge Portfolio Managers
Limited
99 100.00% 100.00% 100.00
%
None 1 100.00% 1 3
GB 213800OKH54257CNV
G78
1 RL LA Limited 99 100.00% 100.00% 100.00
%
None 1 100.00% 1 3
GB 2138001KT7TUH66ZH6
19
1 RL Sch 2c Holdings Limited 99 100.00% 100.00% 100.00
%
None 1 100.00% 1 3
GB 213800YPQ6TD1Y92AN
67
1 RL Finance Bonds Plc 99 100.00% 100.00% 100.00
%
None 1 100.00% 1 3
GB 213800MUAQKCGZ11Y
J45
1 RLM Finance Plc 99 100.00% 100.00% 100.00
%
None 1 100.00% 1 3
GB 213800XMR98URUPQD
636
1 RLNPB Services Limited 99 100.00% 100.00% 100.00
%
None 1 100.00% 1 3
GB 213800NPC94WSKTTM
530
1 Royal Liver (IFA Holdings)
PLC
99 100.00% 100.00% 100.00
%
None 1 100.00% 1 3
GB 213800PUPN11J7TPEH
97
1 Royal Liver Asset Managers
Limited
99 100.00% 100.00% 100.00
%
None 1 100.00% 1 3
GB 2138007UX4X8MZ4JJI8
5
1 Royal London (CIS) Limited 99 100.00% 100.00% 100.00
%
None 1 100.00% 1 3
GB 213800QMOIKD9IQ55F
64
1 Royal London Homebuy
Limited
99 100.00% 100.00% 100.00
%
None 1 100.00% 1 3
GB 213800TZ5CFXIKY1GY
86
1 Royal London Pooled
Pensions Company Limited
99 100.00% 100.00% 100.00
%
None 1 100.00% 1 3

109
GB 213800DF5FYEIGQ152
78
1 Scottish Life (Coventry)
Property Limited
99 100.00% 100.00% 100.00
%
None 1 100.00% 1 3
GB 213800DIKM8ELYOXS5
30
1 Scottish Life Assurance
Company Limited
99 100.00% 100.00% 100.00
%
None 1 100.00% 1 3
GB 213800KAF8G22Z7BF
W22
1 United Assurance Group
Limited
99 100.00% 100.00% 100.00
%
None 1 100.00% 1 3
GB 213800QPL3CW15NIPV
74
1 United Friendly Group
Limited
99 100.00% 100.00% 100.00
%
None 1 100.00% 1 3
GB 2138007FBAWNLE1HN
A54
1 Fundsdirect Isa Nominees
Limited
99 100.00% 100.00% 100.00
%
None 1 100.00% 1 3
GB 213800XQZARYTKRCC
L88
1 Fundsdirect Nominees
Limited
99 100.00% 100.00% 100.00
%
None 1 100.00% 1 3
GB 213800TMTEJ2B9Y8SL
32
1 IFDL Personal Pensions
Limited
99 100.00% 100.00% 100.00
%
None 1 100.00% 1 3
GB 213800XX1TM8TUHLX
B71
1 RLAM (Nominees) Limited 99 100.00% 100.00% 100.00
%
None 1 100.00% 1 3
GB 2138007BIH8NNEZG1S
03
1 RLS Nominees Limited 99 100.00% 100.00% 100.00
%
None 1 100.00% 1 3
GB 213800FLP5G86324W
333
1 Canterbury Life Assurance
Company Limited
99 100.00% 100.00% 100.00
%
None 1 100.00% 1 3
GB 2138005PEFCY28JDZH
06
1 Capitol Way Estate
Management Limited
99 100.00% 100.00% 100.00
%
None 1 100.00% 1 3
GB 213800PB6WLK3LOZ3
A86
1 R.A.Securities Limited 99 100.00% 100.00% 100.00
%
None 1 100.00% 1 3
GB 213800ZARAOTGOKICT
74
1 Refuge Assurance Limited 99 100.00% 100.00% 100.00
%
None 1 100.00% 1 3
GB 213800U9EYLECC3ZD
518
1 Refuge Investments Limited 99 100.00% 100.00% 100.00
%
None 1 100.00% 1 3
GB 2138008WVG8VCRWC
NY45
1 S.L. (Davenport Green)
Limited
99 100.00% 100.00% 100.00
%
None 1 100.00% 1 3
GB 2138001A11QZTEW6I6
90
1 United Friendly Insurance
Limited
99 100.00% 100.00% 100.00
%
None 1 100.00% 1 3
GB 21380014S4X3NSCM9
C20
1 United Friendly Life
Assurance Limited
99 100.00% 100.00% 100.00
%
None 1 100.00% 1 3
GB 213800WBMJO56KYIN
C86
1 United Friendly Staff Pension
Fund Limited
99 100.00% 100.00% 100.00
%
None 1 100.00% 1 3

110
GB 2138001GGQZWJYZ89
E43
1 Royal London Asset
Management Bond Funds plc
99 100.00% 100.00% 100.00
%
None 1 100.00% 1 3
GB 213800P2S11KS3M67
475
1 The Royal London European
Growth Trust
99 35.18% 100.00% 35.18% Investment fund managed by a
group entity and the group has
a significant holding in the fund
1 35.18% 1 3
GB 213800Z1P3OLLFW59
430
1 The Royal London US
Growth Trust
99 58.27% 100.00% 58.27% Investment fund managed by a
group entity and the group has
a significant holding in the fund
1 58.27% 1 3
GB 213800TZR2FX5HM93
U36
1 The Royal London Property
Trust
99 100.00% 100.00% 100.00
%
Investment fund managed by a
group entity and the group has
a significant holding in the fund
1 100.00% 1 3
GB 213800SDTPSXES4HQ
V27
1 The Royal London UK Real
Estate Fund
99 98.14% 100.00% 98.14% Investment fund managed by a
group entity and the group has
a significant holding in the fund
1 98.14% 1 3
GB 213800DA6A6R368VTH
72
1 The Royal London Global
Equity SelecFund
99 99.24% 100.00% 99.24% Investment fund managed by a
group entity and the group has
a significant holding in the fund
1 99.24% 1 3
GB 21380075Y4TJ6QUQ2G
30
1 The Royal London Global
Equity Diversified Fund
99 100.00% 100.00% 100.00
%
Investment fund managed by a
group entity and the group has
a significant holding in the fund
1 100.00% 1 3
GB 213800HZOOB6W9B8I
P07
1 The Royal London Multi
AsseStrategies Fund2
99 53.70% 100.00% 53.70% Investment fund managed by a
group entity and the group has
a significant holding in the fund
1 53.70% 1 3
GB 213800T867O53EAO8I
39
1 The Royal London
Adventurous Fund
99 63.46% 100.00% 63.46% Investment fund managed by a
group entity and the group has
a significant holding in the fund
1 63.46% 1 3
GB 21380062AXL67R9GHP
12
1 The Royal London Balanced
Fund
99 44.68% 100.00% 44.68% Investment fund managed by a
group entity and the group has
a significant holding in the fund
1 44.68% 1 3
GB 213800SXPMDJWZBRF
G55
1 The Royal London
Conservative Fund
99 98.75% 100.00% 98.75% Investment fund managed by a
group entity and the group has
a significant holding in the fund
1 98.75% 1 3
GB 213800VLLOHZCLHO1
R40
1 The Royal London Defensive
Fund
99 59.60% 100.00% 59.60% Investment fund managed by a
group entity and the group has
a significant holding in the fund
1 59.60% 1 3
GB 2138001I3AU5I91KXP8
9
1 The Royal London Dynamic
Fund
99 95.36% 100.00% 95.36% Investment fund managed by a
group entity and the group has
a significant holding in the fund
1 95.36% 1 3
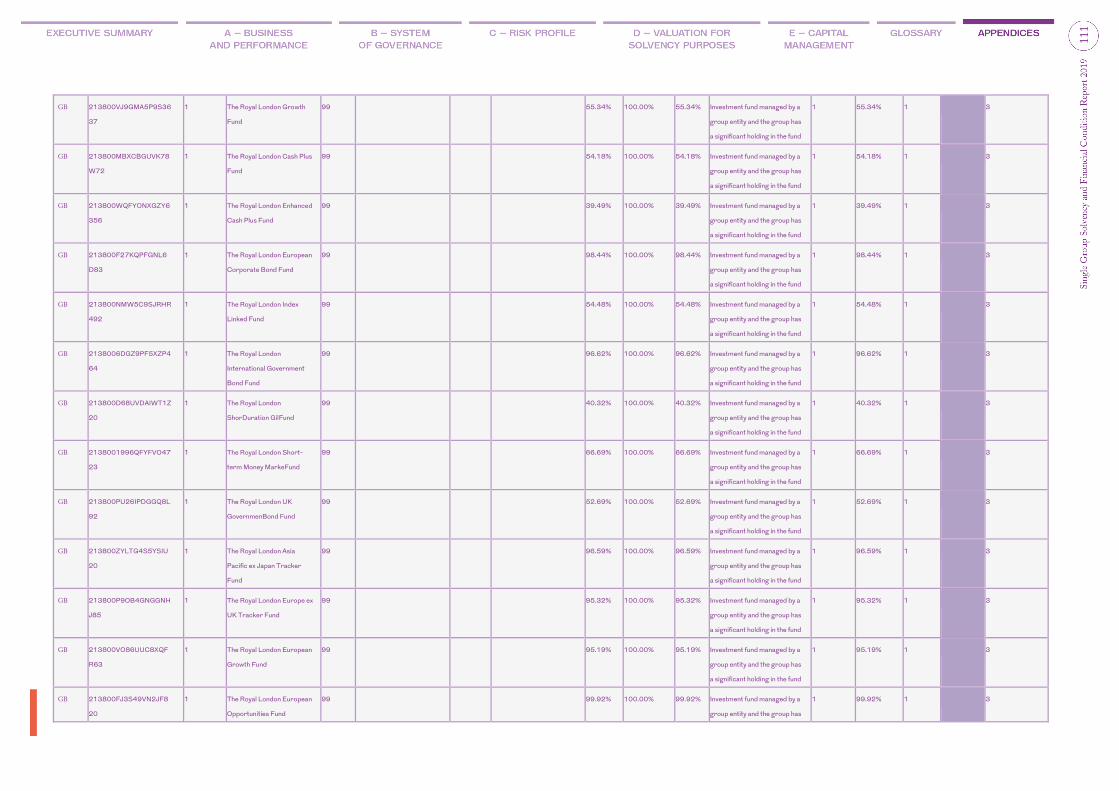
111
GB 213800VJ9GMA5P9S36
37
1 The Royal London Growth
Fund
99 55.34% 100.00% 55.34% Investment fund managed by a
group entity and the group has
a significant holding in the fund
1 55.34% 1 3
GB 213800MBXCBGUVK78
W72
1 The Royal London Cash Plus
Fund
99 54.18% 100.00% 54.18% Investment fund managed by a
group entity and the group has
a significant holding in the fund
1 54.18% 1 3
GB 213800WQFYONXGZY6
356
1 The Royal London Enhanced
Cash Plus Fund
99 39.49% 100.00% 39.49% Investment fund managed by a
group entity and the group has
a significant holding in the fund
1 39.49% 1 3
GB 213800F27KQPFGNL6
D83
1 The Royal London European
Corporate Bond Fund
99 98.44% 100.00% 98.44% Investment fund managed by a
group entity and the group has
a significant holding in the fund
1 98.44% 1 3
GB 213800NMW5C9SJRHR
492
1 The Royal London Index
Linked Fund
99 54.48% 100.00% 54.48% Investment fund managed by a
group entity and the group has
a significant holding in the fund
1 54.48% 1 3
GB 2138006DGZ9PF5XZP4
64
1 The Royal London
International Government
Bond Fund
99 96.62% 100.00% 96.62% Investment fund managed by a
group entity and the group has
a significant holding in the fund
1 96.62% 1 3
GB 213800D68UVDAIWT1Z
20
1 The Royal London
ShorDuration GilFund
99 40.32% 100.00% 40.32% Investment fund managed by a
group entity and the group has
a significant holding in the fund
1 40.32% 1 3
GB 2138001996QFYFVO47
23
1 The Royal London Short-
term Money MarkeFund
99 66.69% 100.00% 66.69% Investment fund managed by a
group entity and the group has
a significant holding in the fund
1 66.69% 1 3
GB 213800PU26IPDGGQ8L
92
1 The Royal London UK
GovernmenBond Fund
99 52.69% 100.00% 52.69% Investment fund managed by a
group entity and the group has
a significant holding in the fund
1 52.69% 1 3
GB 213800ZYLTG4S5YSIU
20
1 The Royal London Asia
Pacific ex Japan Tracker
Fund
99 96.59% 100.00% 96.59% Investment fund managed by a
group entity and the group has
a significant holding in the fund
1 96.59% 1 3
GB 213800P9OB4GNGGNH
J85
1 The Royal London Europe ex
UK Tracker Fund
99 95.32% 100.00% 95.32% Investment fund managed by a
group entity and the group has
a significant holding in the fund
1 95.32% 1 3
GB 213800VO86UUC8XQF
R63
1 The Royal London European
Growth Fund
99 95.19% 100.00% 95.19% Investment fund managed by a
group entity and the group has
a significant holding in the fund
1 95.19% 1 3
GB 213800FJ3S49VN2JF8
20
1 The Royal London European
Opportunities Fund
99 99.92% 100.00% 99.92% Investment fund managed by a
group entity and the group has
1 99.92% 1 3

112
a significant holding in the fund
GB 213800ZDZHGZ287QJE
42
1 The Royal London FTSE 350
Tracker Fund
99 96.82% 100.00% 96.82% Investment fund managed by a
group entity and the group has
a significant holding in the fund
1 96.82% 1 3
GB 213800XCX4K3LKL1OY
63
1 The Royal London Japan
Tracker Fund
99 93.73% 100.00% 93.73% Investment fund managed by a
group entity and the group has
a significant holding in the fund
1 93.73% 1 3
GB 21380039WUZ8WFRTD
842
1 The Royal London All Share
Tracker Fund
99 52.03% 100.00% 52.03% Investment fund managed by a
group entity and the group has
a significant holding in the fund
1 52.03% 1 3
GB 2138003M8ESXKVB7D
H56
1 The Royal London UK
Growth Fund
99 94.76% 100.00% 94.76% Investment fund managed by a
group entity and the group has
a significant holding in the fund
1 94.76% 1 3
GB 213800IRXG86IDDOWD
51
1 The Royal London UK Equity
Fund
99 94.23% 100.00% 94.23% Investment fund managed by a
group entity and the group has
a significant holding in the fund
1 94.23% 1 3
GB 2138001WNZPJZVG5Y
D87
1 The Royal London UK Mid
Cap Growth Fund
99 76.47% 100.00% 76.47% Investment fund managed by a
group entity and the group has
a significant holding in the fund
1 76.47% 1 3
GB 2138009HTVV2R9V7X8
21
1 The Royal London UK
Opportunities Fund
99 98.16% 100.00% 98.16% Investment fund managed by a
group entity and the group has
a significant holding in the fund
1 98.16% 1 3
GB 213800A2FMG85T8LJX
61
1 The Royal London UK
Smaller Companies Fund
99 97.71% 100.00% 97.71% Investment fund managed by a
group entity and the group has
a significant holding in the fund
1 97.71% 1 3
GB 213800WS6BB7RY6RH
B94
1 The Royal London US
Tracker Fund
99 97.67% 100.00% 97.67% Investment fund managed by a
group entity and the group has
a significant holding in the fund
1 97.67% 1 3
GB 213800MJZUXA2ZH7O
Q60
1 The Royal London Monthly
Income Bond Fund2
99 90.54% 100.00% 90.54% Investment fund managed by a
group entity and the group has
a significant holding in the fund
1 90.54% 1 3
GB 21380075KXQHFY8R63
91
1 The Royal London Emerging
Markets Equity Tracker
Fund
99 96.47% 100.00% 96.47% Investment fund managed by a
group entity and the group has
a significant holding in the fund
1 96.47% 1 3
GB 2138004XQBJ84M399E
46
1 The Royal London Multi
AsseCrediFund
99 71.82% 100.00% 71.82% Investment fund managed by a
group entity and the group has
a significant holding in the fund
1 71.82% 1 3
GB 213800MVKMQDZCWM 1 The Royal London Sterling 99 99.95% 100.00% 99.95% Investment fund managed by a 1 99.95% 1 3

113
DN34 Liquidity Fund2 group entity and the group has
a significant holding in the fund
IE 213800OCCCWKOKDS
6E89
1 The Royal London Global
High Yield Bond Fund
99 96.36% 100.00% 96.36% Investment fund managed by a
group entity and the group has
a significant holding in the fund
1 96.36% 1 3
IE 213800CT3DWJ3Y7EN
160
1 The Royal London Global
Bond Opportunities Fund
99 48.17% 100.00% 48.17% Investment fund managed by a
group entity and the group has
a significant holding in the fund
1 48.17% 1 3
IE 213800RZY6VOKLZHC
E41
1 The Royal London
ShorDuration Global High
Yield Fund
99 39.78% 100.00% 39.78% Investment fund managed by a
group entity and the group has
a significant holding in the fund
1 39.78% 1 3
GB 2138008UV8PGLRFW7
W16
1 The Royal London
ShorDuration Plus Fund
99 99.11% 100.00% 99.11% Investment fund managed by a
group entity and the group has
a significant holding in the fund
1 99.11% 1 3
IE 213800NPGHTJUPPNLX
05
1 The Royal London Absolute
Return GovernmenBond
Fund
99 75.55% 100.00% 75.55% Investment fund managed by a
group entity and the group has
a significant holding in the fund
1 75.55% 1 3
GB 21380022OATAWGDUY
155
1 The Royal London
Investment Grade Short
Credit Fund
99 35.20% 35.20% 35.20% Investment fund managed by a
group entity and the group has
a significant holding in the fund
2 35.20% 1 3
GB 2138005ASQA1TQ7AFR
85
1 The Royal London Global
Index Linked Fund
99 27.53% 27.53% 27.53% Investment fund managed by a
group entity and the group has
a significant holding in the fund
2 27.53% 1 3
GB 213800AV3FN55KQ7OI
30
1 The Royal London UK
Growth Trust
99 24.64% 24.64% 24.64% Investment fund managed by a
group entity and the group has
a significant holding in the fund
2 24.64% 1 3
GB 213800IY2IIYFGTJAG11 1 The Royal London Corporate
Bond Monthly Fund
99 22.99% 22.99% 22.99% Investment fund managed by a
group entity and the group has
a significant holding in the fund
2 22.99% 1 3
GB 213800KBBUSBTCF4U
K54
1 The Royal London Sustained
Managed Income Trust
99 22.53% 22.53% 22.53% Investment fund managed by a
group entity and the group has
a significant holding in the fund
2 22.53% 1 3
GG G8FFYFZ5TIO54GXBFZ
14GG00006
2 SPL ARL Private Finance 99 99.40% 99.40% 0.00% Investment fund managed by
third party entity which the
group does not control
2 99.40% 1 3
US G8FFYFZ5TIO54GXBFZ
14US00008
2 CoreAlpha Private Equity
Partners
99 29.90% 29.90% 0.00% Investment fund managed by
third party entity which the
group does not control
2 29.90% 1 3

114
US G8FFYFZ5TIO54GXBFZ
14US00007
2 WP Global Mezzanine
Private Equity
99 100.00% 100.00% 0.00% Investment fund managed by
third party entity which the
group does not control
2 100.00% 1 3
GG G8FFYFZ5TIO54GXBFZ
14US00012
2 Enterprise Ventures Growth
Ltd
99 45.20% 45.20% 0.00% Investment fund managed by
third party entity which the
group does not control
2 45.20% 1 3
US G8FFYFZ5TIO54GXBFZ
14US00010
2 KKR CIS Global Investor L.P. 99 100.00% 100.00% 0.00% Investment fund managed by
third party entity which the
group does not control
2 100.00% 1 3
GB G8FFYFZ5TIO54GXBFZ
14GB00011
2 Rising Star Growth Fund II 99 21.80% 21.80% 0.00% Investment fund managed by
third party entity which the
group does not control
2 21.80% 1 3
GB G8FFYFZ5TIO54GXBFZ
14US00013
2 RJD Private Equity Fund III A
LP
99 31.90% 31.90% 0.00% Investment fund managed by
third party entity which the
group does not control
2 31.90% 1 3
NO G8FFYFZ5TIO54GXBFZ
14US00014
2 Cubera RL Nordic PE LP 99 100.00% 100.00% 0.00% Investment fund managed by
third party entity which the
group does not control
2 100.00% 1 3

Appendices (continued)
115
Appendix 3- Quantitative Reporting Templates (QRTs) - RLMIS S.02.01.02 – Balance sheet [audited]
Assets Solvency II value
£000 C0010
Intangible assets R0030 -
Pension benefit surplus R0050 168,263
Property, plant & equipment held for own use R0060 -
Investments (other than assets held for index-linked and unit-linked contracts) R0070 44,072,373
Property (other than for own use) R0080 181,785
Holdings in related undertakings, including participations R0090 12,881,239
Equities R0100 6,878,969
Equities – listed R0110 6,857,196
Equities – unlisted R0120 21,773
Bonds R0130 17,000,301
Government Bonds R0140 8,286,595
Corporate Bonds R0150 8,410,361
Structured notes R0160 63,787
Collateralised securities R0170 239,559
Collective Investments Undertakings R0180 1,499,380
Derivatives R0190 4,173,161
Deposits other than cash equivalents R0200 1,457,539
Other investments R0210 -
Assets held for index-linked and unit-linked contracts R0220 55,589,964
Loans and mortgages R0230 2,513
Loans on policies R0240 2,493
Loans and mortgages to individuals R0250 20
Other loans and mortgages R0260 -
Reinsurance recoverables from: R0270 4,692,365
Non-life and health similar to non-life R0280 -
Non-life excluding health R0290 -
Health similar to non-life R0300 -
Life and health similar to life, excluding health and index-linked and unit-linked R0310 4,702,495
Health similar to life R0320 (49,252)
Life excluding health and index-linked and unit-linked R0330 4,751,747
Life index-linked and unit-linked R0340 (10,131)
Deposits to cedants R0350 -
Insurance and intermediaries receivables R0360 33,449
Reinsurance receivables R0370 125,399
Receivables (trade, not insurance) R0380 292,063
Own shares (held directly) R0390 -
Amounts due in respect of own fund items or initial fund called up but not yet paid in R0400 -
Cash and cash equivalents R0410 377,231
Any other assets, not elsewhere shown R0420 -
Total assets R0500 105,353,620

Appendices (continued)
116
Liabilities Solvency II value
£000 C0010
Technical provisions – non-life R0510 -
Technical provisions – non-life (excluding health) R0520 -
TP calculated as a whole R0530 -
Best Estimate R0540 -
Risk margin R0550 -
Technical provisions – health (similar to non-life) R0560 -
TP calculated as a whole R0570 -
Best Estimate R0580 -
Risk margin R0590 -
Technical provisions – life (excluding index-linked and unit-linked) R0600 34,293,706
Technical provisions – health (similar to life) R0610 (175,224)
TP calculated as a whole R0620 -
Best Estimate R0630 (177,916)
Risk margin R0640 2,692
Technical provisions – life (excluding health and index-linked and unit-linked) R0650 34,468,930
TP calculated as a whole R0660 -
Best Estimate R0670 34,412,237
Risk margin R0680 56,693
Technical provisions – index-linked and unit-linked R0690 53,638,539
TP calculated as a whole R0700 55,470,394
Best Estimate R0710 (1,921,702)
Risk margin R0720 89,847
Contingent liabilities R0740 -
Provisions other than technical provisions R0750 117,916
Pension benefit obligations R0760 -
Deposits from reinsurers R0770 -
Deferred tax liabilities R0780 200,668
Derivatives R0790 1,518,744
Debts owed to credit institutions R0800 635,503
Financial liabilities other than debts owed to credit institutions R0810 17,411
Insurance & intermediaries payables R0820 536,707
Reinsurance payables R0830 2,721,334
Payables (trade, not insurance) R0840 1,374,535
Subordinated liabilities R0850 1,507,946
Subordinated liabilities not in BOF R0860 -
Subordinated liabilities in BOF R0870 1,507,946
Any other liabilities, not elsewhere shown R0880 33
Total liabilities R0900 96,563,042
Excess of assets over liabilities R1000 8,790,579

117
S.05.01.02 – Premiums, claims and expenses by line of business [unaudited] Line of Business for: life insurance obligations Life reinsurance obligations Total
£000 Health insurance Insurance with
profit participation
Index-linked and unit-linked insurance Other life insurance Health reinsurance Life reinsurance
C0210 C0220 C0230 C0240 C0270 C0290 C0300
Premiums written
� Gross R1410 46,103 206,478 9,828,062 591,028 6,316 1,006,813 11,684,800
� Reinsurers’ share R1420 12,916 561 27,632 253,724 - - 294,833
� Net R1500 33,187 205,917 9,800,429 337,304 6,316 1,006,813 11,389,967
Premiums earned
� Gross R1510 46,103 206,478 9,828,062 591,028 6,316 1,006,813 11,684,800
� Reinsurers’ share R1520 12,916 561 27,632 253,724 - - 294,833
� Net R1600 33,187 205,917 9,800,429 337,304 6,316 1,006,813 11,389,967
Claims incurred
� Gross R1610 17,458 2,027,397 5,012,339 497,910 - 98,355 7,653,458
� Reinsurers’ share R1620 9,984 27,738 23,714 439,963 - - 501,398
� Net R1700 7,474 1,999,659 4,988,625 57,947 - 98,355 7,152,060
Changes in other technical provisions
� Gross R1710 64,917 (2,667,255) (10,696,359) (40,675) (1,991) (780,757) (14,122,120)
� Reinsurers’ share R1720 45,100 6,177 6,528 31,500 - - 89,305
� Net R1800 19,817 (2,673,432) (10,702,887) (72,175) (1,991) (780,757) (14,211,425)
Expenses incurred R1900 3,893 101,565 223,754 266,909 98 1,207 597,426
Other expenses R2500 180,094
Total expenses R2600 777,520
Total amount of surrenders R2700 - 978,920 3,795,231 (16,551) - 18,864 4,776,465

118
S.12.01.02 – Life and health SLT technical provisions [audited]
Insurance with profit
participation
Index-linked and unit-linked insurance Other life insurance Annuities stemming from
non-life insurance contracts and
relating to insurance
obligation other than health
insurance obligations
Accepted reinsurance £000
Contracts without options and guarantees
Contracts with options or
guarantees
Contracts without options and guarantees
Contracts with options or
guarantees C0020 C0030 C0040 C0050 C0060 C0070 C0080 C0090 C0100
Technical provisions calculated as a whole
R0010 - 55,456,535 - 13,858
Total Recoverables from reinsurance/SPV and Finite Re after the adjustment for expected losses due to counterparty default associated to TP calculated as a whole
R0020
- 11,743 - -
Technical provisions calculated as a sum of BE and RM
Best Estimate
Gross Best Estimate R0030 29,140,639 - (1,918,365) 5,000,667 12,323 761,670
Total Recoverables from reinsurance/SPV and Finite Re after the adjustment for expected losses due to counterparty default
R0080
1,225,000 - (21,874) 3,509,499 37 17,212
Best estimate minus recoverables from reinsurance/SPV and Finite Re - total
R0090 27,915,639 - (1,896,491) 1,491,169 12,286 744,459
Risk margin R0100 1,683,497 563,924 310,145 35,521
Amount of the transitional on Technical Provisions
Technical provisions calculated as a whole – unaudited
R0110 - - - -
Best estimate – unaudited R0120 (475,394) - (3,046) - (26,073) (523) (1,364)
Risk margin – unaudited R0130 (1,650,534) (474,078) (286,867) (35,067)
Technical provisions - total R0200 28,698,208 53,624,970 5,009,671 774,620

119
S.12.01.02 – Life and health SLT technical provisions [audited] (continued)
Total (Life, other than health
insurance, incl Unit-Linked)
Health insurance (direct business) Annuities stemming from
non-life insurance contracts and
relating to health insurance
obligations
Health reinsurance
(reinsurance accepted)
Total (Health, similar to life
insurance) £000
Contracts without options and guarantees
Contracts with options or
guarantees C0150 C0160 C0170 C0180 C0190 C0200 C0210
Technical provisions calculated as a whole R0010 55,470,394 - - - -
Total Recoverables from reinsurance/SPV and Finite Re after the adjustment for expected losses due to counterparty default associated to TP calculated as a whole
R0020
11,743 - - - -
Technical provisions calculated as a sum of BE and RM
Best estimate
Gross Best Estimate R0030 32,996,935 (179,824) - - 1,991 (177,834)
Total Recoverables from reinsurance/SPV and Finite Re after the adjustment for expected losses due to counterparty default
R0080
4,729,874 (49,252) - - - (49,252)
Best estimate minus recoverables from reinsurance/SPV and Finite Re - total
R0090 28,267,061 (130,572) - - 1,991 (128,582)
Risk margin R0100 2,593,087 17,186 - 113 17,300
Amount of the transitional on Technical Provisions
Technical provisions calculated as a whole – unaudited
R0110 - - - - -
Best estimate – unaudited R0120 (506,399) (82) - - - (82)
Risk margin – unaudited R0130 (2,446,547) (14,494) - (113) (14,607)
Technical provisions - total R0200 88,107,469 (177,214) - 1,991 (175,224)

Appendices (continued)
120
S.22.01.21 – Impact of long-term guarantees and transitional measures [audited]
£000
Amount with Long Term Guarantee
measures and
transitionals
Impact of transitional
on technical provisions -
unaudited
Impact of transitional on interest
rate
Impact of volatility
adjustment set to zero
Impact of matching
adjustment set to zero
C0010 C0030 C0050 C0070 C0090
Technical provisions R0010 87,932,245 2,967,636 - 324,567 -
Basic own funds R0020 7,122,642 (782,457) - 58,608 -
Eligible own funds to meet Solvency Capital Requirement
R0050 7,122,642 (782,457) - 58,608 -
Solvency Capital Requirement R0090 4,262,021 - - 110,433 -
Eligible own funds to meet Minimum Capital Requirement
R0100 5,827,798 (782,457) - 64,129 -
Minimum Capital Requirement R0110 1,065,505 - - 27,608 -

Appendices (continued)
121
S.23.01.01 – Own funds [audited]
£000 Total Tier 1
unrestricted Tier 1
restricted Tier 2 Tier 3 C0010 C0020 C0030 C0040 C0050
Basic own funds before deduction for participations in other financial sector as foreseen in article 68 of Delegated Regulation 2015/35
Ordinary share capital (gross of own shares) R0010 - - - - -
Share premium account related to ordinary share capital
R0030 - - - - -
Initial funds, members' contributions or the equivalent basic own-fund item for mutual and mutual-type undertakings
R0040 - - - - -
Subordinated mutual member accounts R0050 - - - - -
Surplus funds R0070 8,780,635 8,780,635 - - -
Preference shares R0090 - - - - -
Share premium account related to preference shares
R0110 - - - - -
Reconciliation reserve R0130 (3,165,938) (3,165,938) - - -
Subordinated liabilities R0140 1,507,946 - - 1,507,946 -
An amount equal to the value of net deferred tax assets
R0160 - - - - -
Other own fund items approved by the supervisory authority as basic own funds not specified above
R0180 - - - - -
Own funds from the financial statements that should not be represented by the reconciliation reserve and do not meet the criteria to be classified as Solvency II own funds
Own funds from the financial statements that should not be represented by the reconciliation reserve and do not meet the criteria to be classified as Solvency II own funds
R0220 -
Deductions
Deductions for participations in financial and credit institutions
R0230 - - - - -
Total basic own funds after deductions R0290 7,122,642 5,614,697 - 1,507,946 -
Ancillary own funds
Unpaid and uncalled ordinary share capital callable on demand
R0300 - -
Unpaid and uncalled initial funds, members' contributions or the equivalent basic own fund item for mutual and mutual-type undertakings, callable on demand
R0310 - -

Appendices (continued)
122
£000 Total Tier 1
unrestricted Tier 1
restricted Tier 2 Tier 3 C0010 C0020 C0030 C0040 C0050
Unpaid and uncalled preference shares callable on demand
R0320 - - -
A legally binding commitment to subscribe and pay for subordinated liabilities on demand
R0330 - - -
Letters of credit and guarantees under Article 96(2) of the Directive 2009/138/EC
R0340 - -
Letters of credit and guarantees other than under Article 96(2) of the Directive 2009/138/EC
R0350 - - -
Supplementary members calls under first subparagraph of Article 96(3) of the Directive 2009/138/EC
R0360 - -
Supplementary members calls – other than under first subparagraph of Article 96(3) of the Directive 2009/138/EC
R0370 - - -
Other ancillary own funds R0390 - - -
Total ancillary own funds R0400 - - -
Available and eligible own funds
Total available own funds to meet the SCR R0500 7,122,642 5,614,697 - 1,507,946 -
Total available own funds to meet the MCR R0510 7,122,642 5,614,697 - 1,507,946
Total eligible own funds to meet the SCR R0540 7,122,642 5,614,697 - 1,507,946 -
Total eligible own funds to meet the MCR R0550 5,827,798 5,614,697 - 213,101
SCR R0580 4,262,021
MCR R0600 1,065,505
Ratio of Eligible own funds to SCR R0620 167%
Ratio of Eligible own funds to MCR R0640 547%
Reconciliation reserve
Excess of assets over liabilities R0700 8,790,579
Own shares (held directly and indirectly) R0710 -
Foreseeable dividends, distributions and charges
R0720 -
Other basic own fund items R0730 8,780,635
Adjustment for restricted own fund items in respect of matching adjustment portfolios and ring-fenced funds
R0740 3,175,882
Reconciliation reserve R0760 (3,165,938)
Expected profits
Expected profits included in future premiums (EPIFP) - Life business
R0770 1,177,497
Expected profits included in future premiums (EPIFP) - Non-life business
R0780 -
Total Expected profits included in future premiums (EPIFP)
R0790 1,177,497

Appendices (continued)
123
S.25.02.21 – Solvency Capital Requirement – for undertakings using the standard formula and partial internal model [unaudited]
Unique number of component Component description
Calculation of the Solvency Capital Requirement £’000
Amount modelled £’000 USP Simplifications
C0010 C0020 C0030 C0070 C0090 C0120
10300I Interest rate risk (within insurer) 1,704,615 1,704,615 9 -
10300P Interest rate risk (within pension schemes) (58,085) (58,085) 9 -
10400I Equity risk (within insurer) 1,303,855 1,303,855 9 -
10400P Equity risk (within pension schemes) 270,303 270,303 9 -
10600I Property risk (within insurer) 197,435 197,435 9 -
10600P Property risk (within pension schemes) 67,035 67,035 9 -
10700I Spread risk (within insurer) 937,300 937,300 9 -
10700P Spread risk (within pension schemes) (68,199) (68,199) 9 -
10900I Currency risk (within insurer) 485,660 485,660 9 -
10900P Currency risk (within pension schemes) 133,520 133,520 9 -
11010I Inflation risk (within insurer) 165,541 165,541 9 -
11010P Inflation risk (within pension schemes) 141,901 141,901 9 -
19900 Diversification within market risk (2,101,914) (2,101,914) 9 -
20300 Counterparty default risk 145,890 145,890 9 -
30100I Mortality risk (within insurer) 92,433 92,433 9 -
30200I Longevity risk (within insurer) 1,630,138 1,630,138 9 -
30200P Longevity risk (within pension schemes) 442,384 442,384 9 -
30300I Disability-morbidity risk (within insurer) 96,394 96,394 9 -
30400I Mass lapse risk (within insurer) 828,054 828,054 9 -
30500I Other lapse risk (within insurer) 2,549,990 2,549,990 9 -
30600I Expense risk (within insurer) 811,984 811,984 9 -
30800I Life catastrophe risk (within insurer) 61,299 61,299 9 -
39900 Diversification within life underwriting risk (2,191,500) (2,191,500) 9 -
70100I Operational risk (within insurer) 665,245 665,245 9 -
80200I Loss-absorbing capacity of technical provisions (within insurer)
(1,628,215) (1,628,215) 9 -
80300 Loss-absorbing capacity of deferred tax (within insurer) (141,606) (141,606) 9 -
80401 Other adjustments – Internal Model 199,755 199,755 9 -
8049A Other adjustments – Total SCR 28,855 - 9 -

Appendices (continued)
124
Calculation of the Solvency Capital Requirement C0100
Total undiversified components R0110 6,770,066
Diversification R0060 (2,508,045)
Capital requirement for business operated in accordance with Art.4 of Directive 2003/41/EC (transitional)
R0160 -
Solvency capital requirement excluding capital add-on R0200 4,262,021
Capital add-ons already set R0210 -
Solvency capital requirement for undertakings under consolidated method R0220 4,262,021
Other information on SCR
Amount/estimate of the overall loss-absorbing capacity of technical provisions R0300 (1,628,215)
Amount/estimate of the overall loss-absorbing capacity of deferred taxes R0310 (141,606)
Capital requirement for duration-based equity risk sub-module R0400 -
Total amount of Notional Solvency Capital Requirement for remaining part R0410 2,045,297
Total amount of Notional Solvency Capital Requirement for ring fenced funds R0420 2,216,724
Total amount of Notional Solvency Capital Requirement for matching adjustment portfolios
R0430 -
Diversification effects due to RFF nSCR aggregation for article 304 R0440 -

Appendices (continued)
125
S.28.01.01 – Minimum Capital Requirement – Only life or only non-life insurance or reinsurance activity [audited] £000 C0010
Linear formula component for non-life insurance and reinsurance obligations
MCRNL Result R0010 -
Linear formula component for life insurance and reinsurance obligations C0040
MCRL Result R0200 224,217
£000
Net (of reinsurance/SPV)
best estimate and TP calculated as a
whole
Net (of reinsurance/SPV) total capital at risk
C0050 C0060
Obligations with profit participation - guaranteed benefits R0210 13,974,914
Obligations with profit participation - future discretionary benefits R0220 14,002,056
Index-linked and unit-linked insurance obligations R0230 53,558,823
Other life (re)insurance and health (re)insurance obligations R0240 1,554,856
Total capital at risk for all life (re)insurance obligations R0250 39,555,232
Overall MCR calculation
Linear MCR R0300 224,217
SCR R0310 4,262,021
MCR cap R0320 1,917,910
MCR floor R0330 1,065,505
Combined MCR R0340 1,065,505
Absolute floor of the MCR R0350 3,187
Minimum Capital Requirement R0400 1,065,505