single disk performance · pdf filethis document "single disk performance" presents...
TRANSCRIPT

WHITE PAPER SINGLE DISK PERFORMANCE
© Fujitsu Technology Solutions 2011 Page 1 (48)
WHITE PAPER FUJITSU PRIMERGY SERVER SINGLE DISK PERFORMANCE
This technical documentation is aimed at people who are involved in selecting hard disk drives and solid state drives for operating disk subsystems on PRIMERGY servers. The
document is intended to help find at an early stage the appropriate data media, usually
for RAID configurations, for a planned solution. The various data media and their performance data are presented.
Version
1.0a
2011-08-31
Content
Document history ...................................................2 Introduction ............................................................3 Basics of hard disks ...............................................4
Quality & reliability ..............................................5 Dual porting ........................................................5 Transfer protocols ..............................................5 Solid state drives vs. conventional hard disks ....6
Drive classes ..........................................................7 Disk I/O performance measurements ................... 10
Load profiles ..................................................... 10 Measurement environment ............................... 11
Essential parameters............................................ 12 Block size ......................................................... 12 Load intensity ................................................... 16
Performance data of all hard disks ....................... 20 Hard disk of the ECO class .............................. 20 Hard disks of the BC class ............................... 22 Hard disks of the EP class................................ 28
Performance data in comparison ......................... 33 Server sizing..................................................... 33 Form factor ....................................................... 35 Rotational speed .............................................. 36 Capacity ........................................................... 39 Disk cache ........................................................ 44
Conclusion ........................................................... 47 Literature .............................................................. 48 Contact ................................................................. 48

WHITE PAPER SINGLE DISK PERFORMANCE 1.0A 2011-08-31
Page 2 (48) © Fujitsu Technology Solutions 2011
Document history
Version 1.0a

WHITE PAPER SINGLE DISK PERFORMANCE VERSION: 1.0A 2011-08-31
© Fujitsu Technology Solutions 2011 Page 3 (48)
Introduction
Hard disks are a security factor as well as critical performance components in the server environment. It is thus important to bundle the performance of such components via intelligent organization so that they do not cause a system bottleneck. They should simultaneously compensate for any failure of an individual component. Methods exist for arranging several hard disks in an array so that any hard disk failure can be compensated. This is known as a "Redundant Array of Independent Disks" or in short RAID. Special RAID controllers are normally used.
The PRIMERGY servers are available in a wide range of internal configuration versions with different RAID controller and hard disk configurations. The "Modular RAID" concept that is offered as a standard for all servers in the PRIMERGY family consists of a modular controller family and standardized management via the Fujitsu RAID Manager software known as "ServerView RAID". The comprehensive offer of RAID solutions enables the user to select the appropriate controller for a particular application scenario. The performance of the disk subsystem is defined by the controller, the selected hard disks and the features of the RAID level.
Several documents have been created in the PRIMERGY white paper series which illustrate all aspects of "Modular RAID" regarding performance:
We recommend - as a comprehensive introduction to disk I/O performance - the white paper "Basics of Disk I/O Performance".
This document "Single Disk Performance" presents the hard disks currently available for PRIMERGY and their performance in different application scenarios.
The document "RAID Controller Performance" covers all the RAID controllers currently on offer for PRIMERGY and their performance.
The document "RAID Performance" compares the individual RAID levels and provides information about performance and the optimal configuration.
In the past the terms "Hard Disk" and "Hard Disk Drive" (HDD) were used for a hard magnetic-coated, rotating, digital, non-volatile storage medium that could be directly addressed. Technical development has now seen new "hard disk" versions introduced as storage media; they use the same interface to the server and as far as the server is concerned are handled accordingly as hard disks. A typical example is a flash memory (Solid State Drive = SSD), which is an electronic storage medium without any movable parts; but which is still referred to as a hard disk in everyday talk. This document uses the term "hard disk" throughout. If necessary, for example, to illustrate construction features, the terms "SSD" and "HDD" will be used.
This document specifies hard disk capacities on a basis of 10 (1 TB = 1 billion bytes), while all other capacities as well as throughput are specified on a basis of 2 (1 MB/s = 2
20 Byte/s).

WHITE PAPER SINGLE DISK PERFORMANCE 1.0A 2011-08-31
Page 4 (48) © Fujitsu Technology Solutions 2011
Basics of hard disks
As hard disks are usually the only directly addressable, non-volatile storage media in a server and they have a very high access time in comparison with server components, such as processors or main memory, special attention should be paid regarding their selection for sizing and configuration of disk subsystems. The manner in which hard disks are used in servers is basically different when compared to those in a desktop or notebook. Server hard disks are usually faced with a much greater workload due to the higher number of users. Data transfer requests can arrive suddenly at any time and must be processed as quickly as possible. High transaction rates (IO/s) and fast response times (latency) are essential. Furthermore, data logging and backup/restore functions require a high data throughput rate (MB/s). At the same time, server hard disks usually run over a longer period, around the clock in an extreme situation. Server hard disks are normally used in a RAID array (Redundant Array of Independent Disks) in order to ensure as high data security levels as possible despite such workloads and possible failures of single hard disks. A further intention of using RAID arrays is of achieving throughput rates higher than those attained by just an individual hard disk. Various RAID levels plus their security and performance-specific features are described in detail in the document "RAID Performance". The lifespan requirements for such an individual hard disk are still much greater than for a disk used in the desktop environment. And last of all because the disk subsystem of a server can be very large, its hard disks often play a major role in the power consumption of a server.
The high level of quality requirements facing server hard disks can be described in more detail, as they depend on the specific task that a server has to execute. Here are some examples:
File servers are mainly used for file storage. Not only do they usually have internal hard disks, but are also connected with external hard disk arrays. Fail-safety is a number 1 priority for such a file server. The performance level for file server hard disks depends on the tasks: hard disks are probably not accessed quite so much if the server is just used for archiving purposes. In such situations, speed does not play a significant role. The behavior is different if the file server is used as a central part of daily business. In this case, a high level of hard disk performance is essential.
Database servers house databases which provide data within a company network or even via the Internet. From the user's viewpoint access to a database server is usually via an application server or web server. As database servers usually have to handle many parallel accesses, data security and fast response times are also essential.
Mail servers are responsible for sending, receiving and storing e-mails and are thus of great significance in the communications world. Such a scenario requires reliable hard disks. Fast response times are also required.
Application servers are used to execute application programs in a network. These include for example web applications, authentication services; in short: all services running on a server which are essential for a transaction between client and server. This can be limited to a restricted number of users or openly available for all Internet users. Such usage requires hard disks which are the fastest and most secure.
Streaming servers provide the user with multimedia files. Usually in 7×24 operations. Both fail-safety and high throughput rates are the main factors when selecting the hard disks.
Virtualization servers provide virtual machines in which different operating systems and applications work. The fastest and most reliable hard disks are essential in such a scenario.
Indeed, any combination of the above different server activities could run on one piece of server hardware. In this case, the hard disks should be grouped according to tasks and if possible should not be used in common for all tasks.

WHITE PAPER SINGLE DISK PERFORMANCE VERSION: 1.0A 2011-08-31
© Fujitsu Technology Solutions 2011 Page 5 (48)
Quality & reliability
The reliability requirements are an important aspect when selecting the right hard disk.
The MBTF value of a hard disk type is used to determine the approximate lifespan of a hard disk. MTBF stands for Mean Time Between Failures and specifies in hours the average operating time between two failures. As this is simply a statistic, there is no guarantee that the MTBF value is achieved in a particular situation.
Dual porting
SAS hard disks have two ports and can thus simultaneously be operated via two different controllers. This redundancy also enables hard disk access if one of the two controllers should fail.
SATA hard disks require a port selector for the connection to two controllers. No simultaneous access is then possible. The second controller can only access the SATA hard disk if the first controller is not active.
Transfer protocols
SATA and SAS protocols are used during data exchange at the interface between controllers and hard disks. The transfer rates specified below for both protocols must not be confused with hard disk throughputs. The actual throughput of a hard disk is lower than the throughput, for which your interface is designed. Downwards compatibility applies for the interfaces named below. This means that for example a hard disk with a SATA 6.0 Gbit/s interface can be operated on a server with a SATA 3.0 Gbit/s interface, but it can be only with the lower transfer speed. To ensure that an interface does not become a bottleneck, its transfer rate must be designed to be higher than the maximum possible throughput of a hard disk.
SATA interface
SATA stands for Serial Advanced Technology Attachment and is the successor of the ATA interface for driving storage media. Whereas 16 bit can be transferred in parallel with ATA, transfer is serial with SATA. There are in the meantime three generations of the SATA standard. The theoretically usable transfer rate, specified in the following list in MB/s, is about 80% of the transfer rate specified for the respective SATA generation.
SATA 1.5 Gbit/s enables a throughput of up to 143 MB/s. SATA 3.0 Gbit/s offers a maximum throughput of 286 MB/s. Hot-plug, staggered spinup, NCQ and
longer connecting cables have also been introduced here. The maximum throughput is 572 MB/s for SATA 6.0 Gbit/s. Improved NCQ (Streaming Command)
and energy-saving features have also been implemented and special connectors (LIF, ZIF) introduced.
SAS interface
SAS stands for Serial Attached SCSI and is the successor to the SCSI interface for driving storage media. Whereas the transfer was 16 bit in parallel with the last SCSI generation "Ultra-320 SCSI", transfer is serial with SAS. There are in the meantime two generations of the SAS standard. The theoretically usable transfer rate is about 80% of the transfer rate specified for the respective SAS generation.
SAS 3 Gbit/s offers a maximum throughput of 286 MB/s. SAS 6 Gbit/s enables a throughput of up to 572 MB/s. SAS 12 Gbit/s for a maximum throughput of 1144 MB/s is being planned.
Hard disks with SATA interfaces can also be operated on controllers with SAS interfaces.
WHITE PAPER SINGLE DISK PERFORMANCE 1.0A 2011-08-31
Page 6 (48) © Fujitsu Technology Solutions 2011
Solid state drives vs. conventional hard disks
Solid state drives (SSDs) have also been offered for some time now. Contrary to conventional hard disks, SSDs do not have any moving parts, but are based on flash memory. Outer design and interface correspond to those of conventional hard disks. In comparison with conventional hard disks, SSDs stand out for very low access times, mechanical robustness, low noise and very low energy consumption, but still have considerably lower capacity today and a higher price.
SSDs store information in so-called NAND flash memory single level cells (SLC) or in multi level cells (MLC). In comparison with MLC-based drives, the capacity of SLC-based SSDs is lower. In contrast, they are considerably more durable and offer a clearly higher write performance. Although SSDs are generally indefinitely readable, they are not indefinitely writable. However, the controller that exists in the SSD ensures that write operations are equally distributed over all flash memory cells thus ensuring even wear and tear. As with conventional hard disks, it is also possible to monitor SSDs via S.M.A.R.T. (Self-Monitoring, Analysis and Reporting Technology). The lifespan of an SSD can be compared with that of conventional hard disks of the Enterprise class (see "Drive classes").
SSDs generally provide a higher throughput than conventional hard disks. However, this greatly depends on when an SSD is accessed during its lifecycle. The first write accesses to an SSD take place at the highest possible speed, because only empty cells are written. After a period of time the throughput settles at a lower level, because for each write operation it is first necessary to delete any old contents. Only these are throughputs that are really relevant to practice. The SSDs were used in this condition in our measurements. This settling effect does not exist for the read performance. However, an SSD still achieves a much higher throughput than conventional hard disks - at least with random access - at this lower throughput level.

WHITE PAPER SINGLE DISK PERFORMANCE VERSION: 1.0A 2011-08-31
© Fujitsu Technology Solutions 2011 Page 7 (48)
Drive classes
For PRIMERGY servers Fujitsu offers a large number of hard disks with different performance and availability features for all conceivable scenarios - from the small department server that is only needed during working hours up to the high-availability database server. To facilitate making a selection from this wide range Fujitsu has introduced three hard disk classes:
Hard disks of the Economic class (ECO) are the most cost-effective variant. These disks are chosen if performance and fail-safety do not have to meet the highest requirements. They should only be used in non-critical application areas, in which high transaction rates are not to be expected and in which 7×24-hour operation is not necessary. ECO hard disks have a SATA interface and work at a rotational speed of 5400 or 7200 rpm.
Hard disks of the Business-Critical class (BC) are suited for 7×24-hour operation and thus meet the highest requirements for fail-safety. Due to their high capacities the lowest costs per GB are incurred here. BC hard disks either have a SATA interface and work at a rotational speed of 7200 rpm or have a SAS interface and work at a rotational speed of 10000 rpm.
Hard disks of the Enterprise class (EP) offer the best performance and simultaneously meet the highest security requirements. They were specially developed for scenarios, in which the highest requirements for throughput also have to be met under high loads. The EP hard disks include ones with a SAS interface and a rotational speed of 15000 rpm as well as SATA SSDs.
The following overview is a snapshot taken at the time the white paper was written. New PRIMERGY models and hard disk types can be added. A current compilation of the available hard disks can be found in the data sheet or in the configurator of the appropriate PRIMERGY server.
The following hard disks are on offer in the economic class for the current PRIMERGY servers:
Drive class
Data medium type
Interface Form factor
rpm Capacity
[GB] PRIMERGY servers
ECO HDD SATA 3 Gbit/s 3.5 7200 250 All tower servers except TX120, TX140
ECO HDD SATA 3 Gbit/s 2.5 5400 500
All tower servers except TX100, TX120 CX122 BX920 SX940, SX960
ECO HDD SATA 3 Gbit/s 2.5 5400 320
All tower servers except TX100 All scale-out servers RX100 S6 BX620, BX920, BX922 All storage blades
ECO HDD SATA 3 Gbit/s 2.5 5400 160
All tower servers except TX100 All scale-out servers RX100 S6 BX620, BX920, BX922 All storage blades
All tower servers: PRIMERGY TX100 S2, TX120 S3, TX140 S1, TX150 S6, TX200 S6, TX300 S6 All rack servers: PRIMERGY RX100 S6, RX100 S7, RX200 S6, RX300 S6, RX600 S5, RX600 S6, RX900 S1,
RX900 S2 All scale-out servers: PRIMERGY CX120 S1, CX122 S1 All server blades: PRIMERGY BX620 S6, BX920 S2, BX922 S2, BX924 S2, BX960 S1 All storage blades: PRIMERGY SX650, SX940 S1, SX960 S1

WHITE PAPER SINGLE DISK PERFORMANCE 1.0A 2011-08-31
Page 8 (48) © Fujitsu Technology Solutions 2011
The following hard disks are on offer in the business-critical class for the current PRIMERGY servers:
Drive class
Data medium type
Interface Form factor
rpm Capacity
[GB] PRIMERGY servers
BC HDD SAS 6 Gbit/s 2.5 10000 600
All tower servers except TX100 All rack servers BX920 SX940, SX960
BC HDD SAS 6 Gbit/s 2.5 10000 450
All tower servers except TX100 All rack servers BX920 SX940, SX960
BC HDD SAS 6 Gbit/s 2.5 10000 300
All tower servers except TX100 All rack servers BX920 SX940, SX960
BC HDD SAS 6 Gbit/s 2.5 10000 146
All tower servers except TX100 All rack servers BX920 SX940, SX960
BC HDD SATA 3 Gbit/s 3.5 7200 2000 All tower servers except TX100 RX100, RX300
BC HDD SATA 3 Gbit/s 3.5 7200 1000 All tower servers except TX120 RX100, RX300
BC HDD SATA 3 Gbit/s 3.5 7200 500 All tower servers except TX120 RX100, RX300
BC HDD SATA 3 Gbit/s 3.5 7200 250 All tower servers except TX120 RX100, RX300
BC HDD SATA 3 Gbit/s 2.5 7200 1000
All tower servers except TX100 RX100, RX200, RX300, RX600 S5 BX620, BX920 All storage blades
BC HDD SATA 3 Gbit/s 2.5 7200 500
All tower servers except TX100 All scale-out servers RX100, RX200 RX300, RX600 S5 BX620, BX920 All storage blades
BC HDD SATA 3 Gbit/s 2.5 7200 160
All tower servers except TX100 All scale-out servers RX100, RX200 RX300, RX600 S5 BX620, BX920 All storage blades
All tower servers: PRIMERGY TX100 S2, TX120 S3, TX140 S1, TX150 S6, TX200 S6, TX300 S6 All rack servers: PRIMERGY RX100 S6, RX100 S7, RX200 S6, RX300 S6, RX600 S5, RX600 S6, RX900 S1,
RX900 S2 All scale-out servers: PRIMERGY CX120 S1, CX122 S1 All server blades: PRIMERGY BX620 S6, BX920 S2, BX922 S2, BX924 S2, BX960 S1 All storage blades: PRIMERGY SX650, SX940 S1, SX960 S1

WHITE PAPER SINGLE DISK PERFORMANCE VERSION: 1.0A 2011-08-31
© Fujitsu Technology Solutions 2011 Page 9 (48)
The following hard disks are on offer in the enterprise class for the current PRIMERGY servers:
Drive class
Data medium type
Interface Form factor
rpm Capacity
[GB] PRIMERGY servers
EP SSD SATA 3 Gbit/s 2.5 - 64
All tower servers except TX100 All rack servers All server blades except BX620 SX940, SX960
EP SSD SATA 3 Gbit/s 2.5 - 32
All tower servers except TX100, TX140 All rack servers All server blades except BX620 SX940, SX960
EP HDD SAS 6 Gbit/s 3.5 15000 600 All tower servers except TX100, TX120 RX100, RX300
EP HDD SAS 6 Gbit/s 3.5 15000 450 All tower servers except TX100, TX120 RX100, RX300
EP HDD SAS 6 Gbit/s 3.5 15000 300 All tower servers except TX100, TX120 RX100, RX300
EP HDD SAS 3 Gbit/s 3.5 15000 146 All tower servers except TX100, TX120 RX100, RX300
EP HDD SAS 6 Gbit/s 2.5 15000 146
All tower servers except TX100 All rack servers BX920 SX940, SX960
EP HDD SAS 6 Gbit/s 2.5 15000 73
All tower servers except TX100 All rack servers BX920 SX940, SX960
All tower servers: PRIMERGY TX100 S2, TX120 S3, TX140 S1, TX150 S6, TX200 S6, TX300 S6 All rack servers: PRIMERGY RX100 S6, RX100 S7, RX200 S6, RX300 S6, RX600 S5, RX600 S6, RX900 S1,
RX900 S2 All scale-out servers: PRIMERGY CX120 S1, CX122 S1 All server blades: PRIMERGY BX620 S6, BX920 S2, BX922 S2, BX924 S2, BX960 S1 All storage blades: PRIMERGY SX650, SX940 S1, SX960 S1

WHITE PAPER SINGLE DISK PERFORMANCE 1.0A 2011-08-31
Page 10 (48) © Fujitsu Technology Solutions 2011
Disk I/O performance measurements
At Fujitsu disk I/O performance measurements are performed for all the hard disks released for PRIMERGY servers in the PRIMERGY Performance Lab. In contrast to the application benchmarks, it is in general not the performance of an entire server including disk subsystem that is tested, but merely the performance of the disk subsystem, in other words the storage media in themselves as well as their controllers. In the single disk measurements presented in this document the disk subsystem has been sized in such a way that server components such as the processor or main memory do not constitute a bottleneck.
The Iometer measuring tool was used for the disk I/O performance measurements. Iometer makes it possible to reproduce the behavior of real applications with regard to accesses to disk subsystems. In this way, the most varied application scenarios can be reproduced - be it with sequential read or write, random read or write and also combinations thereof when using different block sizes as well as a variably adjustable number of simultaneous accesses. This method permits the performance of various hard disks with certain access patterns to be compared.
As a result Iometer provides the following important indicators:
Throughput [MB/s] Throughput in megabytes per second Transactions [IO/s] Transaction rate in I/O operations per second Latency [ms] Average response time in ms
Data throughput has generally established itself as the usual measurement variable for sequential load profiles, whereas the measurement variable "transaction rate" is normally used for the random load profiles with their small block sizes, as is also the case in this document.
Load profiles
As standard, a series of load profiles, which are characterized by the following mass storage accesses, is used for disk I/O performance measurements:
Access Type of access Transfer request size [kB] (block size)
Number of outstanding I/Os
read write
sequential 100% 0% 1, 4, 8, 64, 128, 512, 1024 1, 3, 8, 16, 32, 64, 128, 256, 512
sequential 0% 100% 1, 4, 8, 64, 128, 512, 1024 1, 3, 8, 16, 32, 64, 128, 256, 512
random 100% 0% 1, 4, 8, 64, 256, 1024 1, 3, 8, 16, 32, 64, 128, 256, 512
random 0% 100% 1, 4, 8, 64, 256, 1024 1, 3, 8, 16, 32, 64, 128, 256, 512
random 67% 33% 1, 4, 8, 16, 32, 64, 128 1, 3, 8, 16, 32, 64, 128, 256, 512
random 50% 50% 64 1, 3, 8, 16, 32, 64, 128, 256, 512
Some of these load profiles can be assigned with typical applications:
Standard load profile
Access Type of access Block size [kB]
Application
read write
File copy random 50% 50% 64 Copying of files
File server random 67% 33% 64 File server
Database random 67% 33% 8 Database (data transfer) Mail server
Streaming sequential 100% 0% 64 Database (log file), Data backup; Video streaming (partial)
Restore sequential 0% 100% 64 Restoring of files
Apart from a number of measurement results, which clarify the influence of the block size on hard disk performance (see section "Essential parameters", subsection "Block size"), all the measurement results presented in this document can be allocated to these five practice-relevant standard load profiles.

WHITE PAPER SINGLE DISK PERFORMANCE VERSION: 1.0A 2011-08-31
© Fujitsu Technology Solutions 2011 Page 11 (48)
Measurement environment
All the measurement results presented in this document were determined in a standardized measurement environment with the following hardware and software components.
Components Details
Operating system Windows Server 2008 Enterprise Edition
File system NTFS
Measuring tool Iometer 2006.07.27
Measurement data
32 GB measurement file
Controller LSI MegaRAID SAS 1068
Drives ECO HDD SATA 3 Gbit/s 2.5 5400 rpm 160 GB
ECO HDD SATA 3 Gbit/s 2.5 5400 rpm 320 GB
ECO HDD SATA 3 Gbit/s 2.5 5400 rpm 500 GB
ECO HDD SATA 3 Gbit/s 3.5 7200 rpm 250 GB
BC HDD SATA 3 Gbit/s 2.5 7200 rpm 160 GB
BC HDD SATA 3 Gbit/s 2.5 7200 rpm 500 GB
BC HDD SATA 3 Gbit/s 2.5 7200 rpm 1 TB
BC HDD SATA 3 Gbit/s 3.5 7200 rpm 250 GB
BC HDD SATA 3 Gbit/s 3.5 7200 rpm 500 GB
BC HDD SATA 3 Gbit/s 3.5 7200 rpm 1 TB
BC HDD SATA 3 Gbit/s 3.5 7200 rpm 2 TB
BC HDD SAS 6 Gbit/s 2.5 10000 rpm 146 GB
BC HDD SAS 6 Gbit/s 2.5 10000 rpm 300 GB
BC HDD SAS 6 Gbit/s 2.5 10000 rpm 450 GB
BC HDD SAS 6 Gbit/s 2.5 10000 rpm 600 GB
EP HDD SAS 6 Gbit/s 2.5 15000 rpm 73 GB
EP HDD SAS 6 Gbit/s 2.5 15000 rpm 146 GB
EP HDD SAS 6 Gbit/s 3.5 15000 rpm 146 GB
EP HDD SAS 6 Gbit/s 3.5 15000 rpm 300 GB
EP HDD SAS 6 Gbit/s 3.5 15000 rpm 450 GB
EP HDD SAS 6 Gbit/s 3.5 15000 rpm 600 GB
EP SSD SATA 3 Gbit/s 2.5 32 GB
EP SSD SATA 3 Gbit/s 2.5 64 GB
RAID levels JBOD

WHITE PAPER SINGLE DISK PERFORMANCE 1.0A 2011-08-31
Page 12 (48) © Fujitsu Technology Solutions 2011
Essential parameters
To understand the performance data presented in the following sections the influence that the variation of two important parameters has is dealt with here: block size and load intensity.
Block size
Data transfer always takes place block-by-block when accessing a disk subsystem. The size of the transferred data blocks depends on features of the operating system and/or the application and cannot be influenced by the user. The throughput rates that can be achieved therefore depend very much on the access pattern that an application generates on the disk subsystem.
The following table shows examples of typical access patterns of various applications:
Application Access pattern
Operating system random, 40% read, 60% write, blocks ≥ 4 kB
File copy (SMB) random, 50% read, 50% write, 64 kB blocks
File server (SMB) random, 67% read, 33% write, 64 kB blocks
Mail server random, 67% read, 33% write, 8 kB blocks
Database (transaction processing) random, 67% read, 33% write, 8 kB blocks
Web server random, 100% write, 64 kB blocks
Database (log file) sequential, 100% write, 64 kB blocks
Video streaming sequential, 100% read, blocks ≥ 64 kB
Backup sequential, 100% read, blocks ≥ 64 kB
Restore sequential, 100% write, blocks ≥ 64 kB
As the implemented block size is an application feature that cannot be modified, comparing the hard disk performance when varying the block size amounts to comparing the I/O behavior of different applications (file server, database server, etc.) or even a specific application with an exotic or even completely irrelevant access pattern. In comparison with the relevant access patterns, others may exist with which a higher hard disk throughput can be achieved. However, this is always at the expense of poorer response times. Therefore, this type of measurement data is of theoretical interest only and is not practice-relevant.
Below we look at the influence of the block size on the throughputs, transactions and latencies of a SATA-HDD, a SAS-HDD and a SATA-SSD. To this end, measurement results were selected which show this influence with random access and a read/write ratio of 67% to 33%, as well as with sequential read and sequential write access. The load intensity (outstanding I/Os) was kept the same in all cases.

WHITE PAPER SINGLE DISK PERFORMANCE VERSION: 1.0A 2011-08-31
© Fujitsu Technology Solutions 2011 Page 13 (48)
Random access, 67% read, 33% write, 2 outstanding IOs
A reduction in the transaction rates can be seen (diagram 2) for random access with 67% read share and increasing block size. However, in comparison with the increase in block size the decrease is so minor that this results in a significantly growing throughput (diagram 1). But at the same time higher average response times must also be expected with higher block sizes (diagram 3). The measurement results with a block size of 8 kB correspond to those of typical transaction processing in databases, whereas the measurement results with a block size of 64 kB reflect that of a typical file server. As can be seen in the right data column in the top diagrams, applications that used even larger blocks would be able to generate even higher throughputs, whereby this would of course be at the expense of further sinking transaction rates and further increasing response times.
0306090
120150
8 64 128
BC HDD SATA 3 Gbit/s2.5” 7200 rpm 500 GB 1.26 9.18 16.56
EP HDD SAS 6 Gbit/s2.5” 15000 rpm 146 GB 2.98 21.23 36.91
EP SSD SATA 3 Gbit/s2.5" 64 GB 36.19 110.65 121.97
Throughput [MB/s]
010002000300040005000
8 64 128
BC HDD SATA 3 Gbit/s2.5” 7200 rpm 500 GB 161 147 132
EP HDD SAS 6 Gbit/s2.5” 15000 rpm 146 GB 382 340 295
EP SSD SATA 3 Gbit/s2.5" 64 GB 4633 1770 976
Transactions [IO/s]
0
5
10
15
20
8 64 128
EP SSD SATA 3 Gbit/s2.5" 64 GB 0.4 1.1 2.0
EP HDD SAS 6 Gbit/s2.5” 15000 rpm 146 GB 5.2 5.9 6.8
BC HDD SATA 3 Gbit/s2.5” 7200 rpm 500 GB 12.4 13.6 15.1
Latency [ms]
Block size [kB]
bett
er
bett
er
Block size [kB]
Block size [kB]
bett
er

WHITE PAPER SINGLE DISK PERFORMANCE 1.0A 2011-08-31
Page 14 (48) © Fujitsu Technology Solutions 2011
Sequential access, 100% read, 2 outstanding IOs
The throughput of SATA and SAS hard disks with sequential read access does not depend on the block size. Thus, twice as high average response times and halved I/O rates are recorded with double the block size. This is not the case with SATA-SSDs, because with block sizes of more than 64 kB they still offer minor increases in throughput. As only throughput - and not the transaction rates and response times - plays a role during backup, large blocks are used here, whereas smaller block sizes are generally used during streaming.
0
100
200
300
64 128 512 1024
BC HDD SATA 3 Gbit/s2.5” 7200 rpm 500 GB 111.16 111.13 111.15 111.10
EP HDD SAS 6 Gbit/s2.5” 15000 rpm 146 GB 200.15 200.15 200.20 200.17
EP SSD SATA 3 Gbit/s2.5" 64 GB 226.40 247.50 264.62 268.63
Throughput [MB/s]
0
1000
2000
3000
4000
64 128 512 1024
BC HDD SATA 3 Gbit/s2.5” 7200 rpm 500 GB 1779 889 222 111
EP HDD SAS 6 Gbit/s2.5” 15000 rpm 146 GB 3202 1601 400 200
EP SSD SATA 3 Gbit/s2.5" 64 GB 3622 1980 529 269
Transactions [IO/s]
0
5
10
15
20
64 128 512 1024
EP SSD SATA 3 Gbit/s2.5" 64 GB 0.6 1.0 3.8 7.4
EP HDD SAS 6 Gbit/s2.5” 15000 rpm 146 GB 0.6 1.2 5.0 10.0
BC HDD SATA 3 Gbit/s2.5” 7200 rpm 500 GB 1.1 2.2 9.0 18.0
Latency [ms]
Block size [kB]
Block size [kB]
Block size [kB]
bett
er
bett
er
bett
er

WHITE PAPER SINGLE DISK PERFORMANCE VERSION: 1.0A 2011-08-31
© Fujitsu Technology Solutions 2011 Page 15 (48)
Sequential access, 100% read, 2 outstanding IOs
The throughput of all hard disks does not depend on block size with sequential write access. Thus, twice as high average response times and halved transaction rates are recorded with double the block size. As long as response times are of no interest, it does not matter whether an application runs with a block size of 64 kB or even larger blocks.
0
50
100
150
200
64 128 512 1024
BC HDD SATA 3 Gbit/s2.5” 7200 rpm 500 GB 110.72 110.65 110.76 110.85
EP HDD SAS 6 Gbit/s2.5” 15000 rpm 146 GB 195.32 196.09 195.94 196.83
EP SSD SATA 3 Gbit/s2.5" 64 GB 187.30 190.81 191.61 191.64
Throughput [MB/s]
0
1000
2000
3000
4000
64 128 512 1024
BC HDD SATA 3 Gbit/s2.5” 7200 rpm 500 GB 1772 885 222 111
EP HDD SAS 6 Gbit/s2.5” 15000 rpm 146 GB 3125 1569 392 197
EP SSD SATA 3 Gbit/s2.5" 64 GB 2997 1526 383 192
Transactions [IO/s]
0
5
10
15
20
64 128 512 1024
EP SSD SATA 3 Gbit/s2.5" 64 GB 0.7 1.3 5.2 10.4
EP HDD SAS 6 Gbit/s2.5” 15000 rpm 146 GB 0.6 1.3 5.1 10.2
BC HDD SATA 3 Gbit/s2.5” 7200 rpm 500 GB 1.1 2.3 9.0 18.0
Latency [ms]
Block size [kB]
Block size [kB]
Block size [kB]
bett
er
bett
er
bett
er
WHITE PAPER SINGLE DISK PERFORMANCE 1.0A 2011-08-31
Page 16 (48) © Fujitsu Technology Solutions 2011
Load intensity
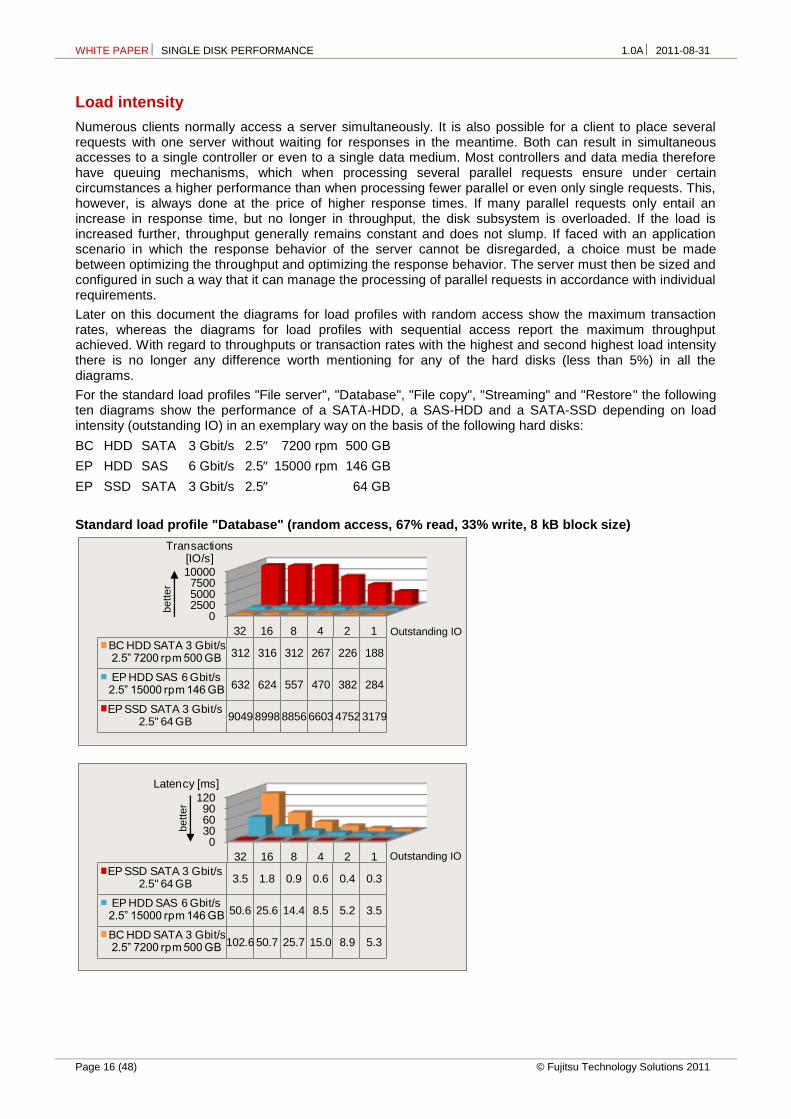
Numerous clients normally access a server simultaneously. It is also possible for a client to place several requests with one server without waiting for responses in the meantime. Both can result in simultaneous accesses to a single controller or even to a single data medium. Most controllers and data media therefore have queuing mechanisms, which when processing several parallel requests ensure under certain circumstances a higher performance than when processing fewer parallel or even only single requests. This, however, is always done at the price of higher response times. If many parallel requests only entail an increase in response time, but no longer in throughput, the disk subsystem is overloaded. If the load is increased further, throughput generally remains constant and does not slump. If faced with an application scenario in which the response behavior of the server cannot be disregarded, a choice must be made between optimizing the throughput and optimizing the response behavior. The server must then be sized and configured in such a way that it can manage the processing of parallel requests in accordance with individual requirements.
Later on this document the diagrams for load profiles with random access show the maximum transaction rates, whereas the diagrams for load profiles with sequential access report the maximum throughput achieved. With regard to throughputs or transaction rates with the highest and second highest load intensity there is no longer any difference worth mentioning for any of the hard disks (less than 5%) in all the diagrams.
For the standard load profiles "File server", "Database", "File copy", "Streaming" and "Restore" the following ten diagrams show the performance of a SATA-HDD, a SAS-HDD and a SATA-SSD depending on load intensity (outstanding IO) in an exemplary way on the basis of the following hard disks:
BC HDD SATA 3 Gbit/s 2.5 7200 rpm 500 GB
EP HDD SAS 6 Gbit/s 2.5 15000 rpm 146 GB
EP SSD SATA 3 Gbit/s 2.5 64 GB
Standard load profile "Database" (random access, 67% read, 33% write, 8 kB block size)
0250050007500
10000
12481632
BC HDD SATA 3 Gbit/s2.5” 7200 rpm 500 GB 188226267312316312
EP HDD SAS 6 Gbit/s2.5” 15000 rpm 146 GB 284382470557624632
EP SSD SATA 3 Gbit/s2.5" 64 GB 317947526603885689989049
Transactions [IO/s]
0306090
120
12481632
EP SSD SATA 3 Gbit/s2.5" 64 GB 0.30.40.60.91.83.5
EP HDD SAS 6 Gbit/s2.5” 15000 rpm 146 GB 3.55.28.514.425.650.6
BC HDD SATA 3 Gbit/s2.5” 7200 rpm 500 GB 5.38.915.025.750.7102.6
Latency [ms]
Outstanding IO
Outstanding IO
bett
er
bett
er

WHITE PAPER SINGLE DISK PERFORMANCE VERSION: 1.0A 2011-08-31
© Fujitsu Technology Solutions 2011 Page 17 (48)
Standard load profile "File server" (random access, 67% read, 33% write, 64 kB block size)
Standard load profile "File copy" (random access, 50% read, 50% write, 64 kB block size)
0500
100015002000
12481632
BC HDD SATA 3 Gbit/s2.5” 7200 rpm 500 GB 171198240273273273
EP HDD SAS 6 Gbit/s2.5” 15000 rpm 146 GB 267340419483546552
EP SSD SATA 3 Gbit/s2.5" 64 GB 122216141741190818251846
Transactions [IO/s]
0306090
120
12481632
EP SSD SATA 3 Gbit/s2.5" 64 GB 0.81.22.34.28.817.3
EP HDD SAS 6 Gbit/s2.5” 15000 rpm 146 GB 3.75.99.616.629.358.0
BC HDD SATA 3 Gbit/s2.5” 7200 rpm 500 GB 5.910.116.629.358.5117.1
Latency [ms]
0500
100015002000
12481632
BC HDD SATA 3 Gbit/s2.5” 7200 rpm 500 GB 189220258289284284
EP HDD SAS 6 Gbit/s2.5” 15000 rpm 146 GB 286369443508543541
EP SSD SATA 3 Gbit/s2.5" 64 GB 143114861711162716061614
Transactions [IO/s]
0306090
120
12481632
EP SSD SATA 3 Gbit/s2.5" 64 GB 0.71.32.34.910.019.8
EP HDD SAS 6 Gbit/s2.5” 15000 rpm 146 GB 3.55.49.015.729.459.2
BC HDD SATA 3 Gbit/s2.5” 7200 rpm 500 GB 5.39.115.527.756.3112.8
Latency [ms]
Outstanding IO
Outstanding IO
bett
er
bett
er
Outstanding IO
Outstanding IO
bett
er
bett
er

WHITE PAPER SINGLE DISK PERFORMANCE 1.0A 2011-08-31
Page 18 (48) © Fujitsu Technology Solutions 2011
With a low load the SAS-HDD offers 50% higher transaction rates for the three standard load profiles with random access than the SATA-HDD. With higher loads the SAS-HDD provides about twice the performance of the SATA-HDD. If the load on the SAS-HDD is twice as high as that on the SATA-HDD, the response times are approximately equal.
In comparison with the SAS-HDD, the SATA-SSD offers many times the transaction rates with significantly lower response times. It can be loaded twice as much as a SAS-HDD without supplying poorer response times than the latter. Therefore, in a RAID array the performance of SAS-HDDs can be achieved with considerably fewer SATA-SSDs, unless capacity requirements oppose this.
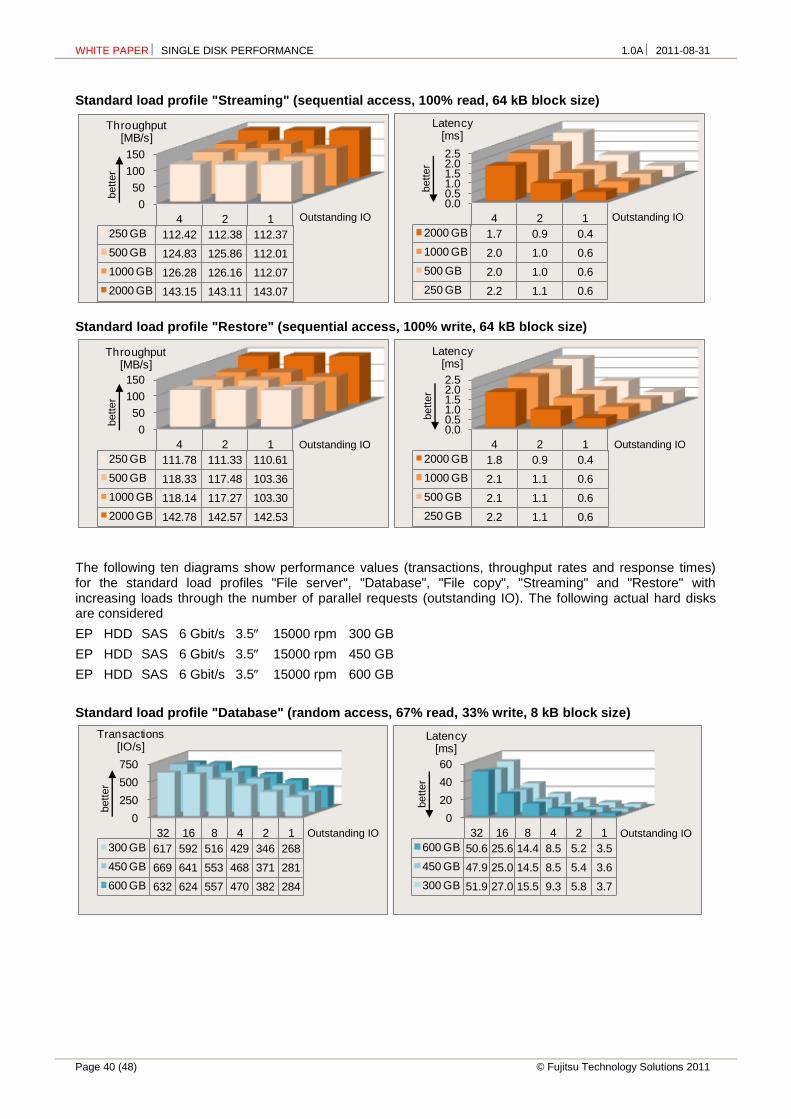
Standard load profile "Streaming" (sequential access, 100% read, 64 kB block size)
With streaming the throughput of the SAS-HDD is about 40% higher than that of the SATA-HDD. Compared with the SAS-HDD, the SATA-SSD offers a higher throughput of about 30%. The response times are reduced by about 20% - 30% in each case.
Standard load profile "Restore" (sequential access, 100% write, 64 kB block size)
0
100
200
300
1248
BC HDD SATA 3 Gbit/s2.5” 7200 rpm 500 GB 143.07143.11143.15143.15
EP HDD SAS 6 Gbit/s2.5” 15000 rpm 146 GB 175.15200.15200.15200.15
EP SSD SATA 3 Gbit/s2.5" 64 GB 197.53226.40252.24257.20
Throughput [MB/s]
01234
1248
EP SSD SATA 3 Gbit/s2.5" 64 GB 0.30.61.01.9
EP HDD SAS 6 Gbit/s2.5” 15000 rpm 146 GB 0.40.61.22.5
BC HDD SATA 3 Gbit/s2.5” 7200 rpm 500 GB 0.40.91.73.5
Latency [ms]
0
50
100
150
200
124
BC HDD SATA 3 Gbit/s2.5” 7200 rpm 500 GB 142.53142.57142.78
EP HDD SAS 6 Gbit/s2.5” 15000 rpm 146 GB 195.04195.32195.99
EP SSD SATA 3 Gbit/s2.5" 64 GB 163.12187.30188.00
Throughput [MB/s]
bett
er
bett
er
bett
er
Outstanding IO
Outstanding IO
Outstanding IO

WHITE PAPER SINGLE DISK PERFORMANCE VERSION: 1.0A 2011-08-31
© Fujitsu Technology Solutions 2011 Page 19 (48)
With restore the throughput of the SAS-HDD is just under 40% higher than that of the SATA-HDD, the response times are just under 30% lower. In comparison with the SAS-HDD, the throughput and response times of the SATA-SSD are slightly worse.
0.0
0.5
1.0
1.5
2.0
124
EP SSD SATA 3 Gbit/s2.5" 64 GB 0.40.71.3
EP HDD SAS 6 Gbit/s2.5” 15000 rpm 146 GB 0.30.61.3
BC HDD SATA 3 Gbit/s2.5” 7200 rpm 500 GB 0.40.91.8
Latency [ms]
bett
er
Outstanding IO

WHITE PAPER SINGLE DISK PERFORMANCE 1.0A 2011-08-31
Page 20 (48) © Fujitsu Technology Solutions 2011
Performance data of all hard disks
Below is an overview of the performance data of all of the hard disks examined, sorted according to drive classes.
Hard disk of the ECO class
The following ten diagrams show performance values (transactions, throughput rates and response times) for the standard load profiles "File server", "Database", "File copy", "Streaming" and "Restore" with increasing loads through the number of parallel requests (outstanding IO). The following actual hard disks are considered
ECO HDD SATA 3 Gbit/s 2.5 5400 rpm 160 GB
ECO HDD SATA 3 Gbit/s 2.5 5400 rpm 320 GB
ECO HDD SATA 3 Gbit/s 2.5 5400 rpm 500 GB
ECO HDD SATA 3 Gbit/s 3.5 7200 rpm 250 GB
Standard load profile "Database" (random access, 67% read, 33% write, 8 kB block size)
Standard load profile "File server" (random access, 67% read, 33% write, 64 kB block size)
050
100150200
124816
2.5” 5400 rpm160 GB 8585919997
2.5” 5400 rpm320 GB 9597105116117
2.5” 5400 rpm500 GB 9383105112111
3.5” 7200 rpm250 GB 118145169192194
Transactions[IO/s]
050
100150200
124816
3.5” 7200 rpm250 GB 8.513.823.641.782.7
2.5” 5400 rpm500 GB 10.724.038.271.1143.8
2.5” 5400 rpm320 GB 10.620.738.269.1137.1
2.5” 5400 rpm160 GB 11.823.643.980.6164.8
Latency [ms]
050
100150200
124816
2.5” 5400 rpm160 GB 7576808685
2.5” 5400 rpm320 GB 84859098100
2.5” 5400 rpm500 GB 8586909898
3.5” 7200 rpm250 GB 113135156178178
Transactions[IO/s]
050
100150200
124816
3.5” 7200 rpm250 GB 8.814.825.645.190.1
2.5” 5400 rpm500 GB 11.823.344.481.5163.6
2.5” 5400 rpm320 GB 11.923.444.381.9160.7
2.5” 5400 rpm160 GB 13.326.449.793.4187.9
Latency [ms]
Outstanding IO Outstanding IO
Outstanding IO Outstanding IO
bett
er
bett
er
bett
er
bett
er

WHITE PAPER SINGLE DISK PERFORMANCE VERSION: 1.0A 2011-08-31
© Fujitsu Technology Solutions 2011 Page 21 (48)
Standard load profile "File copy" (random access, 50% read, 50% write, 64 kB block size)
Standard load profile "Streaming" (sequential access, 100% read, 64 kB block size)
Standard load profile "Restore" (sequential access, 100% write, 64 kB block size)
050
100150200
124816
2.5” 5400 rpm160 GB 7879838681
2.5” 5400 rpm320 GB 8890939998
2.5” 5400 rpm500 GB 8889919795
3.5” 7200 rpm250 GB 129147168185162
Transactions[IO/s]
050
100150200
124816
3.5” 7200 rpm250 GB 7.813.623.843.398.9
2.5” 5400 rpm500 GB 11.322.443.882.8167.7
2.5” 5400 rpm320 GB 11.322.243.181.2162.5
2.5” 5400 rpm160 GB 12.925.448.393.4198.3
Latency [ms]
0
50
100
150
12
2.5” 5400 rpm160 GB 59.6259.63
2.5” 5400 rpm320 GB 74.9074.91
2.5” 5400 rpm500 GB 82.4782.47
3.5” 7200 rpm250 GB 140.79140.67
Throughput[MB/s]
0
1
2
3
12
3.5” 7200 rpm250 GB 0.40.9
2.5” 5400 rpm500 GB 0.81.5
2.5” 5400 rpm320 GB 0.81.7
2.5” 5400 rpm160 GB 1.02.1
Latency [ms]
0
50
100
150
12
2.5” 5400 rpm160 GB 59.4359.35
2.5” 5400 rpm320 GB 74.7274.61
2.5” 5400 rpm500 GB 82.1982.24
3.5” 7200 rpm250 GB 139.54139.04
Throughput[MB/s]
0
1
2
3
12
3.5” 7200 rpm250 GB 0.40.9
2.5” 5400 rpm500 GB 0.81.5
2.5” 5400 rpm320 GB 0.81.7
2.5” 5400 rpm160 GB 1.12.1
Latency [ms]
Outstanding IO Outstanding IO
Outstanding IO Outstanding IO
Outstanding IO Outstanding IO
bett
er
bett
er
bett
er
bett
er
bett
er

WHITE PAPER SINGLE DISK PERFORMANCE 1.0A 2011-08-31
Page 22 (48) © Fujitsu Technology Solutions 2011
Hard disks of the BC class
The following ten diagrams show performance values (transactions, throughput rates and response times) for the standard load profiles "File server", "Database", "File copy", "Streaming" and "Restore" with increasing loads through the number of parallel requests (outstanding IO). The following actual hard disks are considered
BC HDD SATA 3 Gbit/s 2.5 7200 rpm 160 GB
BC HDD SATA 3 Gbit/s 2.5 7200 rpm 500 GB
BC HDD SATA 3 Gbit/s 2.5 7200 rpm 1 TB
BC HDD SATA 3 Gbit/s 3.5 7200 rpm 250 GB
BC HDD SATA 3 Gbit/s 3.5 7200 rpm 500 GB
BC HDD SATA 3 Gbit/s 3.5 7200 rpm 1 TB
BC HDD SATA 3 Gbit/s 3.5 7200 rpm 2 TB
BC HDD SAS 6 Gbit/s 2.5 10000 rpm 146 GB
BC HDD SAS 6 Gbit/s 2.5 10000 rpm 300 GB
BC HDD SAS 6 Gbit/s 2.5 10000 rpm 450 GB
BC HDD SAS 6 Gbit/s 2.5 10000 rpm 600 GB

WHITE PAPER SINGLE DISK PERFORMANCE VERSION: 1.0A 2011-08-31
© Fujitsu Technology Solutions 2011 Page 23 (48)
Standard load profile "Database" (random access, 67% read, 33% write, 8 kB block size)
0
100
200
300
400
500
600
1248163264
SATA 2.5” 160 GB 125151184217216217215
SATA 2.5” 500 GB 132161202235229235234
SATA 2.5” 1 TB 158207260305308307314
SATA 3.5” 250 GB 112119122136133133136
SATA 3.5” 500 GB 118136159190188187192
SATA 3.5” 1 TB 117133155185186187188
SATA 3.5” 2 TB 188226267312316312315
SAS 2.5” 146 GB 195256315378440492494
SAS 2.5” 300 GB 203272343397458472469
SAS 2.5” 450 GB 204261348420488497499
SAS 2.5” 600 GB 206268350429489504505
Transactions[IO/s]
0
100
200
300
400
500
1248163264
SAS 2.5” 600 GB 4.97.511.418.732.763.4126.6
SAS 2.5” 450 GB 4.97.611.519.032.864.4128.4
SAS 2.5” 300 GB 4.97.411.720.134.967.8136.6
SAS 2.5” 146 GB 5.17.812.721.236.465.0129.5
SATA 3.5” 2 TB 5.38.915.025.750.7102.6203.2
SATA 3.5” 1 TB 8.515.025.843.386.0171.5340.8
SATA 3.5” 500 GB 8.514.725.242.085.1170.7332.9
SATA 3.5” 250 GB 9.016.932.758.8120.5240.9471.3
SATA 2.5” 1 TB 6.39.715.426.251.9104.1204.0
SATA 2.5” 500 GB 7.612.419.834.169.8136.0273.0
SATA 2.5” 160 GB 8.013.221.736.974.1147.3298.4
Latency[ms]
Outstanding IO
Outstanding IO
bett
er
bett
er

WHITE PAPER SINGLE DISK PERFORMANCE 1.0A 2011-08-31
Page 24 (48) © Fujitsu Technology Solutions 2011
Standard load profile "File server" (random access, 67% read, 33% write, 64 kB block size)
050
100150200250300350400450
1248163264
SATA 2.5” 160 GB 115132163187195188191
SATA 2.5” 500 GB 122147180205204207203
SATA 2.5” 1 TB 148189229266267274267
SATA 3.5” 250 GB 105113119126123125128
SATA 3.5” 500 GB 111126147172174172173
SATA 3.5” 1 TB 111124143173168171169
SATA 3.5” 2 TB 171198240273273273272
SAS 2.5” 146 GB 179227265315362382397
SAS 2.5” 300 GB 160209262304345367364
SAS 2.5” 450 GB 184234299347393413410
SAS 2.5” 600 GB 185238301350399420420
Transactions[IO/s]
0
100
200
300
400
500
600
1248163264
SAS 2.5” 600 GB 5.48.413.322.840.176.1152.3
SAS 2.5” 450 GB 5.48.613.423.140.877.4156.2
SAS 2.5” 300 GB 6.29.615.326.346.387.3176.0
SAS 2.5” 146 GB 5.68.815.125.444.283.7161.2
SATA 3.5” 2 TB 5.910.116.629.358.5117.1234.9
SATA 3.5” 1 TB 9.016.128.146.395.4186.9377.9
SATA 3.5” 500 GB 9.015.927.246.592.0185.5369.9
SATA 3.5” 250 GB 9.617.733.763.2129.8256.1500.9
SATA 2.5” 1 TB 6.710.617.530.060.0116.9239.3
SATA 2.5” 500 GB 8.213.622.239.178.4154.8316.0
SATA 2.5” 160 GB 8.715.224.542.782.2170.0334.6
Latency[ms]
Outstanding IO
Outstanding IO
bett
er
bett
er

WHITE PAPER SINGLE DISK PERFORMANCE VERSION: 1.0A 2011-08-31
© Fujitsu Technology Solutions 2011 Page 25 (48)
Standard load profile "File copy" (random access, 50% read, 50% write, 64 kB block size)
050
100150200250300350400450
1248163264
SATA 2.5” 160 GB 118138174182180179182
SATA 2.5” 500 GB 135167198219215227220
SATA 2.5” 1 TB 158201233264268271269
SATA 3.5” 250 GB 113127132137137137139
SATA 3.5” 500 GB 118132155184186185184
SATA 3.5” 1 TB 117130152183181181182
SATA 3.5” 2 TB 189220258289284284284
SAS 2.5” 146 GB 193242277316343385385
SAS 2.5” 300 GB 206260313362400406407
SAS 2.5” 450 GB 197257325372401403401
SAS 2.5” 600 GB 195262322373407405408
Transactions[IO/s]
0
100
200
300
400
500
1248163264
SAS 2.5” 600 GB 5.17.612.421.439.379.0156.8
SAS 2.5” 450 GB 5.17.812.321.539.979.4159.6
SAS 2.5” 300 GB 4.97.712.822.140.078.8157.3
SAS 2.5” 146 GB 5.28.314.425.346.683.2166.0
SATA 3.5” 2 TB 5.39.115.527.756.3112.8225.0
SATA 3.5” 1 TB 8.615.426.443.888.5176.6351.7
SATA 3.5” 500 GB 8.515.125.843.486.2173.2347.2
SATA 3.5” 250 GB 8.815.730.258.3116.5233.3461.2
SATA 2.5” 1 TB 6.310.017.230.359.7118.0238.2
SATA 2.5” 500 GB 7.412.020.236.674.4140.9290.7
SATA 2.5” 160 GB 8.514.523.044.088.7178.6351.1
Latency[ms]
Outstanding IO
Outstanding IO
bett
er
bett
er

WHITE PAPER SINGLE DISK PERFORMANCE 1.0A 2011-08-31
Page 26 (48) © Fujitsu Technology Solutions 2011
Standard load profile "Streaming" (sequential access, 100% read, 64 kB block size)
0
30
60
90
120
150
124
SATA 2.5” 160 GB 89.0688.9889.13
SATA 2.5” 500 GB 111.13111.16111.20
SATA 2.5” 1 TB 110.58110.58110.68
SATA 3.5” 250 GB 112.37112.38112.42
SATA 3.5” 500 GB 112.01125.86124.83
SATA 3.5” 1 TB 112.07126.16126.28
SATA 3.5” 2 TB 143.07143.11143.15
SAS 2.5” 146 GB 124.77124.82124.77
SAS 2.5” 300 GB 121.74121.77121.70
SAS 2.5” 450 GB 129.98133.71133.74
SAS 2.5” 600 GB 131.33136.18136.18
Throughput[MB/s]
0.0
0.5
1.0
1.5
2.0
2.5
3.0
124
SAS 2.5” 600 GB 0.50.91.8
SAS 2.5” 450 GB 0.50.91.9
SAS 2.5” 300 GB 0.51.02.1
SAS 2.5” 146 GB 0.51.02.0
SATA 3.5” 2 TB 0.40.91.7
SATA 3.5” 1 TB 0.61.02.0
SATA 3.5” 500 GB 0.61.02.0
SATA 3.5” 250 GB 0.61.12.2
SATA 2.5” 1 TB 0.61.12.3
SATA 2.5” 500 GB 0.61.12.2
SATA 2.5” 160 GB 0.71.42.8
Latency[ms]
Outstanding IO
Outstanding IO
bett
er
bett
er

WHITE PAPER SINGLE DISK PERFORMANCE VERSION: 1.0A 2011-08-31
© Fujitsu Technology Solutions 2011 Page 27 (48)
Standard load profile "Restore" (sequential access, 100% write, 64 kB block size)
0
30
60
90
120
150
124
SATA 2.5” 160 GB 88.2388.0488.04
SATA 2.5” 500 GB 110.43110.72110.38
SATA 2.5” 1 TB 109.43110.23110.35
SATA 3.5” 250 GB 110.61111.33111.78
SATA 3.5” 500 GB 103.36117.48118.33
SATA 3.5” 1 TB 103.30117.27118.14
SATA 3.5” 2 TB 142.53142.57142.78
SAS 2.5” 146 GB 124.42124.44124.63
SAS 2.5” 300 GB 121.32121.34121.46
SAS 2.5” 450 GB 133.54133.57133.56
SAS 2.5” 600 GB 135.93135.98136.01
Throughput[MB/s]
0.0
0.5
1.0
1.5
2.0
2.5
3.0
124
SAS 2.5” 600 GB 0.50.91.8
SAS 2.5” 450 GB 0.50.91.9
SAS 2.5” 300 GB 0.51.02.1
SAS 2.5” 146 GB 0.51.02.0
SATA 3.5” 2 TB 0.40.91.8
SATA 3.5” 1 TB 0.61.12.1
SATA 3.5” 500 GB 0.61.12.1
SATA 3.5” 250 GB 0.61.12.2
SATA 2.5” 1 TB 0.61.12.3
SATA 2.5” 500 GB 0.61.12.3
SATA 2.5” 160 GB 0.71.42.8
Latency[ms]
Outstanding IO
Outstanding IO
bett
er
bett
er

WHITE PAPER SINGLE DISK PERFORMANCE 1.0A 2011-08-31
Page 28 (48) © Fujitsu Technology Solutions 2011
Hard disks of the EP class
The following ten diagrams show performance values (transactions, throughput rates and response times) for the standard load profiles "File server", "Database", "File copy", "Streaming" and "Restore" with increasing loads through the number of parallel requests (outstanding IO). The following actual hard disks are considered
EP HDD SAS 6 Gbit/s 2.5 15000 rpm 73 GB
EP HDD SAS 6 Gbit/s 2.5 15000 rpm 146 GB
EP HDD SAS 6 Gbit/s 3.5 15000 rpm 146 GB
EP HDD SAS 6 Gbit/s 3.5 15000 rpm 300 GB
EP HDD SAS 6 Gbit/s 3.5 15000 rpm 450 GB
EP HDD SAS 6 Gbit/s 3.5 15000 rpm 600 GB
EP SSD SATA 3 Gbit/s 2.5 32 GB
EP SSD SATA 3 Gbit/s 2.5 64 GB
Standard load profile "Database" (random access, 67% read, 33% write, 8 kB block size)
0
2000
4000
6000
8000
10000
12481632
HDD SAS 2.5” 73 GB 236286343408467505
HDD SAS 2.5” 146 GB 258335406489551589
HDD SAS 3.5” 146 GB 232273336410481539
HDD SAS 3.5” 300 GB 268346429516592617
HDD SAS 3.5” 450 GB 281371468553641669
HDD SAS 3.5” 600 GB 284382470557624632
SSD SATA 2.5" 32 GB 334346716305789881987783
SSD SATA 2.5" 64 GB 315346336279808380777754
Transactions [IO/s]
010203040506070
12481632
SSD SATA 2.5" 64 GB 0.30.40.61.02.04.1
SSD SATA 2.5" 32 GB 0.30.40.61.02.04.1
HDD SAS 3.5” 600 GB 3.55.28.514.425.650.6
HDD SAS 3.5” 450 GB 3.65.48.514.525.047.9
HDD SAS 3.5” 300 GB 3.75.89.315.527.051.9
HDD SAS 3.5” 146 GB 4.37.311.919.533.259.4
HDD SAS 2.5” 146 GB 3.96.09.916.329.054.3
HDD SAS 2.5” 73 GB 4.27.011.719.634.363.3
Latency[ms]
Outstanding IO
Outstanding IO
bett
er
bett
er

WHITE PAPER SINGLE DISK PERFORMANCE VERSION: 1.0A 2011-08-31
© Fujitsu Technology Solutions 2011 Page 29 (48)
Standard load profile "File server" (random access, 67% read, 33% write, 64 kB block size)
0
500
1000
1500
2000
2500
12481632
HDD SAS 2.5” 73 GB 213255294345398433
HDD SAS 2.5” 146 GB 234286344395443470
HDD SAS 3.5” 146 GB 203235282332386424
HDD SAS 3.5” 300 GB 243306372445496519
HDD SAS 3.5” 450 GB 254325403472528550
HDD SAS 3.5” 600 GB 267340419483546552
SSD SATA 2.5" 32 GB 130715661543151015441504
SSD SATA 2.5" 64 GB 139117701928202320151990
Transactions [IO/s]
0
20
40
60
80
12481632
SSD SATA 2.5" 64 GB 0.71.12.14.07.916.1
SSD SATA 2.5" 32 GB 0.81.32.65.310.421.3
HDD SAS 3.5” 600 GB 3.75.99.616.629.358.0
HDD SAS 3.5” 450 GB 3.96.19.917.030.358.1
HDD SAS 3.5” 300 GB 4.16.510.718.032.261.7
HDD SAS 3.5” 146 GB 4.98.514.224.141.475.4
HDD SAS 2.5” 146 GB 4.37.011.620.336.268.1
HDD SAS 2.5” 73 GB 4.77.913.623.240.273.9
Latency[ms]
Outstanding IO
Outstanding IO
bett
er
bett
er

WHITE PAPER SINGLE DISK PERFORMANCE 1.0A 2011-08-31
Page 30 (48) © Fujitsu Technology Solutions 2011
Standard load profile "File copy" (random access, 50% read, 50% write, 64 kB block size)
0
400
800
1200
1600
1248163264
HDD SAS 2.5” 73 GB 214265305356407412415
HDD SAS 2.5” 146 GB 248308353415446454447
HDD SAS 3.5” 146 GB 211250297348397418414
HDD SAS 3.5” 300 GB 259330402464493491491
HDD SAS 3.5” 450 GB 274348432481518516514
HDD SAS 3.5” 600 GB 286369443508543541534
SSD SATA 2.5" 32 GB 1014124511591145113611321137
SSD SATA 2.5" 64 GB 1331158015521564156115571555
Transactions [IO/s]
0
40
80
120
160
1248163264
SSD SATA 2.5" 64 GB 0.81.32.65.110.220.541.2
SSD SATA 2.5" 32 GB 1.01.63.57.014.128.356.3
HDD SAS 3.5” 600 GB 3.55.49.015.729.459.2119.8
HDD SAS 3.5” 450 GB 3.75.79.316.630.962.0124.4
HDD SAS 3.5” 300 GB 3.96.110.017.332.565.1130.3
HDD SAS 3.5” 146 GB 4.78.013.523.040.376.6154.5
HDD SAS 2.5” 146 GB 4.06.511.319.335.970.5143.3
HDD SAS 2.5” 73 GB 4.77.613.122.539.477.7154.3
Latency[ms]
Outstanding IO
Outstanding IO
bett
er
bett
er

WHITE PAPER SINGLE DISK PERFORMANCE VERSION: 1.0A 2011-08-31
© Fujitsu Technology Solutions 2011 Page 31 (48)
Standard load profile "Streaming" (sequential access, 100% read, 64 kB block size)
0
50
100
150
200
250
300
1248
HDD SAS 2.5” 73 GB 150.58150.60150.60150.60
HDD SAS 2.5” 146 GB 155.02155.00155.04154.95
HDD SAS 3.5” 146 GB 119.24119.29119.27119.30
HDD SAS 3.5” 300 GB 175.13196.23196.28196.20
HDD SAS 3.5” 450 GB 175.13195.12195.18195.10
HDD SAS 3.5” 600 GB 175.15200.15200.15200.15
SSD SATA 2.5" 32 GB 191.74211.07216.02217.72
SSD SATA 2.5" 64 GB 197.53226.40252.24257.20
Throughput [MB/s]
0
1
2
3
4
5
1248
SSD SATA 2.5" 64 GB 0.30.61.01.9
SSD SATA 2.5" 32 GB 0.30.61.22.3
HDD SAS 3.5” 600 GB 0.40.61.22.5
HDD SAS 3.5” 450 GB 0.40.61.32.6
HDD SAS 3.5” 300 GB 0.40.61.32.5
HDD SAS 3.5” 146 GB 0.51.02.14.2
HDD SAS 2.5” 146 GB 0.40.81.63.2
HDD SAS 2.5” 73 GB 0.40.81.73.3
Latency[ms]
Outstanding IO
Outstanding IO
bett
er
bett
er

WHITE PAPER SINGLE DISK PERFORMANCE 1.0A 2011-08-31
Page 32 (48) © Fujitsu Technology Solutions 2011
Standard load profile "Restore" (sequential access, 100% write, 64 kB block size)
0
50
100
150
200
124
HDD SAS 2.5” 73 GB 150.33150.31150.44
HDD SAS 2.5” 146 GB 154.59154.49154.71
HDD SAS 3.5” 146 GB 113.10113.88113.65
HDD SAS 3.5” 300 GB 195.41194.65194.60
HDD SAS 3.5” 450 GB 191.62191.28191.65
HDD SAS 3.5” 600 GB 195.04195.32195.99
SSD SATA 2.5" 32 GB 167.17189.16189.19
SSD SATA 2.5" 64 GB 163.12187.30188.00
Throughput [MB/s]
0.0
0.5
1.0
1.5
2.0
2.5
124
SSD SATA 2.5" 64 GB 0.40.71.3
SSD SATA 2.5" 32 GB 0.40.71.3
HDD SAS 3.5” 600 GB 0.30.61.3
HDD SAS 3.5” 450 GB 0.30.71.3
HDD SAS 3.5” 300 GB 0.30.61.3
HDD SAS 3.5” 146 GB 0.61.12.2
HDD SAS 2.5” 146 GB 0.40.81.6
HDD SAS 2.5” 73 GB 0.40.81.7
Latency[ms]
Outstanding IO
Outstanding IO
bett
er
bett
er

WHITE PAPER SINGLE DISK PERFORMANCE VERSION: 1.0A 2011-08-31
© Fujitsu Technology Solutions 2011 Page 33 (48)
Performance data in comparison
The individual hard disk features, which are significant for the influence on their performance, are handled below. One of these features is a switchable parameter: the enabling/disabling of the disk cache has a great impact on hard disk performance and simultaneously touches upon security aspects that have to be observed when configuring a server. The three other hard disk features "form factor", "rotational speed" and "capacity" must be taken into account when selecting the suitable hard disk for a specific server and do not only have an impact on server performance. They are of central importance when it comes to server sizing.
Server sizing
The minimum requirements for the total capacity must first be observed when selecting a server and its hard disks. Especially the number of hard disks that can be installed in a server plays a role here and also in relation to the individual hard disk
form factor rotational speed capacity
The following table provides an overview of the PRIMERGY servers that are available today and their
expandability with hard disks (form factor 2.5 hard disks or 3.5 hard disks) and the maximum total capacity achievable:
Server blades Maximum
configuration 3.5
Maximum
overall capacity 3.5
Maximum configuration
2.5
Maximum
overall capacity 2.5
PRIMERGY BX620 S6 2 SAS: 1.2 TB
SATA: 2 TB
PRIMERGY BX920 S2 2 SAS: 1.2 TB
SATA: 2 TB
PRIMERGY BX922 S2 2 SATA: 0.3 TB
PRIMERGY BX924 S2 2 SATA: 0.1 TB
PRIMERGY BX960 S1 2 SATA: 0.1 TB
Storage blades Maximum
configuration 3.5
Maximum
overall capacity 3.5
Maximum configuration
2.5
Maximum
overall capacity 2.5
PRIMERGY SX650 5 SAS: 1.5 TB
SATA: 5 TB
PRIMERGY SX940 S1 4 SAS: 2.4 TB
SATA: 4 TB
PRIMERGY SX960 S1 10 SAS: 6 TB
SATA: 10 TB
Scale-out servers Maximum
configuration 3.5
Maximum
overall capacity 3.5
Maximum configuration
2.5
Maximum
overall capacity 2.5
PRIMERGY CX120 S1 2 SATA: 1 TB
PRIMERGY CX122 S1 2 SATA: 1 TB

WHITE PAPER SINGLE DISK PERFORMANCE 1.0A 2011-08-31
Page 34 (48) © Fujitsu Technology Solutions 2011
Rack servers Maximum
configuration 3.5
Maximum
overall capacity 3.5
Maximum configuration
2.5
Maximum
overall capacity 2.5
PRIMERGY RX100 S6 2 SAS: 1.2 TB SATA: 4 TB
4 SAS: 2.4 TB SATA: 4 TB
PRIMERGY RX100 S7 2 SAS: 1.2 TB SATA: 4 TB
4 SAS: 2.4 TB SATA: 4 TB
PRIMERGY RX200 S6 8 SAS: 4.8 TB SATA: 8 TB
PRIMERGY RX300 S6 6 SAS: 3.6 TB SATA: 12 TB
12 SAS: 7.2 TB SATA: 12 TB
PRIMERGY RX600 S5 8 SAS: 4.8 TB SATA: 8 TB
PRIMERGY RX600 S6 8 SAS: 4.8 TB SATA: 0.5 TB
PRIMERGY RX900 S1 8 SAS: 4.8 TB SATA: 0.5 TB
PRIMERGY RX900 S2 8 SAS: 4.8 TB SATA: 0.5 TB
Tower servers Maximum
configuration 3.5
Maximum
overall capacity 3.5
Maximum configuration
2.5
Maximum
overall capacity 2.5
PRIMERGY TX100 S2 4 SATA: 8 TB
PRIMERGY TX120 S3 2 SATA: 4 TB 4 SAS: 2.4 TB SATA: 4 TB
PRIMERGY TX140 S1 4 SAS: 2.4 TB SATA: 8 TB
8 SAS: 4.8 TB SATA: 8 TB
PRIMERGY TX150 S7 4 SAS: 2.4 TB SATA: 8 TB
8 SAS: 4.8 TB SATA: 8 TB
PRIMERGY TX200 S6 6 SAS: 3.6 TB SATA: 12 TB
16 SAS: 9.2 TB SATA: 16 TB
PRIMERGY TX300 S6 8 SAS: 4.8 TB SATA: 16 TB
20 SAS: 12 TBSATA : 20 TB
The maximum total capacity can be achieved with the 2.5 hard disk "BC HDD SATA 3 Gbit/s 2.5 7200 rpm 1 TB" with the PRIMERGY TX200 S6 and the PRIMERGY TX300 S6. With the other servers the maximum
total capacity is equally high with 2.5 and 3.5 hard disks. When using hard disks with a SAS interface, the
maximum total capacity can be achieved with the 2.5 hard disk "BC HDD SAS 6 Gbit/s 2.5 10000 rpm 600 GB".
Up to twelve hard disks can be connected to a single controller in the PRIMERGY TX200 S6 and the PRIMERGY TX300 S6. A second controller is required for further hard disks.

WHITE PAPER SINGLE DISK PERFORMANCE VERSION: 1.0A 2011-08-31
© Fujitsu Technology Solutions 2011 Page 35 (48)
Form factor
The hard disks with a 3.5 form factor were widely used in servers for a long time. Compared with the 2.5 hard disks, they offered higher capacity and/or better performance over a long period. Today, this only applies with regard to the capacity of SATA hard disks, and now differs from case to case as far as performance is concerned.
The advantages of 2.5 hard disks are lower power consumption, less heat generation and less space
required. As more 2.5 hard disks can be housed in a server than 3.5 hard disks, the capacity and performance differences are relativized in RAID arrays. The RAID performance of a server which is fully
configured with 2.5 hard disks is higher than a server fully configured with 3.5 hard disks. Furthermore, the
same high total capacity levels can be achieved in all PRIMERGY servers with 2.5 hard disks and with 3.5 SAS hard disks. And there are even considerably higher total capacity levels in some servers.
The following ten diagrams show performance values (transactions, throughput rates and response times) for the standard load profiles "File server", "Database", "File copy", "Streaming" and "Restore" with increasing loads through the number of parallel requests (outstanding IO). The following actual hard disks are considered
BC HDD SATA 3 Gbit/s 2.5 7200 rpm 500 GB
BC HDD SATA 3 Gbit/s 3.5 7200 rpm 500 GB
Standard load profile "Database" (random access, 67% read, 33% write, 8 kB block size)
Standard load profile "File server" (random access, 67% read, 33% write, 64 kB block size)
Standard load profile "File copy" (random access, 50% read, 50% write, 64 kB block size)
050
100150200250
124816
3.5" 118136159190188
2.5" 132161202235229
Transactions[IO/s]
0
25
50
75
100
124816
2.5" 7.612.419.834.169.8
3.5" 8.514.725.242.085.1
Latency [ms]
050
100150200250
124816
3.5" 111126147172174
2.5" 122147180205204
Transactions[IO/s]
0
25
50
75
100
124816
2.5" 8.213.622.239.178.4
3.5" 9.015.927.246.592.0
Latency [ms]
050
100150200250
124816
3.5" 118132155184186
2.5" 135167198219215
Transactions[IO/s]
0
25
50
75
100
124816
2.5" 7.412.020.236.674.4
3.5" 8.515.125.843.486.2
Latency [ms]
Outstanding IO Outstanding IO
Outstanding IO Outstanding IO
Outstanding IO Outstanding IO
bett
er
bett
er
bett
er
bett
er
bett
er
bett
er

WHITE PAPER SINGLE DISK PERFORMANCE 1.0A 2011-08-31
Page 36 (48) © Fujitsu Technology Solutions 2011
Standard load profile "Streaming" (sequential access, 100% read, 64 kB block size)
Standard load profile "Restore" (sequential access, 100% write, 64 kB block size)
Whereas the 3.5 hard disk with the standard load profiles and with sequential access provides a higher
throughput than the 2.5 hard disk, the 2.5 hard disk with standard load profiles and with random access is at the forefront. However, this example cannot be generalized.
Rotational speed
In contrast to SSDs, data is saved to rotating disks with conventional hard disks. These revolve at a constant speed. The number of revolutions is normally not specified in the international SI system unit of 1/s, but in the English unit rpm for "revolutions per minute".
In high-performance scenarios either SSDs or hard disks with a rotational speed of 15000 rpm are used for servers. Hard disks with 10000 or 7200 rpm are used in the middle of the range performance segment. Where performance only plays a subordinate role or even no role at all, hard disks with 7200 rpm or even with only 5400 rpm can be used.
The faster the rotational speed of a hard disk, the higher its power consumption and thus also its heat generation, which means higher requirements for the cooling mechanisms in the server. Another aspect that has to be observed is the hard disk vibration that accompanies the rotation. As hard disks with different rotational speeds can disrupt each other, all the hard disks that are located in a common hard disk cage should be of the same type.
If one of the two hard disk types has a 50% higher rotational speed, this does not mean that all performance values are 50% higher. There are several reasons for this. On the one hand the two hard disk types can differ in the number of sectors per track, which has an effect on the amount of data that can be processed per revolution. It is typical for current 10000 rpm hard disks to be offered with higher capacities than the current 15000 rpm hard disks. This difference usually reduces the advantage of the higher revolution speed of the faster disk. On the other hand, the response time for a hard disk access does not only comprise the rotation-defined latency time, but also includes additional components, such as the relevant "track-to-track seek time" of random accesses.
Due to the constant technical development of hard disks the change to a newer hard disk generation can provide better performance, i.e. a modern hard disk with 10000 rpm can be faster than an older hard disk with 15000 rpm.
0
50
100
150
124
2.5" 111.13111.16111.20
3.5" 112.01125.86124.83
Throughput[MB/s]
0
1
2
3
124
3.5" 0.61.02.0
2.5" 0.61.12.2
Latency [ms]
0
50
100
150
124
2.5" 110.43110.72110.38
3.5" 103.36117.48118.33
Throughput[MB/s]
0
1
2
3
124
3.5" 0.61.12.1
2.5" 0.61.12.3
Latency [ms]
Outstanding IO Outstanding IO
Outstanding IO Outstanding IO
bett
er
bett
er
bett
er
bett
er

WHITE PAPER SINGLE DISK PERFORMANCE VERSION: 1.0A 2011-08-31
© Fujitsu Technology Solutions 2011 Page 37 (48)
The influence of the rotational speed on performance is now to be explained on the basis of two hard disk types, whose order-relevant technical data only differs in this aspect. The hard disk cache was enabled.
BC HDD SAS 6 Gbit/s 2.5 10000 rpm 146 GB
EP HDD SAS 6 Gbit/s 2.5 15000 rpm 146 GB
Standard load profile "Database" (random access, 67% read, 33% write, 8 kB block size)
With the random load profile "Database" the faster rotating hard disk for low workload intensities (1 outstanding IO) has a performance advantage of 32%. The advantage is reduced to 20% for higher load intensities (32 outstanding IOs).
Standard load profile "File server" (random access, 67% read, 33% write, 64 kB block size)
With the random load profile "File Server" the faster rotating hard disk for low load intensities (1 outstanding IO) has a performance advantage of 31%. The advantage is reduced to 23% for higher load intensities (32 outstanding IOs).
Standard load profile "File copy" (random access, 50% read, 50% write, 64 kB block size)
With the random load profile "File copy", the faster rotating hard disk for lower load intensities (1 outstanding IO) has a performance advantage of 28%. The advantage is reduced to 18% for higher load intensities (32 outstanding IOs).
0100200300400500600
12481632
10000 195256315378440492
15000 258335406489551589
Transactions[IO/s]
0
25
50
75
12481632
15000 3.96.09.9162954
10000 5.17.813213665
Latency [ms]
0100200300400500
12481632
10000 179227265315362382
15000 234286344395443470
Transactions[IO/s]
0
25
50
75
100
12481632
15000 4.37.012203668
10000 5.68.815254484
Latency [ms]
0100200300400500
12481632
10000 193242277316343385
15000 248308353415446454
Transactions[IO/s]
0
25
50
75
100
12481632
15000 4.06.511193671
10000 5.28.314254783
Latency [ms]
Outstanding IO Outstanding IO
Outstanding IO Outstanding IO
Outstanding IO Outstanding IO
bett
er
bett
er
bett
er
bett
er
bett
er
bett
er

WHITE PAPER SINGLE DISK PERFORMANCE 1.0A 2011-08-31
Page 38 (48) © Fujitsu Technology Solutions 2011
Standard load profile "Streaming" (sequential access, 100% read, 64 kB block size)
With the sequential load profile "Streaming" the faster rotating hard disk remains very consistent with 24% more performance than the more slowly rotating hard disk.
Standard load profile "Restore" (sequential access, 100% write, 64 kB block size)
With the sequential load profile "Restore" the faster rotating hard disk remains very consistent with 24% more performance than the more slowly rotating hard disk.
The time required to reposition the read/write head is important for performance with random load profiles, as it takes place frequently. The time required to reposition only plays a comparably minor role with sequential load profiles. The decisive factors here are the rotational speed and the number of sectors per track. It is therefore no wonder that the two sequential load profiles show a very constant performance difference here, whereas the advantages of the faster rotating hard disk with the three random load profiles vary more, depending on the type of load profile and the load intensity, but remain on average within the same dimension.
The example makes no claim to universal validity, but is certainly not untypical. In individual cases, it depends on the exact technical features of two hard disk types that are to be compared.
0
50
100
150
200
124
10000 124.77124.82124.77
15000 155.02155.00155.04
Throughput[MB/s]
0
1
2
3
124
15000 0.40.81.6
10000 0.51.02.0
Latency [ms]
0
50
100
150
200
124
10000 124.42124.44124.63
15000 154.59154.49154.71
Throughput[MB/s]
0
1
2
3
124
15000 0.40.81.6
10000 0.51.02.0
Latency [ms]
Outstanding IO Outstanding IO
Outstanding IO Outstanding IO
bett
er
bett
er
bett
er
bett
er

WHITE PAPER SINGLE DISK PERFORMANCE VERSION: 1.0A 2011-08-31
© Fujitsu Technology Solutions 2011 Page 39 (48)
Capacity
One of the main criteria when selecting the appropriate hard disk is its capacity. 2.5 SATA-HDDs are
offered with a capacity of up to 1 TB, 3.5 SATA-HDDs with up to 2 TB. SAS-HDDs have capacities of up to 600 GB. SATA-SSDs currently have a maximum capacity of 64 GB.
The following ten diagrams show performance values (transactions, throughput rates and response times) for the standard load profiles "File server", "Database", "File copy", "Streaming" and "Restore" with increasing loads through the number of parallel requests (outstanding IO). The following actual hard disks are considered
BC HDD SATA 3 Gbit/s 3.5 7200 rpm 250 GB
BC HDD SATA 3 Gbit/s 3.5 7200 rpm 500 GB
BC HDD SATA 3 Gbit/s 3.5 7200 rpm 1 TB
BC HDD SATA 3 Gbit/s 3.5 7200 rpm 2 TB
Standard load profile "Database" (random access, 67% read, 33% write, 8 kB block size)
Standard load profile "File server" (random access, 67% read, 33% write, 64 kB block size)
Standard load profile "File copy" (random access, 50% read, 50% write, 64 kB block size)
0100200300400
124816
250 GB 112119122136133
500 GB 118136159190188
1000 GB 117133155185186
2000 GB 188226267312316
Transactions[IO/s]
0
50
100
150
124816
2000 GB 5.38.915.025.750.7
1000 GB 8.515.025.843.386.0
500 GB 8.514.725.242.085.1
250 GB 9.016.932.758.8120.5
Latency [ms]
0
100
200
300
124816
250 GB 105113119126123
500 GB 111126147172174
1000 GB 111124143173168
2000 GB 171198240273273
Transactions[IO/s]
0
50
100
150
124816
2000 GB 5.910.116.629.358.5
1000 GB 9.016.128.146.395.4
500 GB 9.015.927.246.592.0
250 GB 9.617.733.763.2129.8
Latency [ms]
0
100
200
300
124816
250 GB 113127132137137
500 GB 118132155184186
1000 GB 117130152183181
2000 GB 189220258289284
Transactions[IO/s]
0
50
100
150
124816
2000 GB 5.39.115.527.756.3
1000 GB 8.615.426.443.888.5
500 GB 8.515.125.843.486.2
250 GB 8.815.730.258.3116.5
Latency [ms]
Outstanding IO Outstanding IO
bett
er
bett
er
bett
er
bett
er
Outstanding IO Outstanding IO
bett
er
bett
er
Outstanding IO Outstanding IO
WHITE PAPER SINGLE DISK PERFORMANCE 1.0A 2011-08-31
Page 40 (48) © Fujitsu Technology Solutions 2011
Standard load profile "Streaming" (sequential access, 100% read, 64 kB block size)
Standard load profile "Restore" (sequential access, 100% write, 64 kB block size)
The following ten diagrams show performance values (transactions, throughput rates and response times) for the standard load profiles "File server", "Database", "File copy", "Streaming" and "Restore" with increasing loads through the number of parallel requests (outstanding IO). The following actual hard disks are considered
EP HDD SAS 6 Gbit/s 3.5 15000 rpm 300 GB
EP HDD SAS 6 Gbit/s 3.5 15000 rpm 450 GB
EP HDD SAS 6 Gbit/s 3.5 15000 rpm 600 GB
Standard load profile "Database" (random access, 67% read, 33% write, 8 kB block size)
0
50
100
150
124
250 GB 112.37112.38112.42
500 GB 112.01125.86124.83
1000 GB 112.07126.16126.28
2000 GB 143.07143.11143.15
Throughput[MB/s]
0.00.51.01.52.02.5
124
2000 GB 0.40.91.7
1000 GB 0.61.02.0
500 GB 0.61.02.0
250 GB 0.61.12.2
Latency [ms]
0
50
100
150
124
250 GB 110.61111.33111.78
500 GB 103.36117.48118.33
1000 GB 103.30117.27118.14
2000 GB 142.53142.57142.78
Throughput[MB/s]
0.00.51.01.52.02.5
124
2000 GB 0.40.91.8
1000 GB 0.61.12.1
500 GB 0.61.12.1
250 GB 0.61.12.2
Latency [ms]
0
250
500
750
12481632
300 GB 268346429516592617
450 GB 281371468553641669
600 GB 284382470557624632
Transactions[IO/s]
0
20
40
60
12481632
600 GB 3.55.28.514.425.650.6
450 GB 3.65.48.514.525.047.9
300 GB 3.75.89.315.527.051.9
Latency [ms]
bett
er
bett
er
bett
er
bett
er
Outstanding IO Outstanding IO
Outstanding IO Outstanding IO
Outstanding IO Outstanding IO
bett
er
bett
er

WHITE PAPER SINGLE DISK PERFORMANCE VERSION: 1.0A 2011-08-31
© Fujitsu Technology Solutions 2011 Page 41 (48)
Standard load profile "File server" (random access, 67% read, 33% write, 64 kB block size)
Standard load profile "File copy" (random access, 50% read, 50% write, 64 kB block size)
Standard load profile "Streaming" (sequential access, 100% read, 64 kB block size)
Standard load profile "Restore" (sequential access, 100% write, 64 kB block size)
0
200
400
600
12481632
300 GB 243306372445496519
450 GB 254325403472528550
600 GB 267340419483546552
Transactions[IO/s]
0
20
4060
80
12481632
600 GB 3.75.99.616.629.358.0
450 GB 3.96.19.917.030.358.1
300 GB 4.16.510.718.032.261.7
Latency [ms]
0
200
400
600
12481632
300 GB 259330402464493491
450 GB 274348432481518516
600 GB 286369443508543541
Transactions[IO/s]
0
20
40
60
80
12481632
600 GB 3.55.49.015.729.459.2
450 GB 3.75.79.316.630.962.0
300 GB 3.96.110.017.332.565.1
Latency [ms]
0
50
100
150
200
250
124
300 GB 175.13196.23196.28
450 GB 175.13195.12195.18
600 GB 175.15200.15200.15
Throughput[MB/s]
0.0
0.5
1.0
1.5
124
600 GB 0.40.61.2
450 GB 0.40.61.3
300 GB 0.40.61.3
Latency [ms]
0
50
100
150
200
12
300 GB 195.41194.65
450 GB 191.62191.28
600 GB 195.04195.32
Throughput[MB/s]
0.0
0.2
0.4
0.6
0.8
12
600 GB 0.30.6
450 GB 0.30.7
300 GB 0.30.6
Latency [ms]
Outstanding IO Outstanding IO
Outstanding IO Outstanding IO
Outstanding IO Outstanding IO
Outstanding IO Outstanding IO
bett
er
bett
er
bett
er
bett
er
bett
er
bett
er
bett
er
bett
er

WHITE PAPER SINGLE DISK PERFORMANCE 1.0A 2011-08-31
Page 42 (48) © Fujitsu Technology Solutions 2011
The following ten diagrams show performance values (transactions, throughput rates and response times) for the standard load profiles "File server", "Database", "File copy", "Streaming" and "Restore" with increasing loads through the number of parallel requests (outstanding IO). The following actual hard disks are considered
EP SSD SATA 3 Gbit/s 2.5 32 GB
EP SSD SATA 3 Gbit/s 2.5 64 GB
Standard load profile "Database" (random access, 67% read, 33% write, 8 kB block size)
Standard load profile "File server" (random access, 67% read, 33% write, 64 kB block size)
Standard load profile "File copy" (random access, 50% read, 50% write, 64 kB block size)
02000400060008000
10000
124816
32 GB 33434671630578988198
64 GB 31534633627980838077
Transactions[IO/s]
0.0
0.5
1.0
1.5
2.0
124816
64 GB 0.30.40.61.02.0
32 GB 0.30.40.61.02.0
Latency [ms]
0
500
1000
1500
2000
2500
1248
32 GB 1307156615431510
64 GB 1391177019282023
Transactions[IO/s]
0123456
1248
64 GB 0.71.12.14.0
32 GB 0.81.32.65.3
Latency [ms]
0
500
1000
1500
2000
124
32 GB 101412451159
64 GB 133115801552
Transactions[IO/s]
0
1
2
3
4
124
64 GB 0.81.32.6
32 GB 1.01.63.5
Latency [ms]
Outstanding IO Outstanding IO
Outstanding IO Outstanding IO
Outstanding IO Outstanding IO
bett
er
bett
er
bett
er
bett
er
bett
er
bett
er

WHITE PAPER SINGLE DISK PERFORMANCE VERSION: 1.0A 2011-08-31
© Fujitsu Technology Solutions 2011 Page 43 (48)
Standard load profile "Streaming" (sequential access, 100% read, 64 kB block size)
Standard load profile "Restore" (sequential access, 100% write, 64 kB block size)
Conclusion of the review on capacity:
Of two hard disks that only differ in their capacity, the one with the higher capacity also often offers a somewhat higher performance. However, hard disks are not organized into RAID arrays just for security reasons. From a performance point of view, it is also best for the required total capacity to be distributed over as many hard disks as possible. In general, this also applies if the one with less capacity is the one with less performance. This performance disadvantage is more than compensated by the performance advantage associated with the larger number of hard disks in the RAID array.
0
100
200
300
1248
32 GB 191.74211.07216.02217.72
64 GB 197.53226.40252.24257.20
Throughput[MB/s]
0
1
2
3
1248
64 GB 0.30.61.01.9
32 GB 0.30.61.22.3
Latency [ms]
0
100
200
300
124
32 GB 167.17189.16189.19
64 GB 163.12187.30188.00
Throughput[MB/s]
0.0
0.5
1.0
1.5
124
64 GB 0.40.71.3
32 GB 0.40.71.3
Latency [ms]
Outstanding IO Outstanding IO
Outstanding IO Outstanding IO
bett
er
bett
er
bett
er
bett
er

WHITE PAPER SINGLE DISK PERFORMANCE 1.0A 2011-08-31
Page 44 (48) © Fujitsu Technology Solutions 2011
Disk cache
All hard disks, even SSDs, have a cache.
The influence of the cache on performance is achieved by the buffering of data. Write requests are temporarily stored in the hard disk cache, because their processing is generally not as time-critical as that of read requests that the requesting application is waiting for. This also applies analogously for solid state drives.
The influence of the hard disk cache on disk I/O performance is quite high. Unfortunately, this is frequently seen as a security problem during a power failure and is therefore disabled. On the other hand, it was integrated by hard disk manufacturers for a good reason to increase the write performance. For performance reasons it is particularly advisable to enable the disk cache for the SATA hard disks, which rotate more slowly in comparison with SAS hard disks. The much larger cache for I/O accesses, and therefore a potential security risk for data loss during power failure, is already located in the main memory and administered by the operating system. To prevent data loss, you are recommended to equip the system with a UPS. The hard disk comparison measurements were in each case performed with and without a disk cache.
The following five diagrams deal with the influence of the hard disks cache for the standard load profiles "File server", "Database", "File copy", "Streaming" and "Restore" with increasing load intensity (outstanding IO) in an exemplary way for the hard disks:
ECO HDD SATA 3 Gbit/s 2.5 5400 rpm 320 GB
BC HDD SATA 3 Gbit/s 3.5 7200 rpm 2 TB
BC HDD SAS 6 Gbit/s 2.5 10000 rpm 600 GB
EP HDD SAS 6 Gbit/s 3.5 15000 rpm 600 GB
EP SSD SATA 3 Gbit/s 2.5 64 GB
The respective performance growth of a hard disk with an enabled cache is shown in comparison with a hard disk with the cache disabled. The growth of the throughput corresponds to the growth of the transaction rate. The reduction in the average response time is proportional to the increase in the transaction rate. Measurement accuracy is approximately 95%.
Standard load profile "Database" (random access, 67% read, 33% write, 8 kB block size)
A 15% to 25% higher transaction rate can be achieved with an enabled cache with SATA-HDDs. With SAS-HDDs the gain in performance depends on the load intensity. With a medium load it is slightly less than with the SATA-HDDs. With low and very high loads the gain in performance is practically zero. The strongest effect is obtained when the cache is enabled for the SATA-SSD. The growth of the transaction rate increases by up to 175%.
0%
25%
50%
75%
100%
125%
150%
175%
200%
ECO HDDSATA 3 Gbit/s
2.5” 5400 rpm320 GB
BC HDDSATA 3 Gbit/s
3.5” 7200 rpm2 TB
BC HDDSAS 6 Gbit/s
2.5” 10000 rpm600 GB
EP HDDSAS 6 Gbit/s
3.5” 15000 rpm600 GB
EP SSDSATA 3 Gbit/s
2.5"64 GB
1 2 4 8 16 32 64 128
bett
er
Outstanding IO
Transaction rate increase through enabling the disk cache

WHITE PAPER SINGLE DISK PERFORMANCE VERSION: 1.0A 2011-08-31
© Fujitsu Technology Solutions 2011 Page 45 (48)
Standard load profile "File server" (random access, 67% read, 33% write, 64 kB block size)
With an enabled cache it is possible to achieve an at least 20% higher transaction rate with the BC SATA-HDD. With SAS-HDDs and with the ECO SATA-HDD the gain in performance depends on the load intensity. This is mainly between 5% and 20%. The same performance values with an enabled cache can also only be achieved with a disabled cache under very high loads. The strongest effect is obtained when the cache is enabled for the SATA-SSD. The growth of the transaction rate increases by up to 50%.
Standard load profile "File copy" (random access, 50% read, 50% write, 64 kB block size)
With an enabled cache a 13% to 27% higher transaction rate can be achieved with the ECO SATA-HDD. Growth is even between 31% and 53% with the BC SATA-HDD. With the SAS-HDDs the gain in performance depends on the load intensity. It increases to more than 30% and with very high loads sinks to practically zero. Performance growth is between 12% and 29% with the SATA-SSD.
0%
10%
20%
30%
40%
50%
60%
ECO HDDSATA 3 Gbit/s
2.5” 5400 rpm320 GB
BC HDDSATA 3 Gbit/s
3.5” 7200 rpm2 TB
BC HDDSAS 6 Gbit/s
2.5” 10000 rpm600 GB
EP HDDSAS 6 Gbit/s
3.5” 15000 rpm600 GB
EP SSDSATA 3 Gbit/s
2.5"64 GB
1 2 4 8 16 32 64 128 256 512
0%
10%
20%
30%
40%
50%
60%
ECO HDDSATA 3 Gbit/s
2.5” 5400 rpm320 GB
BC HDDSATA 3 Gbit/s
3.5” 7200 rpm2 TB
BC HDDSAS 6 Gbit/s
2.5” 10000 rpm600 GB
EP HDDSAS 6 Gbit/s
3.5” 15000 rpm600 GB
EP SSDSATA 3 Gbit/s
2.5"64 GB
1 2 4 8 16 32 64 128
bett
er
bett
er
Outstanding IO
Outstanding IO
Transaction rate increase through enabling the disk cache
Transaction rate increase through enabling the disk cache

WHITE PAPER SINGLE DISK PERFORMANCE 1.0A 2011-08-31
Page 46 (48) © Fujitsu Technology Solutions 2011
Standard load profile "Streaming" (sequential access, 100% read, 64 kB block size)
The use of the hard disk cache generally has no advantage here.
Standard load profile "Restore" (sequential access, 100% write, 64 kB block size)
By enabling the cache it is possible to achieve a fourteen-fold increase in throughput with the ECO SATA-HDD. And throughput is at least twice as high with higher loads. With the other HDDs it is possible to greatly increase the throughput by enabling the cache with minor loads. If the load increases, this high throughput is also achieved with a disabled cache. With the SATA-SSD an almost four-fold increase in throughput can be achieved by enabling the cache. And throughput is at least twice as high with higher loads.
0%
1%
2%
3%
4%
5%
ECO HDDSATA 3 Gbit/s
2.5” 5400 rpm320 GB
BC HDDSATA 3 Gbit/s
3.5” 7200 rpm2 TB
BC HDDSAS 6 Gbit/s
2.5” 10000 rpm600 GB
EP HDDSAS 6 Gbit/s
3.5” 15000 rpm600 GB
EP SSDSATA 3 Gbit/s
2.5"64 GB
1 2 4 8
0%
250%
500%
750%
1000%
1250%
1500%
1750%
2000%
ECO HDDSATA 3 Gbit/s
2.5” 5400 rpm320 GB
BC HDDSATA 3 Gbit/s
3.5” 7200 rpm2 TB
BC HDDSAS 6 Gbit/s
2.5” 10000 rpm600 GB
EP HDDSAS 6 Gbit/s
3.5” 15000 rpm600 GB
EP SSDSATA 3 Gbit/s
2.5"64 GB
1 2 4 8 16
bett
er
bett
er
Outstanding IO
Outstanding IO
Throughput increase through enabling the disk cache
Throughput increase through enabling the disk cache

WHITE PAPER SINGLE DISK PERFORMANCE VERSION: 1.0A 2011-08-31
© Fujitsu Technology Solutions 2011 Page 47 (48)
Conclusion
For PRIMERGY servers Fujitsu offers a large number of hard disks with different performance and availability features for all conceivable scenarios - from the small department server that is only needed during working hours up to the high-availability database server. The three defined hard disk classes Economic (ECO), Business-Critical (BC) and Enterprise (EP) provide orientation as to how the individual hard disk types should be classified.
Hard disks of the Economic class (ECO) are the most cost-effective variant. These disks are chosen if performance and fail-safety do not have to meet the highest requirements. They should only be used in non-critical application areas, in which high transaction rates are not to be expected and in which 7×24-hour operation is not necessary. ECO hard disks have a SATA interface and work at a rotational speed of 5400 or 7200 rpm.
Hard disks of the Business-Critical class (BC) are suited for 7×24-hour operation and thus meet the highest requirements for fail-safety. Due to their high capacities the lowest costs per GB are incurred here. BC hard disks either have a SATA interface and work at a rotational speed of 7200 rpm or have a SAS interface and work at a rotational speed of 10000 rpm.
Hard disks of the Enterprise class (EP) offer the best performance and simultaneously meet the highest security requirements. They were specially developed for scenarios, in which the highest requirements for throughput also have to be met under high loads. The EP hard disks include ones with a SAS interface and a rotational speed of 15000 rpm as well as SATA-SSDs.
In addition to this classification, the hard disks differ in their technology (HDD or SSD), in the interface (SAS
or SATA), in the form factor (2.5 or 3.5) and in the rotational speed and capacity. All of these factors play a role if the disk subsystem is to be sized with regard to capacity or performance.
In comparison with conventional hard disks, SSDs stand out for very low access times, mechanical robustness, low noise and very low energy consumption, but still have considerably lower capacity today and a higher price. Especially with random accesses, such as with database applications, SSDs offer a much higher transaction rate than conventional hard disks.
The SAS-HDDs have shorter access times and achieve higher throughputs due to the higher rotational speed of the SAS-HDDs (in comparison with the SATA-HDDs). Furthermore, the standard SAS-2.0 with the 6 Gbit/s interface has in the meantime established itself among the SAS-HDDs. Due to the lower rotational speed of the SATA-HDDs in comparison with the SAS-HDDs, the SATA-HDDs have higher access times and achieve lower throughputs. With SATA the hard disks today are for the most part still connected with the 3 Gbit/s interface. However, the SATA-HDDs offer high capacities right up in the terabyte range and at a very low cost. They are above all suited for use in secondary storage and backup systems.
More hard disks per server are possible thanks to the use of 2.5 hard disks. Depending on the RAID level, this enables higher parallelism to be achieved due to the use of more hard disks in the RAID array and thus a better overall performance.
Depending on the required performance, a decision must be taken as to which hard disk type should be used with which rotational speed. Current SAS hard disks with 15000 rpm offer a better performance of between 20% and 30% than the current SAS-HDDs with 10000 rpm.
Of two hard disks that only differ in their capacity, the one with the higher capacity also often offers a somewhat higher performance. From a performance point of view, it is best for the required total capacity to be distributed over as many hard disks as possible. In general, this also applies if the one with less capacity is the one with less performance. This performance disadvantage is more than compensated by the performance advantage associated with the larger number of hard disks in the RAID array.
To ensure maximum performance it is advisable to enable the hard disk cache, especially with SATA-HDDs. When the hard disk cache is activated we recommend the use of a UPS.

WHITE PAPER SINGLE DISK PERFORMANCE 1.0A 2011-08-31
Page 48 (48) © Fujitsu Technology Solutions 2011
Literature
PRIMERGY Systems
http://ts.fujitsu.com/primergy
PRIMERGY Performance
http://ts.fujitsu.com/products/standard_servers/primergy_bov.html
Basics of Disk I/O Performance
http://docs.ts.fujitsu.com/dl.aspx?id=65781a00-556f-4a98-90a7-7022feacc602
RAID Controller Performance
http://docs.ts.fujitsu.com/dl.aspx?id=ada7c1bf-74e3-4953-b783-839cdeec790b
RAID Performance
http://docs.ts.fujitsu.com/dl.aspx?id=c55404e9-69c6-4d1e-a556-6a322b27da5b
Information about Iometer
http://www.iometer.org
Contact
FUJITSU Technology Solutions
Website: http://ts.fujitsu.com
PRIMERGY Product Marketing
mailto:[email protected]
PRIMERGY Performance and Benchmarks
mailto:[email protected]
All rights reserved, including industrial property rights. Delivery subject to availability; right of technical modifications reserved. No liability or warranty assumed for completeness, validity and accuracy of the specified data and illustrations. Designations may be trademarks and/or copyrights of the respective manufacturer, the use of which by third parties for their own purposes may infringe the rights of such owners. Further details are available under http://ts.fujitsu.com/terms_of_use.html
2011-08-31 WW EN Copyright © Fujitsu Technology Solutions GmbH 2011