single-annular combustor technology … · single-annular combustor technology report june 1980...
TRANSCRIPT

t ,r %,
• CIt-lSIM6
RTW_GSe2
,m i
LENE_GY EFFICIENTENGINE1
COMPONENT DEVELOPMENT& INTEGRATION"_lb *
SINGLE-ANNULAR COMBUSTORTECHNOLOGY REPORT
June 1980
Prepared for }
NATIONAL AERONAUTICS AND SPACEADMINISTiLATIONtEWlS RESEARCHCENTER
21000 IIROOKPAEI( ROADCLEVELAND. OHIO 44135
Contract NAS3-20643
(NASA-C_-159b_5) E._EP.G'{EFFICIENT E_GINE NSO-3J_08
. _ (General Electric Co.) 118 p dC AO6/MF A01CSCL 21E
Oncl_
(;3/07 28_31
AECJU_ _ GeOUP
6ENERAL0 ELECTRIC _ .o_......_.,,,,,.,.x,o..,.,"_ o,,,.
1980024900
https://ntrs.nasa.gov/search.jsp?R=19800024900 2018-08-20T19:51:01+00:00Z
1 Re_,t NO. 2. _ Acamm No. 3 RGckmm'sCmdoe No
CRol59685
-4 T_e a,_ _ S Rep_ Dem
ENEI_Y _FFICIENT EIIGINF June 19SOCOMPONENTDEVELOPHENTAND IHTEGRATION 6 PorfmmingOrgomzationCockSINCLE-ANHULAR COHBUSTORTECHNOLOGy_EPORT
7. Aumo,'(s_ 8. Pvrform_gOrgs_m_n _t No
D. _urrus, P.E. Sabla, and D.W. 6ahr __ E79AI[G$6210. Work Unit No.
9 PwfommgOq_n_mionNameand _kkms
General Electric CoipanyCinciunati, Ohio 45215 IIAS3-206A3
13. Type'of 'Report and PeriodCovered
12" Spo_ AIRy NO_Oand _ Contractor kport
Xational Aeronautics and Space Adiinistretion I 1.. Slx_wer_l _ CO_Washington, DC 20.$46 I
4
_ss.,,_.._ No,,,
Project Engineer: D.J. Gauntner
16. Ahnr_
This effort wms directed at deLenmlnin_ the feasibility of meeting or closely approaching theemissions goals established for the Energy Efficient Engine (E 3) Project vith an advanced-design, single-annular ¢ombustor. A total of nine sector-combustnr configurations an& onefull-annulsr-combns*or configuration vere evaluated in this _evelopment program.
Acceptable levels of carbon monoxide and hydrocarbon " ""emzsstons vere obtained vith several of
tbe sector-combuntor configurations tested, end several of the configurations tested demon-strated reduced levels of nitrogen ox{des compared to conventional, single-annular designs.However, none of the configurations tested delonstrated nitrogen oxide emission levels thatmeet the goal of the E3 Pro.ject.
17 K_,Windsmum_d _ A,mw,WD .LO_ ._
Combustion: Combustor
Euissions Unclassified - UnlimitedPollution ReductipnEnergy Efficient, ,Engine
ig. S.c_,Iv ¢_f. (of_ nmrU 20.Socu_vam,. (of _ pip, 21 No.of P._ 22."Pr_"
Uric lames fied Unc lass i fled 110
• Forsale by the Nat,onalTechn,cal Informal,onServ,ce, Spr,ngfield,Virg,nia 22161
N&SA_-I68 tRey. 10-TS)
1980024900-002
FOREWORD
This report describes effort performed by the General Electric Companyfor the National Aeronautics and Space Administration, Lewis Research Center,under Contract NAS3-20643, as part of the Energy Efficient Engine Project.Mr. Neal T. Saunders is the NASA Energy Efficient Engine Project Hanger,Mr. Lawrence E. Hacioce is NASA A_sistant Project Manager responsible for thiscontract. Mr. Daniel J. Gauntner is the NASA Project Engineer responsible formanaging the effort associated with the Combustor effort reported herein.
The Manager of the Energ) Efficient Engine Project for the General Elec-tric Company is Mr. M.C. Hemsworth. This report was prepared by Mr. D. Burruswith the assistance of Messrs. P.E. Sabla and D.W. Bahr.
iii
1980024900-003

TABLE OF CONTENTS
Sect ion
1.0 S'_MAR¥ 1
2.0 INTRODUCTION 2
3.0 PROJECT PLANS AND GOALS 3
3.1 Project Elements 33.2 Project Goals 3
4.0 SINGLE-ANNUL_,R COHBUSTOR [q_SIG_ 6
4.1 Pcoposed Combustor Design 64.2 Baseline Test Combustor Design 10
5.0 CONBUSTORTEST CONFIGURATIONS 15
5.1 Sector-Combustor Test Configurations 155.2 Full-Annular Combustor Test Configuration 15
6.0 DEVELOPMENTTEST METHODS 23
6.1 Sector-Combustor Test Rig 23
6.2 Sector-Combustor Test Facility 266.3 Sector-Combustor Test Procedures 30
6.4 Sector-Combustor Data Analysis Proceduc_q 32
6.5 Full-Annular Combustor Test Rig 396.6 Full-Annular Combustor Test Facility 476.7 Full-Annular Combustor Test Procedures 54)
6.8 Full-Annular Combustor Data-Analysis Procedure 53
7.0 DEVELOPMENTTEST RESULTS 54
7.1 Sector-Combustor Idle Emissions 54
7.2 Sector-Combustor NOx Emissions 647.3 Sector-Combustor Performance 667.4 Full-Annular Combustor Idle Emissions 68
7.5 Full-Annular Combustor NOx Emissions 737.6 Smoke Emissions 73
7.7 Full-Annular Combustor Performance 78
7.8 EPA Parameter 86
7.9 Design Assessment 88
8.0 CONCLUDINGREMARKS 94
APPENDIX A DEVELDPIqENTTEST DATA 95
APPENDIX B DIIf_SIONS ADJUSTMENT FACTORS IO7
APPENDIX C NOMENCLATURE 108
REFERENCES II0V
.,_LCEDiNGPAGE _Lr..:.._C)]",:.._.,-._
m
1980024900-004
LIST OF ILLUSTPATIONS
1. Project Milestone Schedule. 4
2. BOx Levels of Hodern Turbofan Engines. 7
3. Combustor Bulk Residence-Time Variations. 8 v
4. Proposed E3 Alternate Combustor Design. 94
5. Current FI01PV Engine Combustor Cross Section. 11
6. E3 Single-Annular Combustor Simulation. 13
7. Airflow Distribution Comparison. 14
S. Sector-Combustor Test Hardware. 16
9. Combustor Test Configurations. 17
10. Fuel Injector Hardware. 19
11. Full-Annular Combustor Hardware with ImpingementSh ields. 20
12. Full-Annular Combustor Hardware without ImpingementShields. 21
13. Schematic of Full-Annular Combustor Fuel InjectorHardware. 22
14. Schematic of E3/FIOI S_ctor-Combustor Test Rig. 24
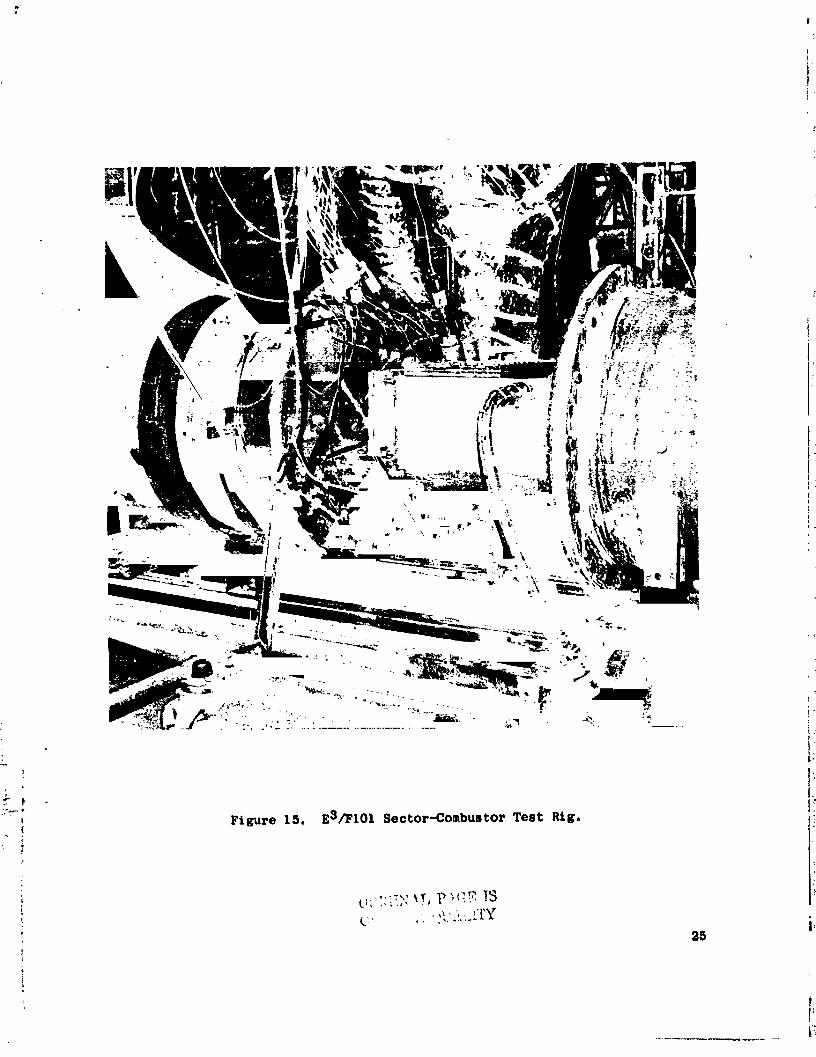
15. E3/FIOI Sector-Combustor Test Rig. 25
16. Quick-Quench Gas-Sampling Rake. 27
17. Gas-Sampling Probe Tip Cross Section. 28
18. Sector-Combustor Test Rig Instrumentatio.. 29
_ 19. Sample Output from Program E3FDH. 35 .
20. Sample Output from Program CALIR. 37
21. Sample Output from Program E3CAROL. 38
22. Full-Annular Combustor Test Rig. 40
vt
qg80024gO0-O05

I,I_Tt)it ILLUSTRATIONS (Continued)
23. Full-Annular Combustor Fuel Nozzle Arrangement. 41
24. Full-Annular Combustor Instrumentation Spool. 43 :
25. Schematic of Ine;trumentation S0,ool Bake Locations andSampl e-Line llook-up. 45 i:
t
26. Full-Annular Combustor Instrumentation. 46 li
27. Interior View of Test Cell A3 Facility. 4S i_
28. Test Facility Data-Acquisition Schematic. 51 t_I"
29. Sector-Combustor Configurations SA-00, SA-0I, and SA-O2: !
CO and lie Emissions Results. 56 t!
30. Sector-Combustor Configurations SA-00, SA-01, and SA-02: iCO and ilC Emissions Results Along the Design-Cycle Operating )_
Line. 5S i
31. Sector-Combustor Configurations SA-03 and SA-06: CO and HCEmissions Results. 59
32. Sector-Combustor Configurations SA-03 and SA-04: CO and IICEmissions Results Along the Design-Cycle Operating Line. 60
33. Sector-Combustor Configurations SA-05, SA-06, SA-07, andSA-O8: CO and HC Emissions Results. 62
34. Sector-Combustor Configurations SA-05, SA-06, SA-07, andSA-08: CO and tic Emissions Results Along the Design-CycleOperat ing l,ine. 63
3.5. Sector-Combustor NOx Emissions Results. 65
36. Sector-Combustor Ow, rall Pressure Drops. 67
37. Sector-CtDmbustor Liner Thermocouple Locations. TO
38. CO and HC Emissions Versus Fuel/Air Ratio for the Full-
Annular Combustor Test Configuration. 72
3q. CO and IIC Emissions Versus Combustor Inlet TemperatureAlong the Design-Cycle Opt, rat ing Line for the Ftsll-AnnutarTest Configuration. 74
40. NOx Emissions Along the Design-Cycle Operating Line forthe Ful L-Annular Test Configurat ion. 75
vtt
1980024900-006

!
LIST OF ILLUSTliATIONS (Concluded)
" i: _.
t_l. Full-Annu|ar Co_bustor NOx Emissions Versus CondbustorSu|k Residence Time. 76
42. Smoke Humber Versus PIOI/CFTI_6 Smo_ce-Correlation Perimeter. 77
43. Peak Liner Temperatures. 79
44. Outer-Liner-Temperature Axial Distribut ion. SO
45. Inner-Liner-Temperature Axial Distribution. Ill
46. Full-Annular Coud)ustor Overall Pressure Drops. 82 r
47. Estimated Airflow Distribution for the Full-Annular
Combustor Test Confiliurat ion. I16
48. CO, HC, and NOx EPAP Numbers Versus Oercent of Powerat ld Is. 87
49. Double-Annular and Sinllle-Annular Combustor Comparison. gO
50. Projected CO/NOx Emissions Trade-Off. 93 I!
tI
T
i*
1
vtLt
1980024900-007

LIST OF TABLES
Table Page.._mmmmmm
,mmmmm,
1, E3 Combustor Emissions Goals, 3
II, E3 Combustor Key Performance Goals, 5
I11. E3 Single-Annular Combustor Design Parameters. 10
IV, Proposed E3 Single-Annular Combustor Airflow Distribution. 12
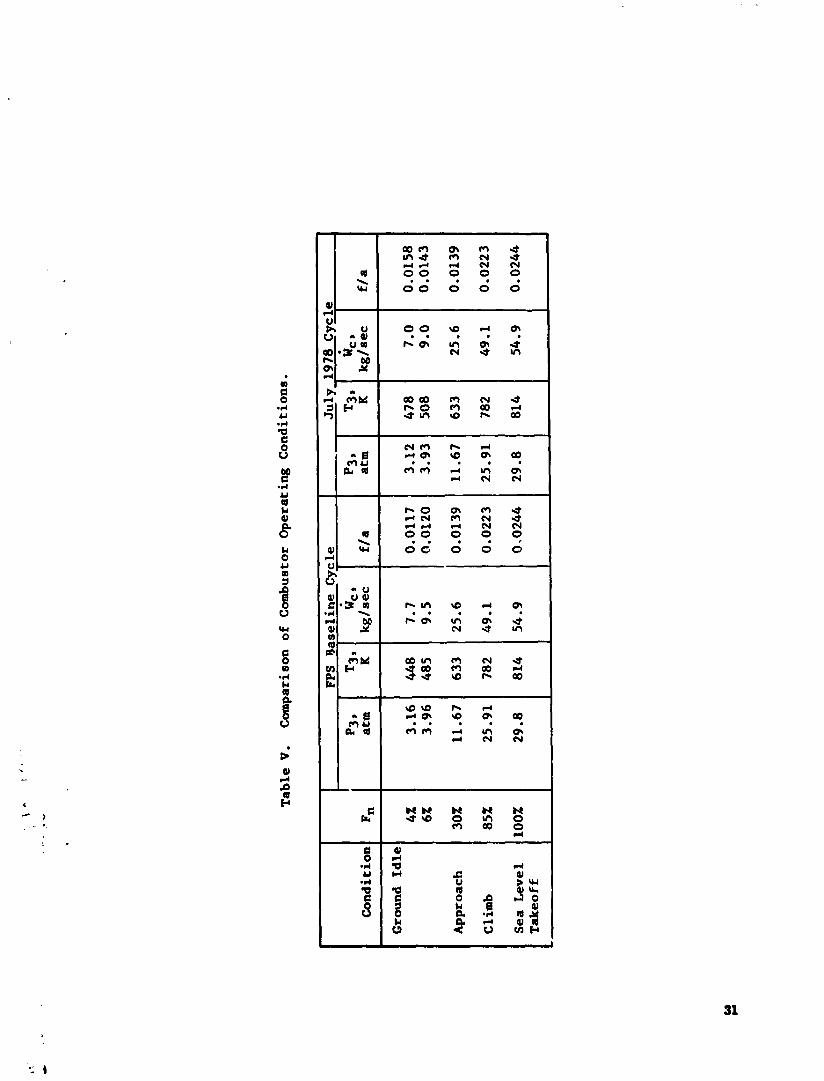
V. Comparison of Combustor Operating ConditLons. 31
VI. Sector-CombuJtor Teat Points for E3 FPS Baseline Cycle. 33
Vll. Sector-Combustor Test Points for E3 July 1978 Cycle. 33
Vlll. Summary of Measured and Calculated Combustor Parameters forSector Tests. 34
IX. Full-Annular Fuel Nozzle Calibrations. 42
X. Combustor/Rig Instrumentation. 44
Xl. Full-Annular Combustor Test Schedule. 52
XlI. Ccmbustor Operating Conditions for E3 FP8_ July 1978_and October 1978 Cycles. 55
Xlll. Su_aary of Sector-Combustor _lissions. 6B
XIV. Sector-Combustor Estimated Flow Areas and AirflowDisir ibut ions. 69
XV. Summary of Sector-Combuscor Liner Temperatures. 71
XVI. Measured Static Pressures for Pull-Annular TeatConfiguration. 83
X_II. Summary of Emissions and Performance Results for the E3Single-Annular Combustor Test Configurations, 89
XVIII. Combustor Desisn Assessments, 91
lit
1980024900-008

l,O SU_RY
The Energy Efficient Engine (E3) alternate combustor effort was con-ducted as part of the overall E3 combustor technnlog 7 development. Themain-line combustor-technology effort is direct d at designing and develo_in_a complex, double-annular configuration. The main objective of this alter-nate-combustor effort was to determir_e the feasibility of meeting the emis-sions goals established for the E3 Project with an advanced, single-annularcombustor design.
The key elements of this effort included the design of a baseline, s,n-gle-annutar, sector-combustor test configuratlon; fabt ication of variation_of the baseline configuration (including one full-annular design version) ;and devetopment testing of the various sector and futt-snnutar combustor testconfigurations. The baseline combustor test configuration was evolved from acurrent production-engine combustor. Design modlfications were made to pro-vide simulation of a short, advanced, singte-annutar combustor design suitabtefor the E3 application. Nine sector-combustor configurations a_d one full-annular combustor test configuration were evaluated. Data vere obtained onemissions revels, component temperatures, and important performance character-istics of each t:est configuration.
Acceptable levers ot CO and HC emissions were obtained with several ofthe test configurations investigated. The final sector-comhustor trqt config-uration demonstrated CO and HC emissions levers, at L+Z and 6_ ground idleoperating conditions, that meet the E3 Project goals with margin. However,none of the configurations demonstrated NOx emission levels that meet theE3 Project goals; therefore, atl future combustor-technology effort underthe E3 Project wilt ;,e directed Coward a doubte-annular configuration. Thisapproach offers greater promise for meeting all of the E3 emission goals.
I
1980024900-009

2.(t [NTK_JDUCTION
'rh,, (;,,neral Electric Company is currently engaged in the Energy EfficientEngim' (E ]) Proi,'ct under Contracl NAS3-20643 to NASA la.wis Research Center.'rhe pulpo_;e of the K3 Project is to d,,velop and d_monstrate the tecl.nnlogyfor obtaining higher thermodynamic and propulsive efficiencies in advanced,environmentally acceptable, turbofan engines foe possible use in future com-mercial transport aircraft. The Project involves technology development forengine components, including the design nf an advanced, low-emissions combus-tor. The primary selected approach is a double-annul,It-dome combustor designevolved from technology developed in the NASA/OK Experimental Clean CombustorProgram (ECCP) (Reference [) and the NASA/OK Quiet, Clean, Short-Haul, Experi-mental Engine (QCSEE) Program (Reference 2). The double-annular-dome combus-tor designs evolved from these programs demonstrated substantial reductionsin gaseous exhaust emissions when compared to current, con,entional, single-annular combustor designs. As a supporting technology effort to the E3Project, an alternate-combustor test effort was conducted to evaluate thefeasibility of meeting or closely approaching the E3 emissions goals withan advanced, single-annular combustor design. Successful development of asingle-annular combustor offers promise of a simpler configuration thatshould be cheaper, more durable, and more reliable than the double-annulardesign.
The emissions goals for the g 3 Project are identical to the emissionsstandards currently defined by the Environmental Protect ion Agency (KPA) forClass T2 [rated thrust greater or equal to 8q kN. (20,000 lbf), subsonicapplications] aircraft turbine engines newly certified after January 1, 1981(Reference 3). The intent of these standards is to limit the quantities ofengine exhaust emissions within and around airport facilites. The E3 alter-nate-combustor technology effort was initiated at the onset of the E3 Projectand was conducted tn parallel with the aeromechanlcal design of the double-ann,llar combustor.
The alternate-combustor test effort included the evaluation of nine
sector-c_mbustor configurations and one full-annular comhustor. All config-urations tested were derived from design modifications to the current F[OI PV(Product Verification), s;.ngle-annular combustor design. These modificationswere designed to simulate in the basic FlOl PV combustor the aerothermodynamiccharacteristics for an E3 single-annular design believed to be beneficialin the reduction of engine exhaust emissions. This supporting technology task,the K3 alternate-combustor effort, was initiated in January 1978 and com-pleted in April 1979. This report presents a description of Ihe sector com-b;istL_r and lull-allni|l:lr _L_mhu._tor t,,sl config¢ir_tl iOll.h_ |h*' Jr'hi I'i},% ;llld
facilities in which the vehicles were tested, and the data-acquisition andreduction methods employed. Results of the test effort are presented in plotsand tabulations of emissions indices and combustor performance parameters.Comparisons of the emissions data to E3 Project goals are presented in theform of EPA parameter numbers (KPAP's).
2
i
1980024900-010

3.0 PROJECT PI,AN._ AND (;OAI,S
3. I PROJECT ELEMENTS
The E3 alternate-c_nbustor effort was comprised of four basic tasks.These :asks wer_ combustor design, fabrication of test hardware, dew,|op_.::ttestin_ ,fforts, and data analysis and repor[ing. Th,, k,.v ele_'nts and siC.-nifican, milestone_ of this effort ar,' shown in Figure I.
3.2 PROJECT GOALS
Emissions Goals - The specific pollutant emissions _oals for thL E3single-annular combustor des".Rn are the same as for the double-annularrose,buster design. They are expressed in th* form of the EPA parameter for the
gaseous exhaust emissions, and SAE smoke number for smoke _nisslons, in Table [.The EPA parameter (EPAP) is a thrust-normal:.zed measure of the total mass ofpollutants emitted in a prescribed landing and takeoff cycle. E3 goals areidentical to the emissions standards for carbon monoxide (CO), unburned hydro-
carbons (H_), oxides of nitrogen (NOx) , and smoke as dc*fim, d hv the EPA for(Class T2) subsonic-aircraft turbim, engines newly cerLified after January I,1981.
As shown in Table I, by comparing the E3 emissions _¢oals to the EPA
standard_ for engines newly manufactured after January I, log1, significantreductions [n ('0 and IIC emissions are requirt,d. Although tim E3 go;ll for
NOx _,mi_sions is identical to the EPA standard for newly manufactur_,d en-gines, these levels have yet to be demonstrated with current-tt.chnology c_m-
buster designs. Significant reductions in CO and NOx er_i_sions have beenachieved in prior emissions-reduction efforts employing such advanced con-cepts as the NFSA/GE ECCP CF6-50 double-annular combustor design. However,
Table I, E3 Comb,Jstor Emissions Goals.
E3 CFO-5OCGoals Goals
• Carbon lqonox[de (CO) Pounds Per 3.0 4.3
1: • Hydrocarbons (HC) lO00 Pound Thrust.- 0.4 0.8
i • Nitrogen Oxides (NOx) Hours Per Cycle 3.0 3.0
• SAE Smoke Number 20.0 20.0
Note: E3 goals at- identical to EPA 1981 _tandards for newly certifiedengines; C;:6-50C goals are identical to EPA 1981 standards for newlymanufactured engines.
3
1980024900-011

A
L 4Z
0
0
0
0
oo,e
,
S "® = '_ .l .e-#
X , s.. ,C i as
rl m
4
1980024900-012

even t_lis advanced design failed to demonstrate NOx eraLssions that wouldsatisfy the 1981 standard. Therefore, the E3 emissions goals for all threegaseous exhaust emissions are very challenging and will require an eveo moreadvanced combustor design.
Performance Goals - The key corabustor performance goals f, r the E3Project are presented in Table II. Most of the current, conventional, com-bu._tor designs developed by Ceneral Electric already provide performancelevels generally equal to or better than the goals established for the _:3combustor. Thus, the major challenge of the E 3 alternate combtlstor effort
was to develop an advanced, single-annular combustor design with significant-ly reduced pollution levels w'thout compromising the performance chacacter-ist ics.
Table II. E3 Corabustor Key Performance Goals.
s Co_bustor Effic iency at SLTO 99.5% (bl_n.)
• Total Pressure Drop at SLTO 5.0% (Max.)
• Exit Temperature Pattern Factor at SLTO 0.250 (Max.j
• Exit Temperature Profile Factor at SLTO 0.125 (Max.)
• Altitude Relight Capability q.1 km (30,000 ft) (Min.)
• Ground Idle Thrust (% of SLrO) 6.0 (Max.)
i
1980024900-013
&.O SINGLE-ANNLrLARCOMBUSTORDESIGN
4.1 PROPOSED COHBUSTORDESIGN
Extensive development efforts carried out by "'_SA and General Electrichave shown that the applicable CO and _C emissions standards can be met inmodern turbofan engines with conventional, single-annular combustors, ltow-
ever, to meet the NOx emission goal and the CO and ltC emissions goals in afixed-geometry, single-annular combustor is a major challenge. Extensive
i_vestigations to determine the NOx emission characteristics of varioustypes and sizes of modern combustor, have been conducted at General Electric.Some typical results of these invescigations are presented in Figure 2. Asshown, none of the current, conventional designs meet the E3 Project goals
for NOx emissions.
The engine families represented iv. Figure 2 are equipped _ith single-annular combustors that are short and compact with high volumetric heat-release rates. Within a family (CF6, CFM56, etc.), each engine is equippedwith the same _mbustor. Since the specific fuel consumption (sfc) charac-teristics of each engine are similar, it is possible to compare the effects
of engine cycle conditions and combustor size on the NOx EPAP levels.
As shown in Figure 2, the NOx EPAP's of each family are directlyrelated to engine cycle pressure ratio. It is also observed that, at the
same cycle pressure ratio, the NOx EPAP's of the smaller engines are lowerthan for the larger engines. This is because the combustors have been sized
using essentially a constant velocity parameter as a scaling factor. There-fore, as engine size is increased the combustor size must accordingly beincreased to maintain the velocity parameter value. As shown [n Figure 3,
combustor residence time is directly related to c_bustor size. The NOxemission indices relationship to residence time is also shown in Figure 3;
therefore, these results indicate that the NOx E:AP values of these enginefamilies are directly associated with the size of the combustors.
These findings suggest the possibility of obtaining low NOx EPAP valueswith a very short, compact, single-annular combustor design. It should be
noted that if the en_.ine families presented in Figure 2 had the improved sfc
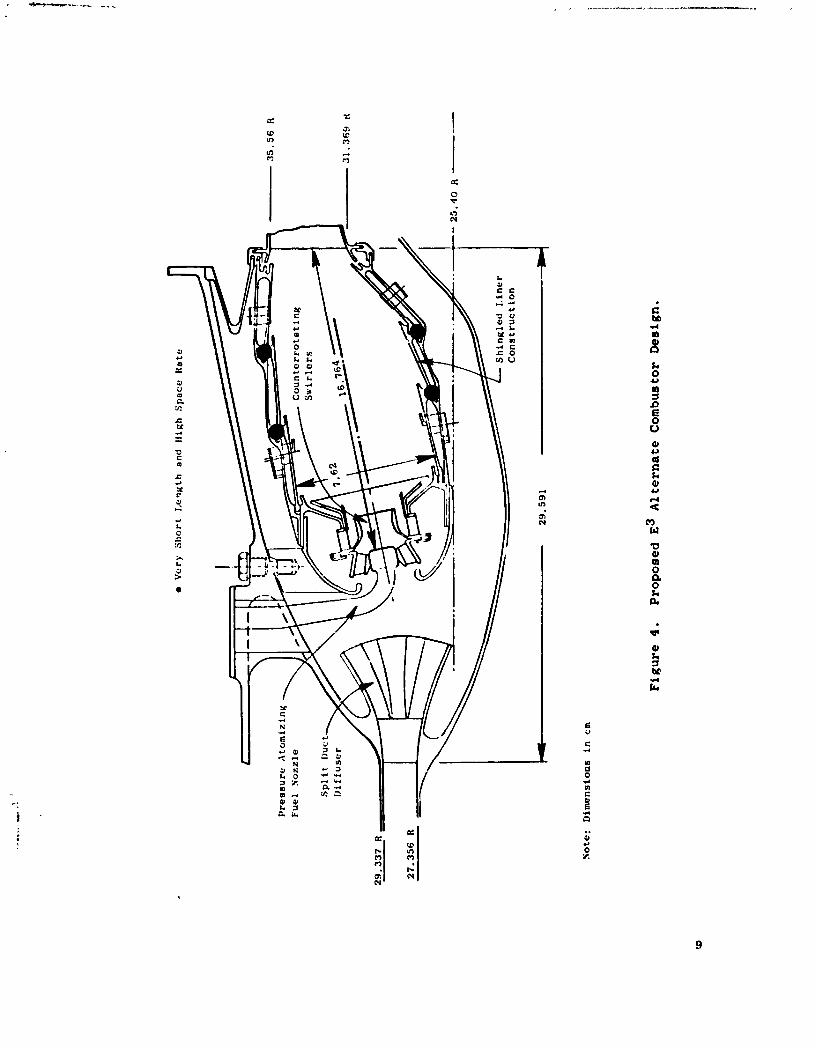
characteristics of the E3 cycle proportionally lower NOx EPAP values wouldbe obtained. A preliminary design of such a combustor, proposed for the E3application, is presented in Figure 4.
The proposed E 3 single-annular combustor design depicted in Figure 4 isconsiderably shorter and more compact than would be the case with a version ofthe FIOI PV combustor directly scaled-up to the E3 size. Since the FIOI PV
combustor is considered to be an advanced, short-length combustor design, anyscaled versions of this cc_bustor with shorter lengths and higher volumetric
'_ heat-release rates would involve further advances in combustor design tech-
nology. Some of the key aerothermodynamic design parameters of the proposed
6
i
1980024900-014

rJD
r-4
0
o_ _
Iflm
_4
(anoH-lsn=q_. sqI O00[/sq[) ,_olo_m.aed Vd_[ O_
1980024900-015

Figure 3. Combustor Bulk Residence Time Variations.
8
i
1980024900-016
g
1980024900-017

short, compact, F3 _lngle-annul.lr comhustor .1re compared with tilofie of theFIOl PV engine combust.or and a directly scaled-up version of the F1OI PV -n-gine combustor in Table III.
Table IlI. E3 Singular-Annular Combustor Design Parameters.
Directly
Parameter Sea led-up E3FIOI PV Proposed FIOI PVDes ign Des ign Des ign
. m
Combustor (Burning) Length, cm 22.6 16.8 21.1in. 8.9 6.6 8.3
Dome Ileight, cm 9.4 7.9 8.6in. 3.7 3.1 3.4
Length/Height Ratio 2.4 2.2 2.4
Number of Fuel Injectors 30 30 20
Reference Velocity, m/see 18.9 21.5 18.9ft/sec 62.0 70.5 62.0
Dome Velocity (Cold), m/sec 7.6 9.8 7.6ft/sec 25.0 32.2 25.0
Space Rate, kW/m3-pa 0.80 1.06 0.82Btu/hr-ft3-atm 7.8 x 10⁶ 10.3 x 10⁶ 8.0 x 10⁶
tlsing Genera[ Electric data on the emissions characteristics of existingslngle-annular combustor designs and the data obtained from various GeneralElectric/NASA emlssions-reduction programs, detailed design studies were con-ducted to define a preliminary combustor airflow distribution that would pro-
vide the optimum combination of low CO, tiC, and NOx EPAP values. As a resultof these studies, a preferred combustor airflow distribution was generated andis presented in Table IV.
4.2 BASELINE TEST COMBtlSTOR DESIGN
.. Trade studies were conducted on several existing General Electric combus-
tor designs to define a short, compact, single-annular combustor satisfactoryfor the E3 application. Based upon the relative similarity of the key designfeatures of the FI01 PV combustor and the proposed E 3 single-annular combustor
design, :,n addition to the availability of combuator hardware and test rigs,th- F[O! PV engine combustor was chosen for this supporting technology pro-gram. A cross section of the current FIOI PV engine combustor design is pre-sented in Figure 5.
IO
1980024900-018

o
u
mm0
U
0
m
E0
U
op,l
U
1980024900-019
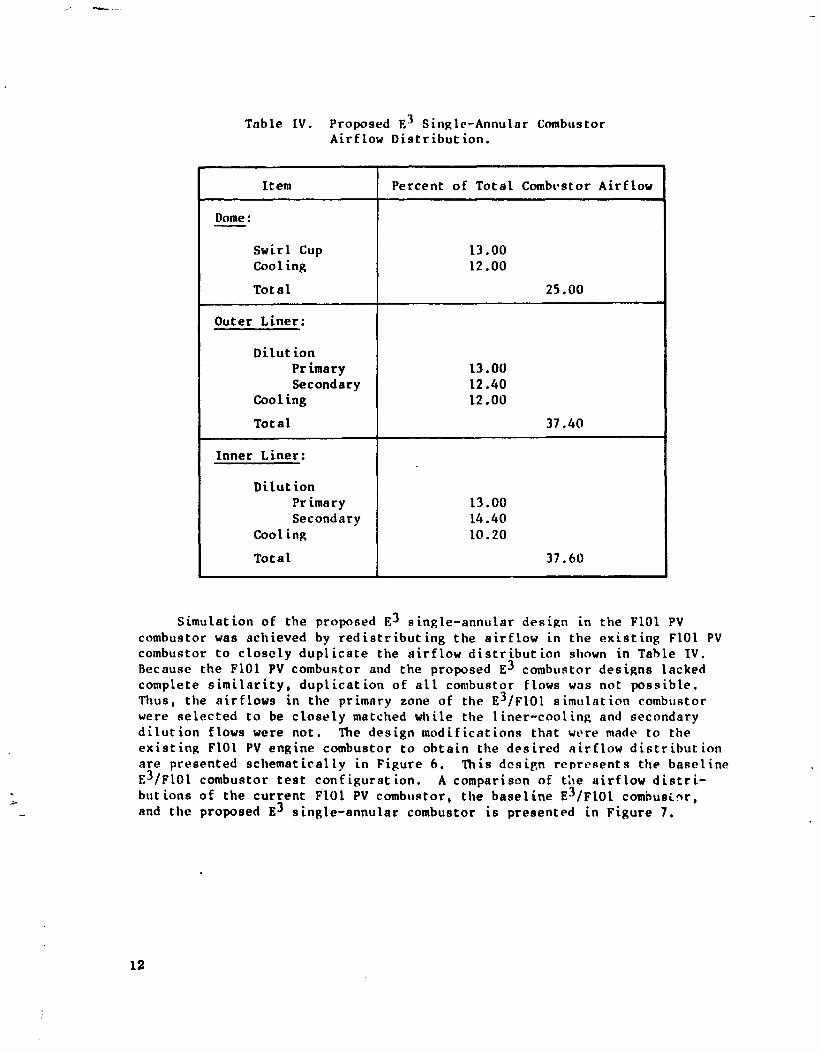
Table IV. Proposed E3 Single-Annular CombustorAirflow Distribut ion.
Item Percent of Total Combt, stor Airflow
Dome :
Swirl Cup 13.00Cool ing 12.00
Total 25.00
Outer Liner:
Dilut ion
Primary 13.00Secondary 12.60
Cool ing 12. O0
Tot al 37.40
Inner Liner:
Dilution
Pr imary 13. O0Secondary I4.40
Cool ing tO .20
Total 37.60
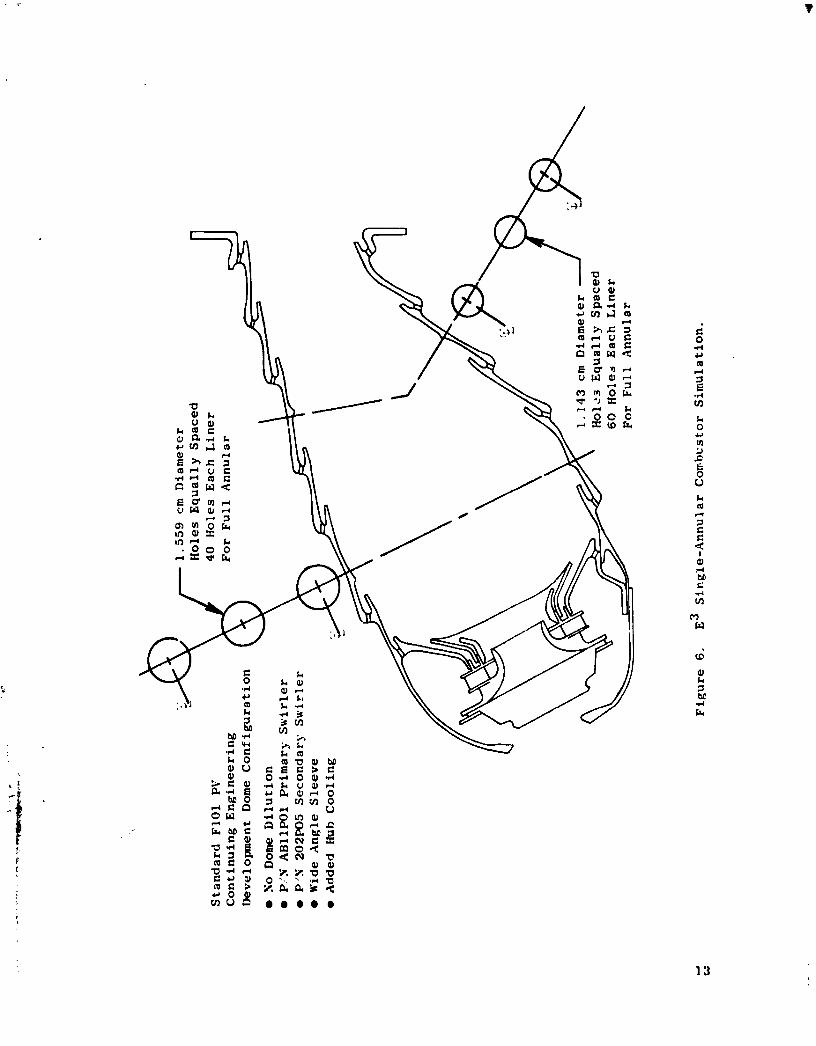
Simulation of the proposed E3 single-annular design in the FIO1 PVcombustor was achieved by redistributing the airflow in the existing FIOI PVcombustor to closely duplicate the airflow distribution shown in Table IV.Because the FI01 FV combustor and the proposed E3 combustor designs lackedcomplete similarity, duplication of all combustor flows was not possible.Thus, the airflows in the primary zone of the E3/FIOI simulation combustorwere selected to be closely matched while the liner-cooling and secondarydilution flows were not. The design modifications that were made to theexisting FIOI PV engine combustor to obtain the desired airflow distribution
are presented schematically in Figure 6. ]'his design represents the baselineE3/FIOI combustor test configurat ion. A comparison of the airflow distrl-butions of the current FIOI PV combustor, the baseline E3/FIOI combusi._r,
_ and the proposed E3 single-annular combustor is presented in Figure 7.
12
1g80024gO0-020
13
1980024900-021
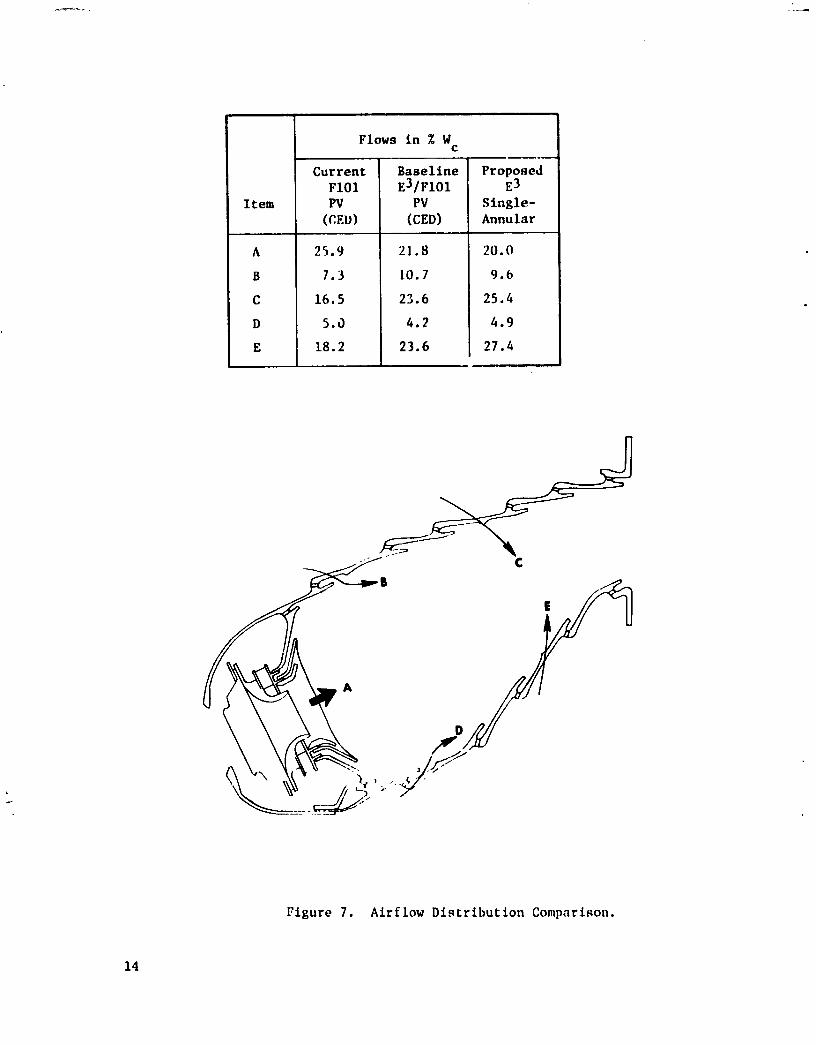
Flows in Z Wc
Current Baseline Proposed
FI01 E3/F101 E3
Item PV PV Single-
(CED) (CED) Annular
A 25.9 21.8 20.0
B 7.3 10.7 9.6
C 16.5 23.6 25.4
D 5.0 4.2 4.9
E 18.2 23.6 27.4
Figure 7. Airflow Distribution Comparison.
14
1980024900-022

:
5.0 COHBUSTOR TEST CONFIGURATIONS
5. | SECTOR-COHBUSTORTEST CONFIGURATIONS
Nine sector-combustor configurations and one full-annular combustor con-figuration were evaluated in the E3 alternate combustor effort. Each sector-combustor configuration was a five-swirl-cup, 90 ° section of a 20-swirl-cup,360" (full-annular) combustor.
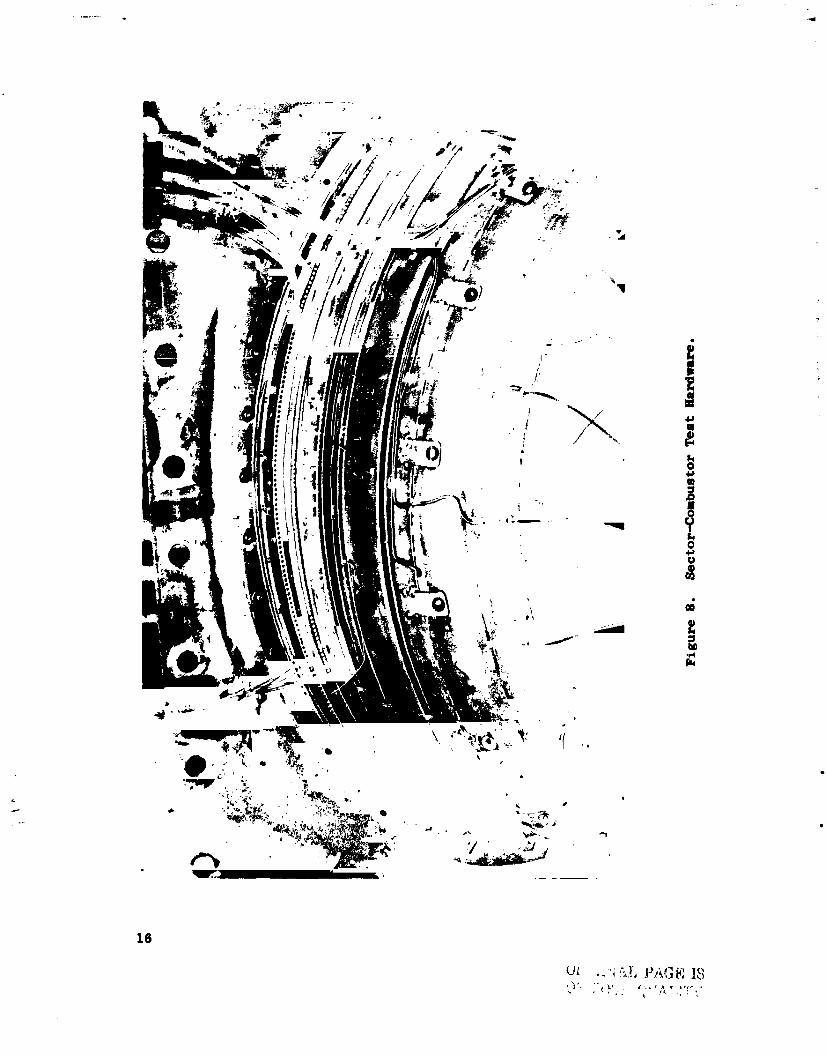
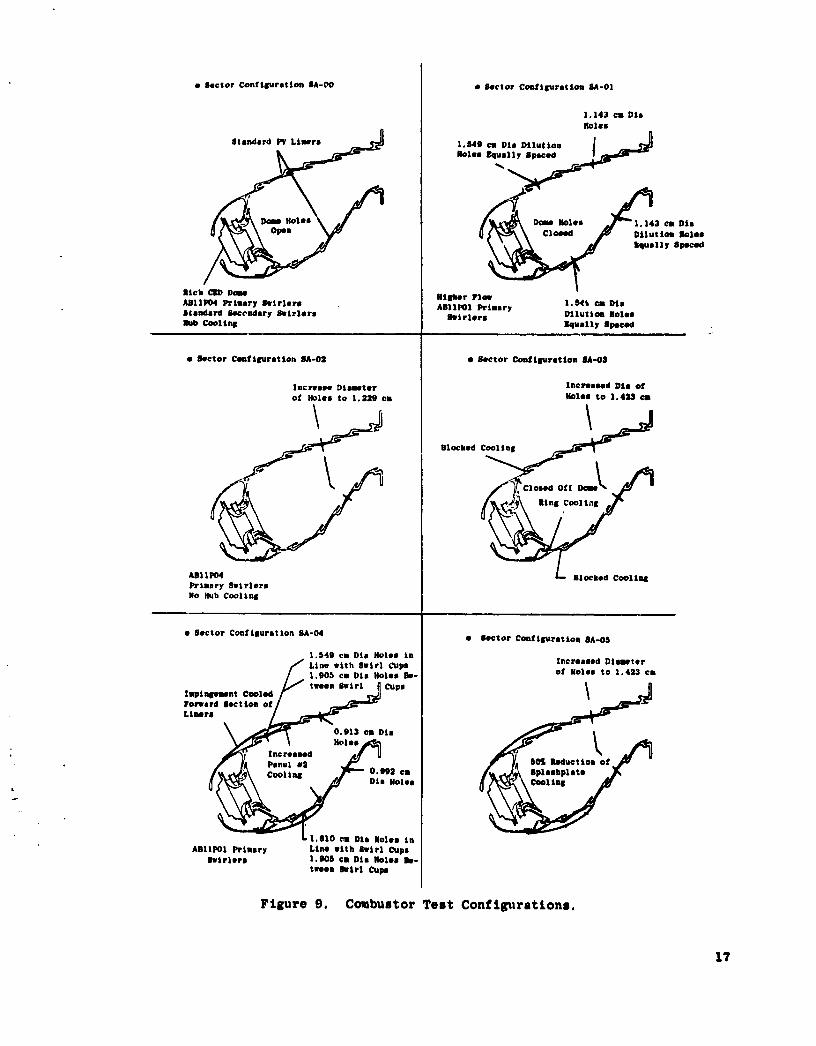
The nine sector-combustor test configurations included the standard FIe1PV CED (Continuing Engineering Development) combustor configuration (Con-figuration SA-O0), the baseline E3/FIOI combustor configuration (Configura-tion SA-OI), and seven configurations representing various design modifica- :tions to the baseline E3/FI01 design (Configurations SA-02 through SA-08). !i;1Sector-combustor configurations SA-04 through SA-08 featured impingement ;cooling on the forward sections of the inner and outer liners as a means ofachieving significant reductions in low-power CO emissions. A photograph ofthe baseline E3/FIOI sector combustor prior to testing is sho_,,n 'n Figure 8.Illustrations of the sector-combustor configurations tested are shown inFigure 9. The specific modificatior_s incorporated in each configuration aredescribed in these figures.
Standard FlO1 engine fuel injectors were used for Configuration SA-O0testing. The other sector configurations used fuel injector assemblies
featuring simplex-type, pressure-atomizing fuel nozzles. This type of fuelnozzle was selected for the excellent fuel atomization it provides; a photo-
graph of the hardware is shown in Figure 10.
5.2 FULL-ANNULAR COHBUSTORTEST CONFIGURATION
The E3/FI01 full-annular combustor design was similar to sector-combus-tor Configuration SA-07. This configuration was selected because Configura-tion SA-07 had demonstrated acceptable liner temperatures and relatively low
projected NOx emission levels at sea level takeoff; both are important char-acteristics for a full-annular combustor test conducted at elevated pressures.The full-annular combustor configuration also featured modified forward panelson the inner and outer liners. This modification involved the elimination of
the forward cooling-ring slot of the inner and outer liners. An illustration
_ : of this full-annular combustor configuration with a description of the modifi-_! cations featured is presented in Figure 9. Photographs of this full-annularJ
combustor configuration with and without the impingement-cooling shield
i attached are shown in Figures ll and 12.
The fu_l injection assemblies used for testing the full-annular combustorconsisted of fabricated, simplex-type, fuel nozzles m_unted in standard FI01combustor test rig nozzle holder assemblies. The simplex nozzles were fab-ricated from FI0I nozzle bodies, with 1.4-mm diameter orifices, and fuel-
metering inserts fxom the CF6-50 NASA/GE ECCP simplex high-flow fuel nozzles.
15
1980024900-023
1980024900-024
• Sector Confifurstton 8A-O0 • Sector Contlsurstion HA-OH
1.143 cm DisHoles
I°MH cs
DIs Dtlut touHoles F.quslly 8p0ced
3 ¢qnDis
Dllut So: Holes
llquslly Spoo_i
Rich CZD Dame HiBher FlowABIIP04 Primary |wirlsre ABI1POI Primnsry i._t_ cm DisStsndsrd Hocendsry Huirlers 8eirlers Dilution HolesHOb Cooltnj kuslly 8pec_l
• Sector Coattfurstlon fl_-OS • Hector _nflsuret/on U-OS
Increase Disaster lncrossod Dis ofof Holes to 1.229 ca Holes to 1.4_1_ cm
Pr _tusry SvlrlereNo Hub Cooling
• Sector Contlfurstion 8A004 • Hector Coutisurstion HA-O6
1.649 cut Dim Holes in
_ Line with Swirl Cups
Incrossed DiMmter
l,O05 cu Dis Holes Be- o! Holes to 1.493 ca
teamX.p' ItSeliollt CO01 od fl _Irl J C_p. 1
iroresrd Section o__r m_Lt'FS \ _d_d_rm_- 1 "0.913 c, Dis
_" lncressed _(_ U
f-- o..,,,,ol.c, o,l.SlO ca DIs Holes In
ABIIPOI Prlmsry Line with Jwlrl CupsSettlers 1.006 el Dis Holes Be-
teoen Ouirl Cup8
Figure 9. Combustor Test Config_;rsttons.
17
1980024900-025

ln_reoeed Ploe JeJrl CupsJtsndord _'ue] Noulo •
• 1N11 _mulsr CoetitmrotionIupt ns_mn¢ Shield
_ rovldtns Coollq for
first Ponol
•odit.s Lt,, ,,--I \ .E|tbaut WlrlJt Cool|no R1nll _
_f_t......_ IUel.esjed 1.340 _ Dis JJolos
Cool in8
j*-_/ -t,, L--* ,,h Cu,, .// I]_/I |. _ Ca DSmblo| _ -
f.. . I_ ht,oo=Cue. ,L.._.._.*o s4,,ln_8a.._
"'"1 "" \ \ _...31euml CuNcmh,, ,,ho,, \ \_ ...... _._r,,rDemoDilution ^ __ _,_Y-q_ _,w'_l
_. _ _"_ vr" __ mpinSewnt lhtold P_ovidiq
_- • _dlflod Ltnor Polml•_ gttbodt _t_t _eOli_
2]S
lPilrU,'o 9. Comtmstor Toot Contijuro*.lons (Concludod),
18
1980024900-026

Figure 10. Fuel Injector Hardware./
19
1980024900-027

Figsre 11. Full-Annular Combustor Hardware with Impingement Shields.
1980024900-028

Figure- 12. Full-Annular Combustor ilardwaro without Impingement Shtolds.|
",''-",1,
31
1980024900-029

The fabrication of the nozzles was necessary to provide a complete set of
simplex-type fuel injector assembles with the capability of operation over
the entire range of fuel flows that would be encountered durins the test.
An illustration of this fabricated fuel injection assembly is presented in
Figure 13.
lolder
Figure 13. Schematic of Full-Annular Combttstor
Fuel Injector Hardware.
22
1980024900-030
6.0 DEVELOPHENTTEST NETHODS
6.1 SECTOR-COMBUSTORTEST RIG
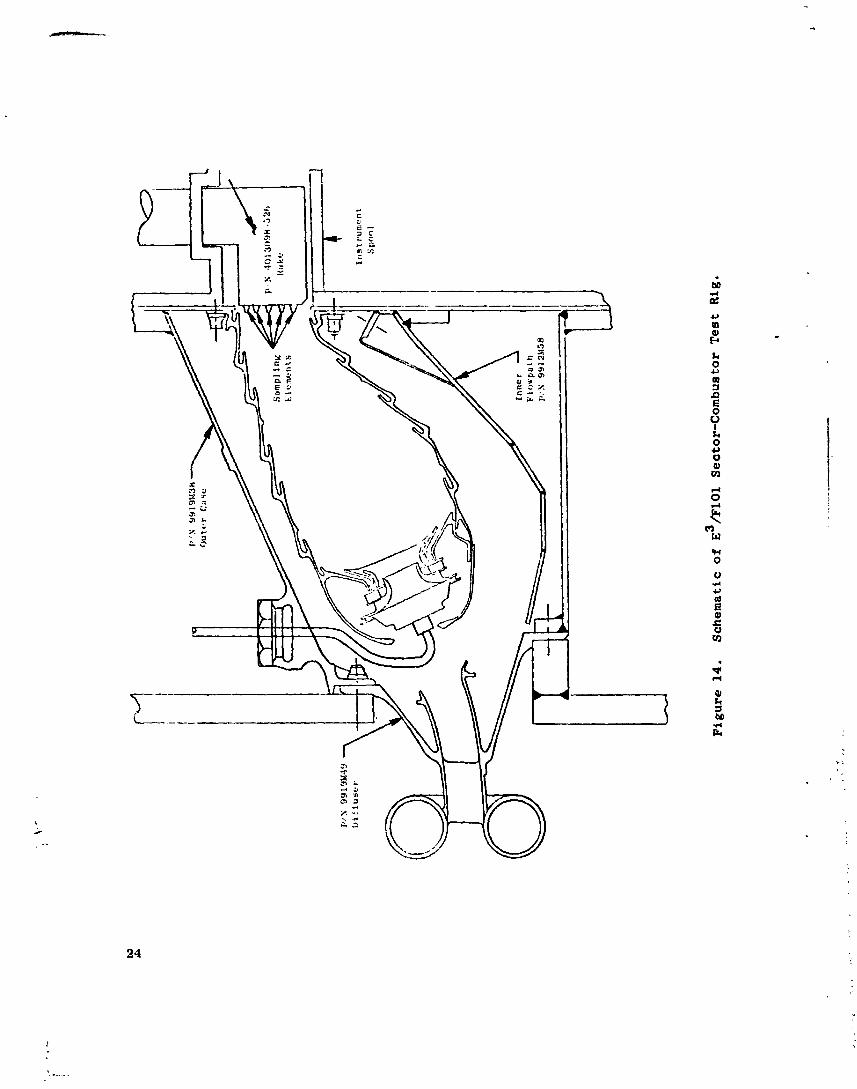
Evaluations of the nine sector-combustor configurations were conductedin a test rig that duplicated the aerodynamic flowpath and envelope dimensionsof the FI01PV engine combustor. The sector test rig consisted of an inletplenum chamber, an inlet diffuser section, a housing for the sector combustor,and an instrumentation section attached to the exit of the combustor housing.The test rig was designed to house a five-svirl-cupm 90" sector combustorwith the capability to operate at inlet conditions up to 0.405 NPa (four atmos-pheres) pressure and 800 K temperature. A schematic illustration and a photo-graph of the sector combustor test rig are presented in Figures 14 and 15.
The inlet plenum section of the test rig is attached to the test facilityair supply. Inside of the inlet plenua the flow is straightened by a singlescreen before it enters the sector diffuser passage simulating the compressordischarge of the FIOI engine. The diffuser section is a standard FIO1 dif-fuser design. The combustor housing section consists of a 90" sector of a
standard FtOI combustor casing. Fuel tubes from the five fuel injectors areled out of the casing through five equally spaced injector ports. Fuel issupplied to all five injectors through a manifold system. The instrumenta-tion section is equipped with installation ports to house fixed rake assem-
blies for obtaining measurements of combustor exit temperatures and pressures.Gas samples for emissions measurements are obtained by means of rakes mountedin these ports.
The test rig instrumentation consisted of various pressure probes andthermocouples plus the fixed-rake, gas-sampling system. Pressure measurementsincluded the diffuser-exit total and static pressures (to measure the sector-combustor inlet pressures), dome upstream total and static pressures plus
downstream static pressures (to measure the combustor-dome pressure drop), andliner static pressure_ (to measure the inner- and outer-passage pressurelosses). Total pressures at the sector-combustor exit were measured by theprobes located in the fixed-rake, gas-sampling system.
Temperature measurements included diffuser-exit air thermocouples, tomeasure the sector-combustor-inlet gas temperature, and numerous skin thermo-
: couples to measure sector-combustor metal temperatures. Several thermocouples"_ were located in the instrumentation section to measure the temperature of the b_4
ii gases entering the exhaust section of the facility.| Sector-combustor exhaust-gas samples were extracted through two rakes,' located in the instrumentation section of the test rig shown in Figure 15.
Each rake has five sampling elements spaced along the leading edge. These :rakes are station_ry, and the elements can be individually sampled or umni-
folded together to provide a radial-average sample. All five sampling ele-! ments of each rake have quick-quenching probe tips. Both water cooling of
: 23
1980024900-031
1980024900-032
the rake body and steam heating of the sampling lines within the rake areused. A photograph of one of these rakes is shown in Figure 16. A sche-matic of a typical rake sampling element is presented in Figure 17. The tipof the sampling elements is designed to quench the chemical reactions of theextracted gas sample, as soon as the sample enters the rake, to eliminatefurther chemical reactions within the sampling lines. Water cooling of therake body is necessary to maintain mechanical integrity in the high-tempera-ture environment created by the combustion exhaust gases. Steam heating ofthe sampling lines within the rake is necessary to prevent the condensationof hydrocarbon compounds and water vapor within the sampling _ines. An illus-tration of the locations of the various instrumentation within the test rig
is presented in Figure 18.
6.2 SECTOR-COMBUSTORTEST FACILITIES
All developmental emissions testin8 of the E3/FIOI single-annular sectorcombustor was performed in the Advanced Combustion Laboratory facility locatedat the General Electric Evendale plant. This facility is equipped with theinlet ducting, exhaust ducting, arid instrumentation necessary for conductingsector-combustor tests. The range of operating conditions obtainable in thisfacility is limited because of the airflow and heater capacity currently avail-able. Airflow levels up to 2.8 kg/sec can be supplied to the facility from alarge compressor, plus an additional 1.8 kg/sec can be supplied by the shop-air system. Combustor inlet air temperatures above ambient are obtainedusing the facility liquid-fueled, shop-air-supplied, indirect prebeater. Thepreheater has the capability to heat 1.35 kg/sec airflow to 800 K. The JetA type fuel used in all of the E3/F101 single-annular tests was supplied tothe sector-c_ubustor test rig by a pipeline from storage tanks located adjacentto the facility. Instrumentation cooling and exhaust-gas quenching were accom-plished using the facility domestic water supply with pressure boost wherenecessary.
Test conditions were monitored using the facility instrumentation. Air-flows were monitored by manometer readings of pressure drops across standardASHE thin-plate orifice meters in the air supply lines. Fuel flows weremetered by turbine-type flo_meters with signals input to electronic frequencymeters. Test rig pressures were also monitored by manometer readings. Test
rig temperatures were indicated by self-balancing potentiometer recording in-_traments. All configurations tested in this facility were installed andope_'sted by skilled laboratory technicians under the direct supervi_ion of
-- EnKineering .
To measure emissions, the facility is equipped with a CAROL I (Contaml-
*- nants Are Read O_n_ine) gas-analysis system. This system consists oTthefollowing instruments:
• Beckman Hodel 402 Total Hydrocarbon Analyzer (Flame IonizationDetector)
• Beckman Hodel 315-A Carbon Honoxide and Carbon Dioxide Analyzer(NDIR)
S6
1980024900-034

"11
•-: O_IGIIvALOl,'_,- ' _AG•-oOR ,,,,, _ 18
Figure 16. Outck-Quench, Oas-SampltnB Rake. _uALFI_
27
1980024900-035

late Structure
Leading Edge of Probeor Rake Body
Stainless Steel
Sample Tube
0.10 cm
!
_'0.25 cm
Copper Tip
Cooling 5teanWater Heating
_290 - 310 K _450 K
Figure 17. Gas-Sampling Probe Tip Cross Section.
28
1980024900-036

1980024900-037

s Beckman Model 915 NOx Analyzer (Chemiluminescence with Converter,Water Trap required)
Extracted exhaust-gas samples were transmitted into this analysis equipment,and the measured emissions levels were recorded on strip charts. An adequatesupp!y of bottled calibration gases for the CAROL system was maintainedthroughout the testing. A qualified technician calibrated and operated theCAROL system throughout the duration of data acquisition for each emissionstest.
6.3 SECTOR-COMBUSTOR TEST PROCEDURES
The sector-combustor tests were directed at identifying combustor fea-tures designed to obtain low emissions of carbon monoxide and unburned hydro-
carbons. Test conditions were designed to simulate the E 3 combustor cold-dome velocity; this is believed to be a controlling factor in the CO and HCemissions characteristics.
A _ubstantlal data base exists that confirms a dependence of NOx emls"-sions on combustor bulk residence time. A similar dependence of CO emissions
on combustor bulk residence time at low-power operating conditions has notbeen established. In general the CO emissions tend to be most affected bythe dome airflow conditions, in particular the cooling and swirl-cup airflows.Therefore, the parameter selected for simulation in the E3/FI01 sector tests
was the combustoc cold-dome velocity. A more representive parameter might bethe hot-dome velocity since a similar parameter has been used on other, conven-
tional, single-annular combustors to identify CO emission trends. However,since fuel/air ratios directly affect the gas temperature, the dome velocitybecomes a test variable.
The E3 Flight Propulsion System (FPS) baseline operating cycle wasestablished using initial engine component performance estimates. This cycledefined combustor operating conditions during the initial portion of the al-ternate combustor effort. Later, however, revised estimates of the engine highpressure compressor perfvcmance indicated a significant reduction in compres-
sor efficiency at the low-power operating conditions. This led to a redefi-tion of the EJ operating cycle in July 1978. The revised cycle providedthe combustor operating conditions used during most of the baseline testing.A comparison of the combustor operating conditions for the baseline and the
: revised cycle is shown in Table V. It is observed from this teble that therevision of the E3 operating cycle produced significant changes in the com-bustor operating conditions at the low-power points; however, no changesoccurred at the higher power points.
Sector-combustor Configurations SA-00 through SA-02 were evaluated at in-let conditions corresponding to 4X, 6X, and IOOZ of sea level takeoff thrustfor the E3 FPS baseline cycle. Configurations SA-03 and SA-04 were evalu-
ated at 4Z and 6X of sea level takeoff thrust for the FPS baseline cycle plus4Zj 6X, and IOOZ of ses level takeoff thrust for the July 1978 revised E3
3O !
I
l
1980024900-038
_1 C_O 0 0 (:3
U
0 _
.M
0 ,_u
0
f_
°
g _
31
1980024900-039
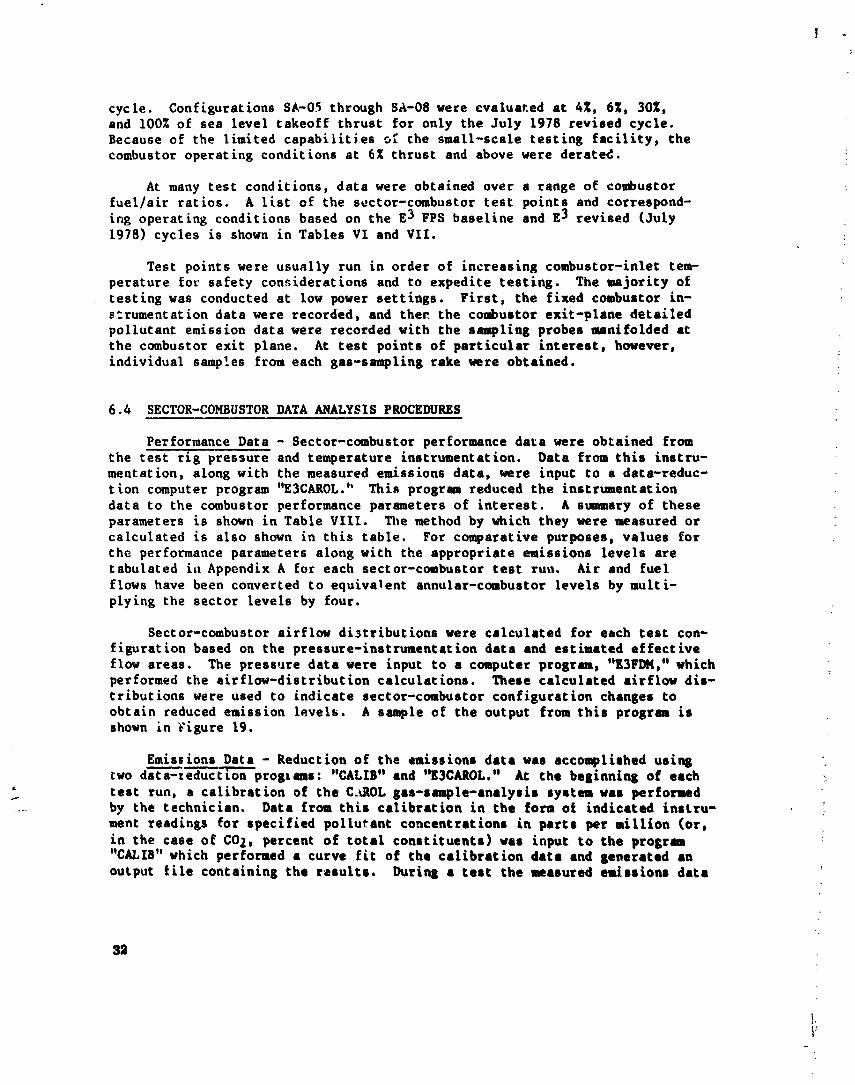
cycle. Configurations SA-05 through SA-08 were evaluated at 4Z, 6Z, 30Z,and 100Z of sea level takeoff thrust for only the July 1978 revised cycle.Because of the limited capabilities o_ the small-scale testing facility, thecombustor operating conditions at 6_ thrust and above were derateg.
At many test conditions, data were obtained over a range of combustorfuel/air ratios. A list of the sector-combustor test points and correspond-
ing operating conditions based on the E3 FPS baseline and E3 revised (July1978) cycles is shown in Tables Vl and Vll.
Test points were usually run in order of increasing combustor-inlet tem-perature for safety considerations and to expedite testing. The majority oftesting was conducted at low power settings. First, the fixed combustor in-s=rumentation data were recorded, and ther the coubustor exit-plane detailedpollutant emission data were recorded with the sampling probes manifolded atthe combustor exit plane. At test points of particular interest, however,
individual samp!es f_om each gas-sauq_lLng rake were obtained.
6.4 SECTOR-CONBUSTORDATA ANALYSIS PROCEDURES
Performance Data - $ector-combustor performance data were obtained fromthe test rig pressure and temperature instrumentation. Data from this instru-mentation, along with the measured emissions data, were input to a data-reduc-tion computer program "E3CAROL." This prosram reduced the instrumentationdata to the combustor performance parameters of interest. A summary of theseparameters is shown in Table VIII. The method by which they were measured orcalculated is also shown in this table. For comparative purposes, values forthe performance parameters along with the appropriate emissions levels aretabulated i, Appendix A for each sector-combustor test run. Air and fuel
flows have been converted to equivalent annular-combustor levels by multi-plying the sector levels by four.
Sector-combustor airflow distributions were calculated for each test con-
figuration based on the pressure-instrumentation data and estimated effective
flow areas. The pressure data were input to a computer program, "E3FDI4," whichperformed the airflow-distribution calculations. These calculated airflow dis-
tributions were used to indicate sector-combustor configuration changes toobtain reduced emission levels. A sample of the output from this program isshown in Figure 19.
Emissions Data - Reduction of the emissions data was accomplished using_wo data-_educt_on progtms: "CALIB" and '_3CAROL." At the beginning of eachtest run, a calibration of the C._ROL gas-sample-analysis systenwas performed
.... by the technician, Data from this calibration in the form o[ indicated instru-ment readings for specified pollutant concentrations in parts per million (or,
in the case of CO2, percent of total constituents) was input to the progrmn"CALIB" which performed a curve fit of the calibration data and generated anoutput Lile containing the results. During a test the maasured emissions data
32
1980024900-040

• Building 306 Facility
• Jet A Fuel
• Air and Fuel Flows are for _0 ° Sector
Table VI. Sector-Combustor Tea Poln_s
for E3 FPS Baseline Cycle.
T,,t O..tins T3, P:,, ' Oc, IPoint Condition K Arm kg/sec I f/a kg/hr
1 4% Base 448 3.16 2.24 0.0090 72.4
2 4% Base 448 3.16 2.24 0.0117 94.2
3 4% Base 448 3.16 2.24 0.0160 12S._4 _% Base 448 3.16 2.24 0.0200 161.05 4% GrouCh 472 3.40 2.48 0.0090 80,2
6 4Z Gtovth 472 3.40 2.48 0.0117 107.97 4% Grovth 472 3.40 2,_8 0.0160 142.68 4% Gro_h 472 3.40 2.48 0.0200 178.3
9* 6% Base 485 3.40 2.39 0.0090 77.3
10" 6% Base 485 3.40 2.39 0.0120 103.011" 6% Base 485 3.40 2.39 0.0160 137.412" 6% Base 485 3.40 2.39 0.0200 171.8
13" 6% Growth 511 3.15 2.27 0.0090 73.514* 6% Gro_h 511 3.15 2.27 0.0121 98.8
15" 6% Growth 511 3.15 2.27 0.O160 130.616" 6% Growth 511 3.15 2.27 0.0200 163.317" SLTOBase 783 2.50 1.36 0.0244 119.5
Table VII. Sector-Combustor Test Points
for E 3 July 1978 Cycle.
Test Operating T3, P3, Wc, - t_:,Point Condition K Arm kglsec Wc/P3 fla k_/hr
1 4% Idle 478 3.12 1.94 16.55 0.0080 $5
2 4% Idle 478 3 12 1.94 1_.$5 0.0!20 833 4% Idle 478 3.12 1.94 16.55 0.O158 1094 4% Idle 478 3.12 1.94 16.55 0.0200 139
5 4% Idle 478 3.12 1,94 16.55 0.0240 1666" 6% Idle 508 3._4 2.24 16.85 0.0080 64
7 6% Idle 508 3.54 2.24 16.83 0.0110 888 6% Idle 508 3.54 2.24 16.85 0.0143 115
9 6% Idle 508 3.54 2.24 16.85 0.0180 144
10 6% Idle 508 3.54 2.24 16.85 0.0210 i68
11" 10% 54_ 3.54 2.30 17.32 O.OOBO 66_ 12 10% 545 3.54 2.30 17.32 0.0123 102
• t, 13 10% 545 3.54 2.30 17.32 0.0160 132J 14 10% _$ 3.54 2.30 17.32 0.0200 166
15 10% 545 3.54 2.30 17.32 O.0240 199
16" 30% APP 633 3.03 1.81 15.97 0.013_ 91
17* 100% SLTO 783 2.68 1.36 13.54 0.0244 120
*Conditions derated to facihty limit,
33
1980024900-041

34
1980024900-042

^II_FLOA JIS*[RIotJEI')_ ANALY_I_ FOil _.3 SECI'()_ C()..IBUSI'()R
qUfER LINER PA55_GE PI_ES5URES-PfiIAP _,qELI ('3) PANELI ( I ) P_i_EL2 PANEL3 P _qEL4 PANFL5
44 ,,,l 13 43. O'ir_ 44 .. i 37 44.6r)4 a4. _t)O 44.097
qUEER FI_(_P_TH PRESSURES-PSIAPAI_ELI PANEL2 P A.NEL3 PANEL4 PA,_4EL542.835 4Z. 78(_ 42.737 42.51b 42.295
IN,_ER LINER PASSAGE PRESSURES-PSIAPA.,IELI (0) PA.'4ELI ( I ) PAt,IEL2 PANEL3 PANIC.4
43.807 43.474 43.9lb 44.35_ 44.702
IIaNER FLO,tPAT'4 PRESSUR_.S-PSIAPA,4EL1 PANEL2 PARCEL3 PANEI_442°835 42,.014 42.393 41.95[
Du_E PRESSdqES-PSIAUPSTR EA*, DO,'|I_SfREAM45. 783 42.FJII
OU[ER LINER AIq, LO_,$-PPSRI._GI RINL_2 RI,_S3 RING4 RIti_5 RIi4Go DIL-I DIL-2 DIL-3 DIL-43. 0.433 0.478 0.326 0.309 r).193 I.871 O. 2.84R O.
13 PERCENf OF _CO. 2,52 2.78 I.90 1.8r) 1.13 I0.00 O. IO.5R O,
limNER LINER AIRFLOw,S-PPSRINGI RING2 RI_IG3 RINd4 RI;4G5 DIL-I DIL-2 DIL-3 DIL-4O. 0.359 q.5")3 0.573 0.411 1.808 '}. 2.785 '}.
It',PERCENT (IF ,,CO. 2.(39 2.93 3.34 2.40 IC).5.'{ O. 16.2_ '3.
D(WE AIRFLr_S-PP5COqLING DILUTI(IN 5_iRLCP OUTER RING INNER RING
3.7_[ 3. 3.492 ,3. O.
It_PERC=NT _IC4.55 '3. 20.34 O. O.
AIRFLt_N SET-PP_=t 7.033
- ' ._IRFLOII _tCC(XI,i'fED-PPS=I7,172
PERCENT OF AIRI'LO#(SEf=lqO,817
Figure 19. Sample Output from Program E3FDM,
35
I
1980024900-043

were recorded _n chart recorders contained within the CAROL system. The emis-sions data were also recorded o_ test log sheets. Following the completionof each test run, the emissions data along with the sector-combustor perfor-mance data were input into program **E3CAROL.'* By accessing the calibration
_ile generated by program "CALIB," the reduction of the raw emissions data toemissions indices was performed by program "E3CAROL." The equations used inthese calculations were those contained in SAE ARP 1256 (Reference 4) andshown below.
2.S0l [coi
,%, oe,Z'c°" 12.Ol• 1.oogO.lOOlucl
EIHC = [ lcol + fnc]\ g/ksFuel
4.601 [NOx]
El.-( [_]),[CO]Io4 + [HC], glkg Fuelx 12.ol*1.oog "Ic°21In these equations the concentrations of CO, HC, and NOx are in parts permillion; CO2 is in percent of total constituents. In the calculations,the CO and CO2 concentrations were corrected for the removal of water fromthe sample prior to analysis. A fuel hydrogen-to-carbon atom ratio of 1.92,representing Jet A fuel, was used in these calculations. Calculated combus-tion efficiency, sample fuel/air ratio, and an overall emission index werealso obtained from the data reduction through program "E3CAROL." The overallemission index represents a weighted average of the values obtained from eachindividual gas-sampllng rake and is defined as follows:
N
(EIj)i * (FIA Sampled) ii-l
EI. (Overall) -j N
E (F/A Sampled) ii=l
: The (j) subscript refers to the identity of the emissions (CO. HC. or NOx),: and the (i) subscript refers to the individual rakes where (N) represents the
total number of gas-sampling rakes. Expressing the average of the emissions
- in this form reduces the influence of very lean combustion zones within the
_" combustor where the concentrations of gaseous pollutants are low (which may: result in calculated emissions indices that are quite high). These weighted-
average emissions values are presented in the numerous data tables and figuresthroughout this report. A sample of the outputs from programs **CALIB" and"E3CAROL'* are shown in Figures 20 and 21.
Because the sector-combustor inlet pressure and airflow were derated at
the simulated hxgh-power operating conditions, the measured emissions levels
36
1980024900-044
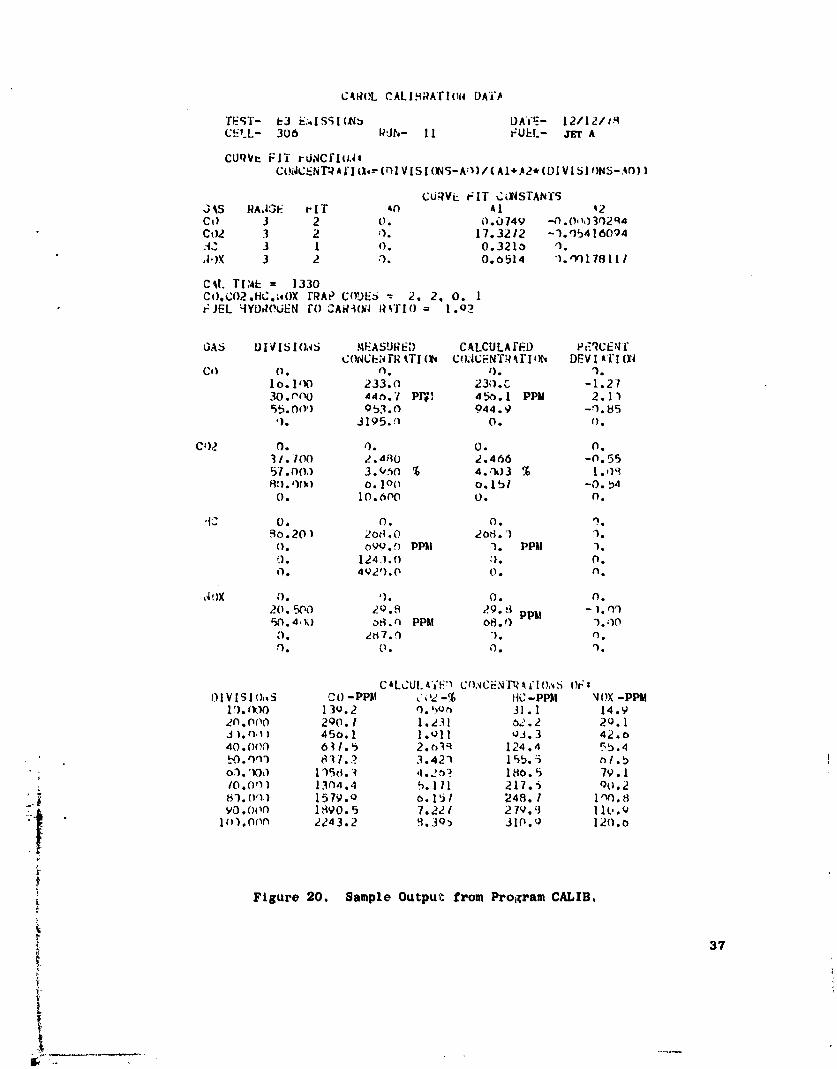
C_(;L CALIHRA'FION DA'i'_
Tb_'_]- _3 E:.,ISqlUN_ D^f=_ - 121121#qC_t.L- 306 P'Jh- II FUhL- a_r A
CUqVt: FIT rONCflu._sCOi4C._NT_AfI 0,-- (hi VIS l ()NS-A,I) / ( ^1+#,2, (DI V l 5I ONS- .e,c)) }
CORVi. FIT CdNSTANf5J_S RA,;;_E PIT AO AI _2Ct) 3 2 O. 0.074_ .-(1.0,_0 3Q<tq4Ct}2 3 2 '). 17.3212 -'}._b416094-12 3 1 o. 0.321o _.N.IX 3 2 :1. 0.o514 "}. o')11811 i
C_I. rI:4_ = ]330C().CO2.HC.a_OX tRAP (;()DES-- 2. 2. o. I6JEL _IYDROGEN fO CAK4(h'4 R_'I'IO= l.O.u_
GAS DIVlSlOa5 ._tEASURED CALCULA fF.D Pt_RCE,_fCONChI_i'R_TI (_N CO:4CENT.R_IION DEV IArl (xl
cd O. O. t). q.lo. l,lO 233.0 23;).C -1.2730.P(_O a4.,_.'lpp;, 45o.1 PPM 2.1")55.0()'} 053. {') 944.9 -.'3. U5'). 3195.:_ O. O.
Ct)_ O. O. O. O."]I. 700 2. a,qO _. 4 66 -n. 5557.00,} 3.UhO 'g 4.,")03 % 1.,lqa:). Of),) o. 1o(_ o. 1bl -0. b4O. lO.bO0 O. n.
qC O. O. O. ").._o. 20 ) 2o_. 0 208. "} "}.
O. OVV. f) PPM 3. PPl! 3.(]. 124,).(} :). O.O. 4U2'}.0 O. rl.
,_',)X O. '). 0. (1.
20..r'W_O 20.8 29.8 PPM - }"0'3r_O.4' _;} 38.q PPM 08.0 "1._I0,'3. _7._ "). o.
CALCUI.at'F._CO.WCENTt_'IO,,,.'iOFtDIV[5| 0,,5 CO -PPM ,."02 -% HC-PPM _lOX-PPH
It).(k10 130.2 r). ,>o_ 31. I 14.92o.000 200. I 1. ,t31 02.2 20.1j ). n_ ) 45o. 1 1 .Ol I oj. 3 42. o40.0o() 6 _ I.5 2.o'¢q 124.4 _b.4.'cO..on') 817._ 3.423 15% :5 e,l.b
; 03. 'X},I l tSd. _ ,l.2_ _ 180.5 79.1
: IO.Oq) 1.3n4..1 b. 111 217. "_ 00.2_._ _ ).(v_! 1579.o o. 15 l 24B. l l'_.8
VO.OO0 1890.5 7.22 1 27v.9 ! ll,.O
LIt Io1. Oon 22a 3.2 9.30 _ 3 lO. o 12o. o
't Figure 20. Sample Output from Pro_iram CALIB.
] 980024900-045

TEST - E3 SA-08 DAT_ - 12/7/713CELL - 306 RUN - If) FUEL - JET ACAL TIME " 1750 FUEL H/C = 1.92
RDG FJ POINT 8
P1 REF DP/P DPIP FLr)b_FCTN FUEL/AIR T3 AI RFL(_VEL RAT I0
Tr)T_L FTISEC C(_B DOME SQUARED _IETERED DFG-R PPS
51.92 70.27 0.0747 0.0701 137.258 0.0140 913.7 5.0311
*** ME'TRIG ***
_TM M/SEC CM**4-DEG-K/SEC**2 DEG-K KG/SEC
3,570 21.418 660.039 507,6 2,2821
ACTUAL GAS ANALYSISRAKE rIME CC C02 HC NO NOX SMOKE
SEMI-DR ! SEM I-DRY _WET DRY DRY NUMBER(PPM] (PCT) (PPM) (PPM) (PPM)
OX 0 2020 415.2 3.04 12.5 35.8A I 2020 449.1 3.12 12,5 3o, 5B 2 2020 373.8 2,93 10.9 35.1AUG 411.4 3.02 II,7 35.8
CALCUI)ATED E¼15SION$ LEVELSRAKE rI_E CO HC NO NOX F/A COMB
******* LHS/InPO LBS FUEL ******* SAMPLE EFFGX 0 2320 27,0 0.4 3.8 0.01466 o9.33A 1 2320 28,5 0.4 3.8 0.01503 09.29B 2 2020 25.3 (_.4 3.9 0.01412 09.37AVE 26,9 0.4 3.8 0.01457 09.33
OVERALL AUG 2/.0 0.4 3.8 0.01457 09.33
E_ISSI(_5 ADJUSTED TO ENGINE CYCLE C(_DITI(_SEICO EIHC EINOX C(_B, EFF.******* LBS/IO00 LBS FUEL *******
22.95 _.30 4.01 0.9943
Figure 21. Sample Output from Program E3CAROL.
38
1980024900-046

were adjusted to the actual engine cycle conditions. The adjusted emissionslevels are tabulated in Appendix A for all configurations tested at higherpower operating conditions; adjustment relations ate defined in Appendix B.
6.5 FULL-ANNULAR CONBUSTORTEST RIG
The E3/FI0I full-annular combustor evaluations were conducted with an
existing FI01 full-annular combustor test rig. This test rig exactly dup11-cares the aerodynamic combustor flowpath and envelope dimensions of the FIn1engine. The test rig consists of an inlet plenum chmuber, an inlet diffusersection, and a housing for the combustor. Included as part of this rig is anexit-plane, fixed-rake assembly for obtaining measurements of combustor outlettemperatures and pressures and extracting gas samples.
A photograph of the test rig is presented in Figure 22. The combustortest rig is basically a cylindrical pressure vessel designed for high-tempera-ture service and fitted with inlet and exit flanges. The rig is equipped withports and bosses to accommodate fuel nozzles/injectors, igniters, and borescopeinspection. These ports are located exactly as in the engine design. The rigis also equipped with provisions to extract both turbine cooling air and cus-tomer bleed air. These provisions also duplicate those in the engine.
The air inlet connection of the test rig consists of an 81.3-cm diameter
pipe flange, of special design, bolted to the alr-supply plenum of the testcelt. In the supply plenum, the flow is mixed and then straightened by gratesand screens. Within the test rig, a bullet-nosed centerbody directs the enter-ing airflow into an annular passage. This annular passage simulates the com-pressor-discharge passage of the engine. The inner and outer walls are formed
to the contour of the engine diffuser, and the gap is spanned by streamlinedoutlet guide vanes similar Co those in the engine. Aft of the step diffuser,the centerbody forms the inner wall of the combustor housing. The outer wall
is provided with ten l.l-cm diameter bleed ports, through which a portion ofthe airflow can be extracted as turbine bleed air. Additional ports are pro-vided on the inner wall to simulate turbine rotor cooling-air extraction.The air extracted from these sets of ports is routed through two 2ol-cm pipesDforward through the centerbody nose, then radially out of the rig,
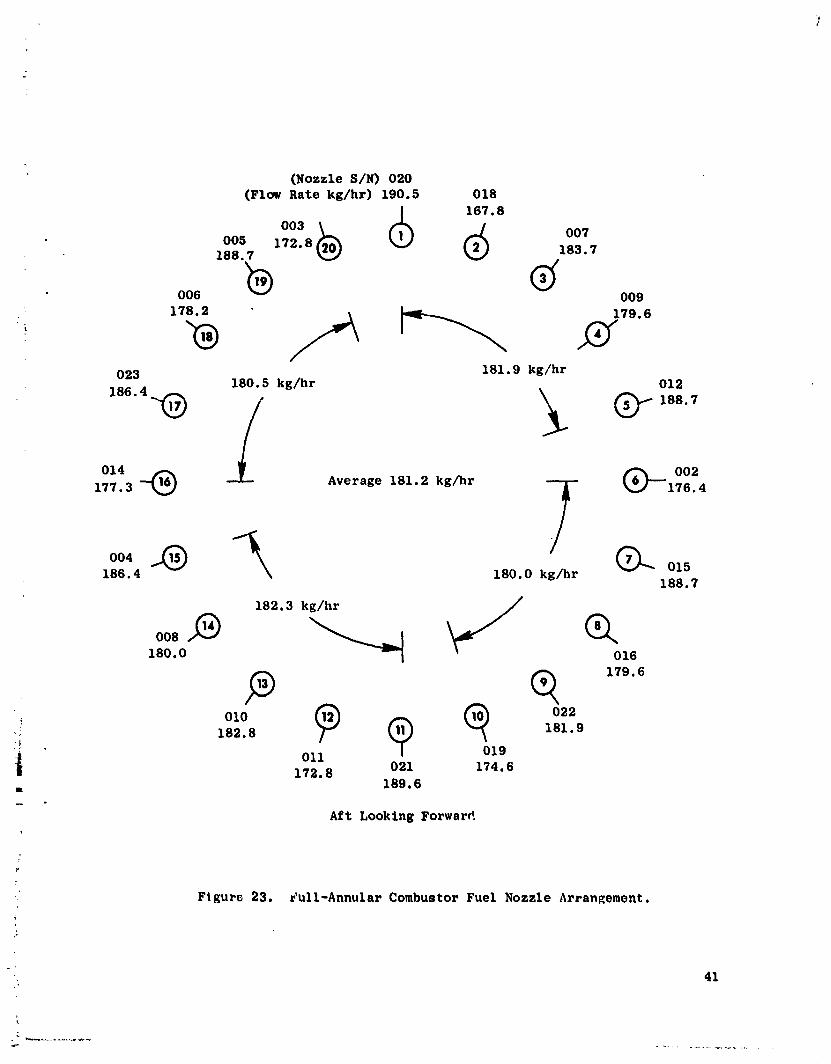
The combustor test rig is equipped with 20 fuel injector ports spaced18" apart. The fuel injectors used in this program were all installed through
:, these existing ports. Fuel was supplied to the injectors through a 1,6-cm_ diameter Cube manifold. Hetering of the fuel occurred at the simplex nozzle
tip, To assure a uniform fuel distribution_ each of th_ 20 fuel injectorassemblies was calibrated prior co the test, Typical calibration results areshown in Table IX. Adjustments Co the circumferential locations of the fuelnozzles in the combustor were made to obtain as uniform a fuel distribution as
possible, The arrangement used in the test is shown in Figure 23.
39
1980024900-047

Figure 22. Full-Annular Combustor Test Rig.
ORIGINAL PAGE ISOF POORQUALITY
4O
1980024900-048
(Nozzle S/N) 020(Flow Rate kg/hr) 190.5 018
(_ 16_.8003 _ 007OO5 172.8
188.7 183.7
ooo_ 0O9
023 181.9 kg/hr180.5 kg/hr 012
014 ___177.3 --_ Average 181.2 kg/hr _ 002
176.4
oo,_ _186.4 180.0 kg/hr 015188.7
182.3 kg/hr _// (_008_180.0 016
oo 9 Q o182.8 181.9;_ 019
011172.8 021 174.6.. 189.6m
Aft Looking Forward
Figure 23. £ull-Annular Combustor Fuel Nozzle Arrangement.
41
t
1980024900-049

Table IX. Full-Annular Fuel Nozzle Calibrations.
Flow Rate - kg/hrNozzle Tip at AP of Spray Quality
Serial Number 6.80 Arm 40.83 Arm at 6.80 Arm
016 71.2 179.6: Satisfactory022 73.1 181.9 Satisfactory
008 71.0 180.0 Satisfactory005 76.1 188.7 Satisfactory
013 (Spare) 75.4 188.7 Satisfactory007 74.1 183.7 Satisfactory
: 003 70.3 172.8 Satisfactory015 74.7 188.7 Satisfactory020 75.7 190.5 Satisfactory006 71.0 178.2 Satisfactory021 74.8 189.6 Satisfactory011 69.5 172.8 Satisfactory014 70.8 177.3 Satisfactory002 69.8 176.4 Satisfactory023 74.7 186.4 Satisfactory010 72.2 182.8 Satisfactory018 68.1 167.8 Satisfactory004 77.3 186.4 Satisfactory009 71.7 179.6 Satisfactory019 70.4 174.6 Satisfactory012 76.0 188.8 Satisfactory
The exhaust end of this combustor test rig is provided with a large-
diameter flange to which an instrumentation spool section can be joined. The
instrumentation spool section used in this program consisted of an existing,
short-flanged pipe with a ring incorporating mounting pads for gas-samplingrakes at specific circumferential locations. This instrumentation spool also
contains water-spray rings to cool the combustion gases downstream of the
measurement plane. A photograph of the instrumentation spool section withthe rakes installed is presented in Figure 24.
The full-annular combustor test rig instrumentation consisted of numerous ,
pressure probes and thermocouples plus the fixed-rakes gas-sampling system.
Pressure measurements included the diffuser exit total and static pressures,t
_- dome upstream and downstream static pressures, liner wall static pressures_" and total pressures at the combustor exit. Temperature measurements included
diffuser-discharge air thermocouples to measure the combustor inlet tempera-ture and numerous skin thermocouples to measure the combustor liner tempera-tures. Other pressure and temperature instrumentation monitored the test rigand facility.
42
1980024900-050

Combustor exhaust-gas samples were extracted through a fixed array of
sampling rakes mounted at specific circumferential locations in the instrumen-tation spool. A total of six rakes was used for obtaining gas samples; twoof these were also used for obtaining smoke samples. Two additional rakeswere mounted in the instrumentation spool to measure the combustor exit totalpressures. The gas-sampllng rakes employed were identical to the samplingrakes used throughout the sector-combustor testing and are shown in Figures 16and 17. All five sampling elements of each rake were manifolded to provide asingle gas sample from each of the six rakes used. This array of six samplingrakes was connected to the gas-a_lalysis system in a manner that allowed anal-ysis of a single "ganged" sample obtained simultaneously from all six rakes.A schematic of the rake locatlon_ and piping is shown in Figure 25. A summaryof the rig instrumentation employed for this test is presented in Table X. Anillustration of the locations of the combustor instrumentation is shown in
Figure 26.
Table X. Combustor/Rig Instrumentation.
Parameter Instrumentation
Total Airflow Standard ASME Orifice
Fuel Flow Turbine Flow Meters
Fuel Injector Pressur_ Drop Pressure Tap in the Fuel Manifold
Fuel Temperature Ther_,ocouple in Fuel Manifold
Diffuser Tnlet Total Pressure 2 One-Element, Fixed-Impact Rakes
Diffuser Inlet Total Temperature 6 Thermocouples on 2 Three-Element Rakes
Combustor Exit Emissions l.-vels 6 Five-Element Impact Rakes
Combustor Exit Total Pressure 2 Slngle-Element Rakes
Combustor Metal Tc:pcrat,_re 26 Thermocouples on Liners
Inlet Air Humidity Level Dew Point Hygrometer'
J
_. Combustor Passage Static Pressure 5 Wall Taps in Each Passage (I0 Total)
Combustor Dome Pressure Drop 4 Pressure Taps
44
1980024900-052

1980024900-053

46
1980024900-054
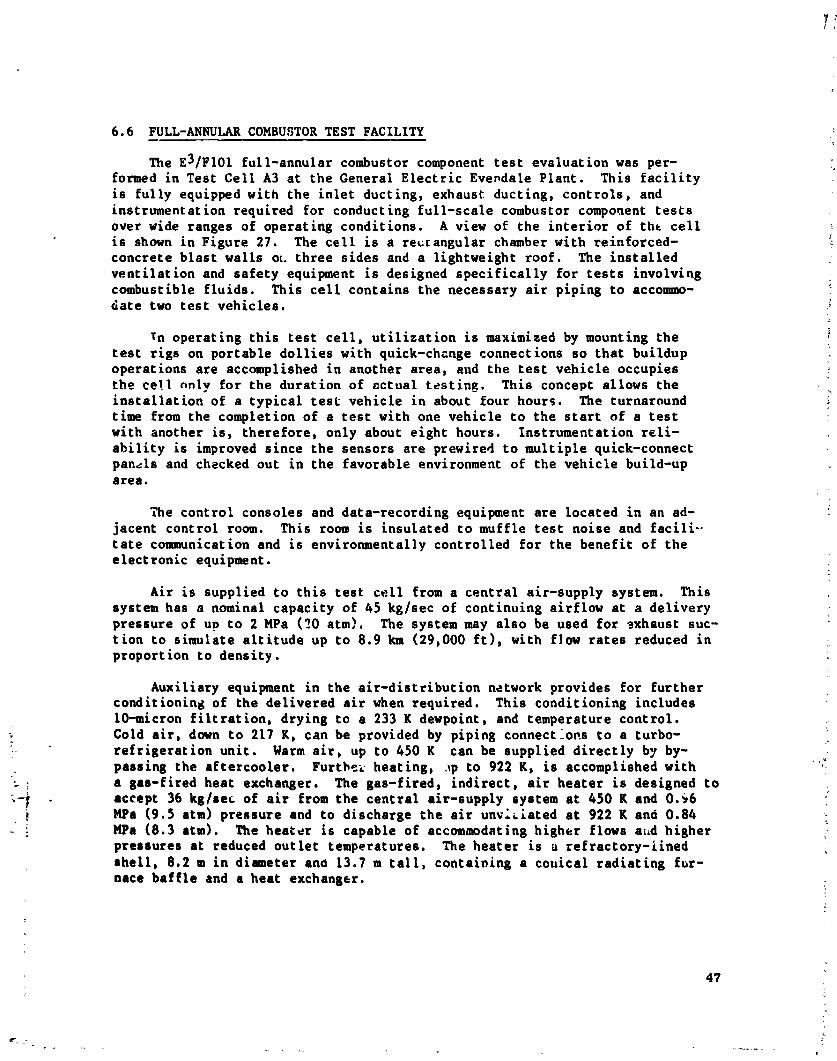
6.6 FULL-ANNUIAR COHBUSTORTEST FACILITY
The E3/F101 full-annular combustor component test evaluation was per-formed in Test Cell A3 at the General Electric Evendale Plant. This facilityis fully equipped with the inlet ducting, exhaust ducting, controls, and
instrumentation required for conducting full-scale combustor component testsover wide ranges of operating conditions. A view of the interior of th_ cellis shown in Figure 27. The cell is a rectangular chamber with reinforced- _concrete blast walls oz. three sides and a lightweight roof. The installedventilatlon and safety equipment is designed specifically for tests involvingcombustible fluids. This cell contains the necessary air piping to accommo-date two test vehicles. /
Tn operating this test cell, utilization is maximized by mounting the _test rigs on portable dollies with quick-ch=nge connections so that buildupoperations are accomplished in another area, and the test vehicle occupiesthe cell only for the duration of _ctual testing. This concept allows theinstallation of a typical test vehicle in about four hours. The turnaroundtime from the completion of a test with one vehicle to the start of a testwith another is, therefore, only about eight hours. Instrumentation reli-ability is improved since the sensors are prewired to multiple quick-connectpan_Is and checked out in the favorable environment of the vehicle build-uparea.
The control consoles and data-recording equipment are located in an ad-jacent control room. This room is insulated to muffle test noise and facili -
tate communication and is environmentally controlled for the benefit of theelectronic equipment.
Air is supplied to this test cell from a central air-supply system. This
system has a nominal capacity of 45 kg/sec of continuing airflow at a delivery ipressure of uo to 2 MPa (20 atm). The system may also be used for _xhaust suc-tion to simulate altitude up to 8.9 Im (29,000 ft), with flow rates reduced in :proportion to density.
Auxiliary equipment in the air-distribution network provides for furtherconditionin_ of the delivered air when required. This conditioning includes10-micron filtration, drying to a 233 K dewpoint, and temperature control.Cold air, down to 217 K, can be provided by piping connections to a turbo-refrigeration unit. Warm air, up to 450 K can be supplied directly by by-passing the aftercooler. Furthe_ heating, _p to 922 K, is accomplished withf
a gas-fired heat exchanger. The gas-fired, indirect, air heater is designed to
_-! accept 36 kg/se_ of air from the central air-supply system at 450 K and 0._6NPa (9.5 atm) pressure and to discharge the air unvi_ated at 922 K and 0.84
: NPa (8.3 atm) The hea_er is capable of accommodating higher flows a_d higherpressures at reduced outlet temperatures. The heater is a refractory-linedshell, 8.2 m in diameter and 13.7 m tall, containing a cotlical radiating fur-
nace baffle and a heat exchanger.
4?
1980024900-055

48
1980024900-056

Combustors being tested in this cell can be exhausted directly to theatmosphere or can be connected to the facility Lxhaust system for pressurecontrol. When connected to the facility exhaust system, the combustor pres-sure can be regulated from the upger limit, imposed by the pressure or flowcapacity of the air-supply system, down to about 20 kPa (0.2 atm). Exhaustsuction is provided either by the centrifugal compressors of the air-supplysystem or by a two-stage, steam-ejector system with an interstage condenser.
Liquid fuels are supplied to Cell A3 from two large (114 m3), above-ground tanks. Each tank is provided with a centrifugal pump to transfer fuelthrough 10.2-cm pipelines. The high-pressure fuel pumps, located in Cell A3,boost the fuel pressure as high as 8.37 MPa (82.6 atm). The available fuelpressures and flows with these pumps were more than adequate for this testprogram; there was ample margin for meterin 8 and control.
The data-processin 8 equilx_ot penaanentty installed in Cell A3 includesa 90n-channel digital data-acquJ_Itlon system_ strlp-chart recorders forcontinuous recordin 8 of up to 24 test parameters, and displays of 22 pres-.=ures, 24 temperatures, and 4 fuel flows for use by the operators in control _ling test parameters, plus a small analog computer that is generally program-med to calculate airflows and fuel/air ratios. Portable equipment includes ateletype terminal for the time-sharing computers. The valves used to regulatefuel flows, airflows, combustor aic temperatures, and combustor air pressures
are remotely operated from the control room by means of pneumatic controls.
Throughout a combustor test, data are recorded by the digital data-acqui-sition system in the test cell. This apparatus scans each of the measuredparameters in sequence, controls the position of pressure scanning valves whenrequired, converts the amplified d.c. signal of the measurement to digit_!form, and record_ the value on a perforated paper tape suitable for input toth_ time-sharing computer through the teletype terminal. During each scan,the overall voltage accuracy is checked against a precision potentiometer chathas been calibrated in a standards laboratory. The digital voltmeter and Ion-level amplifier are of sufficient quality that voltages are accurate to O.02Zof full-scale in the 0 to lO-millivolt range.
All connections between data sensors and readout instrumentation, andall programming of the sequencing and control circuitry, are accomplishedthrough interchangeable program boards. Thus, each test setup includes aprewired, preprogrammed, front panel to aid rapid changeover from one cir-cuit configuration to the next.
To measure emissions, Lhe facility is equipped with a CAROL II gas-analysis system along with a standard OE filter-stain type smoke console.Current analysis instruments in the CAROL II system are:
s Beckman Nodel 402 total hydrocarbon analyzer (flame ionizationdetector)
49
-.
1980024900-057

• Beckman Model 315-B carbon monoxide and carbon dioxide analyzer(_oze)
a Beckman Model 951-H NOx analyzer (chemiluminescence withconverter, water trap required)
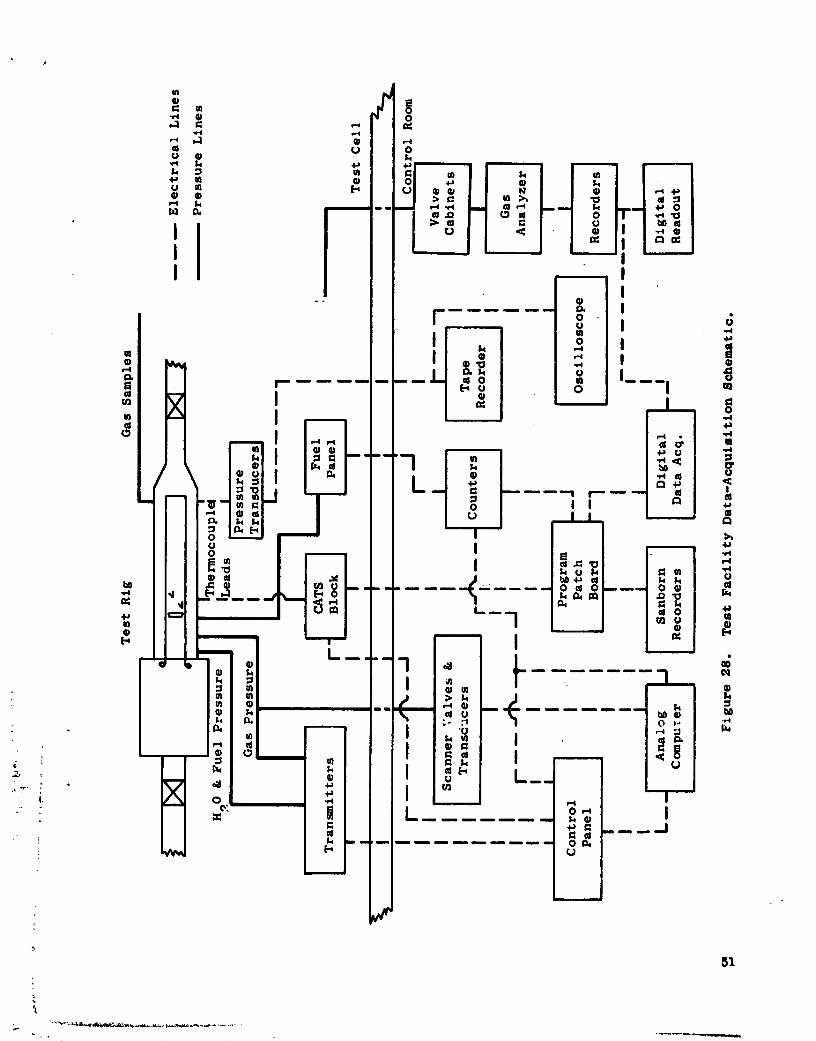
Cmtput from these analyzers is recorded on strip-chart paper, on hand-loggeddata-acquisition sheets, and is input directly into the facility data-acquisi-tion and processing equipment. Smoke samples are submitted to the CeneralElectric Instrumentation Data Reduction Facility, following the completion ofa test, for processing. A schematic of the _ell A3 facility data-acquisitlonins;allation setup is shown in Figure 28.
6.7 FULL-ANNULAR COMBUSTORTEST PROCEDURES
The E3/FI01 full-annular testing was directed at evaluatin 8 the NOx emis-sion characteristics. Therefore, test conditions for the full-annular coer-bustor were designed to simulate the combustor bulk residence times of theproposed E3 alternate combustor in an FIO1 combustor test vehicle operatingat the E3 cycle conditions.
The full-annular combustor was evaluated at inlet :onditions correspond-ing to 4Z, 6I, 30Z, 85Z, and lO0g of sea level takeoff thrust plus several
intermediate power conditions for the revised E3 July 1978 operatin§ cycle.Oata were also obtained at 4Z of sea level takeoff thrust for the EJ FPS base-
line operating cycle. The combustor inlet conditions at the 85Z and 100Zpower settings were derated to avoid exceeding the test facility capabilities.At the low-power conditions, data were obtained over a range of combustor fuel/air ratios. At the E3 July 1978 cycle conditions for 4Z, 6Z, and sea leveltakeoff, several test points representing variations in the combustor bulkresidence time were also evaluated. A list of test points and correspondingoperating conditions for the full-annular combustor test is presented inTable XI.
The test points were run in order of increasing combustor inlet tempera-ture for safety considerations and to expedite testing. As test conditiot, swere changed, the combustor pressure drop and the various combustor metal tem-peratures were monitored on multichannel strip-chart recorders to ensure thatthe established transient safety limits were not exceeded. When each test
: condition was set and stabilized, the data were recorded in two phases. Firstthe fixed combustor instrumentation (inlet air pressure and temperature, air-
flow, fuel flow, metal temperat.res, exit pressure, etc.) was recorded. Thena recording of the pollutant-emissions data st numerous positions in the com-
_'- bustor exit plane was made.
Smoke-emission levels were also measured at selected test points of in-
terest. At those conditions where smoke data were acquired, samples were ex-tracted from the combustor exit plane with tvo gas-sampling rakes. These _wo
1980024900-058
0
_1 _ II ._,/ I _1 /.:1
" °JI ,
il®_'l I= I,iI _ I I _ II
--- M_,,l Io I I
L_.I ° k----,,---I . _,
'. I_u I_1 I _ M.... _I I I I _ 0 _ 0 _ I_ 0 _ ,_
"1 _ .......
i® _ I, _ _ i _ i _ _ •
® _ =, I2, I
' _ "-r--
-" *" II L o _ I= .= _J
_ _ I I I
" .......... _ _ I
II
I
51
] 980024900-059

Table XI. Full-Annular Combustor Test Schedule.
Oper at ing T3, P3, Wc , t, SamplePoint Condition K Atm kg/sec f/a msec Conditions
1 4Z Ground Idle 448 3.16 9.30 9.0090 2.69 G
2 (FPS Cycle) 0.0016 I, S3 I | o.o16o c
4 I' II II 0.0200 Ir G5 0.0250 G
6 4X Ground Idle 478 3.12 8.45 0.0090 2.48 G
7 (July 1978 Cycle) i 0.0120 G8 0.0158 I, SI
9 I' 0.0200 G10 0.0250 _' G
II II I I 9.38 0.0160" 2.39 G12 9.91 0.0247* 2.27 G13 6Z Ground Idle 508 3.93 10.87 0.0090 2.46 G
14 (July 1978 Cycle) 0.0120 J G15 0.0143 I I, S
16 If 0.0200 _f C17 0.0250 _r G
18 I I r 12.12 0.0245* 2.39 G19 12.79 0.0246* 2.27 G
20 3OZ Approach 633 11.68 30.69 0.0100 2.35 G
22 0.0160 _, C23 85Z Climbout 782 16.33 37.26 0.0223 2.00 I, S
24 100Z Sea Level 814 16.33 36.24 0.0244 1.96 I, S
25 Takeoff t 15.88 t _ 1.90 G26 15.17 1.80 GA Intermediate 478 3.12 8.45 0.0158 GB 533 5.15 14.06 0.0125 G
C 589 8.34 22.3 0.0125 G
D 672 15.10 37.5 0.015b G
Z 728 16.33 39.5 0.0188 G
F 797 16.33 36.8 0.0235 G
*ROTE: Fuel/air ratio set to correspond to fuel/air ratio at which the mini-mum CO emissions occurred during the test condition series.
S -Smoke sample taken
G - Ganged emissions sample taken
I - Individual emissions samples taken
52
1980024900-060
sampling rakes were manifolded to provide a single sample to the smoke-measure-ment console. At least three smoke spots were taken at each test condition,and the SAE Smoke Number for this operating point was determined from the
average of the three spots judged most uniform from the samples taken.
6.8 FULL-ANNULARCOMBUSTORDATA-ANALYSIS PROCEDURE
Measured combustor performance and emissions data obtained at each testpoint were directly input to the Cell A3 facility data-acquisition equipmentwhere it was conve-ted to digital output. This digital output was then inputto a computer for reduction of the data to engineering units and emissionsindices. The reduced data from the computer were printed at a terminal sitelocated in the facility control room. Total time for the complete acquisitionand processing of data at each test point was generally accomplished in 10minutes or less.
Values for the various measured and calculated performance parametersalong with the appropriate measured and adjusted emission levels for eachtest point are tabulated in Appendix A. Because the combustor inlet condi-tions were defaced at the 85% and 100% power settings, the measured emissions
levels were adjusted to the actual engine cycle conditions using adjustmentrelations defined in Appendix B.
53
1980024900-061

7.0 DEVELOPMENTTEST RESULTS
7
7.1 SECTOR-COMBUSTORIDLE EI4ISSIONS
Idle emissions characteristics of the sector-combustor test configura-
tions were evaluated at conditions that pcovided a simulation of the colddome velocity of the proposed E3 single-annular combustor design. Testconditions above 4Z ground idle thrust were derated to avoid exceeding thesector-combustor test rig and facility capabilities. Gaseous exhaust emis-sions measured at these derated test conditions were adjusted to the actualE3 cycle conditions by employing the relations defined in Appendix B.
The discussion of sector-combustor idle emissions is in two parts. Thefirst part will present the results of those sector-combustor test configu-rations evaluated at the E3 FPS baseline cycle conditions (SA-OOD SA-01, and
SA-02). The second part will present the results of those test configurationsevaluated at the E 3 July 1978 cycle condition_ (SA-03 through SA-08). Prior
to completion of the sector-combustor testing program, a third engine-operatingcycle was defined and issued in October 1978. A comparison of the combustoroperating conditions for the FPS baseline, July 1978, and the October 1978 E3cycles is presented in Table XII. To maintain the continuity of the test pro-gram D the July 1978 cycle was retained for the remainder of the test programas the basis for test conditions. Because of the complexlty of adjustment toa common cycle, the emissions data are presented at the cycle conditions atwhich the sector-combustor configurations were tested. However, to provide aconvenient basis of comparison, emissions results in the form of the EPAparameter are presented in terms of the October 1978 cycle.
At the start of the test program, emissions data were obtained on a stan-dard FIOI PV sector-combustor configuration (SA-00). The geometry and air-flow distribution of this standard FI01PV combustor design were quite differ-ent than the proposed E3 combustor design. Therefore, this configurationdid not provide a close simulation of the E3 single-annular combustor cold-dome velocity. This test was conducted to obtain reference emissions data fora conventional, single-annular combustor design operating at the E3 cycleconditions. The CO and HC emissions levels obtained at ground idle for thissector-combustor test exceeded the goals as shown in Figure 29.
; The baseline E3/FI01 single-annular, sector-combustor configuration(SA-01) was designed to provide a close simulation of the proposed E3single-annular combustor primary-zone airflow distribution and cold-dome
/_ velocity using a modified F101PV sector combustor. These modifications werepreviously described and illustrated in Figure 6 of Section 4.0. HC emission
": results obtained with this baseline configuration were significantly reducedas shown in Figure 29. However, only a slight reduction in CO emission wasobserved; the CO emission levels remained well above program goals.
54
1980024900-062

o
Uu
• . . °
o _ _
o
0
_ _ _ _ o
u
m0 _ _
oM
oUM * • *
- 0 _ w o
0
0 _ '_
_ 55
i
]980024900-06

120I
• Design Cycle Fuel/Air Ratio
I00 l Configuration "
@
11 0 SA-OO80 Il n SA-Ol
-- Open Symbols:_. P3 = 3.16 Atm; T 3 = 448 K;
60 _ --- W36 = 7.71 kg/sec --
Required Level 3.5 g/kg Fuel--Closed Symbols:
_X P3 = 3.97 Arm; T3 = 485 K;W36 = 9,52 kg/sec40 t 4
_\ Required Level 3.0 g/kg Fuell
20 " , .,
120
£ I [! I :
I \ --Open Symbols:
I\ Required Level 26 g/kg FuelIO0 _ \_ - --Closed Symbols:Required Level 22 g/kg Fuel
e _o - "1 '" i\\O \
,o" 0 O.005 O.010 O,015 0.OZO O,025 O.030
Fuel/Air Ratio
Figure @9. Sector-Combustor ConflEurations SA-O0, SA-O1, andSA-02: CO and HC Emissions Results.
56
L
1980024900-064
The next configuration modification (SA-02) featured a reduced-flow pri-mary swirler and elimination of the cooling flow in the swirl-cup sleeve in-sert. These changes were designed to enrich the combustor dome stolchiometryand increase the primary-combustion-zone residence time by the elimination ofair in the vicinity of the swirl cup. As shown in Figures 29 and 30, thissector-combustor configuration demonstrated no significant change in the COor HC emission levels from Configuration SA-01. The benefit of the increasedprimary-zone residence time in reducing the CO emissions was offset by theadverse effect of the excessively rich dome stoichiometry.
Sector-combustor Configuration SA-03 featured elimination of the inner
and outer dome ring cooling flows and elimination of the first-panel cooling
flow of the inner and outer liners. To maintain the same total combustor iflow area, the secondary dilution area was increased to offset the forward
cooling-flow areas that were eliminated. Previous experience has shown that
the secondary dilution has little, if any, impact on measured CO and HCemissions levels. Blocking these cooling flows in the dome region was in-
tended to eliminate quenching effects on the primary-combustion-zone reaction.
These quenching effects are believed to contribute significantly to the pro-duction of large quantities of CO and HC emissions in the combustor dome. As
expected, results from this test configuration indicated significant reduc-
tions in CO and HC emissions levels (Figure 31). The CO emission levels were
still above the program goals at the design-cycle operating conditions. How-
ever, levels approaching or satisfying these goals were achieved at a fuel/air
ratio of 0.009; this is less than the design-cycle fuel/air ratio of 0.0158.
The HC emission levels achieved with Configuration SA-03 were well belog the
required levels.
Sector-combustor Configuration SA-04 involved substantial design modifi-cations, including: the addition of impingement cooling to the forward section
of the inner and outer liners, increased primary-shirler airflow, increasedprimary dilution airflow, and reduced seccndary dilution airflow. Cooling
airflows for the second panel both of the inner and of the outer liner were also
increased. The increased liner cooling was adopted along with the impingement-cooling concept because of the excessively high inner and outer liner forward-
panel temperatures encountered during the test of Configuration SA-03. Theincreased swirl-cup and primary dilution flows were adopted to provide better
mixing for reduced CO emissions and to lean the combustor primary reaction
zone, thus, moving the minimum CO emission levels to the design-cycle fuel/air _
i ratio. The secondary dilution airflow was reduced to maintain the totalcombustor flow srea. As observed in Figures 31 and 32, a slight reduction in
I CO emission levels and a slight increase in HC emission levels were obtained
for Configuration SA-04. The less-than-anticipated reduction in CO emissiong• levels resulted from the decrease in residence time offsettingthe benefits of
the better mixing conditions. However, the minimum CO emission levels occurred
at a fuel/air ratio that more nearly approached the design value than was ob-
" rained with Configuration SA-03. Although HC emission levels increased, theyremained well below the E3 goals.
57
1980024900-065
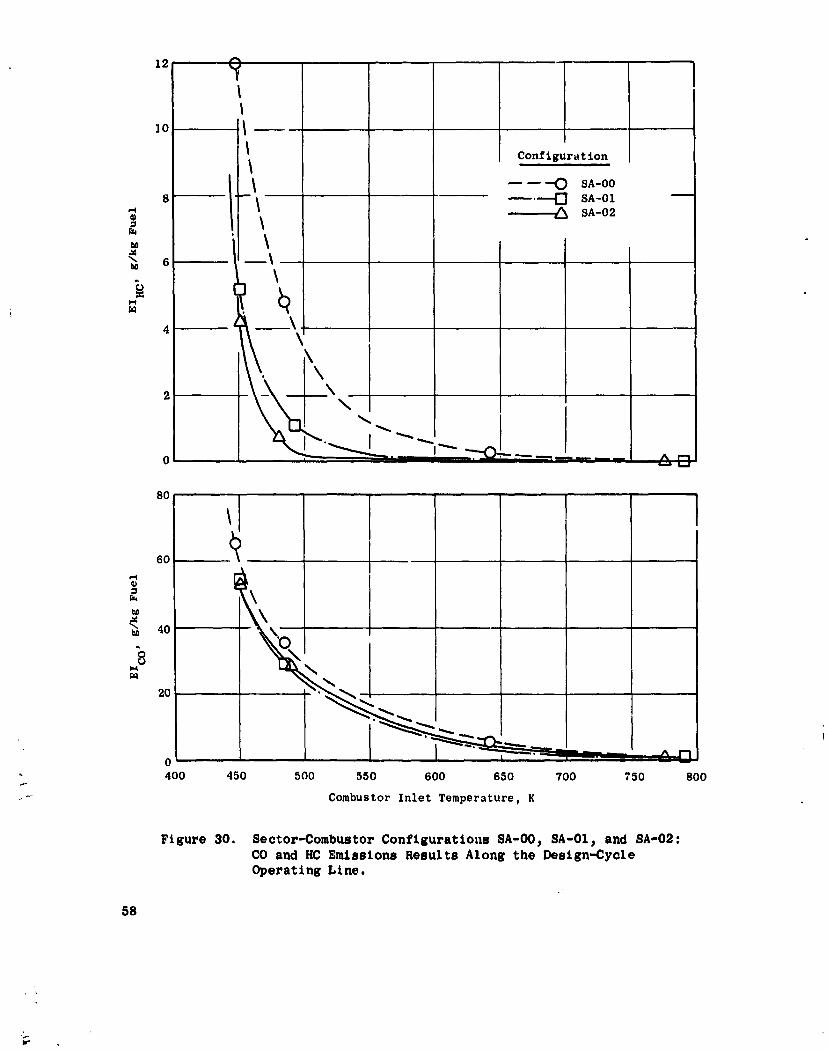
lI
io l
Configurat ion
l -- --0 sA-oos _ --'--0 sA-ol
"_ .... ._ SA-02
. \
\
\ \\2 "\<'1 ] .... ,
o . --- .... A._
8O
oo t
4o
t_
2O {
0400 450 500 550 600 650 700 750 800
..- Combustor Inlet Temperature, K
Figure 30. Sector-Combustor Conflguratious SA-O0_ SA-OI_ and SA-02:
CO and HC Emissions Results Along the Design-CycleOperating Line.
58
r
1980024900-066
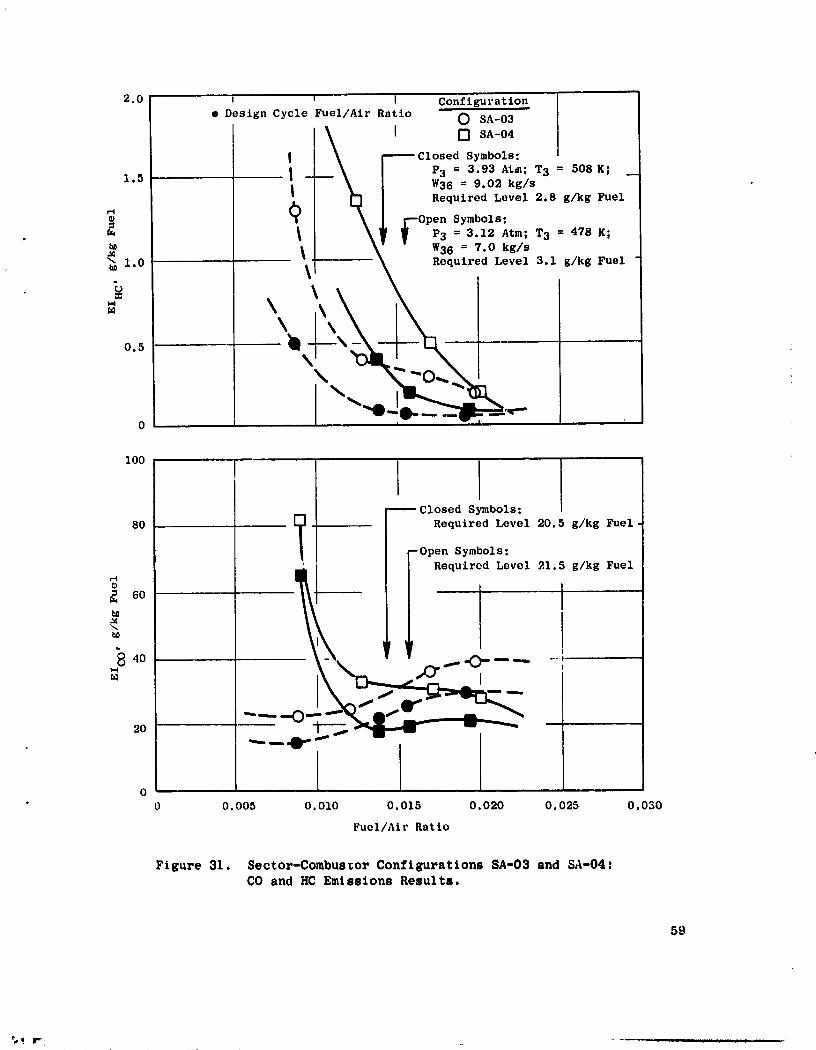
2.0 I _ J Configuration
• Design Cycle Fuel/Air Ratio O SA-03
!\ I o SA04I \ _ Closed Symbols:I ; __ _ P3 = 3.93 ALto; T3 = 508 K; --
1.5 i ---- _ W36 = 9.02 kg/s: f'l Required Level 2.8 g/kg Fuel
q _ r--Open Symbols:
_ _ll T P3 = 3.12 Atm; T3 = 478 K;o
_ _ W36 = 7.0 kg/s
_ 1.0 - \ _ Requlred Level 3.1 g/kg Fuel
,,,\\
0
100
r_ Closed Symbols:
80 y Required Level 20.5 g/kg Fuel-Open Symbols:
Ii ! Required Level 21.5 g/kg Fuel
60
8 40 --
20
00 0.005 0.010 0.015 0.020 0.025 0.030
Fuel/Air Ratio
Figure 31. Sector-Combus_or Configurations SA-03 and SA-04:CO and HC Emissions Resulta.
59
1980024900-067
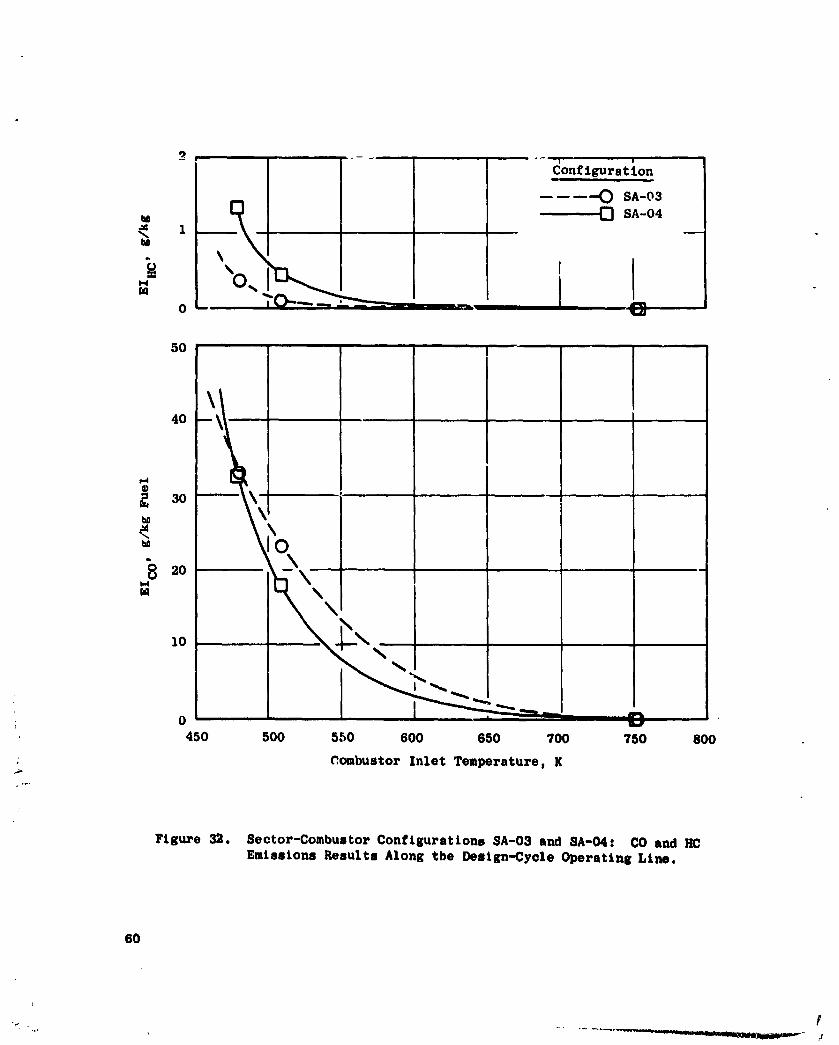
! |
Configuration
--mm--_ SA-03
= " !0 --_ --." _
50 I
\40
30 '"I
\
X
450 500 550 600 650 700 750 800
: _ombustor Inlet Temperature, K
Figure 32. Sector-Combustor Configurationn SA-03 and SA-O4z CO and HC
Emissions Results Along the Design-Cycle Operating Line.
6O
_J _ P
1980024900-068

i
A 50% reduction in dome splash-plate cooling flow and an inc.'ease in [secondary dilution flow were incorporated in sector-combustor Configuration [SA-05. The reduction in the dome splash-plate cooling was adopted t_ furtherreduce quenching effects from dome cooling flows. The corresponding increase
in secondary dilution flow was incorporated t_ maintain the total combustor
flow area. The CO and HC emissions levels obtaine for Configuration SA-05
were similar to the levels previously obtained for Configuration SA-03. The
combination of the increased swirl cup flow and the reduction in the splash-
plate cooling flow produced a dome flow level and stoichiometry similar to
that of Configuration SA-03. This. coupled with tl- _imilar (high) liner
temperature, produced the observed similarity in the CO and HC emissionsre sul t s.
The inner and outer dome ring-cooling flows were reintroduced in Config-
urat;on SA-06 to reduce the excessively high inner and outer liner forward-
panel temperatures encountered during the test of ConFiguration SA-05. Total
combustor flow area was maintained by a decrease in seaondary dilution. The
interior flowpath contour was smoothed by using a thin strip of sheet metal I_to eliminate the step created by the flrst-panel cooling overhang _f the
inner and outer liners. Results from testing of this configuration showed
significant increases "r,the CO and HC emissions levels at 4% idle. S:--.ller
increases were observed _ 6% idle. These results demonstrate the senst=ivity
of the CO and HC emissions to the dome cooli'Ig-airflow levels. Despite the
increases in CO and HC emissions, the HC emission levels remained kelow theprogram target goals.
In sector-combustor Configuration $A-07, the splash-plate cooling aireliminated in Confiqurations SA-05 8nd SA-06 was reintroduced. Fuel nezzles
with narrower fuel-spray angles were also introduced. These changes were
made to evaluate in sector form a combustor configuration .,'_Lilarto that
planned for the high-pressure, full-annular combustor test. o'ith this configu-ration, further increases in the CO emission levels were obtained with little
change ln.the HC emission levels.
The final sector-combustor test Configuration (SA-08) incorporated allof the desirable -eatures evolved earlier to obtain low CO and HC emissions
levels at tP.ed_sign-cycle fuel/air ratio. Based upon previous test results,
these changes, in general, were expected to produce excessively high linertemperatures. However, this test configuration was intended to demonstrate
CO and HC emissions levels the.twould satisfy the program goals at the design-cycle fuel/air ratio. With this configuration, CO emission levels of 26.0
: _ glkg fuel and 12.5 g/kg fuel, respectively, were obtained at 4% and 6% thrust
-- _ at idle. These represent the lowest CO emission levels obtained for any of
...._ the nine s-ctor-combustor conf'Lgurations evaluated in the sector test program.
I _ CO emission levels which would satisfy the goals at 4% thrust at ground idlewere obtained at a fuel/air ratio of 0.010 to 0.012 which is about 25% below
the desi;n-eycle fuel/air ratio. The Ne emission levels for this configura-
tion were well below the program goals. The CO and HC emissions levels
achieved with sector-combustor Configuraticns SA-05 through SA-08 are illus-trated in Figures 33 and J4.
6_
1980024900-069

2.5 I I '
• I)_.$ign Cycle Fuel Air/Ratio Con£iguration
SA-05SA-06
! I 0 sA-oT2.0 d b 1 ] A sA-OS
FI k -- Closed Symbols=• - _ P3 = 3.93 Am; T3 : _08 K;
i _ : Required Level 2.8 g/kg Fuel
_ 1.5 " -- --0 tm,;s_T3 = 478 K;_ Required Level 3.1 g_kg Fuel
1.O
0.5
_-_-- /
o
,o I
,o /..__.. _0--
_ 3o--- I "'" --_----
20 --
10 ls
Cl_i_ Sre)_d_]_lSel__i 1 I _ Required L;evO| '1"5 "/k' Fuel00 0. _'05 0. Ol0 0,015 O. 020 O. 025 O.030
Fuel/Air Ratio
b_
Figure 33, Sector-Combustor Configurations SA-05_ LA-06, SA-07,and SA-08: CO and HC Emissions Results.
,r
62
1980024900-070

10
8 _ Conf t gu rat ion
-0 sA-o5_] SA-06
\1 0 s^-o__, 7 - L_ s^-osW
_.
W
!I
4
Figure 3,1. Sector-Combustor Configurations SA-05, SA-06, SA-07,and SA-08: CO and HC Emissions Results Along the
Design-Cycle Operating Line.
63
1980024900-071
7.2 SECTOR-COHBUSTOR NOx EMISSIONS
With the exception of Configuration SA-06, NOx emission data were ob-tained on all sector-combustor configurations at simulated sea level takeoff
conditions. NOx emission data for Configuration SA-06 were not obtained be-cause the NOx analyzer was unavailable at the time of the test.
Because of test rig and facility limitations, the sector-combustor
inlet pressure, airflow, and temperature test conditions at simulated sealevel takeoff were derated. Measured NOx emission levels obtained for eachconfiguration at these derated-high-pouer conditions were then adjusted to theactual E3 cycle conditions.
Because the sector-combustor test conditions were designed to simulate
the proposed E3 single-annular combustor cold dome velocity, further adjust-
ment to the measured NOx emission data was required to simulate E3 single-annular combustor bulk residence time. Geometric dissimilarities between the
proposed E3 single-annular combustor design and the E3/FI01 single-annularcombustor test vehicle prevented simulation of both the cold dome velocity andbulk residence ti_e with one set of test conditions. Insufficient test time
and funding prevented evaluating each sector-combustor configuration at con-ditions which would simulate both the cold dome velocity and bulk residencetime. Since it is believed chat the bulk residence time is a significant
controlling factor in NOx emission characteristics_ it was decided that theadjustment of the sector-combustor emission data for bulk residence time wasnecessary for a more meaningful representation of the expected NOx emissionsfor a single-annular combustor. The relationship employed to provide theserequired adjustments to the NOx emission data is discussed in Appendix B.The adjustment procedure provides a linear relation with measured NOx emis-
sion data along the engine cycle operating line and pexmits extrapolation ofNOx emission data, measured at derated test conditions, to the actual enginecycle sea level takeoff conditions.
NOx emission levels from eight of the nine sector-combustor configura-tions are plotted against this adjustment relation for the E3 October 1978cycle conditions in Figure 35. In order to meet the E 3 goal for NOx emis-
sions, it was determined that a NOx emission level of 17.5 g/kg fuel wasrequired at the E3 sea level takeoff condition. As observed from Figure 35,none of the sector-combustor configurations tested met with the target level
for NOx emissions at sea level takeoff.
A summary of the sector-combuscor test results in terms of the October1978 E3 cycle is presented in Table XIII It i_ ob.erved from the table that,
-" with the exception of Configuration SA-07, all of the sector-combustor con-figurations tested demonstrated CO emission levels that satisfy the programgoals at 65 ground idle thrust. This is due to the higher combustor-inletpressures and temperatures associated with the October 1978 cycle. However,only Configuration SA-08 demonst'ated CO emission levels that satisfy the pro-gram goals at 4g ground idle thrust. All of the sector-combustor configura-tion_ tested demonstrated HC emission lev¢_s which satisfy the program goals
64
1980024900-072

6S
1980024900-073

with margin at 4Z and 6Z ground idle thrust. However, none of the configura-tions tested demonstrated NOx emission levels which satisfy the progrmgoalsat simulated sea level takeoff. In general, those configurations which demon-
strated low CO emissiou levels also demonstrated higher NOx emission levels.
Table Xlll. SueBary of Sector-Combustor Emissions.
• October 1978 Cycle• CO and HC Emissions for Simulated Cold-Dome Velocity.
w NOx Emissions for Simulated Bulk Residence Time.
Emissions Index, g/kg FuelCO _ HC NOx
Configuration 4Z 6Z 4Z 6Z SLTO
SA-O0 28.5 17.4 1.6 0.3 19.2SA-O1 29.4 18.6 0.5 0.5 18.3SA-02 32.6 18.4 0.3 0.2 18.7SA-03 26.2 18.7 0.3 0.I 20.3SA-04 25.1 13.5 0.9 0.4 20.7SA-05 25.8 17.6 0.2 0.2 25.6
SA-06 34.7 19.5 0.5 0.2 N/ASA-07 39.6 24.3 0.5 0.2 18.8SA-08 17.5 8.6 0.3 0.2 24.2
Full Annular 36.6 24.4 1.3 0.4 21.7
Goals 20.0 19.2 2.8 2.7 17.5
7.3 SECTOR-COMBUSTORPERFORMANCE
Sector-combustor performance data were obtained from the test rig pres-sure and temperature instrmuentation at each test point investigated. Thedata were used to determine combustor pressure drops, airflow distributions,and liner temperature distributions.
Measured overatl combustor pressure drops for all nine sector-combustorconfigurations evaluated are plotted against the square of the combustor in-
- let flow function parameter in Figure 36. As observed from this figure, allof the configurations evaluated exceeded the E3 performance goals for a
pressure drop of 5Z at sea level takeoff. For Configurations SA-01 throughSA-08, the excessive combustor pressure drops were detetnnined to be the re-s_,lt of excessive losses in the standard F101 diffuser system when operatingat higher than desi8 n airflow conditions. These high-flow conditions were
66
r ' '
1980024900-074
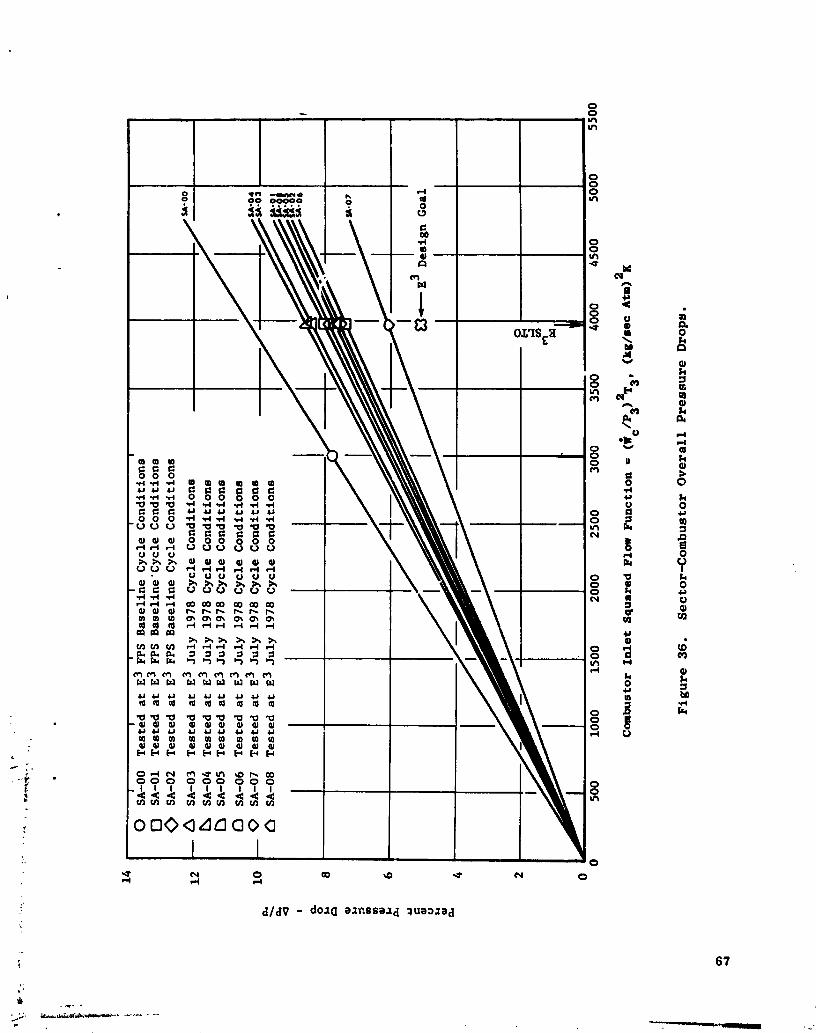
0
67
," __*',mmmmm
1980024900-075
required to simulate the proposed E3 single-annular _old dome velocity inthe FIOI PV combustor test vehicle. In the case of Configuration SA-00, theexcessive overall combustor losses were attributed not _nly to the highdiffuser-system losses but also to the combustor pressure losses chargeableto the smal]er total co_bustor flow area of the standard FIOI PV combustor.
With the exception of Configuration SA-O0, estimated airflow distribu-tions were calculated for each sector-combustor test configuration using
measured static pressures obtained at various points along the cold and hotsurfaces of the combvstor liner and estimated effective flow areas. Configu-
ration SA-OO did not have sufficient pressure instrumentation to provide anestimate of the airflow distribution. A summary of the estimated effectiveflow areas and corresponding airflow distributions for each configuration isshown in Table XIV.
For Configurations SA-01 through SA-03, eight skin thermocouples werelocated on the cold surfaces of the inner and outer liner_ as shown in Figure
37(a). As shown in Figure 37(b), a total o_ 22 liner skin thermocouples wereused for Col,figurations SA-04 through SA-08; these configurations featured
impingement cooling on the forward section of the liners. Configuration SA-O0was not instrumented with liner thermocouples. Indicated liaer temperatures
were recorded at each test point for Configurations SA-01 through SA-0B; thetemperature distributions obtained at simulated sea level takeoff conditionsare presented in Table XV. Since the sector-combustor test conditions at thesea level takeoff conditions were derated due to facility and te_t rig llmi-tations, liner temperatures approximately 8.5Z higher than those presented inTable XV are anticipated at the actual engine operating conditions.
7.4 FULL-ANNULAR COHBUSTOR IDLE ENISSIONS
The primary purpose of the full-annular combustor test was the investS-gation of NOx and smoke emissions at high pressure. ThereforeD the testconditions used in this evaluation simulated only the E3 single-annular com-bustor bulk residence time. As part of this test, low-power emissions datawere also investigated. Measured CO and HC emissions levels obtained a_ theground idle conditions investigated are plotted against the metered combustor
. overall fuel/air ratio in Figure 38. As shown in the figure, the HC emis-sion levels obtained with this combustor configuration satisfied the program
• target levels for the three ground idle conditions tested. However, the COemission levels were significantly above the program target levels. As
indicated by the shape of the CO emission curves, little if any reduction inCO emission levels would _e obtained by sectorized burning at idle. Sectorized
_- burning is accomplished by supplying fuel to only a portion of the total,
• full-annular, swirl-cup array. The intent of the sectorized-burning conceptis to reduce idle emissions by enrichment of the primary combustion zone in
the fueled regions of the combustor while maintaining the overall cycle designfuel/air ratio. Corre_.ation of data is made on the _'sis of an effectiveprimary-zone fuel/air ratio defined as the overall fuel/air ratio times the
reciprocal of the fraction of the total swirl cups _u_!ed. The CO and HCemissions characteristics of this full-annular desxgn lot the combustor-inlet
B8
i
i
1980024900-076
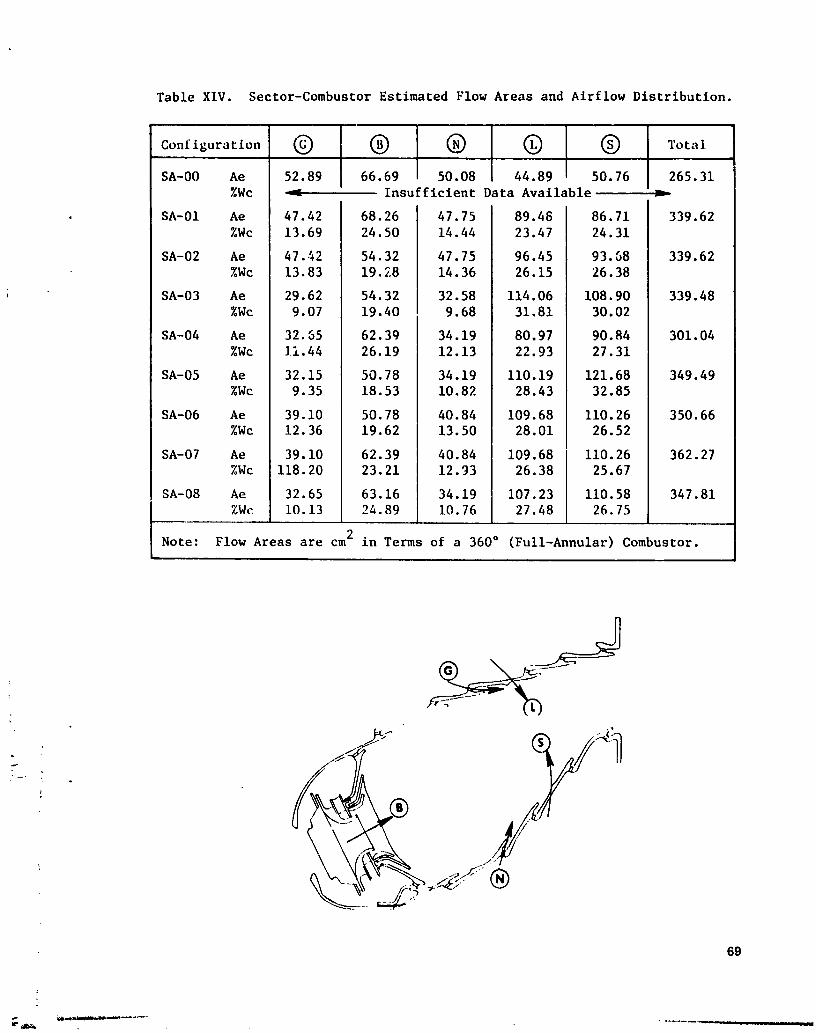
Table XIV. Sector-Combustor Estimated Flow Areas and Airflow Distribution.
SA-00 Ae 52.89 66.69 50.08 44.89 50.76 265.31%We _ Insufficient Data Available
SA-01 Ae 47.42 68.26 47.75 89.48 86.71 339.62
%Wc 13.69 24.50 14.44 23.47 24.31
SA-02 Ae 47.42 54.32 47.75 96.45 93.68 339.62
%Wc 13.83 19.28 14.36 26.15 26.38
SA-03 Ae 29.62 54.32 32.58 114.06 108.90 339.48
%Wc 9.07 19.40 9.68 31.81 30.02
SA-04 Ae 32.65 62.39 34.19 80.97 90.84 301.04
%Wc )_1.44 26.19 12.13 22.93 27.31
SA-05 Ae 32.15 50.78 34.19 110.19 121.68 349.49
%Wc 9.35 18.53 10.82 28.43 32.85
SA-06 Ae 39.10 50.78 40.84 109.68 110.26 350.66
%Wc 12.36 19.62 13.50 28.01 26.52
SA-07 Ae 39.10 62.39 40.84 109.68 110.26 362.27
%Wc 118.20 23.21 12.93 26.38 25.67
SA-08 Ae 32.65 63.16 34.19 107.23 110.58 347.81%Wc 10.13 24.89 10.76 27.48 26.75
Note: Flow Areas are cm2 in Terms of a 360 ° (Full-Annular) Combustor.
89
1980024900-077
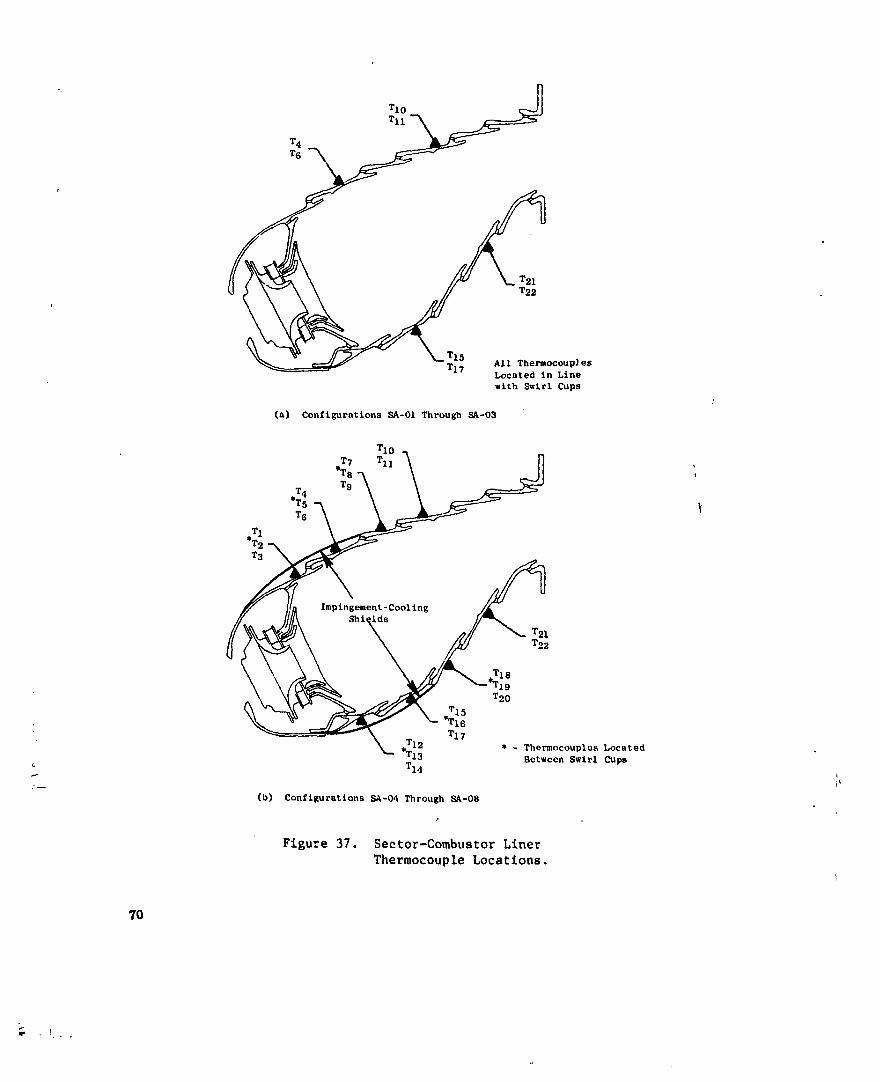
TIOTll
T4T6
T21T22
__ TI5TI 7 All Thermocoup] esLocated in Line
with Swirl Cups
(a) Configurations SA-OI Through SA-03
TIOT7 T11
*TsT9
T4
*Ts 1T6
2T3
T21T22
TI819
T20
T16T17
, T12 * - Thermocouples Located
TI3 Between Swirl CupsTI4
(b) Configurations SA-04 Through SA-08
Figure 37. Sector-Combustor LinerThermocouple Locations.
7O
r
1980024900-078

l==s l.=.
71
1980024900-079
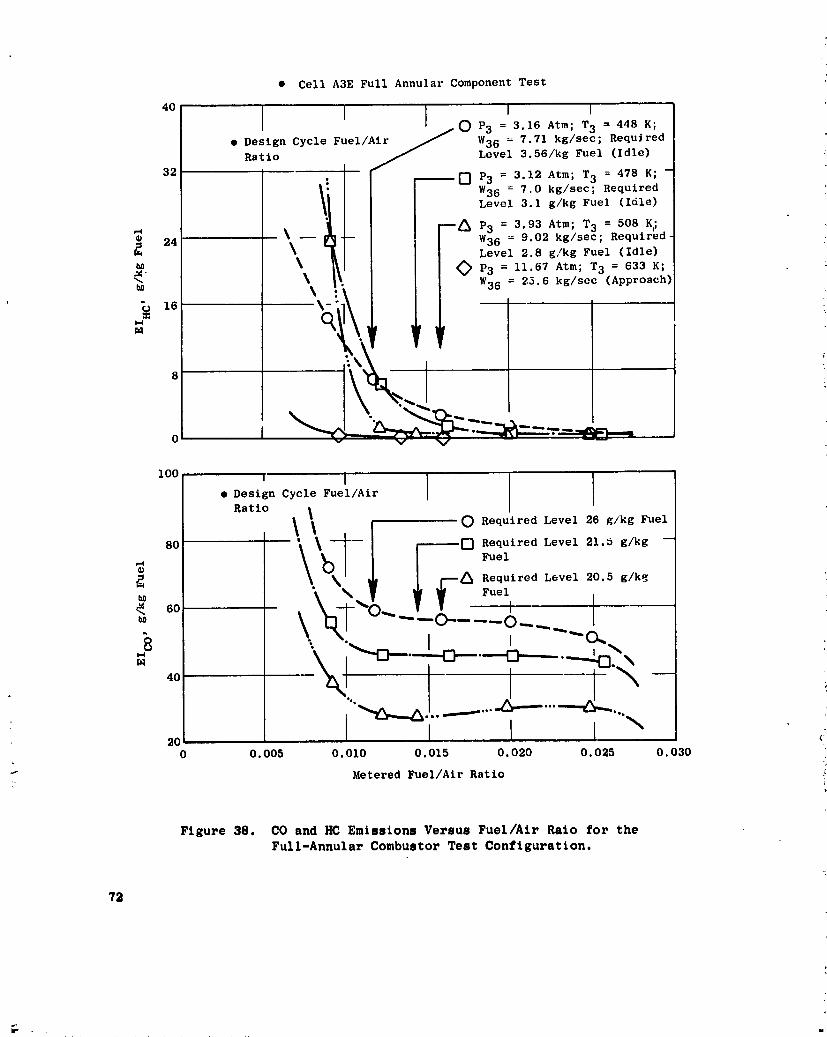
• Cell A3E Full Annular Component Test
'° I I I• Design Cycl Fuel/ /0 P3 = 3.16 Arm; T3 = 448 K;
Ratio Level 3.56/kg Fuel (Idle)
32 m P3 = 3.12 Atm; T3 = 478 K; -
___i W36 = 7.0 kg/sec; Required
Level 3.1 g/kg Fuel (Idle)
P3 = 3.93 Arm; T3 = 508 K;
=_ 24 - i W36 = 9.02 kg/sec; Requiredi Level 2.8 g/kg Fuel (Idle)
0 P3 = 11.67 Arm: T3 = 633 K;
_ I_ W36 = 25.6 kg/sec (Approachl
o __-=-_0_---
i0o r T [ [• Design Cycle Fuel/Air
Ratio _
\ _ F " 0 Required Level 26 g/kg Fuel
'l \ -_- I r----o RequiredLevel_-i._g/kg--\bl i i 'oo'_t k _ I f---/_ Required Level 20.5 g/kg
_ "_ _ V _ W Fuel6o - • _-%6_ V v -__-_---_
\ x. i _c_.- \ ,"-o--.- -o--.--o--.-__ \
o \_..._, .._... .."20 1 1 _
0 o.oos 0.010 o.ols 0.020 0.02s o.03oMetered Fuel/Air Ratio
T i
Figure 38. CO and HC Emissions Versus Fuel/Air Raio for theFull-Annular Combustor Test Configuration.
72
1980024900-080

temperature corresponding to the E3 cycle operating conditions are shown inFigure 39. Combustor operating conditions at 85% of sea level takeoff thrustand above were derated to avoid exceeding the test facility high-pre_s'cecapabilities. Therefore, the CO and HC emissions levels measured at high,-
power test conditions were adjusted to the actual cycle conditions using theadjustment relations discussed in Appendix B.
7.5 FULL-ANNULAR COMBUSTORNOx EMISSIONS
NOx emission levels measured in the full-annular combustor configura-
tion are plotted against the NOx adjustment parameter in Figure 40. Tb_
parameter is similar to that used in adjusting the NOx emission data o_-rained from the sector-test configurations, but an added term p_ovid_s anadjustment for the inlet-air humidity. As part of the data acquisition dur-
ing the full-annular combustor test, the inlet-air humidity was measured with
a hygrometer and recorded at each test point. A hygrometer was not availableduring the sector-combustor testing effort; hence, the humidity was not ac-
coun:ed for in the adjustment of the sectnr-combustor NOx emissions data.The impact of the inlet-air humidity on measured NOx emission levels isgenerally less than 7%. As observed from Figure 40, an NOx emission levelof 21.7 g/kg fuel is estimated for the full-annular combustor configuration
at the sea level takeoff conditions. This is approximately 24% above the
a 17.5 g/kg fuel that was estimated as the level required to satisfy the E3
project goal. Because there are essentially no differences between engine
operating cycles at the sea level takeoff condition, the NOx emission levelobtained from this figure at sea level takeoff would be representative for
all the engine cycles which evolved during the test program. In Figure 41
the effect of bulk residence time on the measured NOx emission levels atsea level takeoft conditions is shown. It is observed from this data that a
10% reduction in combustor bulk residence time resulted in a 6% reduction in
the measu.ed NOx cmis_ion levels.
The CO and HC emissions data obtained with the full-annular combustor
were adjusted to the E3 October 1978 cycle at simulated cold-dome velocityconditions. These adjusted CO and HC emissions levels, along with the sea
level takeoff Nux emission level, were compared to the program goals andto the levels obtained with the nine sector-combustor configurations in TableXlll (Section 7.2). As observed from this table, the full-annular combustordemonstrated CO and NOx emissions levels that exceeded the project goals,but the HC emission levels satisfied the goals with margin.
_" 7.6 SMOKE EMISSIONS
Combustcr smoke data were obtained at the design-cycle combustor fuel/airratio at each of toe key operating conditions set. The smoke data are plottedagainst a correlating parameter in Figure 42. This smoke-correlating parame-ter was developed for use in adjustin_ FIO1/CFM56 component and engine smokedata measured at off-d_sign combustor inlet conditions to the actual design-cycle operating conditions. As observed from this figure, the smoke data donot correlate well with this parameter. During the data processing of the
73
1980024900-081

80 i
\
_ 4o
20 .... [!
0 , !
2.5
?
?
2.0 • _
1.5W
_[!! 1, 0N
m
0°5
0450 500 580 600 680 700 "/50 800 880
C0mbustor Inlet Temperature, K
{
Figure 39. CO and _ Emissions Versus Combustor Inlet Temperature.... Along the Design-Cycle Operating Line for the Full-
Annular Test Configuration.
74
1980024900-082

75
%
1980024900-083

0
76
1980024900-084

77
1980024900-085
smoke smples, it was observed that a considerable amount of water had con-densed onto the samples. This water comes from the combustion process.The GE smoke console is designed to remove most of the water from the smokesample; however, due to excessive amounts of combustion water, and/or mal-function of the smoke console water trap, water collected in the sample lineand contaminated the smoke sample. Thus, the amount of uncontaminated samplefrom which to obtain a smoke number was considerably less than desired. Thiswater contamination produces some doubt as to the validity of the smoke dataobtained.
7.7 FULL-ANI_LAR COMBUSTORPERFORMANCE
At each test point evaluated, data were obtained from the combustor test-rig pre;;sure and temperature instrumentation and used to determine the combus-tot liner temperature distributions, the combustor pressure drops, and airflowdistribution. The quantities and locations of the test-rig instrumentationare shown schematically in Figure 26 (Section 6.0).
Peak tempc.atures were measured for conditions along the combustor oper-ating line on each panel of both the inner and outer combustor liners and areshown in Figure 43. At the simulated sea level takeoff condition, maximumindicated temperatures of 1150 K (1610" F) and 1100 K (] 520" F) were recordedrespectively on panel No. 1 of the outer liner and panel No. 2 of the innerliner. Because these temperatures were obtained at derated pressure condi-tions, peak liner temperatures at the actual engine cycle conditions would beapproximately 5Z higher. Figures 44 and 45 show the peak-temperature axial
distributions, along the outer and inner liners respectively, at selectedoperating conditions.
Measured overall combustor and combustor-deme pressure drops are plottedagainst the square of the combustor inlet flow function parameter in Figure
46. At the simulated sea level takeoff condition, an overall combustor pres-sure drop of 8.5Z was obtained. Along the revised-cycle combustor operatingline, a maximum overall drop of IOZ was obtained at the approach (30Z) powercondition. The design overall pressure drop for the E3 combustor system atsea level takeoff is 5Z. As in the case of the sector-combustor pressuredrops, the high pressure drops obtained _ith this configuration are due tolarge diffuser-system pressure losses caused by the high airflow levels setfor the basic FI01 combustor to providc the desired low combustor bulk resi-dence times of the proposed E3 alternate combustor design.
Measured static pressures on the liners and dome at various power set-- tings along the E3 cycle ccmbustor operatin_ line are shown in Table X"I.
Some pressure data at high power conditions were not obtained due to failureof the static pressure instrumentation.
_le estimated airflow distribution for the full-annular combustor designis shown in Figure 47. In obtaining this airflow distribution, a completereassessment was made of the combustor egfettive glow areas obtained grom a
78
1980024900-086

• High Power Conditions Derated Ior P3 and WC
Outer Liner
sooi a 8 ..,_-_" .........Dt, _ ..........a.... Io
_" 2........_..j600 -
: __..T-...._-_- I _ I_
4004_
x1400
E
Inuer LinerI
1200_ Sym Pane.!l -{}= 0 1
O 2 /
,ooo_X:_ .. /
800 _.
401 , •,
400 450 500 550 600 650 700 750 800 850
Combustor Inlet Temperature, K
Figure 43. Peak Liner Temperatures.
?9
1980024900-087

0 49 Idle
r] 69 Idle
0 Approach/_ Cllmbouta SLTO
8O
1980024900-088

7/78 Revised
Baseline Cycle
0 4_ IdleC] OR Idle
ApproachC1 imbout
O SLTO
ooom
800
m
_ 600t
m
,-1
400 ..e4
i
200 i
Figure 45. Inner-Liner-Temperature Axial Distribution.
81
1980024900-089

82
1980024900-090

Table XVI. Measured Static Pressures for _ull-Annular Test Configurption.
. Pressures are MPa
Test A *B C *D E F *G *H *I JCondition
FP54Z Idle 0.308 0.308 0.308 0.308 0.309 0.302 0.301 0.300 0.298 0.297
Revised4_ Idle 0.305 0.306 0.307 0.307 0.307 0.301 0.300 0.300 0.299 0.299
Revised
6Z Idle 0.372 0.373 0.374 0.374 0.374 0.368 0.365 0.365 0.363 0.362
30Z Approach 1.108 1.111 1.105 1.114 1.113 1.076 1.071 1.066 1.061 1.056
85Z Climb 1.577 1.582 1.584 1.584 1.584 N/A N/A N/A N/A 1.544
100Z SLTO 1.578 1.582 1.585 1.585 1.584 N/A N/A N/A N/A 1.543
Test *N *R *SCondltion g L H 0 P 0 T
FPS4X Idle 0.322 0.302 0.312 0.312 0.313 0.314 0.302 0.300 0.298 0.298
Revised4Z Idle 0.319 0.301 0.310 0.310 0.311 0.312 0.301 0.300 0.298 0.297
Revised6Z Idle 0.392 0.368 0.378 0.380 0.381 0.381 0.368 0.368 0.365 0.360
30Z Approach 1.182 1.076 1.122 1.124 1.127 1.133 1.076 1.071 1.064 1.059
85_ Climb 1.659 NIA 1.592 1.596 1.596 1.604 N/A N/A N/A 1.515
100Z SLTO 1.657 NIA 1.593 1.594 1.595 1.598 NIA NIA N/A 1.515
*Note: These pressures dete_ined by linear extrapo-lation end interpolation of measured data.
83
1980024900-091

Table _I. Measured Static Pressures for Full-Annular Test
Configuration (Concluded).
• Pressures are PSIA
. ..... u ....
_st A "8 C *D 8 F *G *H *I JCondi t ion
FPS4g Idle _.60 _.65 _.70 _.75 _,80 43.80 43.63 43.45 43.28 43.10
bvised4g Idle _. 30 _.40 _. 50 _. 50 _. SO 43.70 43.58 43.45 43, 33 43.20
_vised6g Idle _.00 54.15 54.30 54._0 54.30 53.30 53.10 52.90 52.70 52.50
30g Approach 160.70 161.20 161.70 161.60 161.50 156.10 155.35 154.60 153.85 153.10
85g Cli_ 228.80 229.45 229.70 229.70 229.70 WA N/A N/A _A 224.00
I0_ SL_ 228.90 229.40 229.90 229.85 229.i0 _A _/A N/A _A 223.80
i i nJ i, -
Test *NCondition K L H 0 P Q *K *S T
FPS42 Idle 46.70 43.80 45.20 45.30 45.40 45.50 43,80 43.50 43.30 43.00
_vised42 Idle 46.20 43.70 44.90 45.0 45.10 45.20 43.70 43.50 43.30 43.10
_vised6Z Idle 56.90 53.30 54.90 55.05 55.20 55.30 53.30 53.31 _2.90 52.20
30Z Approach [71.40 156,10 162.80 163.10 163.40 164.30 156.10 155.30 154.40 153.60
852 Cli_ 240.60 N/A 230.90 231.40 231.90 !232.60 WA N/A N/A 219.80
100g SL_ 240.30 N/A 231.00 231.15 231.30 231.70 N/A _A N/A 219.80
*_te: _ese pressures detemined by lineer extrapo-lation and interpolation of measured data.
®
!. ®
84
1980024900-092

11.4% WC
16.4_o6.3%
:' Ftgur_ 4;. Estimated Airflow Distribution for the Full-Annular-_ " Combustor Test Configuration.
85
1980024900-093
posttest combustor flow check. Effective areas measured on the flow-calibra-tion stand produced a total combustor effective area of 335.5 cm2 (52 in.2).The pressure-drop data measured during the test indicated that the combustor
had a total effective area of 260 cm2 (40 in.2). An analytical investiga-
tion of this diRcrepancy indicated that the discharge coefficiunts of the
various comb1:stor cooling and dilution holes were significantly l,'_s for the
conditions _xisting in the test rig than th>se measured at the near-slat"conditions on the flow-calibration stand. This decrease in the discharge co-
efficients is related to high pressure losses in the diffuser and high liner-
passage velocities associated with operating the basic FIOI diffuser/combustor
system at the high airflow conditions required to simulate the proposed E3alternate combustor bulk residence times. A recalculation of the individual
combustor areas using discharge coefficients determined _ the test-rig
conditions produced a total combustor effective flow area of 265 cm2 (41.0
in.2), confirming the measured combustor pressure drop data.
7.8 EPA PARAMETER
The emissions goals for the E3 P_oject are expressed in the form of the
EPA parameter (EPAP). These goals are the amissions standards currently de-
fined by the EPA for Class T2 aircraft engines newly certified after January I,1981. The EPA emissions standards are based upon a representative landing/
takeoff cycle (EPA-LTO) that includes idle, approach, climbout, and sea level
takeoff engine operating conditinns (Reference 3). The EPA parameter is de-
fined in equation form as:
J
r(zli) (WF)j (Time)j
EPAP i =
_(FN) j (Time)j
where i is the category of gaseous e=.ission (CO, HC, or NOx) , El is the emls-
sion index, WF is the fuel-flow rate, Time is in hours at each power level,
FN is the corresponding thrust, and j is the prescribed power level (idle,30%, 85%, and SLTO). Units of EPAP are defined as pounds of emissions per
I000 pounds thrust-hour-cycle. In order to evaluate the development program
in terms of satisfying the pT _ram emission goals, it was necessary to i11ves-
tigate the emission levels at each of the prescribed EPA-LTO cycle conditions
to determine the impact of a particular comhustor design modification on the
CO, HC, and NOx emissions levels.
.-_ EPAP numbers for the full-annular combustor configuration were gener-
ated for the October 1978 cycle at 4%, 6%, and 7% of sea level takeoff thrust
at ground idle. The results of these EPAP calculations, shown in Fi§ure 48,indicate that this single-annular combustor design should meet the E_ Projectgoals for CO emissions at approximately 6.5% of sea lev_ takeoff thrust at
ground idle. However, reductions in NOx emissions on the order of 2_% areneeded to satisfy the E3 Project goal at the same operating conditions.
Emissions results presented in the form of the EPA parameter, alo,g with
86
i
1980024900-094
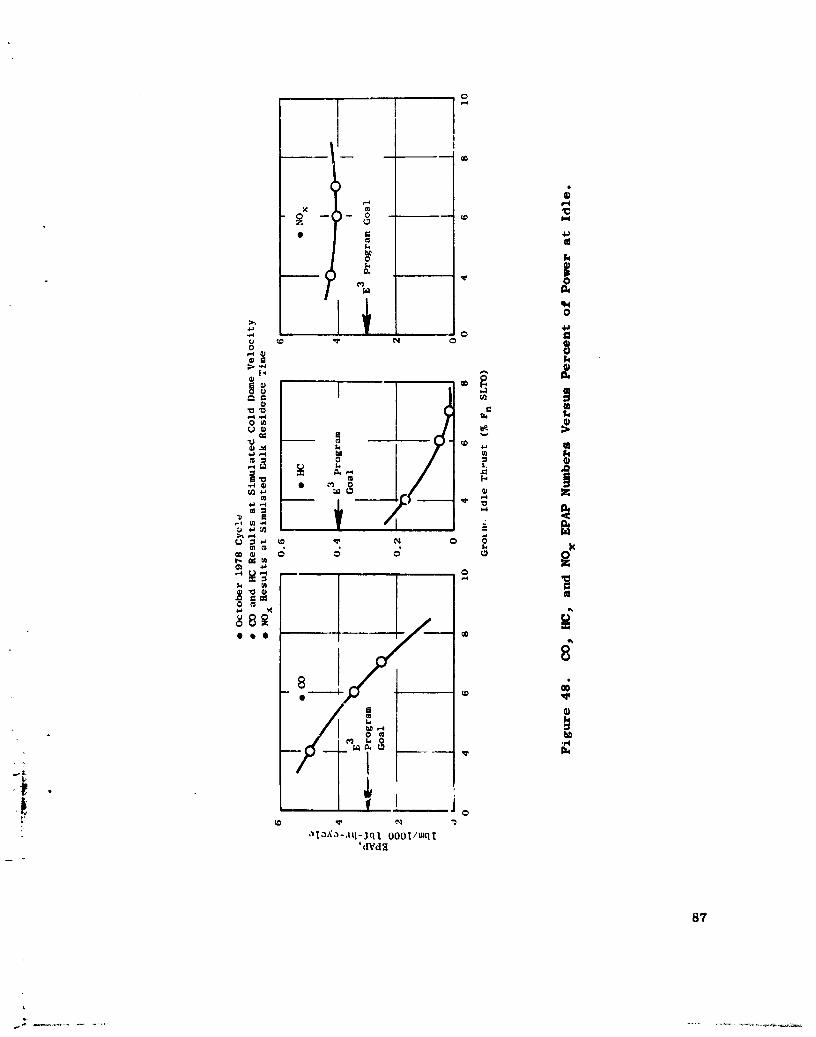
o
)'Co_ -()- _ ,.,z
0
m .I m m
g_ T
88_
t
,, ,o'_' ai;_,_.).,ttl=jq I O001/U_q _
'dVd
87
1980024900-095

several key combustor-performance results, a _ summarized for each of thenine sector-combustor configurations and the fu11-annular colbustor configu-ration in Table XVlI for the October 1978 E3 cycle. In this table, the COand HC emissions results are representative of simulated cold-dome velocity;
the NOx emissions results are representative of simulated combustor bulkresidence time.
7.9 DESICN ASSESSMENT
The alternate combustor task assessed the feasibility and practicality
of using a single-annular combustor design in the E 3 application. Thisassessment was based on the test results reported herein and on a trade stcdywhich evaluated the relative performance and product _pplicability of thesingle-an)ular and dm,ble-annular combuator designs•
The double-annular coabustor concept was selected for the E3 applicationbecauJe it is expected tomeet all of the objectives of the E3 Project. The
single-annular combustor design (while less complex, lighter, and less expen-sive) will not, baaed on results of this study, meet the E3 emiscions goal_,especially for the oxides of nitrogen.
Cross sections of the double-annular and single-annul-r combustor designsproposed for the E3 application are shown in Figure 49. Both designs usesplit-duct diffusers, pressure-atomizing fuel nozzles, counterrotating swirlcups, and impingement-plus-film-cooled shingle liners• The centerbody and thedual-fuel-nozzle system give the double-annul_r design added complexity. Inaddition, the double-annular design _'equires staging of combustion in the two
domes to obtain the very low emissions required to meet the E3 Project goals.
Quantitative or qualitative estimates of the combustor characteristicsan_ performance parameters of both designs are compared in Table XVlII. In_eneral, these comparisons indicate that the single-annular combustor shouldmee_ the E3 Project objectives except for emissions, would weigh les_, costless, be les_ expensive to maincein (based on production price), and giv_ ade-quate perfo_lance. Furthermore, the single-annular design would provide more
desirable com_stor-exit-temperatur_ distribution during low-power operationand be more resistant to gumming in the fuel system because of the continuoussupply of fuel to the fuel nozzles during operatio_,. In addition, the ab- tsence of a centerbody provides additional combustor airflow for combustion
purposes or exit-temperature-profile control. However, the double-annular [design should meet all of the E3 Project ob]:ctives and would give better
performance for some of the operating requirements. This better perfccmancewould result because the two stages of the double-annular combustor can be
adjusted over wider ranges of stoichiom_cries s_ the various engine cycle "
conditions.
The _ain impetus for the double-annular approach in the E 3 Project isto demonstrate tne ability to meet the emissions goe_s; these are equivalentto the emissions standards specified by the EPA (Reference 3) F.r Newly Certi-fied Engines (NCE) after 1981. The results of the alternate co_ustor task,
88
1980024900-096
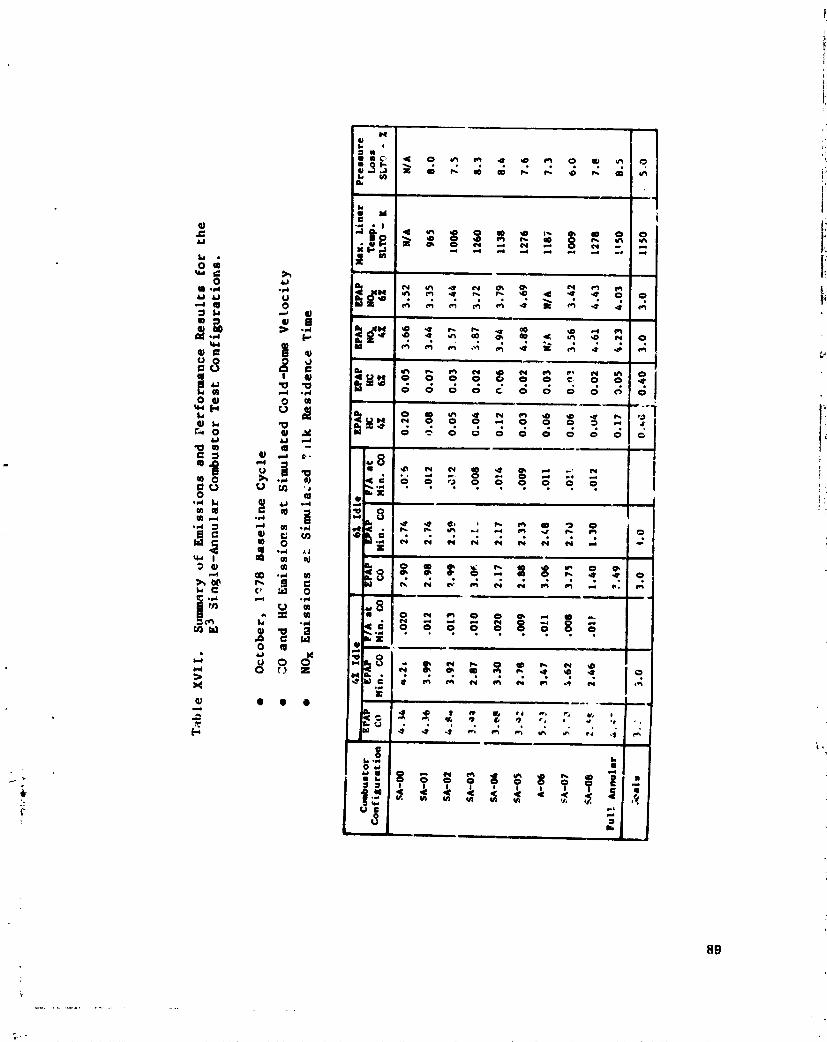
119
' 1980024900-097
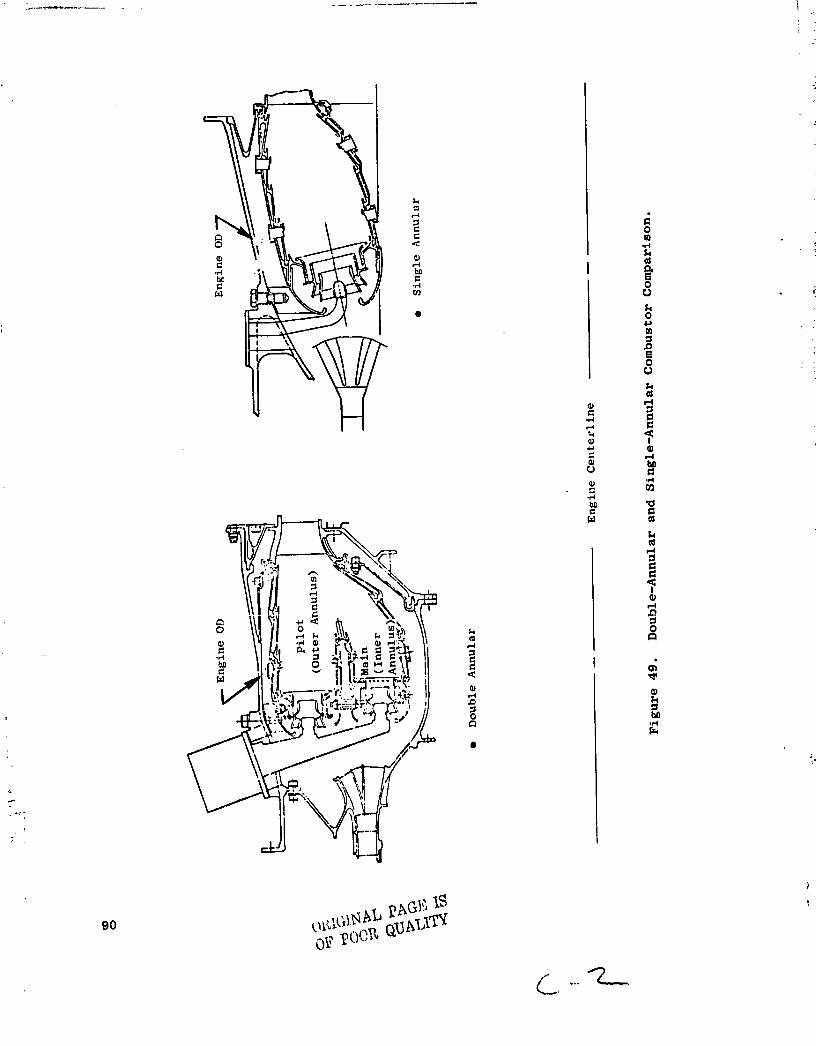
1980024900-098
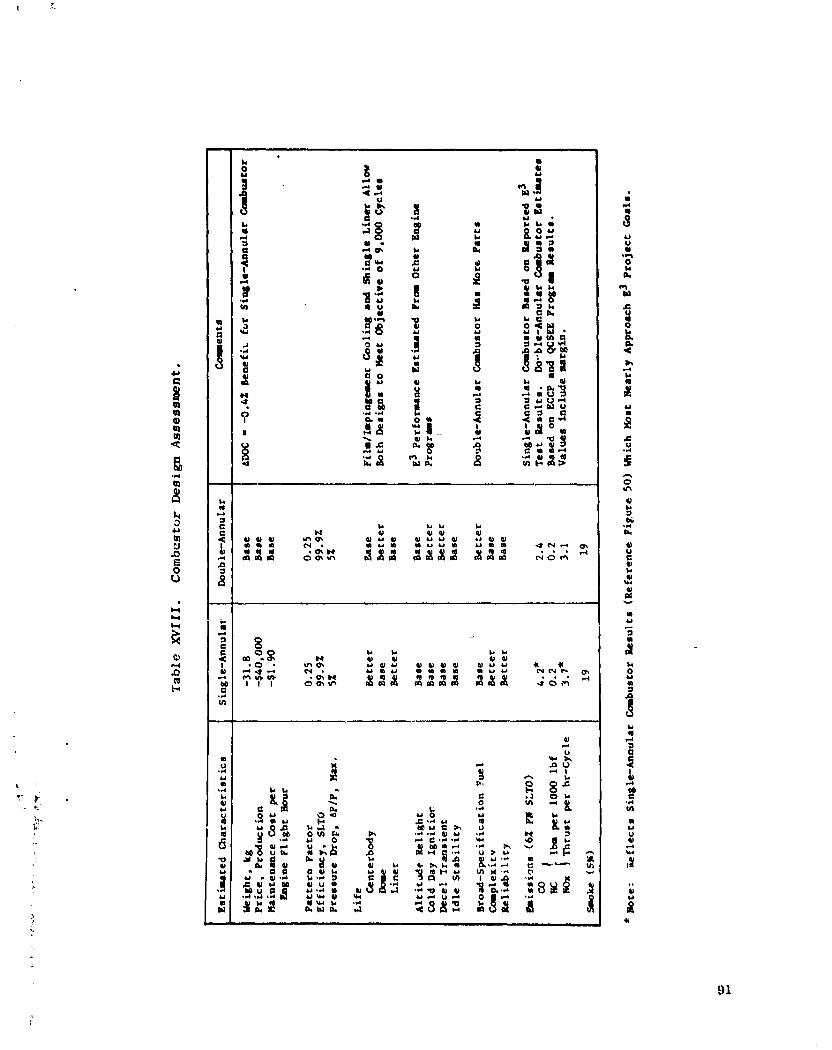

il
!as shown in Figure 50, indicate that a single-annular design wilt not meet _:
the 1981 CO and NOx standards, particularly _en the a_rgin required for i _
engine-to-engine variability is taken into account. However, the projected !,emissions levels for the double-annular combustor are expected to meet these
goals, as shown in Figure 50. i-
The assessment of the combustor designs also considered the fact that 1
the EPA has issued a Notice of Proposed Rule Making (Reference 5) which would I _delay the effective date for NCE standards to 1984 and would increase the i*
NOx standard. Again, the double-annular combustor is the only design_ of !_the two discussed herein, which will meet the proposed standards. The i _proposed 1984 standards, adjusted for an idle thrust setting of 6% SLTOD are !also shown on Figure 50. i _
[
I.
i!-_ .
,!L
5
?
\
_5
1980024900-100
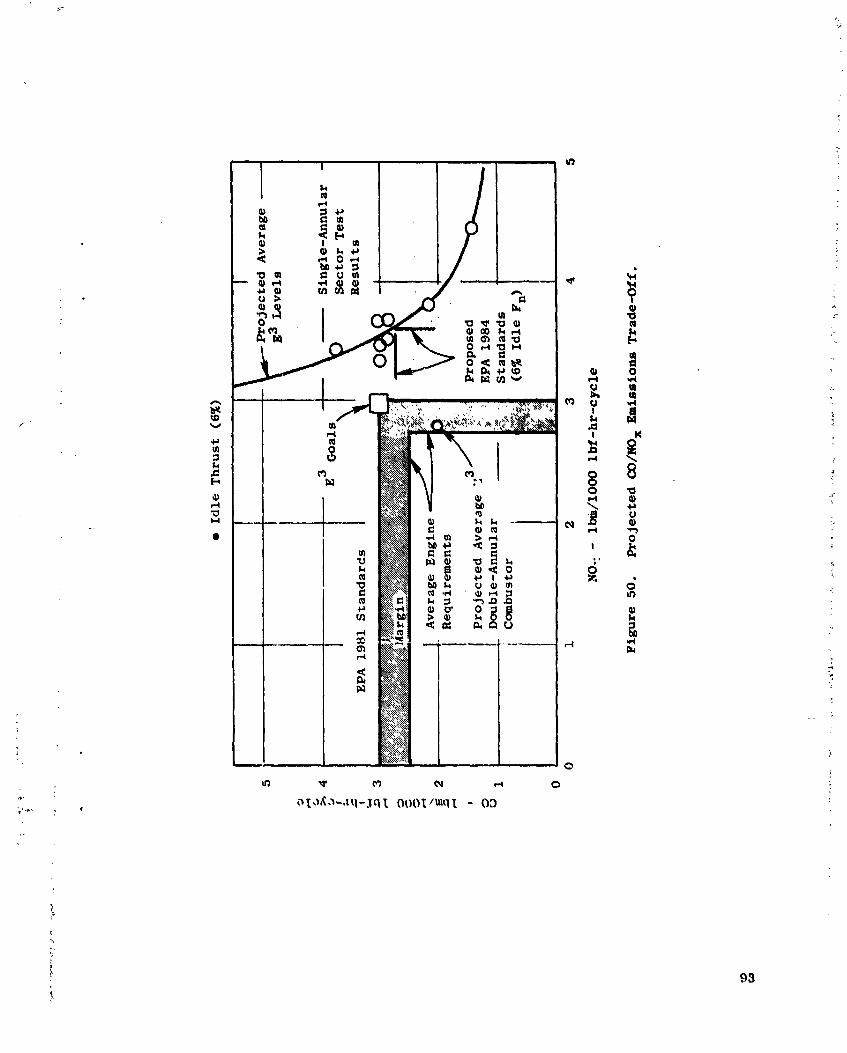
i
1980024900-101

!
?
8.0 CONCLUDING P=_RKS
Tlle E3 Single Annular Alternate Combusto. Project provided importantdesign technology for the evolution of short, single-annular, combustor de-
signs required to satisfy the very stringent emissions requirements of theE3 combustor system. As a result of this development test program, several
key design features were identified which resulted in significant reductions
in CO and HC emissions, at ground-ldle operating conditions, to levels which
would satisfy the E3 Project goals for these two emissions categories.
These features included impingement cooling of the forward sections of the
combustor liners, reduced dome-coollng flows, and increased swlrl-cup flows.
However, addlt_onal development effort will be required to evolve a single-
annular combustor design that will simultaneously demonstrate NO emission _
levels within the project goals, x
As part of this testing program, several combustor performance _
parameters were evaluated. Results determined that the overall combustor
total pressure drops, and combustor liner temperatures in general, exceed =
the E 3 combustor system requirements. However, neither of these observed
performance shortcomings represents a significant design barrier.
I
1
:(
94 "
'1
2
\
]980024900-]02

APPENDIX A - DEVELOPMENT TEST DATA
This appendix contains summaries of the operating conditions, combustorperformance data, and exhaust emissions data for each of the nine sector-com-bustor configurations and the one full-annular combustor configuration tested.For each of the simulated high engine power operating conditions, the CO, HC,
and NOx emissions indices are presented two ways: (1) measured test data and(2) corrected to the E3 baseline cycle comburtor inlet conditions, at which
the configurations were evaluated, using the adjustment procedures described
in Appendix B. _
,H
5
i
;' g5
]980024900-]0:3

96
1980024900-104

97
1980024900-105
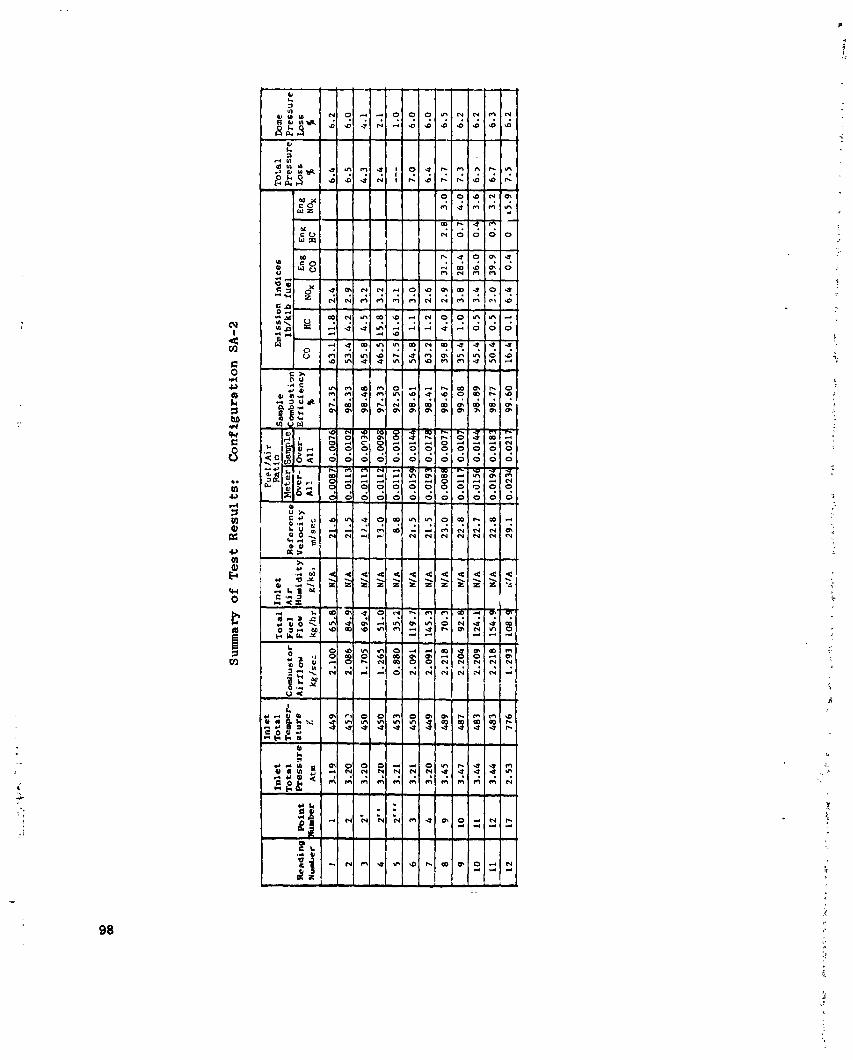
1980024900-106

99
1980024900-107

IO0
1980024900-108

ioi
• ",',, (,)fr,_l_lTy
1980024900-109

103
1980024900-110

103 :_
1980024900-111
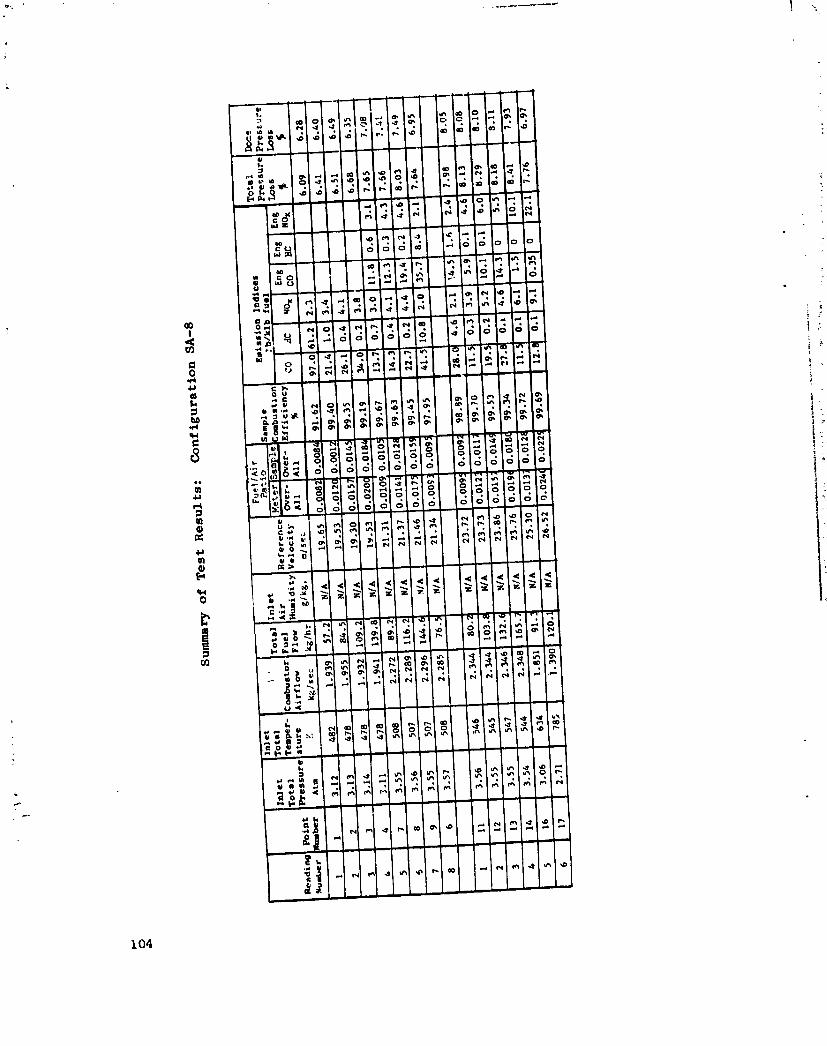
104
1980024900-112

,198002490
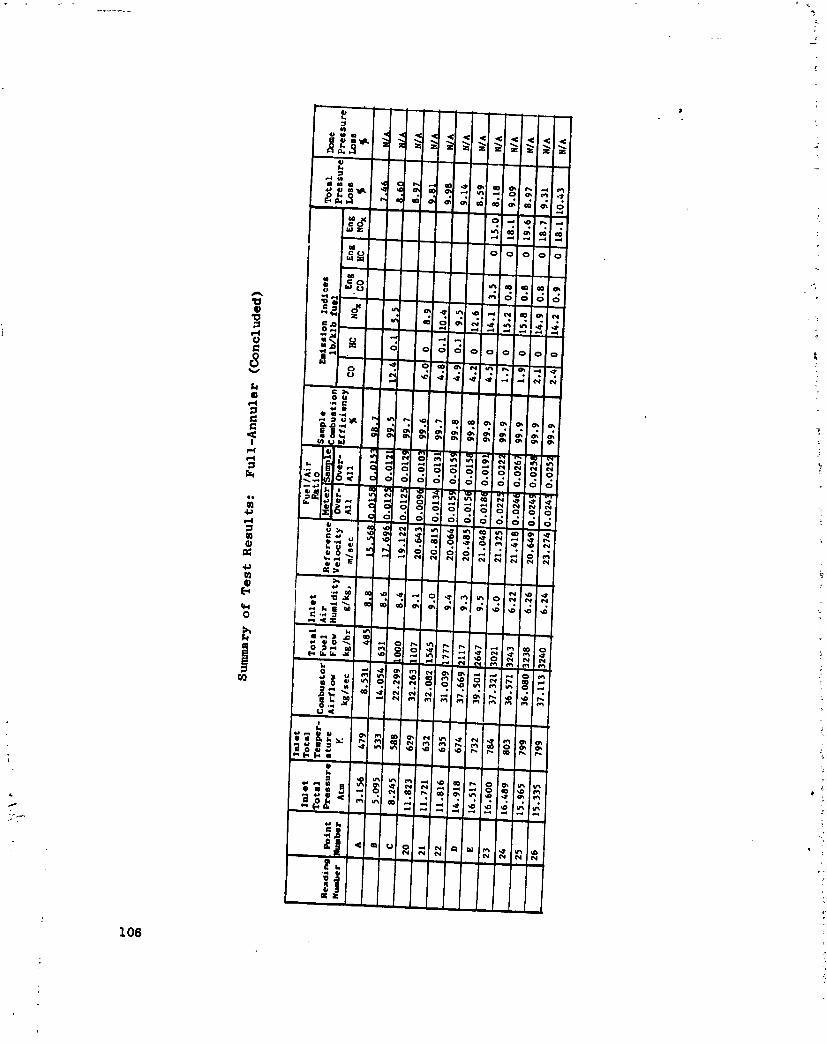
L
c.
106
1980024900-11
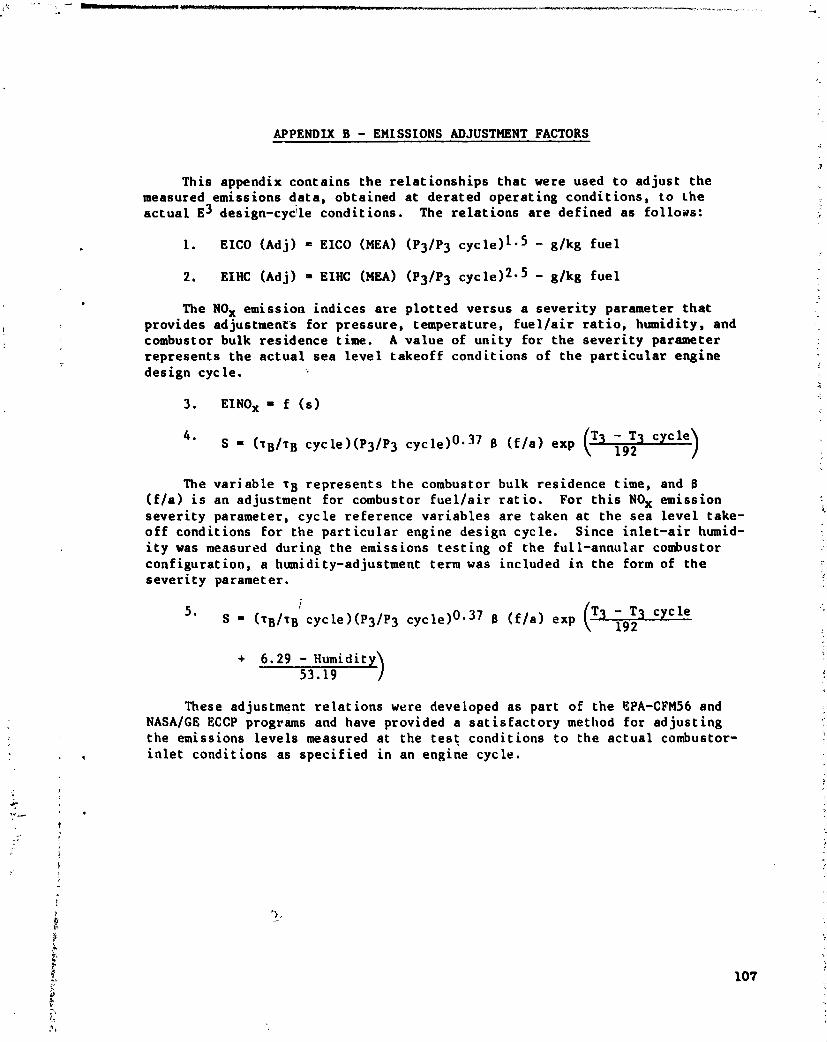
APPENDIX B - ENISSIONS ADJUSTNENT FACTORS
This appendix contains the relationships that were used to adjust themeasured emissions dataj obtained at derated operating conditions, to theactual E3 design-cyc_le conditions. The relations are defined as follo_s:
I. EICO (Adj) = EICO (MEA) (P3/P 3 cycle) 1"5 - g/kg fuel
2. EIHC (Adj) = EIHC (NEA) (P3/P 3 cycle) 2"5 - g/kg fuel
• The NOx emission indices are plotted versus a severity parameter thatprovides adjustments for pressure, temperature, fuel/air ratio, humidity, and
. combustor bulk residence time. A value of unity for the severity parameter !represents the actual sea level takeoff conditions of the particular engine •
design cycle.
3. EINOx = f (S) '_
( -T3 c,cle)4. S = (TB/_ B cycle)(P3/P 3 cycle) 0.37 S (f/a) exp T3 192
The variable _B represents the combustor bulk residence time, and B(f/a) is an adjustment for combustor fuel/air ratio. For this NOx emissionseverity parameter, cycle reference variables are taken at the sea level take-off conditions for the particular engine design cycle. Since inlet-air humid-ity was measured during the emissions testing of the full-annular combustorconfiguration, a humidity-adjustment term was included in the form of theseverity parameter.
5. S = (TB/T B cycle)(P3/P 3 cycle)0.37 B (f/a) exp T3 - T3 cycle192
+ 6.29 - Humidity_53.19 /
These adjustment relations were developed as part of the EPA-CFM56 andNASA/GE ECCP programs and have provided a satisfactory method for adjustingthe emissions levels measured at the test conditions to the actual combustor-
• , inlet conditions as specified in an engine cycle.
t
f
' ?
z, 107
] 980024900-] ] 5

APPENDIX C - NOMENCLATURE
Symbol Units
Ae Corhustor effective flow area cm2(Geometric area x flow coefficient)
Ar Combustor reference area cm2
CO Carbon monoxide pollutant emission
CO2 Carbon dioxide emission
Cp Smoke Correlating Parameter _akg/K (sec)
El Emission index g/ks fuel
EPAP Environmental Protection Agency emission parameter lbm-lbf-hr-cycle
f, f36 Total combustor metered fuel/air ratio g/kg
fs Fuel/air ratio calculated from gas sample g/kg
FN, Fn Installed Thrust kN
H Engine/combustor inlet-air humidity g/kg
HC Total unburned hydrocarbon pollutant emission
N Number of fuel injectors
NO Nitric oxide pollutant emission
NOx Total oxides of nitrogen pollutant emission
P3, PT3 Compressor discharge (combustor inlet) pressure MPa
S Severity Parameter
T3 Compressor discharge (combustor inlet) temperature K
T i Combustor Metal Temperature K
:" Tf Fuel temperature K
Wf Fuel flow rate kg/s
108
1980024900-116
APPENDIX C - NOMENCLATURE (Concluded)
s__mbot Unit_.._._s
W3 Compressor discharge total airflow rate kg/s
W36 , Wc Combustor airflow rate kg/s
APf Fuel manifold pressure drop MPa
• APt Combustor total pressure drop MPa
Equivalence Ratio
TB Bulk Residence Time ms
I
1980024900-117

REFERENCES
I. Gleascn, C.C., and Bahr, D.W., "The Experimental Clean Combustor Program -
Phase III Final Report," NASA CR-135384, June 1979.
2. Bahr, D.W., Burrus, D.L., and Sabla, P._., "Quiet Clean Short Haul
Experimental Engine (QCSEE) Double Annular Clean Combustor Technology
Development Report," NASA CR-159483, May 1979.
3. "Control of Air Pollution from Aircraft and Aircraft Engines," U.S.
Environmental Protection Agency, Federal Register, Volume 38, Number 136,
July 1973.
4. "Procedure for the Continuous Sampling and Measurement of Gaseous Emis-sions from Aircraft Turbine Engines," SAE Aerospace Recommended Practice
1256, October 1971.
5. "Control Of Air Pollution From Aircraft And Aircraft Engines - Proposed
Amendments To Standards," EPA, Federal Register, Volume 43, Number 58, _.March 1978.
110
1980024900-118