singapore p67 technical seminar closing report · the current belief of asus as of the date of this...
TRANSCRIPT

ASUSTeK 4Q 2015 Investor Conference

Confidential
Disclaimer
ASUSTeK’s presentation contains forward-looking
statements subject to significant risks and
uncertainties. Actual results may differ materially from
those contained in the forward-looking statements.
The forward-looking statements in this release reflect
the current belief of ASUS as of the date of this
release, we undertake no obligation to update these
forward-looking statements for new information,
future events, or otherwise.
2

Confidential
• 4Q 2015 Financial Result
• Business Highlights
• Strategy & Outlook
• Q & A
Agenda
3

4Q 2015 Financial Result
4

Confidential
4Q 2015 Brand I/S (QoQ) (unaudited brand consolidated financials)
5
*
* 4Q EPS = $6.12; 2015 EPS = $ 23.02
in NT$ Mn 4Q 2015 % 3Q 2015 % QoQ
Net Revenue 123,989 100.0% 110,985 100.0% 12%
COGS (107,199) (86.5%) (95,081) (85.7%) 13%
Gross Profit 16,789 13.5% 15,904 14.3% 6%
Operating Expenses (11,212) (9.0%) (10,877) (9.8%) 3%
Operating Income 5,577 4.5% 5,027 4.5% 11%
Non-OP Items 333 0.3% 109 0.1% 205%
Pre-Tax Income 5,911 4.8% 5,136 4.6% 15%
Tax (1,367) (1.1%) (921) (0.8%) 48%
Net Income 4,544 3.7% 4,215 3.8% 8%

Confidential
4Q 2015 Brand I/S (YoY) (unaudited brand consolidated financials)
6
in NT$ Mn 4Q 2015 % 4Q 2014 % YoY
Net Revenue 123,989 100.0% 127,059 100.0% -2%
COGS (107,199) (86.5%) (111,036) (87.4%) -3%
Gross Profit 16,789 13.5% 16,023 12.6% 5%
Operating Expenses (11,212) (9.0%) (10,197) (8.0%) 10%
Operating Income 5,577 4.5% 5,826 4.6% -4%
Non-OP Items 333 0.3% 135 0.1% 147%
Pre-Tax Income 5,911 4.8% 5,961 4.7% -1%
Tax (1,367) (1.1%) (1,452) (1.1%) -6%
Net Income 4,544 3.7% 4,509 3.5% 1%
* In constant currency basis (i.e., 4Q 2014 average exchange rates), 4Q 2015 revenue would have been +6% YoY
*

Confidential
2015 Brand I/S (YoY) (unaudited brand consolidated financials)
7
in NT$ Mn 2015 % 2014 % YoY
Net Revenue 436,520 100.0% 436,264 100.0% 0.1%
COGS (376,117) (86.2%) (377,845) (86.6%) -0.5%
Gross Profit 60,403 13.8% 58,418 13.4% 3%
Operating Expenses (40,357) (9.2%) (38,129) (8.7%) 6%
Operating Income 20,046 4.6% 20,289 4.7% -1%
Non-OP Items 1,853 0.4% 4,490 1.0% -59%
Pre-Tax Income 21,899 5.0% 24,779 5.7% -12%
Tax (4,801) (1.1%) (5,309) (1.2%) -10%
Net Income 17,097 3.9% 19,470 4.5% -12%

Confidential
4Q 2015 Non-OP Items (unaudited brand consolidated financials)
8
Non-OP Items 4Q 2015 3Q 2015 QoQ 4Q 2014 YoY
Interest Income (net) 122 30 302% 22 449%
Investment Income 124 321 -61% 630 -80%
Askey (53) 148 -136% 218 -124%
Others 177 174 2% 412 -57%
Exchange Gain / (Loss) 2 (2,286) 100% (713) 100%
Dividend Income 1,826 -100%
Other Income (net) 85 217 -61% 196 -57%
Total Non-OP items 333 109 205% 135 147%

Confidential
4Q 2015 Brand B/S
*CCC calculation based on average of Inventory/AR/AP balances and quarterly unaudited brand financials 9
*
in NT$ Mn Dec 31, 2015 Sep 30, 2015 QoQ Dec 31, 2014 YoY
Cash & cash equivalents 51,394 59,343 -13% 72,474 -29%
Accounts receivable 75,546 76,889 -2% 71,427 6%
Inventories 98,729 93,192 6% 94,725 4%
Current Assets 234,515 238,804 -2% 246,547 -5%
Long-term investments 70,625 77,647 74,731
Fixed assets 3,576 3,632 3,698
Other assets 10,458 10,014 9,466
Total Assets 319,174 330,097 -3% 334,441 -5%
Accounts payable 52,529 67,114 -22% 77,499 -32%
Current Liabilities 142,575 155,169 -8% 163,610 -13%
Total Liabilities 151,821 162,620 -7% 170,799 -11%
Paid-in capital 7,428 7,428 7,428
Stockholders' equity 167,352 167,478 -0.1% 163,642 2%
Avg. Days of Inventory 82 89 78
Avg. Days of AR 56 59 49
Avg. Days of AP 55 70 63
Avg. CCC Days 82 78 64

Business Highlights
10

Confidential
4Q 2015 Sales Mix
11
By Product By Region
PC
62%
Mobile
23%
IOT
3%
Component
12% EURP
37%
ASIA
40%
Americas
23%

Confidential
2015 Sales Mix
12
By Product By Region
PC
63%
Mobile
21%
IOT
3%
Component
13% EURP
31%
ASIA
47%
Americas
22%

Confidential
2015 Shipment
13
1Q 2Q 3Q 4Q Total YoY%
PC 5.4m 4.8m 5.3m 6.0m 21.5m -4%
- NB 4.8m 4.3m 4.8m 5.4m 19.3m -5%
Mobile 4.5m 6.0m 7.1m 8.3m 25.9m +45%
- Phone 3.0m 5.0m 5.5m 6.5m 20.0m +135%
* PC = NB + DT; Mobile = Phone + Pad

Confidential
1Q 2016 Shipment Outlook
14
1Q 2016 target YoY%
PC 5.3m 22~24m Outgrow
industry by
5~10% - NB 4.8m ~20m
Mobile ~5m 30~31m Outgrow
industry by
10~20% - Phone ~4m ~25m

Strategy & Outlook
15

In Search Of Incredible
創新迎戰 變中求勝
2016 / 2 / 17

Cloud (Big Data)
PC IOT
VR / AR Robotics
Accessing
Screening
Sharing
Generating
Interacting
Flowing
New Ubiquitous Cloud Computing Era
Mobile

Gaming (ROG) NB / DT / MB / VGA / Monitor
Zen AiO Pro / ZenBook ZenBook 303 / 305 / 501
Commercial DT / NB / Tablet / Chromebook
ASUS PC
Mainstream VivoBook / Vivo AiO
2-in-1 Flip / Transformer

PC Goal
in 2016 (e)
ASUS PC YoY :

ASUS Gaming NB
YoY in 2016 (e)
CN / USA / FR / DE / RU ( over 70% of total TAM ) Source : GFK

ASUS ZenBook
YoY in 2016 (e)
An Evolution of Everything
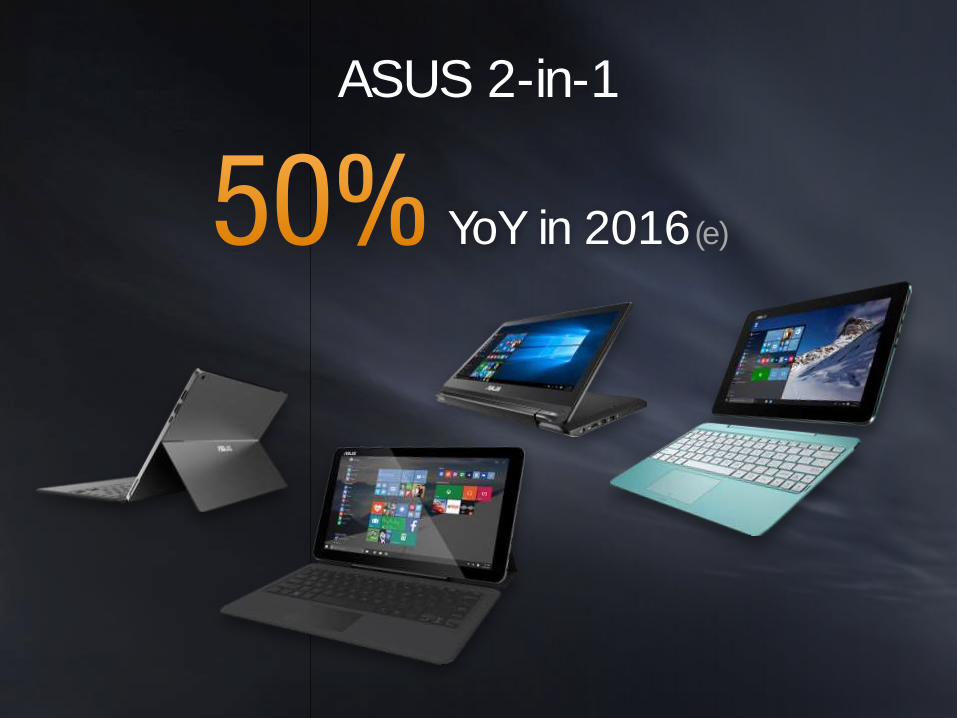
ASUS 2-in-1
YoY in 2016 (e)

ASUS AiO
YoY in 2016 (e)

ASUS VR / AR
Phone based VR / AR ( 2016 Q4 )
PC based VR Facebook Oculus Rift

ASUS Mobile
Empowering Luxury
for Everyone
ZenPad / ZenPad Theater ZenFone
Empowering Luxury
for Everyone

Phone Goal
in 2016 (e)
in 2016 (e)
(excluding China Market)
(excluding China Players)

The New ZenFone
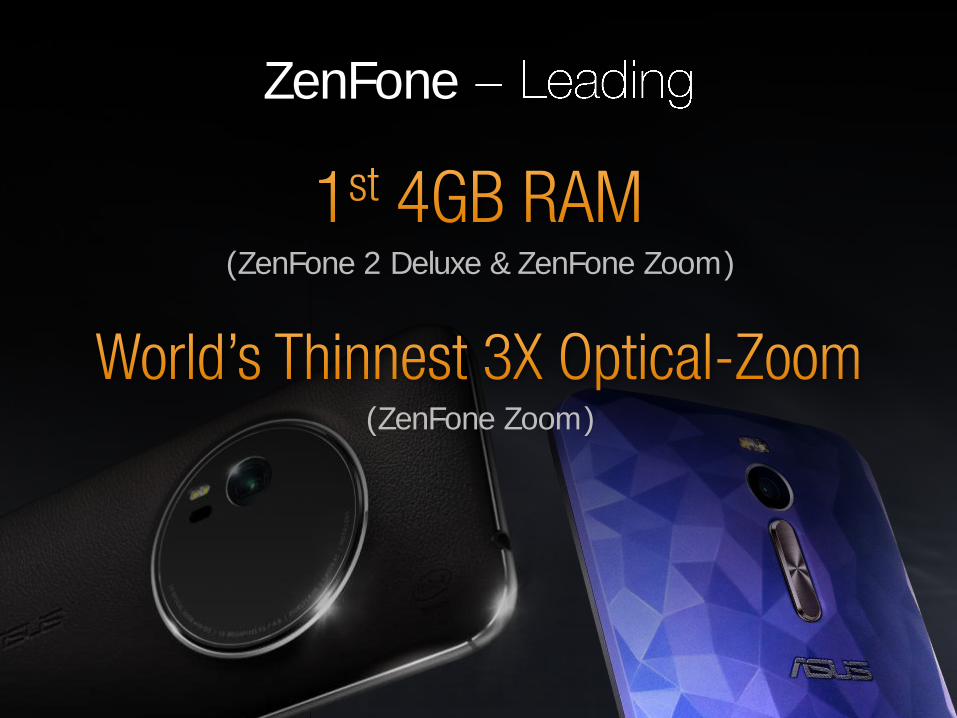
ZenFone
( ZenFone 2 Deluxe & ZenFone Zoom)
( ZenFone Zoom)

A New Era of Mobile Photography
Oscar award in design industry
World-class camera technology
OIS empowers shake-free photos
Equipped with Laser auto-focus system
32s long exposure, 5cm macro focusing, 52MP photos, 4X sensitivity & contrast
Intel 64-bit Z3590 Super Quad Core CPU 2.5Ghz
BoostMaster fast charging technology


with 3X optical-zoom


with 3X optical-zoom

with 3X optical-zoom

with 3X optical-zoom


Instant Update via Google Play Store
• ZenUI Apps over 440,000,000 downloads
• Total 38 Apps in Google Play
• Average 4.5 rating
• 5 ZenUI apps got 4.7 amazing high rating ( t )
ZenUI Apps Instant Update
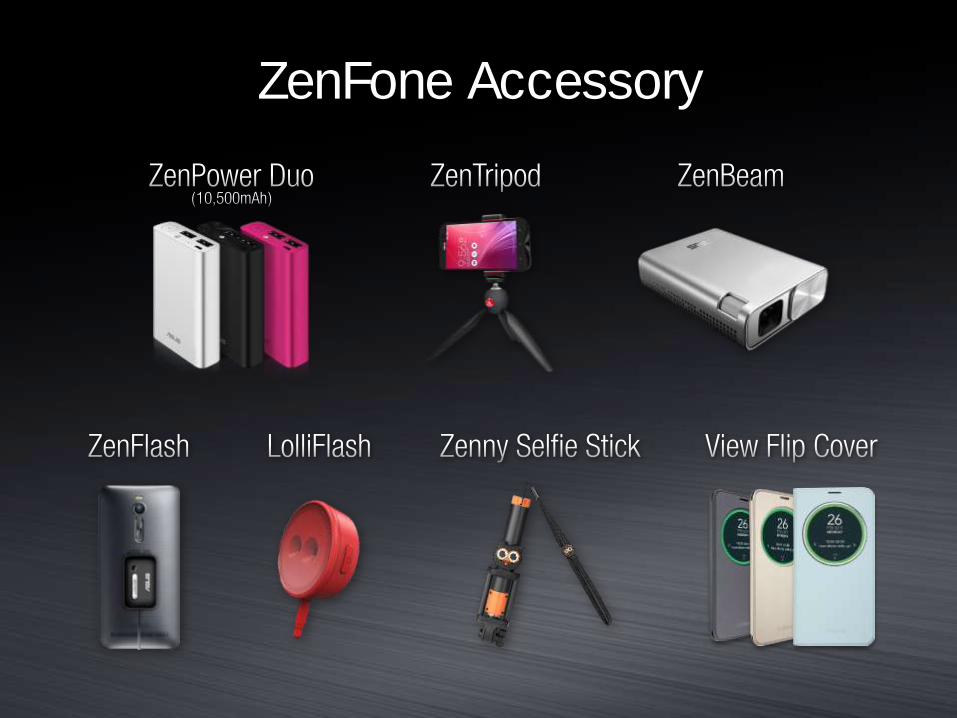
ZenFone Accessory

ZenFone 3 & Robotics
(2016 Computex)

leading enterprise in the new digital era.

ASUSTeK 4Q 2015 Investor Conference