singapore p67 technical seminar closing report › event › investor › content › ...• best...
TRANSCRIPT

ASUSTeK4Q 2019 Investor Conference

Disclaimer
ASUSTeK’s presentation contains forward-looking statements subject to significant risks and uncertainties. Actual results may differ materially from those contained in the forward-looking statements.
The forward-looking statements in this release reflect the current belief of ASUS as of the date of this release, we undertake no obligation to update these forward-looking statements for new information, future events, or otherwise.
2
• 4Q 2019 Financial Result
• Business Highlights
• Strategy & Outlook
• Q & A
Agenda
3

4Q 2019 Financial Result

4Q 2019 Brand P&L
(unaudited brand consolidated financials)
in NT$ Mn 2019 4Q 2019 3Q QoQ 2018 4Q YoY
Net Revenue 89,288 88,467 1% 88,099 1%
COGS (77,551) (74,955) 3% (84,446) -8%
Gross Profit 11,737 13,512 -13% 3,653 221%
Operating Expenses (10,747) (9,150) 17% (9,998) 7%
Operating Profit 991 4,362 -77% (6,345) 116%
Non-OP Items 2,162 2,643 -18% 2,510 -14%
Pre-Tax Profit 3,153 7,005 -55% (3,835) 182%
Tax (514) (1,372) -63% 1,016 -151%
Net Profit 2,639 5,633 -53% (2,819) 194%
EPS 3.6 7.6 (3.8)
Gross Margin % 13.1% 15.3% 4.1%
Operating Margin % 1.1% 4.9% -7.2%
5

Phone Phone
in NT$ Mn 2019 4Q old models new models W/O Phone
Net Revenue 89,288 1,898 3,437 83,953
COGS (77,551) (2,098) (3,377) (72,076)
Gross Profit 11,737 (200) 60 11,877
Operating Expenses (10,747) (173) (862) (9,712)
Operating Profit 991 (372) (802) 2,165
Non-OP Items 2,162 (365) (41) 2,569
Pre-Tax Profit 3,153 (738) (844) 4,734
Tax (514) 346 71 (932)
Net Profit 2,639 (391) (773) 3,802
EPS 3.6 (0.5) (1.0) 5.1
Gross Margin % 13.1% -10.5% 1.7% 14.1%
Operating Margin % 1.1% -19.6% -23.3% 2.6%
4Q 2019 Brand P&L (pro forma – excluding phone’s P&L)
(unaudited brand consolidated financials)6

4Q 2019 Brand Non-OP Items
Non-OP Items 2019 4Q 2019 3Q QoQ 2018 4Q YoY
Interest Income (net) 276 292 -5% 269 3%
Investment Income 491 44 1016% 517 -5%
Askey 123 (40) 403% (319) 138%
Others 368 84 336% 837 -56%
Exchange Gain/(Loss) 1,053 (141) 846% 514 105%
Dividend Income 2,301
Disposal Gain - 1,212 -
Other Income (net) 342 148 131% (3) 12118%
Total Non-OP items 2,162 2,643 -18% 2,510 -14%
(unaudited brand consolidated financials)7

in NT$ Mn Dec 31, 2019 Sep 30, 2019 QoQ Dec 31, 2018 YoY
Cash & equivalents 75,453 58,993 28% 55,773 35%
Accounts receivable 63,521 68,883 -8% 75,273 -16%
Inventories 68,937 73,452 -6% 86,694 -20%
Current Assets 216,631 212,462 2% 226,428 -4%
Long-term investments 78,279 69,232 13% 64,515 21%
Fixed assets 17,930 17,282 4% 11,855 51%
Total Assets 329,550 315,340 5% 318,283 4%
Accounts payable 53,362 50,658 5% 58,850 -9%
Current Liabilities 139,410 136,194 2% 145,620 -4%
Total Liabilities 152,690 147,832 3% 156,918 -3%
Paid-in capital 7,428 7,428 7,428
Stockholders' equity 176,860 167,508 6% 161,365 10%
Avg. Days of Inventory 84 90 93
Avg. Days of AR 68 68 82
Avg. Days of AP 65 61 73
Avg. CCC Days 87 98 102
4Q 2019 Brand Balance Sheet
8 (unaudited brand consolidated financials)
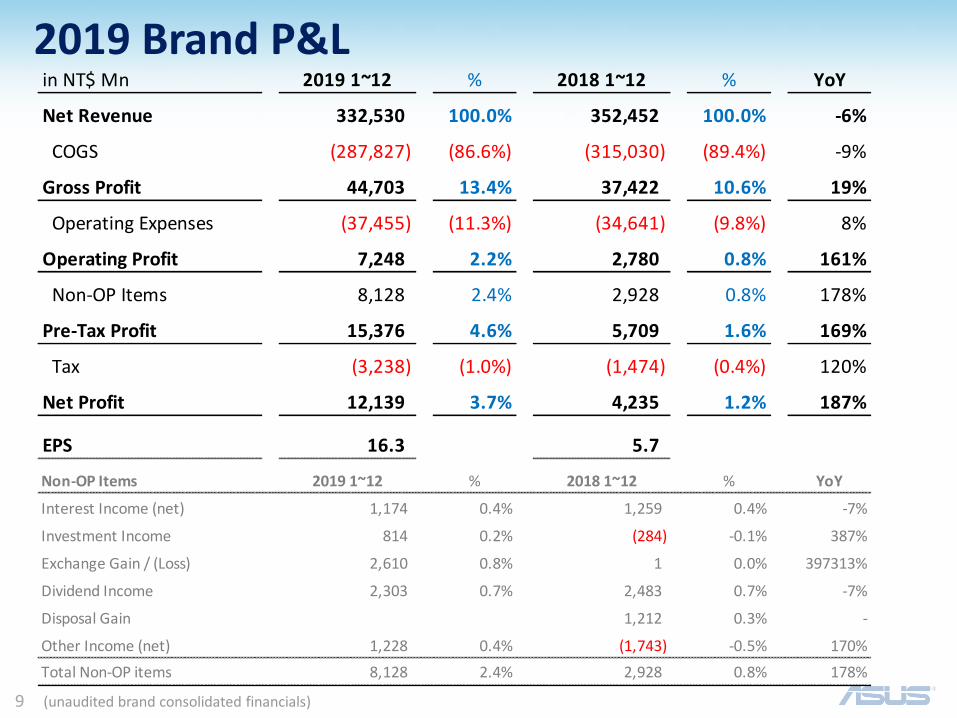
2019 Brand P&L
(unaudited brand consolidated financials)9
in NT$ Mn 2019 1~12 % 2018 1~12 % YoY
Net Revenue 332,530 100.0% 352,452 100.0% -6%
COGS (287,827) (86.6%) (315,030) (89.4%) -9%
Gross Profit 44,703 13.4% 37,422 10.6% 19%
Operating Expenses (37,455) (11.3%) (34,641) (9.8%) 8%
Operating Profit 7,248 2.2% 2,780 0.8% 161%
Non-OP Items 8,128 2.4% 2,928 0.8% 178%
Pre-Tax Profit 15,376 4.6% 5,709 1.6% 169%
Tax (3,238) (1.0%) (1,474) (0.4%) 120%
Net Profit 12,139 3.7% 4,235 1.2% 187%
EPS 16.3 5.7
Non-OP Items 2019 1~12 % 2018 1~12 % YoY
Interest Income (net) 1,174 0.4% 1,259 0.4% -7%
Investment Income 814 0.2% (284) -0.1% 387%
Exchange Gain / (Loss) 2,610 0.8% 1 0.0% 397313%
Dividend Income 2,303 0.7% 2,483 0.7% -7%
Disposal Gain 1,212 0.3% -
Other Income (net) 1,228 0.4% (1,743) -0.5% 170%
Total Non-OP items 8,128 2.4% 2,928 0.8% 178%

Phone Phone
in NT$ Mn 2019 1~12 old models new models W/O Phone
Net Revenue 332,530 17,139 6,360 309,031
COGS (287,827) (17,424) (6,465) (263,938)
Gross Profit 44,703 (285) (105) 45,093
Operating Expenses (37,455) (2,108) (2,678) (32,669)
Operating Profit 7,248 (2,393) (2,783) 12,424
Non-OP Items 8,128 (168) 5 8,290
Pre-Tax Profit 15,376 (2,560) (2,778) 20,715
Tax (3,238) 365 381 (3,984)
Net Profit 12,139 (2,195) (2,397) 16,731
EPS 16.3 (3.0) (3.2) 22.5
Gross Margin % 13.4% -1.7% -1.7% 14.6%
Operating Margin % 2.2% -14.0% -43.8% 4.0%
2019 Brand P&L (pro forma – excluding phone’s P&L)
(unaudited brand consolidated financials)10

Business Highlights

4Q 2019 Revenue Mix
PC74%
Component& others
26%
By Product Group By Region
* Excluding revenue of smartphones12
EURP38%
ASIA41%
Americas21%

2019 Revenue Mix
PC71%
Component& others
29%
By Product Group By Region
* Excluding revenue of smartphones13
EURP34%
ASIA45%
Americas21%

1Q 2020 Business Outlook
• PC QoQ -40%
• Component QoQ -5%
14
Strategy & Outlook
Confidential
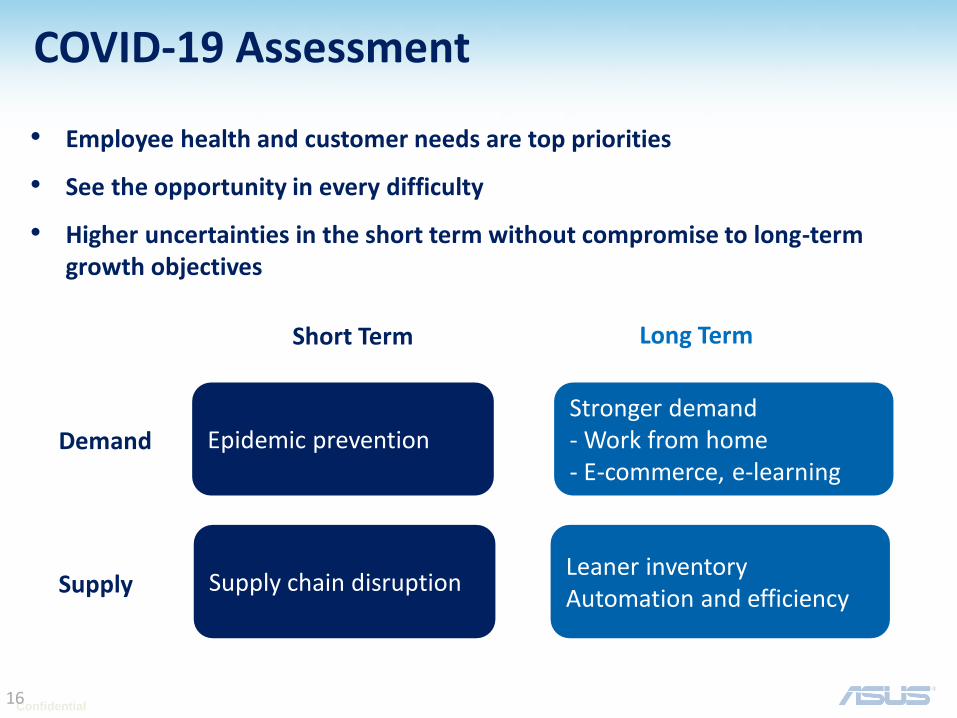
• Employee health and customer needs are top priorities
• See the opportunity in every difficulty
• Higher uncertainties in the short term without compromise to long-term growth objectives
Supply
Demand
Supply chain disruption
Short Term Long Term
Epidemic prevention
Leaner inventoryAutomation and efficiency
Stronger demand- Work from home- E-commerce, e-learning
COVID-19 Assessment
16

Confidential
Key Business Objectives
17
Manage market dynamics
Expand addressable
market
Focus on areas of growth

Confidential
Business Growth
(Units)(Revenue YoY) (Revenue YoY)
18
Confidential
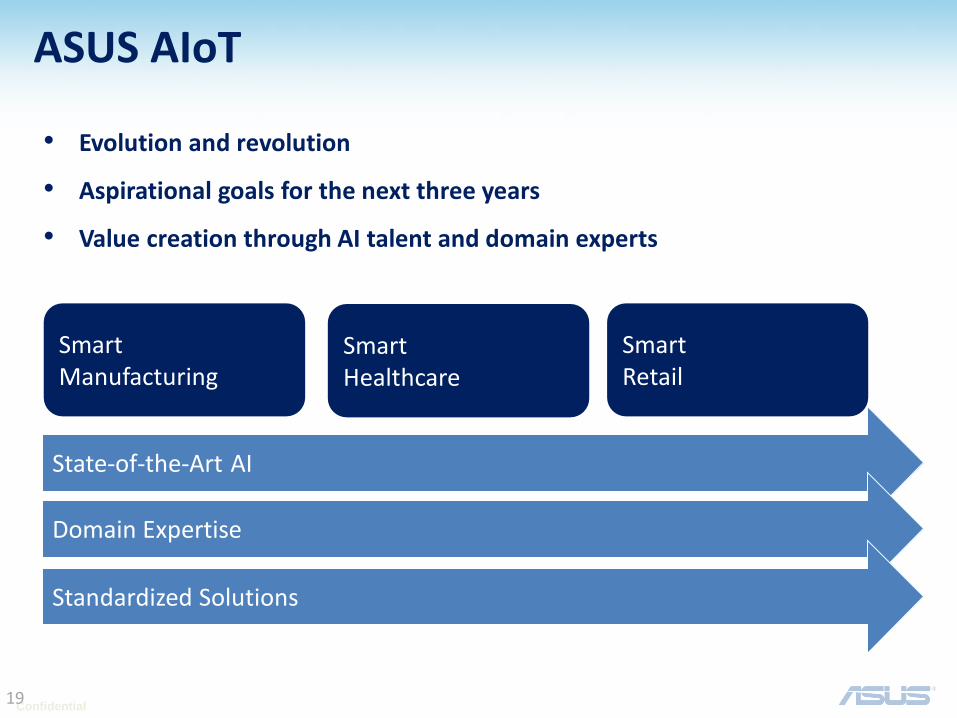
Smart Healthcare
Smart Manufacturing
Smart Retail
State-of-the-Art AI
Domain Expertise
Standardized Solutions
• Evolution and revolution
• Aspirational goals for the next three years
• Value creation through AI talent and domain experts
ASUS AIoT
19

Confidential
ProArt
Gaming
Thin & Light
Consumer PCs
PC
• Brand and product strength
• Expand addressable market
• Best user experience
20
Confidential
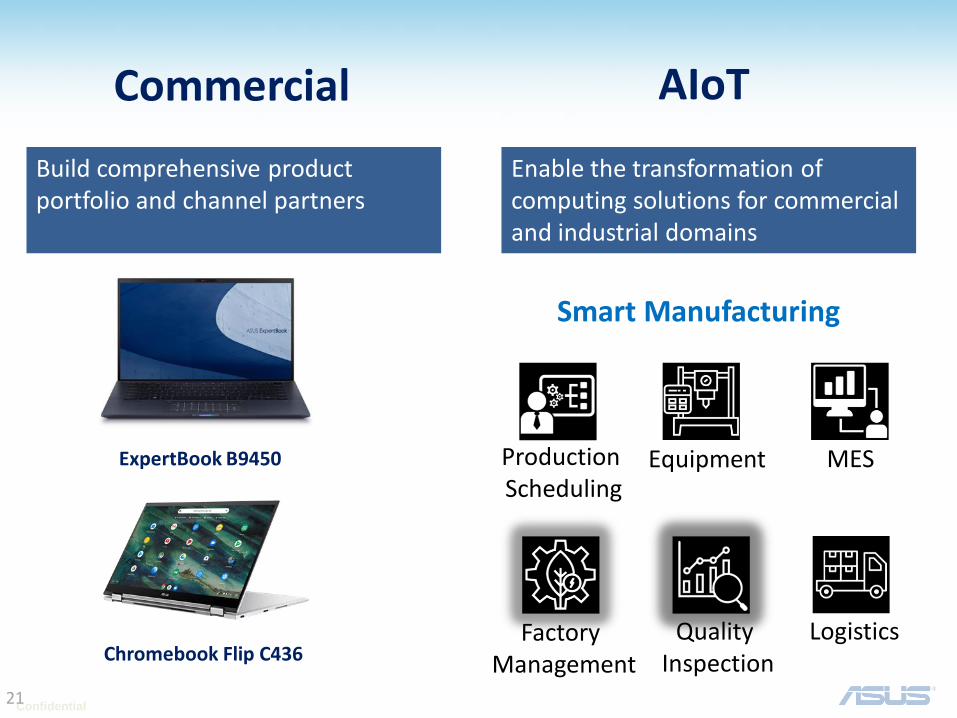
Commercial AIoT
Build comprehensive product portfolio and channel partners
Enable the transformation of computing solutions for commercial and industrial domains
Chromebook Flip C436
ExpertBook B9450
Smart Manufacturing
EquipmentProduction Scheduling
MES
Quality Inspection
LogisticsFactory Management
21
Confidential
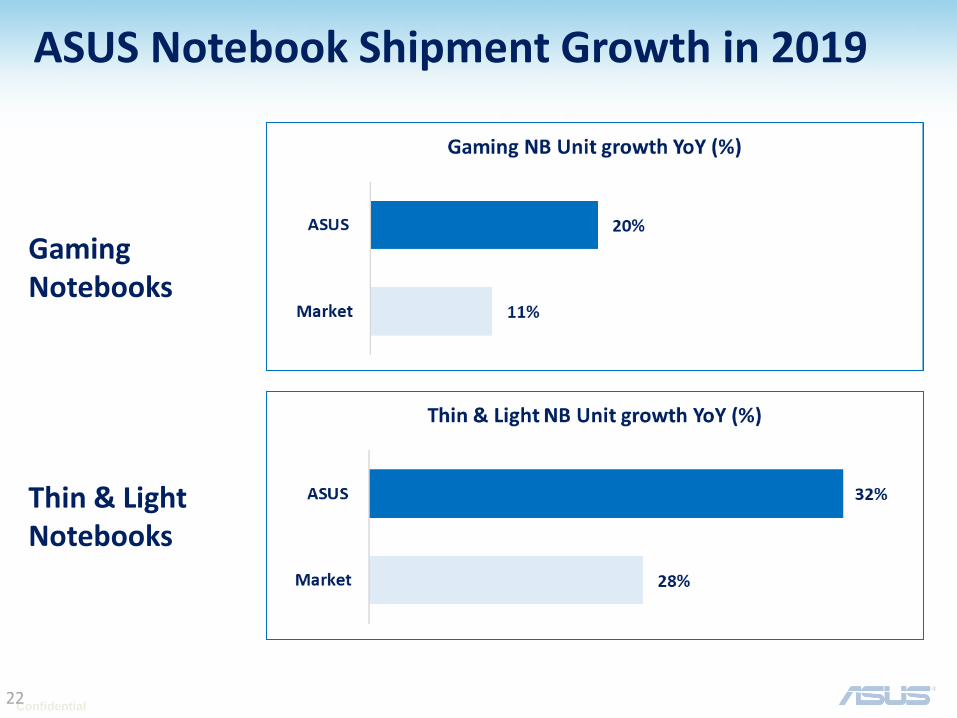
ASUS Notebook Shipment Growth in 2019
GamingNotebooks
Thin & LightNotebooks
22

Confidential
Gaming Notebook Growth by Region
#1 #1
#1
Market share %
23

Q & A