singapore: a case study - fvv.tuwien.ac.at a case study • the development of a “world class...
TRANSCRIPT

Singapore:a case study
Professor Tony MayInstitute for Transport Studies
University of Leeds
Singapore: a case study
• The development of a “world class transport system”
• Based on an international audit conducted for the Land Transport Authority in 1997
• And updates to 2003– See Transport Reviews 24(1) 2004I
• But note that developments since then may not have been fully reflected
The Land Transport Authority
• Formed in 1995• Responsible for
– Policy– Planning and transportation– Vehicle and transit licensing– Projects and engineering– Contracts and process– Corporate services
Other Agencies
• Two private PT companies• Public Transport Council (fares, services)• Traffic Police (enforcement, safety)• Urban Redevelopment Agency (land use)• Ministry of Environment (pollution)• But a city state with only one tier of
government responsible for transport
Singapore’s Land Transport Policy
• Pre 1972– Unreliable bus services– Pirate taxis– Poor traffic management
• 1972 Strategy based on a UNDP study– network of expressways– comprehensive traffic management– restraint of car use in Central Area– restructuring of bus services– investigation of Mass Rapid Transit

Trends in transport demand
Year 1970 1980 1990 1995
Population (millions)
2.01 2.28 2.71 2.99
No. of cars 142600 153300 272500 345400
Cars/person 0.07 0.07 0.10 0.12
Motorised trips/per person/per day
n.a. 1.19 1.37 1.67
Percentage by car
n.a. 13.6 16.1 20.2

Trends in transport supply
1972 1999Road length (km) 1000 3100Expressway (km) 0 149
Bus operators 11 2
Buses 3730 3300
Rail (MRT) (km) 0 83
Stations 0 49
Light rail (km) 0 8
Stations 0 14

Singapore’s Land Transport Policy
• 1996 White Paper Mission– To provide Singaporeans with a world class
transport system– To develop an effective transport network:
integrated, efficient, cost-effective, sustainable– To support a quality environment: optimal use
of transport– To encourage commuters to choose the most
appropriate mode
Objectives and Indicators
• Equity not mentioned, but implicit• No explicit priorities; though efficiency is
in practice dominant• Few performance indicators, except for
congestion (80% free flow) and mode split
Figure 4

1996 Strategy
• Based on continuation and development of the 1972 strategy– Integrating transport and land use– Road network capacity maximisation,
expansion– Managing demand for road use– Quality public transport choices– Information technology applications
Strategy Timescales
• Low cost measures: continued development• Land use, infrastructure: five year plans• Longer term Concept Plan
– 2010– 2030– 2045– Plan X

The 2001 Concept Plan

The Year X Road Network
Barriers• Legal and institutional
– few constraints• Finance
– not a major barrier– revenues exceed expenditure
• Political– public opinion largely supportive
but restraint implemented early (1975)• Practical
– availability of land– volume of construction activity

Land Use Control
• 1991 Concept Plan– decentralise commercial activities
• focused on MRT stations
– locate employment near housing• to reduce the need to travel
• Master Plan and Development Guide Plans– control use of all land– including links to PT, pedestrian routes

Land use control• But housing is expensive• So few people move when changing jobs
– Around 15% of residents in many new towns work there
• And average journey lengths remain high
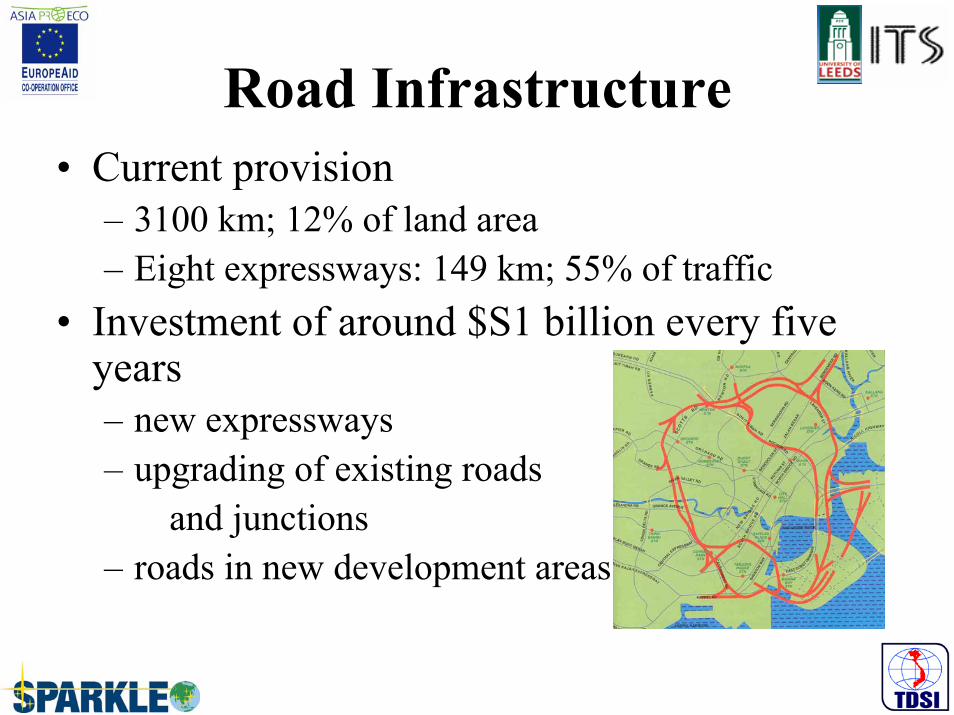
Road Infrastructure• Current provision
– 3100 km; 12% of land area– Eight expressways: 149 km; 55% of traffic
• Investment of around $S1 billion every five years– new expressways– upgrading of existing roads
and junctions– roads in new development areas

Demand managementTaxes on ownership
1972 1998
Import duty 10% of OMV 45% of OMV
Registration fee $S15 $S1000
Additional registration fee Zero 175% of OMV
Annual road tax 10 c/cc 100 c/cc
Purchase price 1500 cc (1998 prices) $S22,000 $S69,000
OMV = original market value

Demand Management• Vehicle quota system
– monthly quota based on 3% pa growth– Certificate of Entitlement bids against quota– around $S30,000 for all sizes of vehicle
• Total vehicle fleet– projected to be over 1,000,000 by 1990– in practice under 700,000 in 1999


Demand Management
• Area Licensing Scheme– introduced in 1975– charges to enter city centre in am peak– several alternatives offered– car use reduced by over 40%– subsequently extended
• to whole day plus Saturdays• to expressways

Demand Management• Electronic Road Pricing
– introduced in 1998– replaced ALS by gantries– with almost 700,000 vehicles equipped– and flexible charges– based on maintaining speeds
• 20-30 km/h in centre• 45-60 km/h on expressways
– plans to extend to additional cordons or distance-based charging

Public Transport• Licensed, unsubsidised buses
– standards specified, but some criticism• Rapid Transit System
– currently 100 km; heavy and light rail– $S2 billion pa expansion programme
• Special bus, taxi services for niche markets• Fares regulated and integrated
– but reluctance to increase fares

Light rail developments and future plans

Integrated transport management

Integrated transport management
• GLIDE traffic signal control system based on SCATS: all 1750 signals
• Expressway Monitoring and Advisory System• ERP information• TrafficScan using GPS data on taxi travel times to
review ERP charge levels• Real time information in vehicles and at bus stops• Journey planning information

Attributes of Success
• Long term, stable vision and strategy• Integration of land use, demand
management, roads and public transport• Single tier of government• No serious barriers to implementation• Gradual implementation > public support• Willingness to experiment with new ideas
Attributes of Success
• High quality planning tools• Land use control avoids relocation response• Extensive range of demand management• Quality PT for main and niche markets• Intensive application of information
technology