simultaneously inferring t cell fate and clonality from ... · michael j.t. stubbington 1* , tapio...
TRANSCRIPT

Simultaneously inferring T cell fate and clonality from single cell
transcriptomes
Michael J.T. Stubbington1*, Tapio Lönnberg1*, Valentina Proserpio1, Simon
Clare2, Anneliese O. Speak2, Gordon Dougan2, Sarah A. Teichmann1,2
1European Molecular Biology Laboratory, European Bioinformatics Institute (EMBLEBI),
Wellcome Genome Campus, Hinxton, Cambridge, CB10 1SD, UK
2Wellcome Trust Sanger Institute, Wellcome Genome Campus, Hinxton, Cambridge, CB10
1SA, UK
*These authors contributed equally to this work
Corresponding author:
S. A. T.
Phone: +44 (0) 1223 492520
Fax: +44 (0) 1223 494468
Other author email addresses:
M.J.T.S: [email protected]
T.L: [email protected]
V.P.: [email protected]
S.C.: [email protected]
A.O.S.: [email protected]
G.D.: [email protected]
not peer-reviewed) is the author/funder. All rights reserved. No reuse allowed without permission. The copyright holder for this preprint (which was. http://dx.doi.org/10.1101/025676doi: bioRxiv preprint first posted online Aug. 28, 2015;

ABSTRACT
The heterodimeric T cell receptor (TCR) comprises two protein chains that pair to determine
the antigen specificity of each T lymphocyte. The enormous sequence diversity within TCR
repertoires allows specific TCR sequences to be used as lineage markers for T cells that
derive from a common progenitor. We have developed a computational method, called
TraCeR, to reconstruct fulllength, paired TCR sequences from T lymphocyte singlecell
RNAseq by combining existing assembly and alignment programs with a “synthetic
genome” library comprising all possible TCR sequences. We validate this method with PCR
to quantify its accuracy and sensitivity, and compare to other TCR sequencing methods. Our
inferred TCR sequences reveal clonal relationships between T cells, which we put into the
context of each cell’s functional state from the complete transcriptional landscape quantified
from the remaining RNAseq data. This provides a powerful tool to link T cell specificity
with functional response in a variety of normal and pathological conditions. We demonstrate
this by determining the distribution of members of expanded T cell clonotypes in response to
Salmonella infection in the mouse. We show that members of the same clonotype span early
activated CD4+ T cells, as well as mature effector and memory cells.
not peer-reviewed) is the author/funder. All rights reserved. No reuse allowed without permission. The copyright holder for this preprint (which was. http://dx.doi.org/10.1101/025676doi: bioRxiv preprint first posted online Aug. 28, 2015;

INTRODUCTION
T lymphocytes are crucial to the adaptive immune system. Key to their function is the ability
of each T cell to recognise specific peptide–major histocompatibility complex (pMHC)
combinations presented on the surface of antigen presenting cells 1. This specific recognition
is mediated by the T cell receptor (TCR), an extremely diverse cellsurface protein that has
been estimated to have up to 1015 possible variations 2. The TCR is a heterodimer of an α and
a β chain that are encoded by genes produced by V(D)J recombination of two separate
germline loci during T cell development3. The enormous nucleotide sequence diversity of
paired TCR sequences allows us to assume that cells with identical paired TCR genes arose
from the same T cell clone.
The diversity of single TCR chains (typically β) has been used as a proxy for overall clonal
diversity within bulk populations of T lymphocytes 4–6 but studies of bulk populations cannot
determine the paired heterodimeric chains within each cell. This limits their ability to perform
highresolution determination of the clonal relationships between individual cells and also to
draw conclusions about the antigenic specificities of the T cells in the studied population1.
An ability to study the paired TCR sequences within individual T cells will be extremely
powerful in understanding the adaptive immune response in a variety of normal and
pathological conditions. Knowledge of the paired TCR chains that are involved in T cell
responses to particular pathogens and antigens will be crucial in informing studies intended to
discern the 'grammar' of TCR recognition or to design therapeutic TCR molecules.
Furthermore, making a connection between TCR sequence and the transcriptional identity of
individual T cells will be even more informative, enabling us to connect cellular
not peer-reviewed) is the author/funder. All rights reserved. No reuse allowed without permission. The copyright holder for this preprint (which was. http://dx.doi.org/10.1101/025676doi: bioRxiv preprint first posted online Aug. 28, 2015;

transcriptional fate with antigen specificity, to measure and model the dynamics of clonal
expansion within T cell populations and to investigate T cell phenotypic plasticity.
Paired TCR analysis has been performed in individual singlecells but these methods have,
until now, relied upon specific amplification of the TCR loci7–10 or capture of the TCR
genes 11 and so provide no other information about the cells in question. In addition, biases in
PCR primer efficiency prevent accurate determination of TCR expression levels. A method
that also amplifies a small set of ‘phenotyping marker’ genes 12 provides limited information
about the functional identity of the cells and requires a priori knowledge of genes whose
expression will be informative, as well as the design and optimisation of many multiplexed
PCR primers.
Singlecell RNAseq (scRNAseq) has already proved valuable in investigating the
transcriptional heterogeneity and differentiation processes of several cell populations 13–19 and
has provided insights into a novel T lymphocyte subset20. However, it has not yet been
possible to determine recombined TCR sequences from T cell scRNAseq datasets.
Existing computational tools for the analysis of TCR sequences are designed for use with
experiments that analyse bulk cell populations and also require the targeted amplification of
TCR loci during the experimental step21–25. Therefore, the nature of bulk TCRsequencing
data is quite different from singlecell whole transcriptome RNAsequencing data, and the
requirements for alignment methods are distinct. In future, combining these methods with
single cell data could be a fruitful strategy to gain a global overview of clonal amplifications
not peer-reviewed) is the author/funder. All rights reserved. No reuse allowed without permission. The copyright holder for this preprint (which was. http://dx.doi.org/10.1101/025676doi: bioRxiv preprint first posted online Aug. 28, 2015;

of individual loci together with indepth phenotyping of several hundreds to thousands of
individual cells.
Here, we present a novel method and software tool that enables fulllength, paired TCR
sequences (alongside their expression levels) to be reconstructed from singlecell RNAseq
data with high accuracy and sensitivity. Importantly, this method requires no alterations to
standard scRNAseq protocols and so can be easily applied to any species and sample for
which scRNAseq is possible. This novel approach links clonal ancestry and antigen
specificity with the comprehensive transcriptomic identity of each studied T cell.
RESULTS
Extraction and assembly of complete TCR sequences from RNAseq data
We have extended the analysis of RNAseq data from single T lymphocytes to enable the
accurate and specific reconstruction of fulllength sequences of recombined and expressed
TCR loci within each cell. Importantly, this approach does not require any alterations to
standard singlecell RNAseq protocols and, furthermore, provides accurate, unbiased
measurements of expression for thousands of genes within the transcriptome of each cell as
well for the TCR loci themselves. Here, we use scRNAseq data generated using the
SMARTSeq protocol26 performed using the Fluidigm C1 microfluidics system. Our method
would, however, work with any RNAseq data derived from fulllength cDNA.
Our method begins by extracting TCRderived sequencing reads from the pool of all
RNAseq reads for each single cell ( Fig. 1a). This is achieved by aligning the sequencing
reads against ‘synthetic genomes’ comprising all possible combinations of V and J segments
not peer-reviewed) is the author/funder. All rights reserved. No reuse allowed without permission. The copyright holder for this preprint (which was. http://dx.doi.org/10.1101/025676doi: bioRxiv preprint first posted online Aug. 28, 2015;

( Fig. 1b ). A separate synthetic genome and alignment step was used for the alpha and beta
TCR loci. The alignment step is performed with low stringency to ensure that the maximum
number of TCRderived reads are captured. We then assemble the potential TCRderived
reads for each locus into contiguous sequences (contigs) using the de novo RNAseq
assembly package, Trinity27. This assembly step provides resolution of sequencing errors to
provide highlyaccurate contig sequences.
To determine which of the assembled contigs represent fulllength, recombined TCR
sequences we use IgBLAST28 to analyse each contig and, where possible determine the V, D
and J segments within the contig and the exact nucleotide sequences of the junctions. Contigs
are taken forwards for further analysis if they have gene segments from the expected locus
(i.e. TCRα genes for TCRα contigs) along with low IgBlast Evalues indicative of
highquality alignment.
Importantly, the reconstructed recombinant sequences typically contain nearly the complete
length of the TCR V(D)J region ( Fig. 1c) and so allow highconfidence discrimination
between closely related and highlysimilar gene segments. Where multiple contigs from a
single cell all represent the same original recombinant TCR sequence, they are collapsed into
a single assignment. TCR sequences are then analysed for the presence of an appropriate
open reading frame to determine whether they can produce a fulllength polypeptide chain.
Finally, the full nucleotide sequence of each recombinant is reduced to a recombinant
identifier ( Fig. 1a) that uses IMGT gene nomenclature29,30 and uniquely represents the V and
J segments as well as the junctional nucleotides present in the sequence.
not peer-reviewed) is the author/funder. All rights reserved. No reuse allowed without permission. The copyright holder for this preprint (which was. http://dx.doi.org/10.1101/025676doi: bioRxiv preprint first posted online Aug. 28, 2015;

In very few cases (5/272, 1.8% of cells in this study), a cell will have more than two contigs
for one or both of its TCR loci. These biologically implausible situations are resolved by
quantifying the expression of each possible contig within the cell and taking the two most
highlyexpressed recombinants. TCR expression is quantified by appending the contig
sequences to the entire mouse transcriptome and then using ‘pseudoalignment’based
abundance quantification performed by the Kallisto algorithm31.
To permit broad use of our approach by other researchers, we have made the TCR
reconstruction tool, ‘TraCeR’, available at www.github.com/teichlab/tracer. This performs
TCR sequence reconstruction as well as summarising and visualising data from multiple
single cells.
Performance, validation and comparison with PCRbased TCR sequencing
To demonstrate and validate our method for TCR sequence reconstruction we analysed
singlecell RNAseq data from 272 FACSsorted CD4+ T cells isolated from spleens of
C57BL/6 mice ( Table 1, Supplementary Fig. 1). We were able to detect at least one
productive alpha chain in 74%–96% of cells, a productive beta in 88%–96% and paired
productive alphabeta chains in 70%–93% ( Table 2, Supplementary Table 1). This
compares favourably with previous PCRbased approaches for singlecell TCR sequencing
that were able to detect productive, paired TCR genes in 50%–82% of cells 7–9,12.
Many T cells contain two recombined alleles for one or both TCR chains. In the majority of
cases, one allele encodes a fulllength chain whilst the other is nonproductively rearranged
and contains a frameshift and/or stop codons. However, it has also been shown that 30% of
not peer-reviewed) is the author/funder. All rights reserved. No reuse allowed without permission. The copyright holder for this preprint (which was. http://dx.doi.org/10.1101/025676doi: bioRxiv preprint first posted online Aug. 28, 2015;

murine T lymphocytes possess two productively rearranged TCRα genes whilst up to 10%
possess two productive TCRβ genes 32.
Our method detected two alpha chain recombinants in 42% of cells and two beta chain
recombinants in 22% ( Supplementary Table 1). We detect two productive alpha chains in
35 out of 188 (19%) cells with at least one productive alpha chain and two productive beta
chains in 16 out of 247 (6%). These data are in line with the previously reported statistics
above, and suggest that our method is more sensitive than the bestperforming PCRbased
method, which surprisingly, did not detect multiple β recombinants in any of the 1268 cells
studied12. In only one cell (0.3%) did we detect two nonproductive sequences for a locus and
both of these sequences were validated by the PCRbased approach described below.
We compared the TCR sequences reconstructed by our method to those detected by a
multiplex PCRbased approach12 that we adapted for use with mouse cells. We took 185 cells
for which we had RNAseq data, and used fulllength SMARTseqderived cDNA as
template material in PCR reactions. We designed the PCR to amplify a region from within
the V gene up to the constant segment. The products from each cell also contained a unique
indexed barcode ( Fig. 2a). PCR products were purified, pooled and sequenced using an
Illumina MiSeq. Sequencing reads from individual cells were then resolved according to their
barcode sequences and readpairs were merged based on their overlapping sequence.
Sequences with up to 5% similarity were merged and a consensus was derived to overcome
sequencing and PCR errors. Sequences were then analysed by IgBlast to determine if they
were from rearranged TCR genes and were filtered to remove background sequences that
were not supported by sufficient sequencing reads.
not peer-reviewed) is the author/funder. All rights reserved. No reuse allowed without permission. The copyright holder for this preprint (which was. http://dx.doi.org/10.1101/025676doi: bioRxiv preprint first posted online Aug. 28, 2015;

For each cell, TCR sequences derived from PCR amplification were aligned against those
reconstructed from the RNAseq data to determine whether a particular recombinant had been
detected by both methods. The number of mismatches throughout the entire alignment and
also within the CDR3encoding region were determined ( Fig. 2a). Alignments that differed
within the CDR3 region were considered to be derived from different original sequences.
Mismatches within the remainder of the alignment were permitted since these were likely to
be due to errors introduced during PCR amplification or sequencing.
The alignments between RNAseq and PCRderived TCR sequences were used to classify
each recombinant in each cell as concordant (detected by both approaches) or discordant
(detected by only one approach). In total, 485 recombinant sequences were detected by one or
both approaches, of which 371 (76.5%) were concordant ( Supplementary Table 2). From
the 371 concordant sequences, 55 had at least one mismatch throughout the nonCDR3
portion of the alignment with, at most, three mismatches occurring.
In addition, there were 39 occasions where no sequence was detected by either technique for
a particular locus, thereby giving 410/523 (78.4%) concordant events ( Fig. 2b ). Thirtyfive
recombinant sequences (6.7%) were detected only by PCR whilst 79 (15.1%) were present
only in the RNAseq data.
To determine the cause of the discordant recombinants, we first investigated whether they
were, in fact, artefacts caused by misassembly or sequencing errors. We checked whether
discordant recombinant sequences within a particular cell were highly similar to other
sequences (discordant or concordant) that were also detected within the same cell. We only
not peer-reviewed) is the author/funder. All rights reserved. No reuse allowed without permission. The copyright holder for this preprint (which was. http://dx.doi.org/10.1101/025676doi: bioRxiv preprint first posted online Aug. 28, 2015;

found one example of this ( Supplementary Fig. 2) and, here, the difference was within a
long homopolymeric stretch (11 or 13 nt) of G nucleotides. Long homopolymeric regions are
problematic for PCR amplification and sequencing reactions so it is difficult to draw
conclusions as to which sequence represents the actual TCR within the cell.
We then hypothesised that discordant reads might represent genuine TCR sequences present
within the cells that are expressed at lower levels. These will be less likely to be concordantly
detected by both approaches due to stochastic detection of sequences expressed at levels
approaching the sensitivity limits of each technique. We found that discordant recombinants
are, indeed, expressed at lower levels than concordant recombinants ( Fig. 2c). Further
evidence for this hypothesis is provided by determination of the numbers of total
recombinants and productive recombinants within each cell if the RNAseq and PCR data are
combined ( Fig. 2d ). Only 10/185 (5%) cells contain more than two recombinants for a locus,
which is biologically implausible, whilst the numbers of cells with two productive
recombinants for each locus are in accordance with previous reports 32.
Finally, we sought to determine the number of sequencing reads required for each cell to
permit detection of recombinant sequences. To do this we randomly subsampled sequencing
reads from all the cells from a single mouse (day 14 mouse 1). Reads were subsampled three
independent times to depths of 2, 1, 0.5, 0.1, 0.05, 0.01 and 0.005 million pairedend reads.
We then used TraCeR to attempt reconstruction of the TCR sequences and determined in how
many subsamples at each depth the expected recombinants were detected. We found that
more highlyexpressed TCR genes could be reconstructed at lower read depths and that 92%
of recombinants were reliably reconstructed from 1 million reads or fewer ( Fig. 2e,
not peer-reviewed) is the author/funder. All rights reserved. No reuse allowed without permission. The copyright holder for this preprint (which was. http://dx.doi.org/10.1101/025676doi: bioRxiv preprint first posted online Aug. 28, 2015;

Supplementary Fig. 3). Therefore, our method does not require sequencing depth above that
which is optimal for accurate transcript quantitation (Power Analysis of Single Cell
RNASequencing Experiments. Svensson V., Labalette C., Macauley IM., Cvejic A., SAT.
Submitted).
Taken together, these data indicate that our method accurately and sensitively determines the
sequences of recombined and expressed TCR loci within individual T cells from singlecell
RNAseq data.
Clonal expansion of CD4+ T lymphocytes during Salmonella infection
We demonstrated an application of our approach by investigating in detail the CD4+ T
lymphocyte clonotypes present within the spleens of mice prior to, during or after a
nonlethal infection with Salmonella typhimurium. S. typhimurium elicits a strong type1
CD4+ T cell response and is widely used as murine model of enteric fever. Bacterial clearance
and protective immunity require production of interferon by Th1type CD4+ T cells, andγ
genetic defects in Th1related signaling pathways have been shown to cause a predisposition
to infection33,34. We analysed effector cells (CD44highCD62LLow) at day 14 when their relative
abundance is close to its maximum, and memory cells (CD44highCD62LLowCD127high) at day
49 when the infection has been resolved35 ( Supplementary Fig. 1) .
Analysis of the TCR sequences present within the splenic CD4+ T cells found 12 cells that
expressed a productive TCRα recombinant comprising TRAV11 (Valpha14) and TRAJ18
(Jalpha18) segments ( Supplementary Table 1). This gene combination is typical of invariant
natural killer T (iNKT) cells 36. Although there was variation between the exact junctional
not peer-reviewed) is the author/funder. All rights reserved. No reuse allowed without permission. The copyright holder for this preprint (which was. http://dx.doi.org/10.1101/025676doi: bioRxiv preprint first posted online Aug. 28, 2015;

nucleotides within these TCRα sequences, each encoded exactly the same CDR3 amino acid
sequence ( CVVGDRGSALGRLHF), the first eight nucleotides of which were also
previously reported as the most common junctional sequence from eight iNKT hybridomas 37.
Furthermore, 11 out of 12 cells expressing an iNKTlike TCRα chain also expressed a
productive beta chain with a V gene from the limited repertoire observed previously in iNKT
cells 36.
The discovery of these iNKT cells within our analysed populations demonstrates one aspect
of the utility of considering paired TCR sequences within individual cells under study. We
excluded NK1.1+ cells during T cell purification but it is known that a CD4+NK1.1
population of iNKT cells exists within the spleen38 and that NK1.1 is downregulated on NKT
cells following Salmonella infection39. iNKT cells are best identified by their TCR specificity
using CD1d tetramers loaded with αGalCer 40. Here, we show that we can identify such cells
without requiring additional staining during cellsorting procedures. Since we wished to
focus on conventional MHCrestricted CD4+ T cells, we excluded the 12 iNKT cells from
further analyses.
We compared recombinant identifiers between all cells to find cases where multiple cells
expressed TCR genes with exactly the same nucleotide sequence. These cells are examples of
clonal expansion whereby multiple members of the clonotype all derive from a single
ancestor. We found no TCR sharing between cells from different mice nor between cells
from within the uninfected mouse ( Fig. 3b , Supplementary Fig. 4, Supplementary Table
1). The huge potential diversity of TCR nucleotide sequences means that it is extremely
unlikely that a small number of CD4+ T cells sampled from a single steadystate mouse will
not peer-reviewed) is the author/funder. All rights reserved. No reuse allowed without permission. The copyright holder for this preprint (which was. http://dx.doi.org/10.1101/025676doi: bioRxiv preprint first posted online Aug. 28, 2015;

exhibit evidence of TCR sharing. It is also equally unlikely that identical TCR nucleotide
sequences will be found in cells from different mice.
We did see evidence of clonotype expansion within activated CD4+ T lymphocytes from each
mouse at day 14 of Salmonella infection as well as within the effector memory cells from the
mouse at week 7 postinfection ( Figs. 3b, 3c and Supplementary Figs. 5–7. Supplementary
Table 1). TCR sequences within expanded clonotypes from these mice are likely to be
specific for Salmonella antigens and to be associated with clonal expansion of their T cells
upon activation during the immune response to infection.
Importantly, we observe multiple cells that share all their detected recombinant sequences
including those that are nonproductive. This indicates that our method is detecting the
correct combinations of TCR recombinants within the cells. We detected cells that share
TCRβ sequences but have different TCRα sequences. This can be expected given that
developing T lymphocytes in the thymus first perform recombination at the TCRβ locus and
undergo proliferation prior to recombining their TCRα loci. Cells generated from a single
progenitor by this proliferative expansion will all have the same TCRβ recombinant but will
each randomly generate a different α recombinant prior to continuing their maturation and
entering the periphery.
It should be noted that there is no evidence of contamination across microfluidics chip
capture or harvest sites or adjacent wells in the 96well plates used ( Supplementary Fig. 8).
Again, this implies that the observed sequence sharing represents a genuine biological
phenomenon.
not peer-reviewed) is the author/funder. All rights reserved. No reuse allowed without permission. The copyright holder for this preprint (which was. http://dx.doi.org/10.1101/025676doi: bioRxiv preprint first posted online Aug. 28, 2015;

We compared the CDR3 amino acid sequences that we found within our data with those
described in previous work that identified different degrees of CDR3 sharing between mice
and classified sequences as ‘public’ or ‘private’ 41 ( Fig. 3c). Public sequences were shared
between the majority of mice whilst private sequences were only observed in very few mice.
CDR3 sequences from expanded clones appear to be less likely to be public, a finding that
agrees with the previous conclusion that pathogenresponsive CDR3s are more private.
Distribution of clonally expanded cells between CD4+ T cell functional states
Singlecell RNAseq allows cells to be classified according to their gene expression profiles.
Our ability to accurately determine the paired TCR sequences within each single cell allows
us to explore how cells that are all derived from a single ancestor in an expanded clonotype
are distributed between transcriptional states. To demonstrate this, we quantified gene
expression within each single CD4+ splenic T cell and performed independent component
analysis (ICA) to reduce the gene expression space to two dimensions ( Fig. 4a).
After filtering for genes expressed in at least three cells, we were able to use 14,889
informative genes for ICA. This is a great deal larger than the 17 phenotyping genes that
were used in a previous PCRbased approach to determining clonality and cell fate12. We
determined the phenotype of the cells within the reduced gene expression space by analysing
the expression of 259 genes that indicate a Th1 cell fate42, Il7r (CD127) which is indicative of
effectormemory T cells 43, Ccr7 (a marker of centralmemory T cells) 44 and a set of seven
genes that are expressed in proliferating cells 45 ( Fig 4a).
not peer-reviewed) is the author/funder. All rights reserved. No reuse allowed without permission. The copyright holder for this preprint (which was. http://dx.doi.org/10.1101/025676doi: bioRxiv preprint first posted online Aug. 28, 2015;

Expression of these genes and modules of genes allowed us to separate the cells into four
populations: activated proliferating cells that are differentiating to the Th1 fate, mature
differentiated Th1 effector cells, effector memorylike cells and central memorylike cells.
Cells from the steadystate mouse are mostly central memorylike, cells from the mouse at
day 14 have an activated or Th1 effector phenotype whilst cells from day 49 (sorted to be
CD127high, a marker of effector memory fate) are found in the effectormemory region of the
ICA gene expression space.
We then determined the distributions of expanded clonotypes within the reduced
geneexpression space ( Fig 4b and Supplementary Figs. 911). Cells derived from the same
progenitor can be seen throughout the activated differentiating, Th1 effector and
effectormemory populations. This suggests that, after activation by binding to a Salmonella
antigen–MHC complex, the progeny of a particular CD4+ T cell differentiate to the effector
and memory subtypes at varying rates leading to the asynchronous populations that we
observe here. In other words, the members of one clonotype can be spread across the full
spectrum of proliferation and differentiation states that occur during the Salmonella response.
DISCUSSION
Here, we present a method for the determination of paired T cell receptor sequences from
individual T lymphocytes achieved solely by analysis of standard singlecell RNAseq
datasets without the need for alterations to the RNAseq protocol. Our method is as sensitive
as the bestperforming PCRbased method12 for determining paired, productive α and β
chains. For the detection of cases where both alleles of the β locus have been recombined, our
method achieves better sensitivity than the PCRbased method. This is likely due to RNAseq
not peer-reviewed) is the author/funder. All rights reserved. No reuse allowed without permission. The copyright holder for this preprint (which was. http://dx.doi.org/10.1101/025676doi: bioRxiv preprint first posted online Aug. 28, 2015;

not being subject to PCR biases so that multiple recombinants within a cell are detected
independently. Furthermore, our method is easy to adapt to any species for which annotated
TCR gene sequences are available without the need for design and lengthy optimization of
large numbers of multiplexed PCR reactions. We also fully expect our method to be easily
adapted to the study of the analogous B cell receptor/antibody sequences within B
lymphocytes.
Reconstruction of TCR sequences from singlecell RNAseq datasets means that the
information about cell lineage and antigen specificity is obtained alongside the
comprehensive transcriptomic identity of the cells. This provides us with the opportunity to
assess the cells’ phenotypes and to perform clustering analysis using orders of magnitude
more genes than existing PCRbased approaches. RNAseq also obviates the need for a priori
knowledge of phenotyping genes of interest. This will permit the discovery of novel or
poorlycharacterised phenotypic subtypes in conjunction with the analysis of their TCR
sequences. Our method will work with any scRNAseq protocol that produces reads from
fulllength cDNA. This will become increasingly valuable as higherthroughput scRNAseq
methods are developed and applied to T and B lymphocytes.
Having assessed the performance of our method and validated it using an alternative
technique, we demonstrated its ability to analyse the distribution of murine T cell clones
between phenotypically different CD4+ T cell populations during S. typhimurium infection.
Challenge with Salmonella is known to cause large clonal expansion of responsive T cells
within the spleen35,46,47 and we were able to observe expanded clonotypes within our samples.
Full transcriptomic quantification of gene expression allowed us to perform finegrained
not peer-reviewed) is the author/funder. All rights reserved. No reuse allowed without permission. The copyright holder for this preprint (which was. http://dx.doi.org/10.1101/025676doi: bioRxiv preprint first posted online Aug. 28, 2015;

determination of the various cell states within the Th1 response. We showed that members of
a single expanded clonotype can be found at different stages of effector T cell activation and
also within the population of memory cells. This demonstrates that T cells derived from a
single progenitor can exhibit divergent fates at the same time within a single mouse.
To enable the widespread use of our method by researchers who perform singlecell
RNAseq on lymphocyte populations we have made the TraCeR tool and associated
documentation freely available for download. A combined knowledge of T cell clonal
dynamics, TCR specificity and detailed transcriptional phenotype is likely to be of great use
in the study of T cell responses to infection, autoantigens or vaccination and will provide
insights into both pathogenic mechanisms and therapeutic approaches.
not peer-reviewed) is the author/funder. All rights reserved. No reuse allowed without permission. The copyright holder for this preprint (which was. http://dx.doi.org/10.1101/025676doi: bioRxiv preprint first posted online Aug. 28, 2015;

METHODS
Ethics statement
Mice were maintained under specific pathogenfree conditions at the Wellcome Genome
Campus Research Support Facility (Cambridge, UK). These animal facilities are approved by
and registered with the UK Home Office. Animals were sacrificed by approved animal
technicians in accordance with Schedule 1 of the Animals (Scientific Procedures) Act 1986.
Oversight of the arrangements for Schedule 1 killing was performed by the Animal Welfare
and Ethical Review Body of the Wellcome Genome Campus.
Cell preparation
Female C57BL6/N mice aged 68 weeks were infected intravenously with 0.2 ml Salmonella
Typhimurium M525 containing 5x10⁵ CFU of bacteria in sterile phosphate buffered saline
(PBS, SigmaAldrich). At day 14 or 49 post infection (p.i.) mice were sacrificed with spleens
and livers being harvested. Bacteria were enumerated from the livers by serial dilution and
plating onto agar plates (Oxoid) to confirm levels of infection. Singlecell suspensions were
prepared by homogenising spleens through 70 μm strainers and lysing erythrocytes.
Following incubation with CD16/CD32 blocking antibody, the cells from day 14 p.i. were
stained with titrated amounts of fluorochrome conjugated antibodies for CD44(FITC),
CD25(PE), CD62L(PECF594), TCRβ(PerCPCy5.5), CD69(APC), CD8α(APCH7),
CD161(BV421), and CD4(BV510). The cells from day 49 p.i. were stained with antibodies
for CD44(FITC), CD127(PE), CD62L(PECF594), TCRβ(PerCPCy5.5), CD161(APC),
CD8α(APCH7), CD4 (BV510), and Sytox Blue viability stain. Cell sorting was performed
not peer-reviewed) is the author/funder. All rights reserved. No reuse allowed without permission. The copyright holder for this preprint (which was. http://dx.doi.org/10.1101/025676doi: bioRxiv preprint first posted online Aug. 28, 2015;

using a BD FACSAria II instrument using the 100 micron nozzle at 20 psi using the single
cell sort precision mode. The cytometer was set up using Cytometer Setup and Tracking
beads and compensation was calculated using compensation beads (for antibodies,
eBioscience UltraComp) and cells (for Sytox Blue) using automated software (FACSDiva
v6).
Singlecell RNAsequencing and gene expression quantification
Capture and processing of single CD4+ T cells was performed using the Fluidigm C1
autoprep system. Cells were loaded at a concentration of 1700 cells μl1 onto C1 capture chips
for 510 μm cells. ERCC (External RNA Controls Consortium) spikein RNAs (Ambion, Life
Technologies) were added to the lysis mix. Reverse transcription and cDNA preamplification
were performed using the SMARTer Ultra Low RNA kit (Clontech). Sequencing libraries
were prepared using Nextera XT DNA Sample Preparation kit with 96 indices (Illumina),
according to the protocol supplied by Fluidigm. Libraries were pooled and sequenced on
Illumina HiSeq2500 using pairedend 100 base reads.
Reads were mapped to the Mus musculus genome (Ensembl version 38.70) concatenated with
the ERCC sequences, using GSNAP 48 with default parameters. Genespecific read counts
were calculated using HTSeq49. Sixtyeight cells (out of 352) with detected transcripts for
fewer than 2000 genes, or with more than 10% of measured exonic reads corresponding to
genes coded by the mitochondrial genome, were excluded from further analyses.
not peer-reviewed) is the author/funder. All rights reserved. No reuse allowed without permission. The copyright holder for this preprint (which was. http://dx.doi.org/10.1101/025676doi: bioRxiv preprint first posted online Aug. 28, 2015;

Reconstruction and analysis of TCR sequences from RNAseq data
Synthetic genome files were separately created for the TCRα and TCRβ chains. To generate
these fasta files, nucleotide sequences for all mouse V and J genes were downloaded from
The International ImMunoGeneTics information system50 (IMGT, www.imgt.org). Every
possible combination of V and J genes was generated for each TCR locus such that each
combination was a separate sequence entry in the appropriate synthetic genome file.
Ambiguous N nucleotides were introduced into the junction between V and J genes in each
sequence entry to improve alignments of reads that spanned diverse junctional sequences.
Seven N nucleotides were used in TCRβ combinations whilst one N nucleotide was used in
the TCRα combinations. V gene leader sequences are not well annotated within IMGT and so
20 N nucleotides were added at the 5ʹ end of the V sequence to permit alignment of
sequencing reads that included the leader sequence.
TCRα or TCRβ constant region cDNA sequences were downloaded from ENSEMBL and
appended to the 3ʹ end of each combined sequence to permit alignment of reads that ran into
the constant region. The fulllength TCRα constant region was used whilst the only the first
259 nucleotides of the TCRβ constant gene were used since these are identical between both
Trbc homologs that are found within the mouse genome. The synthetic genomes used in this
work can be found alongside the other tools at www.github.com/teichlab/tracer.
RNAseq reads from each cell were aligned against each synthetic genome independently
using the Bowtie 2 aligner 51. Bowtie 2 is ideal for alignment against the synthetic genomes
because it can align against ambiguous N nucleotides within a reference and also introduce
gaps into both the reference and read sequences. This allows it to align reads against the
not peer-reviewed) is the author/funder. All rights reserved. No reuse allowed without permission. The copyright holder for this preprint (which was. http://dx.doi.org/10.1101/025676doi: bioRxiv preprint first posted online Aug. 28, 2015;

variable junctional regions. We used the following Bowtie 2 parameters with low penalties
for introducing gaps into either the read or the reference sequence or for aligning against N
nucleotides ‘nounal k 1 np 0 rdg 1,1 rfg 1,1’.
For each chain, separately, we used the reads aligning to the synthetic genome as input to the
Trinity RNAseq assembly software27 using its default parameters.
V, D and J gene sequences downloaded from IMGT were used to generate appropriate
databases for use with IgBLAST28. Contigs assembled by Trinity were used as input to
IgBlast and the resulting output text files were processed with a custom parsing script.
Contigs were classed as representing TCR sequences if they contained gene segments from
the correct locus (ie TCRα genes for TCRα contigs) and if their reported V and J alignments
had Evalues below 5×10³. If multiple contigs within the same cell represented the same
recombinant sequence, these were collapsed so that the sequence was only represented once
in the cell for subsequent analyses. In some cases where two contigs derived from the same
original sequence but one was shorter than the other, IgBLAST assigned different V
sequences if the shorter sequence did not provide sufficient information to distinguish
between highly similar genes. This typically occurred with V genes that were part of the
evolutionary expansion events that caused gene duplication and triplication within the TCRα
locus 29. In these cases, the sequences were collapsed into a single assignment that used the
results from the longest contig. The IgBLAST results for the TCR sequences within each cell
were then reduced to an identifying string consisting of the V gene name, the junctional
nucleotide sequence and the J gene name (eg. TRBV31_AGTCTTGACACAAGA_TRBJ25)
which was used for comparisons between sequences within other cells.
not peer-reviewed) is the author/funder. All rights reserved. No reuse allowed without permission. The copyright holder for this preprint (which was. http://dx.doi.org/10.1101/025676doi: bioRxiv preprint first posted online Aug. 28, 2015;

It is important to determine whether a particular TCR mRNA sequence is productive and
therefore able to be translated to produce a fulllength TCR polypeptide chain. To do this for
the reconstructed TCR sequences we first converted them to entirely fulllength sequences by
using fulllength V and J gene sequences from IMGT appropriate to the gene segments
assigned by IgBLAST. Since TCRs do not undergo somatic hypermutation we can make the
assumption that variations between the RNAseq derived sequences and the reference
sequences outside the junctional region are due to PCR and/or sequencing errors and so can
be ignored. We check that these fulllength sequences are in the correct reading frame from
the start of the V gene to the start of the constant gene and that they lack stop codons. If this
is the case, the sequence is classed as productive. For analysis of CDR3 aminoacid
sequences we translate the productive recombinants and define the CDR3 as the region
flanked by the final cysteine residue of the V gene and the conserved FGXG motif in the J
gene as previously described23.
Expression levels of the TCR genes found within a cell were quantified by appending that
cell’s fulllength recombinant sequences to a file containing the entire mouse transcriptome
(downloaded from http://bio.math.berkeley.edu/kallisto/transcriptomes /) and then using this
file for the generation of an index suitable for use with the pseudoalignmentbased Kallisto
algorithm31. This index was then used with the RNAseq reads for the cell as input for
Kallisto in quantification mode to calculate transcripts per million (TPM) values for each
TCR sequence. If a cell was assigned more than two recombinant sequences for a particular
locus, the sequences were ranked by their TPM values and the two most highlyexpressed
were used for further analyses. Kallisto’s speed in constructing indices and performing
expression quantification makes it ideal for this task.
not peer-reviewed) is the author/funder. All rights reserved. No reuse allowed without permission. The copyright holder for this preprint (which was. http://dx.doi.org/10.1101/025676doi: bioRxiv preprint first posted online Aug. 28, 2015;

After assignment of TCR sequences to each cell within an experiment, we used custom
Python scripts to compare the recombinant identifiers present in each cell to find cases where
multiple cells contained the same identifier. These analyses were used to generate network
graphs where each node in the graph represents a single cell and edges between the nodes
represent shared TCR sequences.
The analyses described above are performed by our tool, TraCeR which is freely available at
www.github.com/teichlab/tracer.
PCRbased sequencing of TCR sequences
Primers were designed to amplify all possible recombined TCR sequences from both the
TCRα and TCRβ loci (all sequences can be found in Supplementary Table 3). Two constant
region primers were designed to be complementary to the Trac or Trbc genes close to their 5ʹ
ends. Sets of primers complementary to all TCRα and β V gene sequences downloaded from
IMGT were also designed. Primers were designed to regions of homology between V genes
and included degeneracy where appropriate so as to minimise the number of primers
required. In total, 34 TCRα and 31 TCRβ primers were used. All primers were designed with
a Tm of 71–73 °C. All V gene primers were designed with the sequence
ACACTCTTTCCCTACACGACGCTCTTCCGATCT at their 5ʹ end to allow amplification
by the Illumina PE 1.0 primer
(AATGATACGGCGACCACCGAGATCTACACTCTTTCCCTACACGACGCTCTTCCG
ATCT) while the constant region primers were designed with the sequence
TCGGCATTCCTGCTGAACCGCTCTTCCGATCT at their 5ʹ end so that they could be
not peer-reviewed) is the author/funder. All rights reserved. No reuse allowed without permission. The copyright holder for this preprint (which was. http://dx.doi.org/10.1101/025676doi: bioRxiv preprint first posted online Aug. 28, 2015;

amplified by barcoding primers containing a unique 11 nt index sequence ( Supplementary
Table 3). The barcoding primers also contain the Illumina PE 2.0 sequence.
Fulllength (oligodT primed) cDNA produced from singlecells by the C1 system (Fluidigm,
USA) was used as template in two PCR reactions, one for each TCR locus. 0.4 µl of cDNA
were used in each reaction along with each V primer at 0.06 µM and the constant primer at
0.3 µM. Phusion DNA polymerase (NEB, USA) was used to perform the amplification in 25
µl final volume. The cycling conditions for this step were 98 °C 30 s; 98 °C 10 s, 60 °C 10s,
72 °C 30 s × 16 cycles; 72 °C 5 min. 4 °C. A 1 µl aliquot of the first reaction was used as
template in a second PCR amplification, again using Phusion in a 25 µl reaction volume.
Here, the Illumina PE 1.0 primer was used with a barcoding primer unique for each cell and
each primer was at 0.4 µM. The cycling conditions for this step were 98 °C 30 s; 98 °C 10 s,
58°C 10s, 72 °C 30 s × 16 cycles; 72 °C 5 min. 4 °C. PCR products of the correct size for
sequencing were purified using 0.7 volumes of AMPure XP beads (Beckman Coulter)
according to the manufacturer’s instructions. Purified products were pooled and submitted to
the Wellcome Trust Sanger Institute (WTSI) Sequencing Facility for sequencing using a
MiSeq (Illumina) with 250bp pairedend reads.
Processing PCR data
Reads generated by MiSeq sequencing of PCR products were demultiplexed by the WTSI
Sequencing Facility according to their barcode sequences. Reads were then trimmed to
remove lowquality regions and adapter sequences using TrimGalore
(http://www.bioinformatics.babraham.ac.uk/projects/trim_galore/). The TCRtargeted PCR
primers were designed to provide amplicons short enough such that the forward and reverse
not peer-reviewed) is the author/funder. All rights reserved. No reuse allowed without permission. The copyright holder for this preprint (which was. http://dx.doi.org/10.1101/025676doi: bioRxiv preprint first posted online Aug. 28, 2015;

paired reads would overlap upon sequencing enabling read pairs to be merged using
FLASH 52. Merged read sequences were then filtered to remove those under 200 nucleotides
in length to remove artefactual sequences. Following this step, read sequences for each cell
were subsampled where necessary such that there were 50,000 sequences or fewer from each
cell. This reduced the computational time and requirements for the next stage whilst still
providing sufficient information about the sequences present. As described previously12, we
assumed that sequences from an individual cell that had at least 95% sequence identity were
derived from the same original cDNA sequence and so these were combined to generate a
consensus sequence. The consensus sequences for each cell were analysed by IgBLAST to
find sequences that represented recombined TCRs and the number of sequencing reads
supporting each TCR were used to filter out background sequences that had few reads.
Comparing PCR and RNAseq data
For each cell, sequences derived from PCR analysis or reconstructed from RNAseq data
were trimmed to only include the regions assigned by IgBlast as containing V, D or J
sequences. This removed any leader sequences or constant regions. Trimmed reconstructed
RNAseq sequences were aligned against the trimmed PCRderived sequences in a set of
pairwise comparisons using BLAST. If an alignment was reported, the number of mismatches
across the entire alignment were counted, as were the number of mismatches between the
nucleotides that encoded the CDR3 region (defined here as the 30nt following the end of the
framework 3 region as annotated by IgBlast). If the CDR3 regions contained any mismatches,
the alignment was classed as discordant, otherwise the two sequences were classed as
concordant. Sequences from one method (RNAseq or PCR) that did not align successfully
with any sequence from the other method were classed as discordant.
not peer-reviewed) is the author/funder. All rights reserved. No reuse allowed without permission. The copyright holder for this preprint (which was. http://dx.doi.org/10.1101/025676doi: bioRxiv preprint first posted online Aug. 28, 2015;

Gene expression quantification and dimensionality reduction
Genes were filtered to remove those expressed (TPM>1) in fewer than three cells.
Dimensionality reduction of the remaining gene expression data was performed by
independent component analysis (ICA) using the FastICA Python package.
For plotting gene expression for each cell within ICA space, 259 genes indicating a Th1like
fate and seven indicators of proliferation ( Mki67, Mybl2, Bub1, Plk1, Ccne1, Ccnd1, Ccnb1)
were taken from previous work42,45 and their expression levels (in TPM) were summed for
each cell.
Clonotype distribution within gene expression space
Cells that did not appear to be derived from the same progenitor (same TCRβ but differing
TCRα chains) were removed from the expanded clonotype groups. Cells belonging to a
particular expanded clonotype were then plotted within the ICA reduced gene expression
space.
not peer-reviewed) is the author/funder. All rights reserved. No reuse allowed without permission. The copyright holder for this preprint (which was. http://dx.doi.org/10.1101/025676doi: bioRxiv preprint first posted online Aug. 28, 2015;

Table 1 Mouse splenic CD4+ T lymphocyte populations used for singlecell RNAseq
Mouse status Infection timepoint Cell sorting markers Number of cells
Uninfected N/A CD4+TCRB+NK1.1 CD44+CD62LLow 50
Salmonella
tyhpimurium infected
Day 14 CD4+TCRB+NK1.1 CD44+CD62LLow
Mouse 1 71
Mouse 2 39
Recovered from infection Day 49 CD4+TCRB+NK1.1
CD44+CD62LLowCD127Hi 112
Table 2 TCR reconstruction statistics
Mouse TCRα reconstruction TCRβ reconstruction Paired productive chains
Steadystate 39/50 (78%) 46/50 (92%) 37/50 (74%)
Day 14 mouse 1 68/71 (96%) 68/71 (96%) 66/71 (93%)
Day 14 mouse 2 29/39 (74%) 35/39 (90%) 28/39 (72%)
Day 49 87/112 (78%) 98/112 (88%) 78/112 (70%)
not peer-reviewed) is the author/funder. All rights reserved. No reuse allowed without permission. The copyright holder for this preprint (which was. http://dx.doi.org/10.1101/025676doi: bioRxiv preprint first posted online Aug. 28, 2015;

ACKNOWLEDGEMENTS
We thank Valentine Svensson, Tzachi Hagai, Johan Henriksson and other members of the
Teichmann laboratory for helpful discussions. We thank the Wellcome Trust Sanger Institute
Sequencing Facility for performing Illumina sequencing and the Wellcome Trust Sanger
Institute Research Support Facility for care of the mice used in these studies. This work was
supported by European Research Council grant ThSWITCH (number 260507) and the Lister
Institute for Preventative Medicine.
AUTHOR CONTRIBUTIONS
MJTS conceived the project, designed the computational method, wrote the software,
designed PCR sequencing primers, analysed data, generated figures and wrote the
manuscript. TL and SC designed and performed the Salmonella experiments. TL performed
cell collection and purification, generated scRNAseq libraries, performed gene expression
analyses, analysed data, generated figures and wrote the manuscript. VP performed
PCRbased TCR sequencing experiments. AOS designed the cell sorting strategy, performed
the sorting and generated figures. SAT and GD supervised work and wrote the manuscript.
not peer-reviewed) is the author/funder. All rights reserved. No reuse allowed without permission. The copyright holder for this preprint (which was. http://dx.doi.org/10.1101/025676doi: bioRxiv preprint first posted online Aug. 28, 2015;

FIGURE LEGENDS
Figure 1 Method for reconstructing TCR sequences from singlecell RNAseq data. ( a)
Overview of dataprocessing steps for TCR sequence reconstruction. Singlecell
RNAsequencing was performed on individual T lymphocytes to produce a pool of
pairedend sequencing reads for each cell. These reads were used to quantify gene expression
within each cell. In addition, sequencing reads that are derived from TCR mRNA are
extracted and assembled into long contiguous TCR sequences. TCR contigs are filtered and
analysed with IgBlast to determine the gene segments used and the junctional nucleotides. ( b )
Example of a synthetic genome entry used as alignment reference for extraction of
TCRderived reads. Each TCR locus is represented by a fasta file containing entries
comprising every possible combination of V and J genes for that locus. V–J combinations
contain the sequence of the appropriate constant gene along with stretches of N nucleotides to
represent V leader and variable junctional regions. ( c) Distributions of lengths of
reconstructed TCR sequences. Reconstructed sequences were trimmed to include the region
derived from the V gene, junction and J gene. The lengths of these sequences are plotted as
histograms and kernel density estimates. Dotted lines represent the interquartile range of
lengths of fulllength sequences derived from the synthetic genome files.
Figure 2 Validation of RNAseq TCR reconstruction. ( a) PCR amplification and sequencing
of recombined TCR genes from singlecells adapted from a previously reported method12.
Fulllength singlecell cDNA libraries were used in PCR reactions with multiplexed V gene
primers and single constant region primers for each TCR locus. Amplicons were purified,
pooled and sequenced using an Illumina MiSeq. Sequences were compared with TCR
not peer-reviewed) is the author/funder. All rights reserved. No reuse allowed without permission. The copyright holder for this preprint (which was. http://dx.doi.org/10.1101/025676doi: bioRxiv preprint first posted online Aug. 28, 2015;

sequences reconstructed from RNAseq data for the same cells. Alignments were classified as
concordant if there were no mismatches or if mismatches were found only outside the
CDR3encoding region. ( b ) Numbers of concordant and discordant events from comparison
between RNAseq and PCR. Concordant events include 39 occasions where no sequence was
detected by either method for a particular locus. ( c) Expression levels of concordant and
discordant recombinant sequences. Expression levels of TCR sequences were calculated as
transcripts per million (TPM) from RNAseq data or as numbers of reads from PCR data. P
values were calculated using the MannWhitney U test. ( d ) Number of cells with zero, one,
two or three recombinants for each TCR locus from combined RNAseq and PCR results.
Either for all (‘All’) or productive recombinants only (‘Prod’). ( e) Sensitivity analysis of
RNAseq reconstruction. All singlecell datasets from day 14 mouse 1 were randomly
subsampled three independent times to contain decreasing total read numbers followed by
TCR reconstruction. Points representing each TCR sequence found in the full datasets are
plotted according to their expression levels and the minimum total read depth required for
detection in at least two out of three subsamples. For clarity, points are jittered about the
yaxis.
Figure 3 Assessment of clonal CD4+ T cell expansion during Salmonella typhimurium
infection. ( a) Schematic of timeline for Salmonella infection experiment. ( b ) Distribution of
expanded clonotypes within splenic CD4+ T cell populations analysed by singlecell
RNAseq. The xaxis indicates the number of cells within the expanded clonotypes whilst the
yaxis represents the number of clonotypes of each size. ( c) Clonotype network graph from
day 14, mouse 1. Each node in the graph represents an individual splenic CD4+ T
lymphocyte. Coloured bars within the nodes indicate the presence of reconstructed TCR
sequences that were detected for each cell. Dark coloured identifiers are productive, light
not peer-reviewed) is the author/funder. All rights reserved. No reuse allowed without permission. The copyright holder for this preprint (which was. http://dx.doi.org/10.1101/025676doi: bioRxiv preprint first posted online Aug. 28, 2015;

coloured are nonproductive. Red edges between the nodes indicate shared TCRα sequences
whilst blue edges indicate shared TCRβ sequences. Edge thickness is proportional to the
number of shared sequences. ( c) Relationship between clonotype size and level of TCRβ
CDR3 publicity. Reconstructed TCRβ nucleotide sequences from every cell analysed across
all mice were translated and the CDR3 aminoacid sequences extracted. For each CDR3
sequence, its level of sharing between mice was determined from Madi et al41.
Figure 4 Distribution of expanded clonotypes throughout the Th1 response to S. typhimurium
infection. ( a) Dimensionality reduction of singlecell gene expression data by independent
component analysis (ICA). Each single CD4+ T cell is plotted in reduced twodimensional
space according to its gene expression profile. Points are colored according to the timepoint
from which they were sampled or according to their expression of marker genes indicative of
their phenotype. Where the expression of a set of genes (Th1 genes and proliferation
markers) is plotted, this is the sum of TPM values for the genes within the set. ( b ) Clonotype
distribution in geneexpression space. Three representative expanded clonotypes from day 14
mouse 1 are shown as blue points on top of all other cells within the gene expression space.
not peer-reviewed) is the author/funder. All rights reserved. No reuse allowed without permission. The copyright holder for this preprint (which was. http://dx.doi.org/10.1101/025676doi: bioRxiv preprint first posted online Aug. 28, 2015;

SUPPLEMENTARY TABLE TITLES
Supplementary Table 1 TCR sequences reconstructed from singlecell RNAsequencing
data.
Supplementary Table 2 Comparison between RNAseq reconstruction and PCRbased
detection of TCR sequences.
Supplementary Table 3 PCR primers used for TCR sequencing.
not peer-reviewed) is the author/funder. All rights reserved. No reuse allowed without permission. The copyright holder for this preprint (which was. http://dx.doi.org/10.1101/025676doi: bioRxiv preprint first posted online Aug. 28, 2015;

REFERENCES
1. Rossjohn, J. et al. T cell antigen receptor recognition of antigenpresenting molecules.
Annu. Rev. Immunol. 33, 169–200 (2015).
2. Davis, M. M. & Bjorkman, P. J. Tcell antigen receptor genes and Tcell recognition.
Nature 334, 395–402 (1988).
3. Krangel, M. S. Mechanics of T cell receptor gene rearrangement. Curr. Opin. Immunol.
21, 133–139 (2009).
4. Becattini, S. et al. Functional heterogeneity of human memory CD4+ T cell clones
primed by pathogens or vaccines. Science 347, 400–406 (2015).
5. Mamedov, I. Z. et al. Quantitative tracking of T cell clones after haematopoietic stem
cell transplantation. EMBO Mol. Med. 3, 201–207 (2011).
6. Thomas, N. et al. Tracking global changes induced in the CD4 Tcell receptor repertoire
by immunization with a complex antigen using short stretches of CDR3 protein
sequence. Bioinformatics 30, 3181–3188 (2014).
7. Dash, P. et al. Paired analysis of TCRα and TCRβ chains at the singlecell level in mice.
J. Clin. Invest. 121, 288–295 (2011).
8. Turchaninova, M. A. et al. Pairing of Tcell receptor chains via emulsion PCR. Eur. J.
Immunol. 43, 2507–2515 (2013).
9. Kim, S.M. et al. Analysis of the paired TCR α and βchains of single human T cells.
PLoS One 7, e37338 (2012).
10. Howie, B. et al. Highthroughput pairing of T cell receptor α and β sequences. Sci.
Transl. Med. 7, 301ra131 (2015).
11. Linnemann, C. et al. Highthroughput identification of antigenspecific TCRs by TCR
not peer-reviewed) is the author/funder. All rights reserved. No reuse allowed without permission. The copyright holder for this preprint (which was. http://dx.doi.org/10.1101/025676doi: bioRxiv preprint first posted online Aug. 28, 2015;

gene capture. Nat. Med. 19, 1534–1541 (2013).
12. Han, A., Glanville, J., Hansmann, L. & Davis, M. M. Linking Tcell receptor sequence
to functional phenotype at the singlecell level. Nat. Biotechnol. 32, 684–692 (2014).
13. Buettner, F. et al. Computational analysis of celltocell heterogeneity in singlecell
RNAsequencing data reveals hidden subpopulations of cells. Nat. Biotechnol. 33,
155–160 (2015).
14. Jaitin, D. A. et al. Massively parallel singlecell RNAseq for markerfree
decomposition of tissues into cell types. Science 343, 776–779 (2014).
15. Patel, A. P. et al. Singlecell RNAseq highlights intratumoral heterogeneity in primary
glioblastoma. Science 344, 1396–1401 (2014).
16. Shalek, A. K. et al. Singlecell RNAseq reveals dynamic paracrine control of cellular
variation. Nature 510, 363–369 (2014).
17. Trapnell, C. et al. The dynamics and regulators of cell fate decisions are revealed by
pseudotemporal ordering of single cells. Nat. Biotechnol. 32, 381–386 (2014).
18. Treutlein, B. et al. Reconstructing lineage hierarchies of the distal lung epithelium using
singlecell RNAseq. Nature 509, 371–375 (2014).
19. Zeisel, A. et al. Brain structure. Cell types in the mouse cortex and hippocampus
revealed by singlecell RNAseq. Science 347, 1138–1142 (2015).
20. Mahata, B. et al. Singlecell RNA sequencing reveals T helper cells synthesizing
steroids de novo to contribute to immune homeostasis. Cell Rep. 7, 1130–1142 (2014).
21. Bolotin, D. A. et al. MiXCR: software for comprehensive adaptive immunity profiling.
Nat. Methods 12, 380–381 (2015).
22. Shugay, M. et al. Towards errorfree profiling of immune repertoires. Nat. Methods 11,
653–655 (2014).
not peer-reviewed) is the author/funder. All rights reserved. No reuse allowed without permission. The copyright holder for this preprint (which was. http://dx.doi.org/10.1101/025676doi: bioRxiv preprint first posted online Aug. 28, 2015;

23. Thomas, N., Heather, J., Ndifon, W., ShaweTaylor, J. & Chain, B. Decombinator: a
tool for fast, efficient gene assignment in Tcell receptor sequences using a finite state
machine. Bioinformatics 29, 542–550 (2013).
24. Kuchenbecker, L. et al. IMSEQa fast and error aware approach to immunogenetic
sequence analysis. Bioinformatics (2015). doi:10.1093/bioinformatics/btv309
25. Yang, X. et al. TCRklass: a new Kstringbased algorithm for human and mouse TCR
repertoire characterization. The Journal of Immunology 194, 446–454 (2015).
26. Ramsköld, D. et al. Fulllength mRNASeq from singlecell levels of RNA and
individual circulating tumor cells. Nat. Biotechnol. 30, 777–782 (2012).
27. Grabherr, M. G. et al. Fulllength transcriptome assembly from RNASeq data without a
reference genome. Nat. Biotechnol. 29, 644–652 (2011).
28. Ye, J., Ma, N., Madden, T. L. & Ostell, J. M. IgBLAST: an immunoglobulin variable
domain sequence analysis tool. Nucleic Acids Res. 41, W34–40 (2013).
29. Bosc, N. & Lefranc, M.P. The mouse (Mus musculus) T cell receptor alpha (TRA) and
delta (TRD) variable genes. Dev. Comp. Immunol. 27, 465–497 (2003).
30. Bosc, N. & Lefranc, M. P. The mouse (Mus musculus) T cell receptor beta variable
(TRBV), diversity (TRBD) and joining (TRBJ) genes. Exp. Clin. Immunogenet. 17,
216–228 (2000).
31. Bray, N., Pimentel, H., Melsted, P. & Pachter, L. Nearoptimal RNASeq quantification.
arXiv [qbio.QM] (2015).
32. Brady, B. L., Steinel, N. C. & Bassing, C. H. Antigen receptor allelic exclusion: an
update and reappraisal. The Journal of Immunology 185, 3801–3808 (2010).
33. Dougan, G., John, V., Palmer, S. & Mastroeni, P. Immunity to salmonellosis. Immunol.
Rev. 240, 196–210 (2011).
not peer-reviewed) is the author/funder. All rights reserved. No reuse allowed without permission. The copyright holder for this preprint (which was. http://dx.doi.org/10.1101/025676doi: bioRxiv preprint first posted online Aug. 28, 2015;

34. FilipeSantos, O. et al. Inborn errors of IL12/23 and IFNγmediated immunity:
molecular, cellular, and clinical features. Semin. Immunol. 18, 347–361 (2006).
35. Mittrücker, H.W., Köhler, A. & Kaufmann, S. H. E. Characterization of the murine
Tlymphocyte response to Salmonella enterica serovar Typhimurium infection. Infect.
Immun. 70, 199–203 (2002).
36. Brennan, P. J., Brigl, M. & Brenner, M. B. Invariant natural killer T cells: an innate
activation scheme linked to diverse effector functions. Nat. Rev. Immunol. 13, 101–117
(2013).
37. Lantz, O. & Bendelac, A. An invariant T cell receptor alpha chain is used by a unique
subset of major histocompatibility complex class Ispecific CD4+ and CD48 T cells in
mice and humans. J. Exp. Med. 180, 1097–1106 (1994).
38. McNab, F. W. et al. Peripheral NK1.1 NKT cells are mature and functionally distinct
from their thymic counterparts. The Journal of Immunology 179, 6630–6637 (2007).
39. Wilson, M. T. et al. The response of natural killer T cells to glycolipid antigens is
characterized by surface receptor downmodulation and expansion. Proc. Natl. Acad.
Sci. U. S. A. 100, 10913–10918 (2003).
40. Godfrey, D. I. & Kronenberg, M. Going both ways: immune regulation via
CD1ddependent NKT cells. J. Clin. Invest. 114, 1379–1388 (2004).
41. Madi, A. et al. Tcell receptor repertoires share a restricted set of public and abundant
CDR3 sequences that are associated with selfrelated immunity. Genome Res. 24,
1603–1612 (2014).
42. Stubbington, M. J. T. et al. An atlas of mouse CD4+ T cell transcriptomes. Biol. Direct
10, 14 (2015).
43. Kallies, A. Distinct regulation of effector and memory Tcell differentiation. Immunol.
not peer-reviewed) is the author/funder. All rights reserved. No reuse allowed without permission. The copyright holder for this preprint (which was. http://dx.doi.org/10.1101/025676doi: bioRxiv preprint first posted online Aug. 28, 2015;

Cell Biol. 86, 325–332 (2008).
44. Sallusto, F., Lenig, D., Förster, R., Lipp, M. & Lanzavecchia, A. Two subsets of
memory T lymphocytes with distinct homing potentials and effector functions. Nature
401, 708–712 (1999).
45. Whitfield, M. L., George, L. K., Grant, G. D. & Perou, C. M. Common markers of
proliferation. Nat. Rev. Cancer 6, 99–106 (2006).
46. Srinivasan, A., Foley, J. & McSorley, S. J. Massive number of antigenspecific CD4 T
cells during vaccination with live attenuated Salmonella causes interclonal competition.
J. Immunol. 172, 6884–6893 (2004).
47. McSorley, S. J., Cookson, B. T. & Jenkins, M. K. Characterization of CD4+ T cell
responses during natural infection with Salmonella typhimurium. The Journal of
Immunology 164, 986–993 (2000).
48. Wu, T. D. & Nacu, S. Fast and SNPtolerant detection of complex variants and splicing
in short reads. Bioinformatics 26, 873–881 (2010).
49. Anders, S., Pyl, P. T. & Huber, W. HTSeqa Python framework to work with
highthroughput sequencing data. Bioinformatics 31, 166–169 (2015).
50. Lefranc, M.P. et al. IMGT®, the international ImMunoGeneTics information system®.
Nucleic Acids Res. 37, D1006–D1012 (2009).
51. Langmead, B. & Salzberg, S. L. Fast gappedread alignment with Bowtie 2. Nat.
Methods 9, 357–359 (2012).
52. Magoč, T. & Salzberg, S. L. FLASH: fast length adjustment of short reads to improve
genome assemblies. Bioinformatics 27, 2957–2963 (2011).
not peer-reviewed) is the author/funder. All rights reserved. No reuse allowed without permission. The copyright holder for this preprint (which was. http://dx.doi.org/10.1101/025676doi: bioRxiv preprint first posted online Aug. 28, 2015;

a
b
c
50 100 150 250 300 350 400200
50 100 150 250 300 350 400200
0.01
0.02
0.03
0.04
0.05
0.06
0.00
Reconstructed length
Reconstructed length
Dens
ity
0.010.02
0.030.04
0.050.060.060.060.06
0.00
Dens
itySynthetic genome file
V D J C
~350 bp
Perform single-cell RNA-seq on
T lymphocytes of interest.
Quantify expression of entire transcriptome
Find TCR-derived reads and assemble into contigs
Analyse contigs to assign gene usage and productivity
Demultiplexed reads from a single cell
V segment: TRAV6D-6*02 J segment: TRAJ45*01 ID: TRAV6D-6_GGTGATAGAGGTG_TRAJ45 Productive: Yes Stop codon: No In frame: Yes
>
>
>
>
>
>
NNNNNNNNNNNNNNNNNNNNaacactaaaattactcagtcaccaagatatctaatcctgggaagagca
aataagtctttggaatgtgagcaacatctgggacataatgctatgtactggtataaacagagcgctga
gaagccgccagagctcatgtttctctacagtgttaaacaattgattcgaaatgagacggtgcccagtc
lgttttatacctgaatgcccagacagctccaagctacttttacatgtatctgccgtggatctagaaga
ctcagctgtctatttttgtgccagcagcNNNNNNNctcctatgaacagtacttcggtcccggcaccag
gctcacggttttagAGGATCTGAGAAATGTGACTCCACCCAAGGTCTCCTTGTTTGAGCCATCAAAAG
CAGAGATTGCAAACAAACAAAAGGCTACCCTCGTGTGCTTGGCCAGGGGCTTCTTCCCTGACCACGTG
GAGCTGAGCTGGTGGGTGAATGGCAAGGAGGTCCACAGTGGGGTCAGCACGGACCCTCAGGCCTACAA
GGAGAGCAATTATAGCTACTGCCTGAGCAGCCGCCTGAGGGTCTCTGCTACCTTCTGGCACAATCCTC
>chr=TRBV5*05_TRBJ2-7*01
V leader
V gene
Junction
Constant gene
J gene
TCRα
TCRβ
not peer-reviewed) is the author/funder. All rights reserved. No reuse allowed without permission. The copyright holder for this preprint (which was. http://dx.doi.org/10.1101/025676doi: bioRxiv preprint first posted online Aug. 28, 2015;

a b
c d
e
cDNA from individual single-cell mRNA extractions
PCR with indexed sequencing adapter primers. Pool with products from other cells.Sequence with Illumina MiSeq
V J CAAAAAAAAAA
V D J CAAAAAAAAAA
PCR with multiple V primers, single C primer for each locus.
Compare with reconstructed sequences
Concordant
Exact match
Mismatches outside CDR3
Discordant
Mismatches within CDR3
No alignment
410 concordant events
34 PCR only78 RNA-seq only
PCR sequence
RNAseq sequence
Concordant
log2
(TPM
)
Discordant RNA-seq only
Discordant PCR only
0
2
4
6
8
10
12
14 ***p = 2.4 × 10⁻¹²
Concordant
log2
(read
cou
nt)
0
2
4
6
8
10
12
14
16 ***p = 3.4 × 10⁻¹⁴
0 recombinants 1 recombinant 2 recombinants 3 recombinants
All α 21 66 (40%) 91 (55%) 7 (4%)
β 18 123 (74%) 40 (24%) 4 (2%)
Prod α 26 116 (73%) 41 (26%) 2 (1%)
β 18 153 (92%) 14 (8%) 0 (0%)
RNA-seq expression
PCR expression
TCR expression (log2(TPM))
Min
imum
read
-dep
th fo
r det
ectio
n
Dens
ity
Frequency1400
0
0.25
02 4 6 8 10 12 14 16
10000
100000
1000000
2000000
500000
50000
5000
>2000000
Productive TCRα
Productive TCRβ
Non-productive TCRα
Non-productive TCRβ
not peer-reviewed) is the author/funder. All rights reserved. No reuse allowed without permission. The copyright holder for this preprint (which was. http://dx.doi.org/10.1101/025676doi: bioRxiv preprint first posted online Aug. 28, 2015;

01 105 6 8 973 42
1
2
3
4
5
6
7
8
47 Uninfected steady state. 0 expanded clonotypes.
Clonotype size
Clo
noty
pe c
ount
Day 14, mouse 1. 10 expanded clonotypes
01 105 6 8 973 42
1
2
3
4
5
6
7
8
33
Clonotype size
Clo
noty
pe c
ount
Day 49. 13 expanded clonotypes
01 105 6 8 973 42
1
2
3
4
5
6
7
8
60
Clonotype size
Clo
noty
pe c
ount
01 105 6 8 973 42
1
2
3
4
5
6
7
8
28 Day 14, mouse 2. 4 expanded clonotypes
Clonotype size
Clo
noty
pe c
ount
a
b
d
5
10
15
20
25
30
21 3 4 5 6 7 8 9 10Clonotype size
Publ
ic s
harin
g co
unt
0
c
Pre-infectionSteady-state
1 mouse
d 0 d 142 mice
d 491 mouse
+
Productive TCRαNon-productive TCRαProductive TCRβNon-productive TCRβ
not peer-reviewed) is the author/funder. All rights reserved. No reuse allowed without permission. The copyright holder for this preprint (which was. http://dx.doi.org/10.1101/025676doi: bioRxiv preprint first posted online Aug. 28, 2015;

Central mem
ory
Activated, proliferating
Th1 effector Effector memory
Central mem
ory
Activated, proliferating
Th1 effector Effector memory
Central mem
ory
Activated, proliferating
Th1 effector Effector memory
Central mem
ory
Activated, proliferating
Th1 effector Effector memory
Central mem
ory
Activated, proliferating
Th1 effector Effector memory
Central mem
ory
Activated, proliferating
Th1 effector Effector memory
Central mem
ory
Activated, proliferating
Th1 effector Effector memory
Central mem
ory
Activated, proliferating
Th1 effector Effector memory
-0.2-0.3
0.1
-0.1
0.20.0 -0.2-0.3
0.1
-0.1
0.20.08000
32000
48000
64000
-0.2-0.3
0.1
-0.1
0.20.00
1800
3600
5400
-0.2-0.3
0.1
-0.1
0.20.0
8000
2000
0
4000
6000
d0
d14
d49
Timepoints
Ccr7
Th1 genes Il7r
-0.2-0.3
0.1
-0.1
0.20.0
3200
800
0
1600
2400
Proliferation markers
-0.3-0.2 0.0 0.2
0.1
-0.1
-0.3-0.2 0.0 0.2
0.1
-0.1
-0.3-0.2 0.0 0.2
0.1
-0.1
a
b
not peer-reviewed) is the author/funder. All rights reserved. No reuse allowed without permission. The copyright holder for this preprint (which was. http://dx.doi.org/10.1101/025676doi: bioRxiv preprint first posted online Aug. 28, 2015;

FSC-A
FSC
-H
Singlets88.0
0 50K 100K 150K 200K 250K
0
50K
100K
150K
200K
250K
695/40 (488)-A TCRβ PerCP-Cy5.5
450/
40 (4
05)-
A C
D16
1(N
K1.
1) B
V42
1
T cells27.9
0 10 4 10 5
0
10 3
10 4
10 5S
SC
-H
SSC-W
Single Cells96.4
0 50K 100K 150K 200K 250K
0
50K
100K
150K
200K
250K
530/
30 (4
05)-
A C
D4
BV
510
780/60 (633)-A CD8α APC-H7
CD4 T cells58.9
0 10 3 10 4 10 5
0
10 3
10 4
10 5
FSC-A
SS
C-A
Lymphocytes84.5
0 50K 100K 150K 200K 250K
0
50K
100K
150K
200K
250K
530/
30 (4
88)-
A C
D44
FIT
C
616/23 (488)-A CD62L PE-CF594
CD62Llo CD44hi54.0
0 10 3 10 4 10 5
0
10 3
10 4
10 5
a
b
Singlets89.5
0 50K 100K 150K 200K 250K
0
50K
100K
150K
200K
250K
Single Cells96.1
0 50K 100K 150K 200K 250K
0
50K
100K
150K
200K
250K
Alive lymphocytes93.0
0 50K 100K 150K 200K 250K
0
10 3
10 4
10 5
T cells28.8
0 10 4 10 5
0
10 3
10 4
10 5
CD4 T cells63.9
0 10 3 10 4 10 5
0
10 3
10 4
10 5
CD44hi CD62Llo21.5
0-10 3 10 3 10 4 10 5
0
10 3
10 4
10 5
530/
30 (4
88)-
A C
D44
FIT
C
616/23 (488)-A CD62L PE-CF594
CD127hi44.0
0-10 3 10 3 10 4 10 5
0
-10 3
10 3
10 4
10 5
585/
42 (4
88)-
A C
D12
7 P
E
616/23 (488)-A CD62L PE-CF594
695/40 (488)-A TCRβ PerCP-Cy5.5
530/
30 (4
05)-
A C
D4
BV
510
660/
20 (6
33)-
A N
K1.
1AP
C
450/
40 (4
05)-
A S
ytox
Blu
e
780/60 (633)-A CD8α APC-H7
FSC-A FSC-A
SS
C-H
FSC
-H
SSC-W
Supplementary Figure 1 FACS strategy for (a) steady-state control and
day 14 cells and (b) day 49 cells. In both cases ,cells were sorted to be
CD4+TCRB+NK1.1-CD44+CD62LLow. Additionally, cells from the mouse
at day 49 were sorted to be CD127High.
not peer-reviewed) is the author/funder. All rights reserved. No reuse allowed without permission. The copyright holder for this preprint (which was. http://dx.doi.org/10.1101/025676doi: bioRxiv preprint first posted online Aug. 28, 2015;

RNA-seq: TRBV16_CAGCTCACT--GGGGGGGGGGGATGCAG_TRBJ2-3 ||||||||| ||||||||||||||||| PCR: TRBV16_CAGCTCACTGGGGGGGGGGGGGATGCAG_TRBJ2-3
Supplementary Figure 2 Discordancy between PCR and RNA-seq TCR
sequence due to sequencing error. The TCR identifiers above were found in the
same cell by RNA-seq and PCR. They differ solely by two G residues within the
long homopolymeric G tract within the junctional region.
not peer-reviewed) is the author/funder. All rights reserved. No reuse allowed without permission. The copyright holder for this preprint (which was. http://dx.doi.org/10.1101/025676doi: bioRxiv preprint first posted online Aug. 28, 2015;

a
bTCR expression (log2(TPM)) Frequency
00
0
0.25
1002 4 6 8 12 14 16
Productive TCRα
Productive TCRβ
Non-productive TCRα
Non-productive TCRβ
Min
imum
read
-dep
th fo
r det
ectio
nDe
nsity
1000000
2000000
500000
100000
50000
100000
50000
>2000000
Detection in three subsamples
Detection in one subsample
TCR expression (log2(TPM)) Frequency00
0
0.25
1002 4 6 8 12 14 16
Productive TCRα
Productive TCRβ
Non-productive TCRα
Non-productive TCRβ
Min
imum
read
-dep
th fo
r det
ectio
nDe
nsity
1000000
2000000
500000
100000
50000
100000
50000
>2000000
Supplementary Figure 3 Sensitivity analysis of RNA-seq reconstruction. All single-cell datasets
from day 14 mouse 1 were randomly subsampled three independent times to contain decreasing
total read numbers followed by TCR reconstruction. Points representing each TCR sequence found
in the full datasets are plotted according to their expression levels and the minimum total read depth
required for detection in at least (a) three or (b) one out of three subsamples. For clarity, points are
jittered about the y-axis.
not peer-reviewed) is the author/funder. All rights reserved. No reuse allowed without permission. The copyright holder for this preprint (which was. http://dx.doi.org/10.1101/025676doi: bioRxiv preprint first posted online Aug. 28, 2015;

TRAV13N-1_GCTATCTCCCTCTCTTC_TRAJ34TRAV6-7_DV9_TGAGTGTATGGTTACCA_TRAJ34TRBV31_AGTCTTGGGGGGGGTCAA_TRBJ2-4
TRBV24_CAGTCCTCAAAC_TRBJ1-1
TRBV15_TTCAGGAAACA_TRBJ1-1
TRBV13-2_CGGTGCAGCAAGGGGAGAAG_TRBJ1-1
TRAV4D-3_GCTGCGTAATG_TRAJ38TRAV14D-3_DV8_CAAGTTTGGAT_TRAJ33
TRBV19_AGCAGACGACTGGGGGACTAT_TRBJ2-1
TRAV4D-4_GCTGCTGTGATAACA_TRAJ37TRBV13-3_AGCAGGGGGGACAGGGGAAACA_TRBJ1-1
TRAV14-2_AAGTGATGACA_TRAJ30TRBV13-1_GCAGTTACAGGGAGGGG(GC)TGAGC_TRBJ2-1
TRAV4D-4_CTGCTCTTTATAGA_TRAJ18TRBV19_AGCAGCCCCGACAGGGGAAGCGCAGA_TRBJ2-3
TRAV4D-4_GCTGCTGACTCTGGA_TRAJ52TRAV14D-3_DV8_GCAAGAGACGTTAC_TRAJ44
TRBV4_CAGCTTGGGGGGAGGGGG(C)TATGA_TRBJ2-7
TRBV5_CAAGATAGGGACTGGGGCAGTGC_TRBJ2-3
TRAV9N-4_GAGCAGGAAT_TRAJ31TRBV3_AGCAGTCCAGGGGGCGCTCCTGGA_TRBJ1-3
TRAV12D-2_GAGTGGGGATA_TRAJ33TRBV13-2_TGATGCAGGGAGGGG(C)TCCGA_TRBJ1-2
TRBV5_CAAGATAACTGGGGGTCAAACA_TRBJ2-4
TRBV19_GTATAACCTGGGGACAAACAAAC_TRBJ1-1
TRAV12D-1_CTCTGGTAGAT_TRAJ18TRBV4_GCAGCCGGGACAGGGGGCTGTATAA_TRBJ1-6
TRAV5D-4_GCTGCCCCCAATTA_TRAJ23TRBV17_AGAGATGAGGACTGGGGGGGGCAGA_TRBJ2-3
TRBV15_AGTTTTGGACAGAGTGC_TRBJ2-3
TRAV12D-2_AGCGATCTAC_TRAJ28TRAV7D-6_GAGCATGAAT_TRAJ23
TRBV15_GTTTACGGGACAAGGGGGTACAGAA_TRBJ2-3TRBV1_TGCAGTAACTGGGGGCTCCT_TRBJ2-7
TRAV16N_AGAGA(G)GGGAC_TRAJ12TRBV19_GTATAAGGACTGGGGGTATGA_TRBJ2-7TRBV15_AGTTTGCTGGGGGGGCGCTATG_TRBJ2-1
TRBV13-3_CAGTGGGGACTGGGGGGGCGCAGA_TRBJ2-3
TRAV14D-3_DV8_GCAAGGGGGGCTTCA_TRAJ16TRAV13N-1_TGGAAGCTTTCTG_TRAJ13
TRBV5_GCCAACCGGGACTAAGCTCCT_TRBJ2-7
TRAV4D-4_GCTGCGCCCCCTAGCAACA_TRAJ9TRAV1_TGAGGTCCCTTCC_TRAJ34
TRBV31_CTCTG(TG)GGGGGGTTAACT_TRBJ2-1
TRAV4D-4_TGAGGGAAGTGC_TRAJ17TRBV4_CAGCTTCAGCCTTTCC_TRBJ1-4
TRAV6D-5_TGGGA(GA)CACAA_TRAJ30TRBV19_AGTATTGAGACAGGGAACAC_TRBJ1-1
TRAV7-4_CAGCTGGGTATAA_TRAJ23TRAV12-3_TGTGCCCCAGG_TRAJ28
TRBV13-2_CGGTGGAGAATTCTG_TRBJ1-3
TRAV9-1_GTGAGGTGATTAT_TRAJ32TRBV13-2_AGCGGCCGACTTGCAG_TRBJ2-3
TRAV4N-3_TGAGGTGGAT_TRAJ33TRBV12-2_CTCTCAGGGACATTCCA_TRBJ1-4
TRAV17_ACTGGAGAACA_TRAJ49TRBV20_CTAGG(G)GGACTGGTGCTTATGA_TRBJ2-7
TRAV9N-3_GAGCATCTAACT_TRAJ26TRAV16N_GAGAGGGGTCTA_TRAJ21
TRBV2_CAGCCGGGACAGGGGGCGCAACTC_TRBJ1-2
TRAV8D-1_TGCTATCCCTCACAGG_TRAJ40TRAV7-5_GAGCATGGAGTATGG_TRAJ32
TRBV2_GCCAACCAGGGGG(C)ACCGG_TRBJ2-2
TRAV7-1_TGCAGAGTCCTCCCCAGGC_TRAJ37TRBV19_AGTATGGCAGATTCTG_TRBJ1-3
TRAV14-2_CAAGTTCTGCTAAC_TRAJ52TRBV4_CAGCTGGACAGGGCTGGTTAAACA_TRBJ1-1TRBV5_GCAGCAACAGGGGGCCGGGCACAG_TRBJ1-1
TRAV14D-1_GCAGCCCTTTGAAT_TRAJ39TRAV14-2_CAAGTCCAGGC_TRAJ37
TRBV2_GCCAA(GA)CAGGGACCAA_TRBJ2-5TRBV13-3_AGCAGCCCCCCGGGACTGGGGAGCTTATAACT_TRBJ2-1
TRAV8D-2_GCTACCCTCTAC_TRAJ28TRAV6-4_TCTGGCCGATTCCA_TRAJ34
TRBV16_TTAGATCAAGAGAACAA_TRBJ1-5
TRAV13D-4_TGCTAAATGTCT_TRAJ21TRAV4D-4_CTGAGCCCTAC_TRAJ15
TRBV26_AGCAGAGGGACAGGGTTACCCGAC_TRBJ1-2TRBV29_CAGTTCGGGACAGGGGATGCT_TRBJ2-1
TRAV7-4_GCTAGATCTT_TRAJ22TRBV2_CAGCCGGGACTCTAGTGC_TRBJ2-3
TRAV17_ACTGGAGAGCAGTG_TRAJ53TRAV21_DV12_AGTAGACCACAGT_TRAJ53
TRBV20_TGCTA(GGGA)CTGGGGGGGCGCATGGGACACC_TRBJ2-4TRBV5_CAAGAAGAGGGA(CT)ATGAA_TRBJ2-7
TRAV10_CAGCAAGCCGGAGGAACAG_TRAJ17TRAV13N-2_TAGATTGGATAAC_TRAJ26TRBV13-2_GGTGAAGGGAGTCA_TRBJ2-4
TRAV13N-1_CTATGCTCCCTTCT_TRAJ22TRBV1_TGCAGCACAACAAAC_TRBJ1-1
TRBV13-1_TGATGAGGGGA(C)CAACG_TRBJ1-4
TRAV12D-1_AGTGATCCTGGC_TRAJ44TRAV5D-4_AAGTGGGAATAA_TRAJ39
TRBV24_CACTCCAGGGGGCTTCTATG_TRBJ2-1TRBV13-2_GGTGAGATGGGGGTCGCTGA_TRBJ2-1
TRAV6D-7_TGGGG(GA)CACAA_TRAJ30TRAV6D-6_TGTGCAACCGG_TRAJ37
TRBV30_CTAGAAGGGATAACT_TRBJ2-1TRAV16_ATGAGGTGGGGAGGT_TRAJ18TRAV9-1_TGAGC(G)GAATA_TRAJ31
TRBV19_CAGTAGGACAGGGGAGGGCACAG_TRBJ1-1TRBV4_AGCAGACGGGACTGGGGGGGTGAAC_TRBJ2-7
TRAV9D-4_GAGCGCGGACAGCAA_TRAJ33TRBV13-1_CAGTGGGGACAGGGGGCGCGGTGCA_TRBJ2-3
TRBV15_AGCAGCCCCCCGGTTAGTGC_TRBJ2-3TRBV15_AGTTT(A)CTGGGAGGAGAACA_TRBJ2-7
TRAV19_CAGGTGCGGGGGCAAG_TRAJ58TRBV4_GCTAATTCAACTC_TRBJ1-2
TRAV7-3_GAGCATGCAGGATGGAG_TRAJ53TRBV12-1_CTCTCGGAGGCACCT_TRBJ2-4
TRAV14D-1_AAGTGCAGATAAC_TRAJ26TRAV7D-3_GTGAGAAGAGG_TRAJ18
TRBV5_CAGCCCCCGGACAGAGCTCCT_TRBJ2-7
TRAV12-3_GAGTGGACAACTGCCAG_TRAJ24TRAV6-2_GGGTGTAAGAGG_TRAJ18
TRBV19_GCAGTCCCGACAGGGGAACAAAC_TRBJ1-2
Supplementary Figure 4 Clonotype network graph from steady-state uninfected mouse. Each node in the graph represents an individual splenic CD4+ T lymphocyte. Identifiers within the nodes indicate the reconstructed TCR sequences that were detected for each cell. Dark coloured identifiers are productive, light coloured are non-productive. The lack of edges between nodes in this graph indicates that no nodes share TCR sequences.
not peer-reviewed) is the author/funder. All rights reserved. No reuse allowed without permission. The copyright holder for this preprint (which was. http://dx.doi.org/10.1101/025676doi: bioRxiv preprint first posted online Aug. 28, 2015;

TRAV8-1_GCTACCCCCGGGAC_TRAJ12TRAV7-1_GTGCATCACCGATAG_TRAJ33TRBV4_AGCTACAACTCCT_TRBJ2-7
TRBV13-2_GGTGAGGTTTATGA_TRBJ2-7
TRAV4-2_TTGAGAATAA_TRAJ43TRBV4_AGCTACAACTCCT_TRBJ2-7
TRAV4-2_TTGAGAATAA_TRAJ43TRAV9-1_GTGAGGGGGAAGGAGAGGCA_TRAJ37
TRBV4_AGCTACAACTCCT_TRBJ2-7
TRAV7-4_TAGTGTTATAACA_TRAJ27TRAV6D-7_GGGTGTGACTGG_TRAJ44TRBV4_AGCTACAACTCCT_TRBJ2-7
TRBV12-1_GCTCTACAACAGGGGGGGCACCG_TRBJ2-2
TRAV4-2_TTGAGAATAA_TRAJ43TRAV9D-4_GTGAGGGGGAAGGAGAGGCA_TRAJ37
TRBV4_AGCTACAACTCCT_TRBJ2-7
TRAV4-2_TTGAGAATAA_TRAJ43TRAV9D-4_GTGAGGGGGAAGGAGAGGCA_TRAJ37
TRBV4_AGCTACAACTCCT_TRBJ2-7
TRAV4-2_TTGAGAATAA_TRAJ43TRAV9D-4_GTGAGGGGGAAGGAGAGGCA_TRAJ37
TRBV4_AGCTACAACTCCT_TRBJ2-7TRBV12-1_GCTCTACAACAGGGGGGGCACCG_TRBJ2-2
TRAV4-2_TTGAGAATAA_TRAJ43TRBV4_AGCTACAACTCCT_TRBJ2-7
TRAV4-2_TTGAGAATAA_TRAJ43TRAV9D-4_GTGAGGGGGAAGGAGAGGCA_TRAJ37
TRBV4_AGCTACAACTCCT_TRBJ2-7TRBV12-1_GCTCTACAACAGGGGGGGCACCG_TRBJ2-2
TRAV4-2_TTGAGAATAA_TRAJ43TRAV9D-4_GTGAGGGGGAAGGAGAGGCA_TRAJ37
TRBV4_AGCTACAACTCCT_TRBJ2-7TRBV12-1_GCTCTACAACAGGGGGGGCACCG_TRBJ2-2
TRAV9N-2_GAGCGGAAGCTATG_TRAJ26TRBV4_CAGCTTACAGGGGTCTGAG_TRBJ2-1
TRAV9N-2_GAGCGGAAGCTATG_TRAJ26TRBV4_CAGCTTACAGGGGTCTGAG_TRBJ2-1
TRAV9N-2_GAGCGGAAGCTATG_TRAJ26TRAV13N-1_GGAACCGTGAAT_TRAJ39
TRBV4_CAGCTTACAGGGGTCTGAG_TRBJ2-1
TRAV9N-2_GAGCGGAAGCTATG_TRAJ26TRBV4_CAGCTTACAGGGGTCTGAG_TRBJ2-1
TRAV6D-7_CTCTGTCGGCCAA_TRAJ48TRBV15_AGCAGGGCGACAGGGAGGACCACAG_TRBJ1-1
TRAV6D-7_CTCTGTCGGCCAA_TRAJ48TRAV4D-3_CTGAGCCCCGATGGCT_TRAJ56
TRBV15_AGCAGGGCGACAGGGAGGACCACAG_TRBJ1-1
TRAV6D-7_CTCTGTCGGCCAA_TRAJ48TRAV4D-3_CTGAGCCCCGATGGCT_TRAJ56
TRBV15_AGCAGGGCGACAGGGAGGACCACAG_TRBJ1-1
TRAV6D-7_CTCTGTCGGCCAA_TRAJ48TRAV4D-3_CTGAGCCCCGATGGCT_TRAJ56
TRBV15_AGCAGGGCGACAGGGAGGACCACAG_TRBJ1-1
TRAV6D-7_CTCTGTCGGCCAA_TRAJ48TRBV15_AGCAGGGCGACAGGGAGGACCACAG_TRBJ1-1
TRAV19_CAGGTGCTCGGACT_TRAJ12TRBV13-1_GCAGTTGGACAGAGGGTGAAC_TRBJ2-7
TRAV19_CAGGTGCTCGGACT_TRAJ12TRBV13-1_GCAGTTGGACAGAGGGTGAAC_TRBJ2-7
TRAV7-5_CAGTT(AACA)CGGGT_TRAJ49TRAV14-2_GCAAGGGGGACCACGG_TRAJ49
TRBV13-2_GCGGTCTGGGAAGCTCCT_TRBJ2-7
TRAV7-5_CAGTT(AACA)CGGGT_TRAJ49TRAV14-2_GCAAGGGGGACCACGG_TRAJ49
TRBV13-1_TGATGCGGGGGGGGGCGCCCGAAAC_TRBJ2-3TRBV13-2_GCGGTCTGGGAAGCTCCT_TRBJ2-7
TRAV6D-7_TGAGTAACATGGCT_TRAJ56TRBV17_AGAGATATCAGCAAAC_TRBJ2-2
TRBV3_CAGCTCGACAGGGGGCACCTAT_TRBJ2-7
TRAV6D-7_TGAGTAACATGGCT_TRAJ56TRBV17_AGAGATATCAGCAAAC_TRBJ2-2
TRBV3_CAGCTCGACAGGGGGCACCTAT_TRBJ2-7
TRAV7-5_TGAGCGACACC_TRAJ27TRAV3-3_CAGTGGGGGAACTA_TRAJ26TRBV31_AGTCTTGACACAAGA_TRBJ2-5
TRBV31_TGGAGCCCCGGGACAGGGCTCAACC_TRBJ1-5
TRAV7-5_TGAGCGACACC_TRAJ27TRBV31_TGGAGCCCCGGGACAGGGCTCAACC_TRBJ1-5
TRAV7-5_TGAGCGACACC_TRAJ27TRAV3-3_CAGTGGGGGAACTA_TRAJ26TRBV31_AGTCTTGACACAAGA_TRBJ2-5
TRBV31_TGGAGCCCCGGGACAGGGCTCAACC_TRBJ1-5TRAV4-2_TTGAGCGCAAT_TRAJ43
TRBV2_CAAGAGGGAAACT_TRBJ1-2
TRAV5-1_GCTCATCTACTG_TRAJ2TRAV4D-3_CTGAGGCGAAGGACAGG_TRAJ40
TRBV2_CAAGAGGGAAACT_TRBJ1-2
TRAV5-1_GCTCATCTACTG_TRAJ2TRBV15_TTTAG(C)AGGGGG(C)ACCGG_TRBJ2-2
TRAV7-4_TAGTGTGAAT_TRAJ23TRAV6D-6_GGTGAAAATA_TRAJ26
TRBV15_TTTAG(C)AGGGGG(C)ACCGG_TRBJ2-2TRBV16_GCAAG(CAG)GGGCGGGACATCTAGTGC_TRBJ2-3
TRBV31_AGTCTAGACATGAA_TRBJ2-7
TRAV6D-7_CTCTGAGCGGTACAG_TRAJ40TRBV31_AGTCTAGACATGAA_TRBJ2-7
TRBV19_GTATATGGCAGGGGGCAGGGGCTGA_TRBJ2-1
TRAV13D-4_GGAACCTCCAGG_TRAJ28TRAV6D-7_CTCTGAGCGGTACAG_TRAJ40
TRBV19_GTATATGGCAGGGGGCAGGGGCTGA_TRBJ2-1
TRAV6-5_CTGAGGATGGACTAT_TRAJ47TRAV12D-2_GAGTGGGCCATCC_TRAJ50
TRBV4_CAGCTTACTGGGGGGCCAAAA_TRBJ2-4
TRAV6D-7_CTCTGAGGATGGACTAT_TRAJ47TRAV12D-2_GAGTGGGCCATCC_TRAJ50
TRBV4_CAGCTTACTGGGGGGCCAAAA_TRBJ2-4
Supplementary Figure 5 Clonotype network graph from day 14, mouse 1. Each node in the graph
represents an individual splenic CD4+ T lymphocyte. Identifiers within the nodes indicate the
reconstructed TCR sequences that were detected for each cell. Dark coloured identifiers are
productive, light coloured are non-productive. Red edges between the nodes indicate shared TCRα
sequences whilst blue edges indicate shared TCRβ sequences. Edge thickness is proportional to the
number of shared sequences. For clarity, the 33 nodes without edges are not displayed.
not peer-reviewed) is the author/funder. All rights reserved. No reuse allowed without permission. The copyright holder for this preprint (which was. http://dx.doi.org/10.1101/025676doi: bioRxiv preprint first posted online Aug. 28, 2015;

TRAV4D-4_GCTGCTGAGAGGGGAGGAGG_TRAJ56TRAV6D-6_GGTGATTTCATGAAT_TRAJ57
TRBV2_CCAAGGAGGGGCCTCCAA_TRBJ1-4
TRBV2_CCAAGGAGGGGCCTCCAA_TRBJ1-4
TRAV13D-1_GTGCTTTGGAATAACA_TRAJ27TRAV12D-2_TTGAGGGGGGATA_TRAJ33
TRBV3_CAGCACCCAGACAGGGGGCAACTC_TRBJ1-2
TRAV13D-1_TGGAATAACA_TRAJ27TRAV12D-2_TTGAGGGGGGATA_TRAJ33
TRBV3_CAGCACCCAGACAGGGGGCAACTC_TRBJ1-2
TRAV13N-1_GGAACGGGAAACTGG_TRAJ12TRAV13-2_TGCTAGATCACCTC_TRAJ6
TRBV29_TAGCAAGGGACTGGGGGAACAC_TRBJ2-2TRBV19_AGTATGAACAATTATGA_TRBJ2-7
TRAV13N-1_GGAACGGGAAACTGG_TRAJ12TRAV13-2_TGCTAGATCACCTC_TRAJ6
TRBV29_TAGCAAGGGACTGGGGGAACAC_TRBJ2-2TRBV19_AGTATGAACAATTATGA_TRBJ2-7
TRAV13N-1_GGAACGGGAAACTGG_TRAJ12TRBV19_AGTATGAACAATTATGA_TRBJ2-7
TRAV13N-3_GTGCTCCTTGATCTAC_TRAJ28TRAV4D-4_TGAGGCCGCGGACT_TRAJ7
TRBV3_CAGCTCCCAAG_TRBJ2-5
TRAV4D-4_TGAGGCCGCGGACT_TRAJ7TRBV3_CAGCTCCCAAG_TRBJ2-5
Supplementary Figure 6 Clonotype network graph from day 14, mouse 2. Each node in the graph
represents an individual splenic CD4+ T lymphocyte. Identifiers within the nodes indicate the
reconstructed TCR sequences that were detected for each cell. Dark coloured identifiers are
productive, light coloured are non-productive. Red edges between the nodes indicate shared TCRα
sequences whilst blue edges indicate shared TCRβ sequences. Edge thickness is proportional to the
number of shared sequences. For clarity, the 28 nodes without edges are not displayed.
not peer-reviewed) is the author/funder. All rights reserved. No reuse allowed without permission. The copyright holder for this preprint (which was. http://dx.doi.org/10.1101/025676doi: bioRxiv preprint first posted online Aug. 28, 2015;
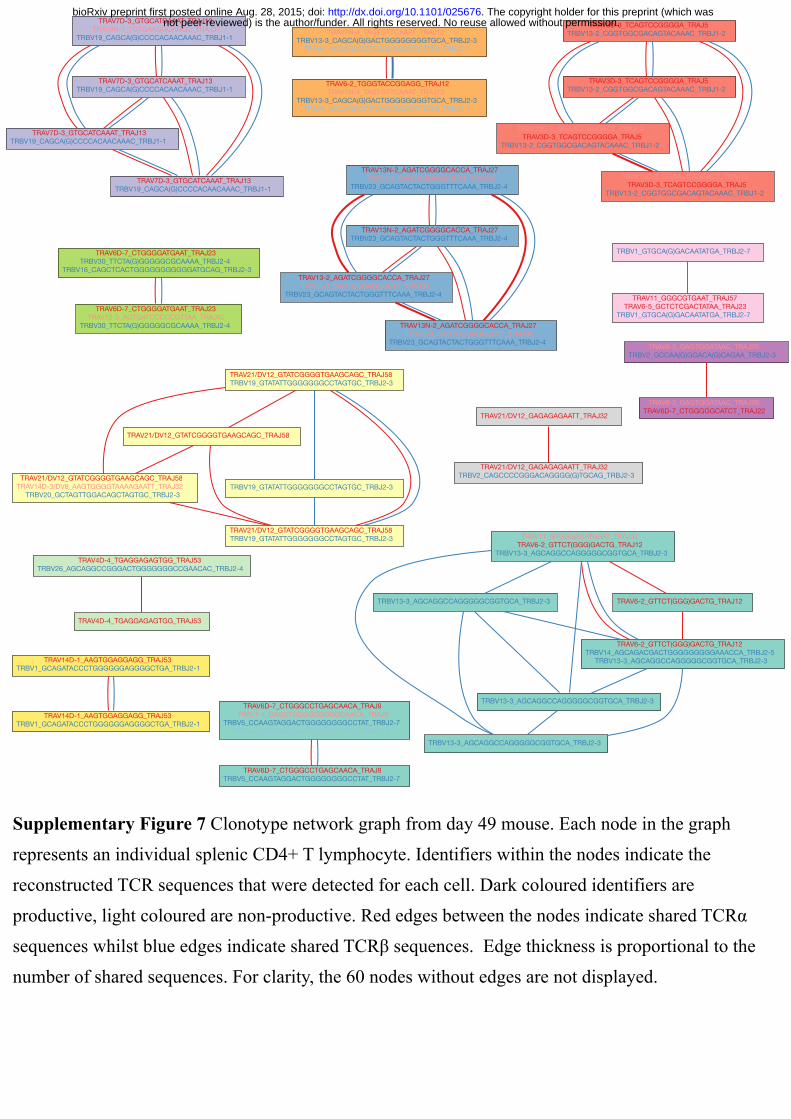
TRAV7D-3_GTGCATCAAAT_TRAJ13TRAV9N-1_TGTGAAGGCAGGC_TRAJ37
TRBV19_CAGCA(G)CCCCACAACAAAC_TRBJ1-1
TRAV7D-3_GTGCATCAAAT_TRAJ13TRBV19_CAGCA(G)CCCCACAACAAAC_TRBJ1-1
TRAV7D-3_GTGCATCAAAT_TRAJ13TRBV19_CAGCA(G)CCCCACAACAAAC_TRBJ1-1
TRAV7D-3_GTGCATCAAAT_TRAJ13TRBV19_CAGCA(G)CCCCACAACAAAC_TRBJ1-1
TRAV7N-4_TAGTGTTCAAAT_TRAJ13TRBV13-3_CAGCA(G)GACTGGGGGGGGTGCA_TRBJ2-3TRBV4_AGCAGGCCTAGGGGGGGTCTATG_TRBJ2-1
TRAV6-2_TGGGTACCGGAGG_TRAJ12TRAV7N-4_TAGTGTTCAAAT_TRAJ13
TRBV13-3_CAGCA(G)GACTGGGGGGGGTGCA_TRBJ2-3TRBV4_AGCAGGCCTAGGGGGGGTCTATG_TRBJ2-1
TRAV3D-3_TCAGTCCGGGGA_TRAJ5TRBV13-2_CGGTGGCGACAGTACAAAC_TRBJ1-2
TRAV3D-3_TCAGTCCGGGGA_TRAJ5TRBV13-2_CGGTGGCGACAGTACAAAC_TRBJ1-2
TRAV13D-3_GGAACCAGGACT_TRAJ12TRAV3D-3_TCAGTCCGGGGA_TRAJ5
TRBV13-2_CGGTGGCGACAGTACAAAC_TRBJ1-2
TRAV13D-3_GGAACCAGGACT_TRAJ12TRAV3D-3_TCAGTCCGGGGA_TRAJ5
TRBV13-2_CGGTGGCGACAGTACAAAC_TRBJ1-2
TRAV13N-2_AGATCGGGGCACCA_TRAJ27TRAV3-3_CAGTGGGAGGGCTT_TRAJ35
TRBV23_GCAGTACTACTGGGTTTCAAA_TRBJ2-4
TRAV13N-2_AGATCGGGGCACCA_TRAJ27TRBV23_GCAGTACTACTGGGTTTCAAA_TRBJ2-4
TRAV13-2_AGATCGGGGCACCA_TRAJ27TRAV3-3_CAGTGGGAGGGCTT_TRAJ35
TRBV23_GCAGTACTACTGGGTTTCAAA_TRBJ2-4
TRAV13N-2_AGATCGGGGCACCA_TRAJ27TRAV3-3_CAGTGGGAGGGCTT_TRAJ35
TRBV23_GCAGTACTACTGGGTTTCAAA_TRBJ2-4
TRAV21/DV12_GTATCGGGGTGAAGCAGC_TRAJ58TRBV19_GTATATTGGGGGGGCCTAGTGC_TRBJ2-3
TRAV21/DV12_GTATCGGGGTGAAGCAGC_TRAJ58
TRAV21/DV12_GTATCGGGGTGAAGCAGC_TRAJ58TRAV14D-3/DV8_AAGTGGGGTAAAAGAATT_TRAJ32
TRBV20_GCTAGTTGGACAGCTAGTGC_TRBJ2-3TRBV19_GTATATTGGGGGGGCCTAGTGC_TRBJ2-3
TRAV21/DV12_GTATCGGGGTGAAGCAGC_TRAJ58TRBV19_GTATATTGGGGGGGCCTAGTGC_TRBJ2-3
TRAV6D-7_CTGGGGATGAAT_TRAJ23TRBV30_TTCTA(G)GGGGGCGCAAAA_TRBJ2-4
TRBV16_CAGCTCACTGGGGGGGGGGGATGCAG_TRBJ2-3
TRAV6D-7_CTGGGGATGAAT_TRAJ23TRAV12-3_AGTGATCCCCCGTTAA_TRAJ40
TRBV30_TTCTA(G)GGGGGCGCAAAA_TRBJ2-4
TRBV1_GTGCA(G)GACAATATGA_TRBJ2-7
TRAV11_GGGCGTGAAT_TRAJ57TRAV6-5_GCTCTCGACTATAA_TRAJ23
TRBV1_GTGCA(G)GACAATATGA_TRBJ2-7
TRAV21/DV12_GAGAGAGAATT_TRAJ32
TRAV21/DV12_GAGAGAGAATT_TRAJ32TRBV2_CAGCCCCGGGACAGGGG(G)TGCAG_TRBJ2-3
TRAV6-5_GAGTGGATAAC_TRAJ26TRBV2_GCCAA(G)GGACA(G)CAGAA_TRBJ2-3
TRAV6-5_GAGTGGATAAC_TRAJ26TRAV6D-7_CTGGGGGCATCT_TRAJ22
TRAV11_GTGGGACATGAAT_TRAJ32TRAV6-2_GTTCT(GGG)GACTG_TRAJ12
TRBV13-3_AGCAGGCCAGGGGGCGGTGCA_TRBJ2-3
TRBV13-3_AGCAGGCCAGGGGGCGGTGCA_TRBJ2-3 TRAV6-2_GTTCT(GGG)GACTG_TRAJ12
TRAV6-2_GTTCT(GGG)GACTG_TRAJ12TRBV14_AGCAGACGACTGGGGGGGGGAAACCA_TRBJ2-5
TRBV13-3_AGCAGGCCAGGGGGCGGTGCA_TRBJ2-3
TRBV13-3_AGCAGGCCAGGGGGCGGTGCA_TRBJ2-3
TRBV13-3_AGCAGGCCAGGGGGCGGTGCA_TRBJ2-3
TRAV4D-4_TGAGGAGAGTGG_TRAJ53TRBV26_AGCAGGCCGGGACTGGGGGGGCCGAACAC_TRBJ2-4
TRAV4D-4_TGAGGAGAGTGG_TRAJ53
TRAV14D-1_AAGTGGAGGAGG_TRAJ53TRBV1_GCAGATACCCTGGGGGGAGGGGCTGA_TRBJ2-1
TRAV14D-1_AAGTGGAGGAGG_TRAJ53TRBV1_GCAGATACCCTGGGGGGAGGGGCTGA_TRBJ2-1
TRAV6D-7_CTGGGCCTGAGCAACA_TRAJ9TRAV7-4_CAGCTGGGGGGGGGCAACA_TRAJ9
TRBV5_CCAAGTAGGACTGGGGGGGGCCTAT_TRBJ2-7TRBV20_TGCTA(GG)ACAGGGCCAACC_TRBJ1-5
TRAV6D-7_CTGGGCCTGAGCAACA_TRAJ9TRBV5_CCAAGTAGGACTGGGGGGGGCCTAT_TRBJ2-7
Supplementary Figure 7 Clonotype network graph from day 49 mouse. Each node in the graph
represents an individual splenic CD4+ T lymphocyte. Identifiers within the nodes indicate the
reconstructed TCR sequences that were detected for each cell. Dark coloured identifiers are
productive, light coloured are non-productive. Red edges between the nodes indicate shared TCRα
sequences whilst blue edges indicate shared TCRβ sequences. Edge thickness is proportional to the
number of shared sequences. For clarity, the 60 nodes without edges are not displayed.
not peer-reviewed) is the author/funder. All rights reserved. No reuse allowed without permission. The copyright holder for this preprint (which was. http://dx.doi.org/10.1101/025676doi: bioRxiv preprint first posted online Aug. 28, 2015;

TRAV4-2_TTGAGAATAA_TRAJ43
TRBV4_AGCTACAACTCCT_TRBJ2-7
Harvest sites Harvest sitesCapture sites
96-well plate
Harvest sites Harvest sitesCapture sites
96-well plate
Cel
l flo
w
Cel
l flo
w
Cel
l flo
w
Cel
l flo
w
TPM
0
3200
4000
800
1600
TPM
0
800
1600
200
400
Supplementary Figure 8 Distribution of shared TCR sequences within the Fluidigm C1
integrated fluidics circuit (IFC) and 96-well plate. TPM expression values of the two most
highly-shared TCR sequences are shown within the C1 IFC capture sites, harvest sites and
the resulting 96-well plate that contained the associated single cells.
not peer-reviewed) is the author/funder. All rights reserved. No reuse allowed without permission. The copyright holder for this preprint (which was. http://dx.doi.org/10.1101/025676doi: bioRxiv preprint first posted online Aug. 28, 2015;

Central mem
ory
Activated, proliferating
Th1 effector Effector memory
Central mem
ory
Activated, proliferating
Th1 effector Effector memory
Central mem
ory
Activated, proliferating
Th1 effector Effector memory
Central mem
ory
Activated, proliferating
Th1 effector Effector memory
Central mem
ory
Activated, proliferating
Th1 effector Effector memory
Central mem
ory
Activated, proliferating
Th1 effector Effector memory
Central mem
ory
Activated, proliferating
Th1 effector Effector memory
Central mem
ory
Activated, proliferating
Th1 effector Effector memory
Central mem
ory
Activated, proliferating
Th1 effector Effector memory
Central mem
ory
Activated, proliferating
Th1 effector Effector memory
Supplementary Figure 9 Clonotype distribution in gene-expression
space. All clonotypes from day 14 mouse 1 are shown as blue
points on top of all other cells within the gene expression space.
not peer-reviewed) is the author/funder. All rights reserved. No reuse allowed without permission. The copyright holder for this preprint (which was. http://dx.doi.org/10.1101/025676doi: bioRxiv preprint first posted online Aug. 28, 2015;

Central mem
ory
Activated, proliferating
Th1 effector Effector memory
Central mem
ory
Activated, proliferating
Th1 effector Effector memory
Central mem
ory
Activated, proliferating
Th1 effector Effector memory
Supplementary Figure 10 Clonotype distribution in gene-expression space. All clonotypes from day
14 mouse 2 are shown as blue points on top of all other cells within the gene expression space.
not peer-reviewed) is the author/funder. All rights reserved. No reuse allowed without permission. The copyright holder for this preprint (which was. http://dx.doi.org/10.1101/025676doi: bioRxiv preprint first posted online Aug. 28, 2015;

Central mem
ory
Activated, proliferating
Th1 effector Effector memory
Central mem
ory
Activated, proliferating
Th1 effector Effector memory
Central mem
ory
Activated, proliferating
Th1 effector Effector memory
Central mem
ory
Activated, proliferating
Th1 effector Effector memory
Central mem
ory
Activated, proliferating
Th1 effector Effector memory
Central mem
ory
Activated, proliferating
Th1 effector Effector memory
Central mem
ory
Activated, proliferating
Th1 effector Effector memory
Central mem
ory
Activated, proliferating
Th1 effector Effector memory
Central mem
ory
Activated, proliferating
Th1 effector Effector memory
Central mem
ory
Activated, proliferating
Th1 effector Effector memory
Central mem
ory
Activated, proliferating
Th1 effector Effector memory
Central mem
ory
Activated, proliferating
Th1 effector Effector memory
Central mem
ory
Activated, proliferating
Th1 effector Effector memory
Supplementary Figure 11 Clonotype distribution in
gene-expression space. All clonotypes from the day 49 mouse
are shown as green points on top of all other cells within the
gene expression space.
not peer-reviewed) is the author/funder. All rights reserved. No reuse allowed without permission. The copyright holder for this preprint (which was. http://dx.doi.org/10.1101/025676doi: bioRxiv preprint first posted online Aug. 28, 2015;