simultaneous estimation of pioglitazone hydrochloride and...
TRANSCRIPT
Simultaneous Estimation of Pioglitazone Hydrochloride and Metformin Hydrochloride using UV Spectroscopic Method
K.Sujana*, G.Swathi Rani, M.Bhanu Prasad, M.Saheethi Reddy *Department of Pharmaceutical Analysis, Mallareddy Institute of pharmaceutical sciences, Maisammaguda,
Secunderabad-500014.
Abstract: Two new UV-spectrophotometric methods have been developed for simultaneous estimation of Pioglitazone hydrochloride and Metformin hydrochloride in tablets. The first method was based on application of vierodt’s method which involves the formation and solving of simultaneous equations at 225nm and 237nm, as absorbance maxima of Pioglitazone hydrochloride and Metformin hydrochloride, respectively. The second method employed was absorption correction method which involves direct estimation of pioglitazone hydrochloride at 267 nm, as at this wavelength Metformin hydrochloride has zero absorbance and shows no interference. For estimation of Metformin hydrochloride, corrected absorbance was calculated at 237.0 nm due to the interference of Pioglitazone hydrochloride at this wavelength. Calibration curves were linear with correlation coefficient between 0.999 over the concentration range of 6-14 μg/mL and 1-5 μg/mL for both the drugs. The mean percent recovery was found in the range of 99.41-99.80 and 100.36-100.52 for vierodt’s method and 99.18-99.80 and 99.64-99.92 for absorption correction method, for pioglitazone hydrochloride and Metformin hydrochloride, respectively. The results of analysis were validated statistically. The proposed methods are simple, rapid, accurate, precise and economical and can be used successfully in the quality control of pharmaceutical formulations and routine laboratory analysis. Keywords: Pioglitazone hydrochloride, Metformin hydrochloride, UV-spectroscopy, Vierodt’s method.
Introduction: Pioglitazone hydrochloride (PIO) is chemically [(±)-5-[[4-[2-(5-ethyl-2-pyridinyl) ethoxy] phenyl] methyl] -2, 4-] thiazolidinedione monohydrochloride. It is a potent agonist for peroxisome proliferator-activated receptor-gamma (PPARγ), activation of which modulates the transcription of a number of insulin responsive genes involved in the control of glucose and lipid metabolism. Metformin hydrochloride (MET) is chemically (N, Ndimethyl imidodicarbonimidic diamide hydrochloride) is a member of the biguanide class of oral antihyperglycemics improves glucose tolerance in patients with type 2 diabetes, lowering both basal and postprandial plasma glucose. Metformin decreases hepatic glucose production, decreases intestinal absorption of glucose and improves insulin sensitivity by increasing peripheral glucose uptake and utilization. Double distilled water and Methanol (E.Merk, Mumbai, India) was used. Preparation of standard stock solution: Standard stock solution of PIO and MET were prepared by dissolving 10mg of drug
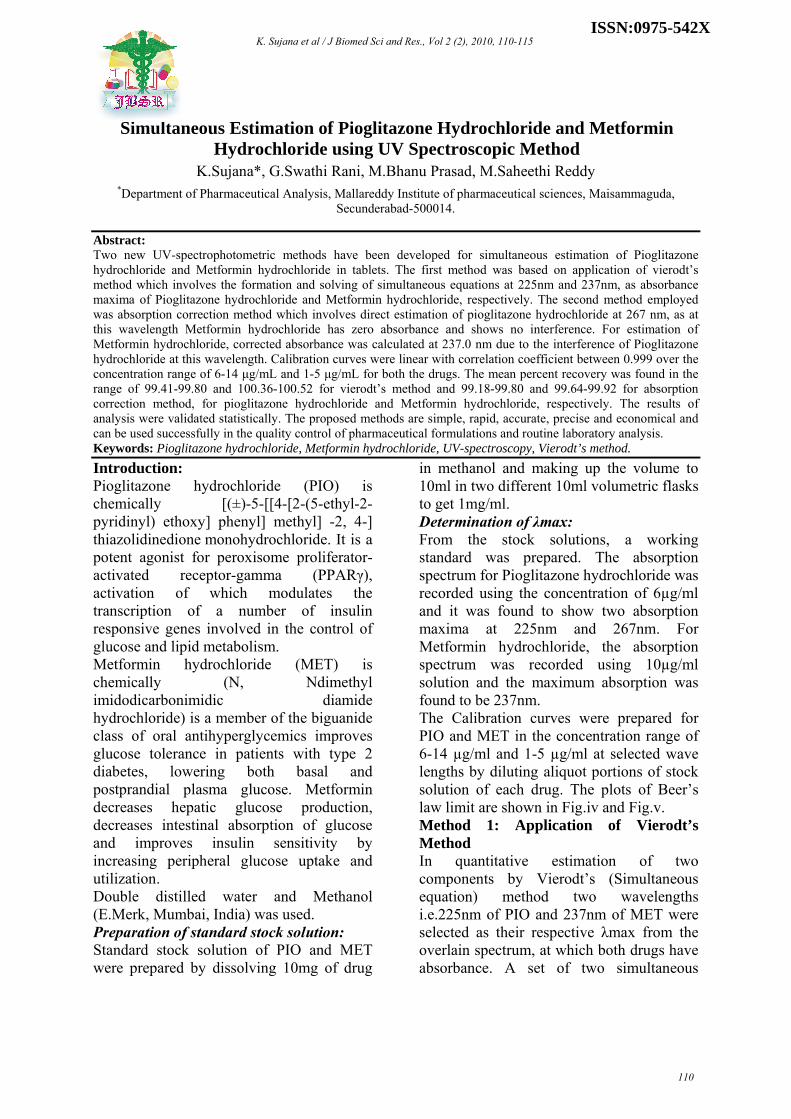
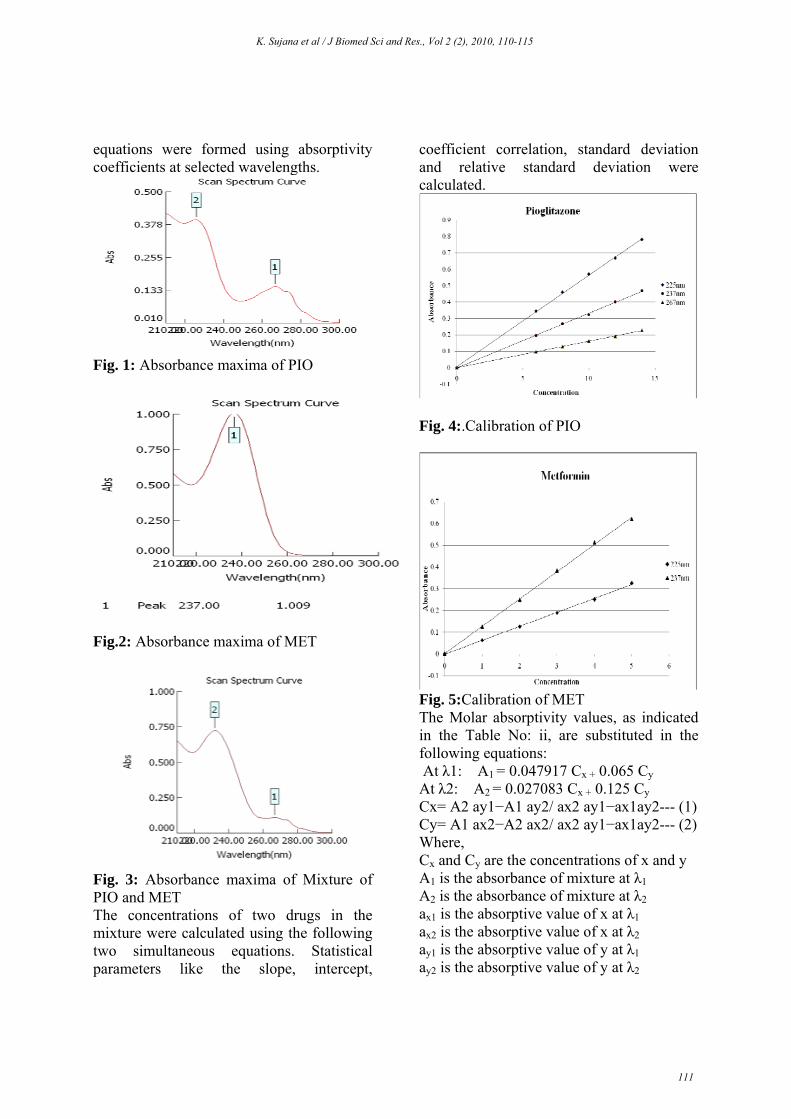
in methanol and making up the volume to 10ml in two different 10ml volumetric flasks to get 1mg/ml. Determination of λmax: From the stock solutions, a working standard was prepared. The absorption spectrum for Pioglitazone hydrochloride was recorded using the concentration of 6µg/ml and it was found to show two absorption maxima at 225nm and 267nm. For Metformin hydrochloride, the absorption spectrum was recorded using 10µg/ml solution and the maximum absorption was found to be 237nm. The Calibration curves were prepared for PIO and MET in the concentration range of 6-14 µg/ml and 1-5 µg/ml at selected wave lengths by diluting aliquot portions of stock solution of each drug. The plots of Beer’s law limit are shown in Fig.iv and Fig.v. Method 1: Application of Vierodt’s Method In quantitative estimation of two components by Vierodt’s (Simultaneous equation) method two wavelengths i.e.225nm of PIO and 237nm of MET were selected as their respective λmax from the overlain spectrum, at which both drugs have absorbance. A set of two simultaneous
ISSN:0975-542X K. Sujana et al / J Biomed Sci and Res., Vol 2 (2), 2010, 110-115
110
equations were formed using absorptivity coefficients at selected wavelengths.
Fig. 1: Absorbance maxima of PIO
Fig.2: Absorbance maxima of MET
Fig. 3: Absorbance maxima of Mixture of PIO and MET The concentrations of two drugs in the mixture were calculated using the following two simultaneous equations. Statistical parameters like the slope, intercept,
coefficient correlation, standard deviation and relative standard deviation were calculated.
Fig. 4:.Calibration of PIO
Fig. 5:Calibration of MET The Molar absorptivity values, as indicated in the Table No: ii, are substituted in the following equations: At λ1: A1 = 0.047917 Cx + 0.065 Cy At λ2: A2 = 0.027083 Cx + 0.125 Cy
Cx= A2 ay1−A1 ay2/ ax2 ay1−ax1ay2--- (1)
Cy= A1 ax2−A2 ax2/ ax2 ay1−ax1ay2--- (2)
Where, Cx and Cy are the concentrations of x and y A1 is the absorbance of mixture at λ1
A2 is the absorbance of mixture at λ2
ax1 is the absorptive value of x at λ1 ax2 is the absorptive value of x at λ2 ay1 is the absorptive value of y at λ1
ay2 is the absorptive value of y at λ2
K. Sujana et al / J Biomed Sci and Res., Vol 2 (2), 2010, 110-115
111
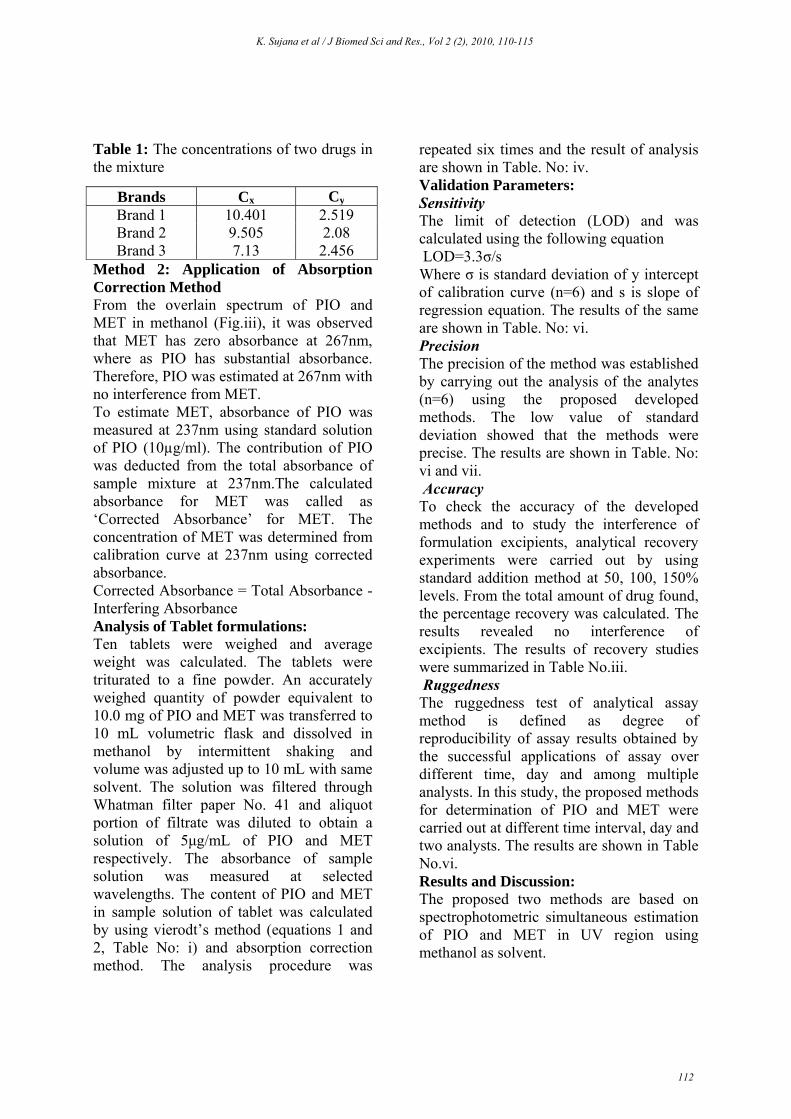
Table 1: The concentrations of two drugs in the mixture
Method 2: Application of Absorption Correction Method From the overlain spectrum of PIO and MET in methanol (Fig.iii), it was observed that MET has zero absorbance at 267nm, where as PIO has substantial absorbance. Therefore, PIO was estimated at 267nm with no interference from MET. To estimate MET, absorbance of PIO was measured at 237nm using standard solution of PIO (10µg/ml). The contribution of PIO was deducted from the total absorbance of sample mixture at 237nm.The calculated absorbance for MET was called as ‘Corrected Absorbance’ for MET. The concentration of MET was determined from calibration curve at 237nm using corrected absorbance. Corrected Absorbance = Total Absorbance - Interfering Absorbance Analysis of Tablet formulations: Ten tablets were weighed and average weight was calculated. The tablets were triturated to a fine powder. An accurately weighed quantity of powder equivalent to 10.0 mg of PIO and MET was transferred to 10 mL volumetric flask and dissolved in methanol by intermittent shaking and volume was adjusted up to 10 mL with same solvent. The solution was filtered through Whatman filter paper No. 41 and aliquot portion of filtrate was diluted to obtain a solution of 5μg/mL of PIO and MET respectively. The absorbance of sample solution was measured at selected wavelengths. The content of PIO and MET in sample solution of tablet was calculated by using vierodt’s method (equations 1 and 2, Table No: i) and absorption correction method. The analysis procedure was
repeated six times and the result of analysis are shown in Table. No: iv. Validation Parameters: Sensitivity The limit of detection (LOD) and was calculated using the following equation LOD=3.3σ/s Where σ is standard deviation of y intercept of calibration curve (n=6) and s is slope of regression equation. The results of the same are shown in Table. No: vi. Precision The precision of the method was established by carrying out the analysis of the analytes (n=6) using the proposed developed methods. The low value of standard deviation showed that the methods were precise. The results are shown in Table. No: vi and vii. Accuracy To check the accuracy of the developed methods and to study the interference of formulation excipients, analytical recovery experiments were carried out by using standard addition method at 50, 100, 150% levels. From the total amount of drug found, the percentage recovery was calculated. The results revealed no interference of excipients. The results of recovery studies were summarized in Table No.iii. Ruggedness The ruggedness test of analytical assay method is defined as degree of reproducibility of assay results obtained by the successful applications of assay over different time, day and among multiple analysts. In this study, the proposed methods for determination of PIO and MET were carried out at different time interval, day and two analysts. The results are shown in Table No.vi. Results and Discussion: The proposed two methods are based on spectrophotometric simultaneous estimation of PIO and MET in UV region using methanol as solvent.
Brands Cx Cy Brand 1 10.401 2.519 Brand 2 9.505 2.08 Brand 3 7.13 2.456
K. Sujana et al / J Biomed Sci and Res., Vol 2 (2), 2010, 110-115
112
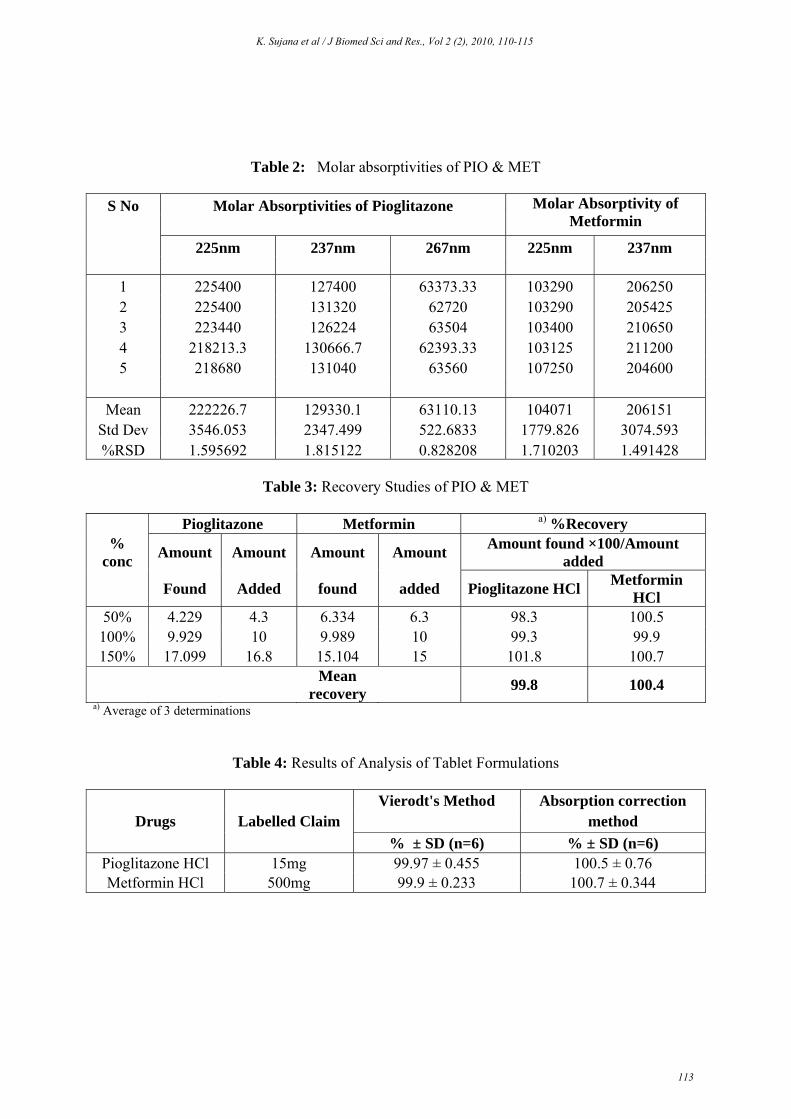
Table 2: Molar absorptivities of PIO & MET
S No Molar Absorptivities of Pioglitazone Molar Absorptivity of
Metformin 225nm 237nm 267nm 225nm 237nm 1 225400 127400 63373.33 103290 206250 2 225400 131320 62720 103290 205425 3 223440 126224 63504 103400 210650 4 218213.3 130666.7 62393.33 103125 211200 5 218680 131040 63560 107250 204600
Mean 222226.7 129330.1 63110.13 104071 206151 Std Dev 3546.053 2347.499 522.6833 1779.826 3074.593 %RSD 1.595692 1.815122 0.828208 1.710203 1.491428
Table 3: Recovery Studies of PIO & MET
Pioglitazone Metformin a) %Recovery
% conc
Amount Amount Amount Amount Amount found ×100/Amount
added
Found Added found added Pioglitazone HCl Metformin
HCl 50% 4.229 4.3 6.334 6.3 98.3 100.5
100% 9.929 10 9.989 10 99.3 99.9 150% 17.099 16.8 15.104 15 101.8 100.7
Mean
recovery 99.8 100.4
a) Average of 3 determinations
Table 4: Results of Analysis of Tablet Formulations
Vierodt's Method Absorption correction Drugs Labelled Claim method
% ± SD (n=6) % ± SD (n=6) Pioglitazone HCl 15mg 99.97 ± 0.455 100.5 ± 0.76 Metformin HCl 500mg 99.9 ± 0.233 100.7 ± 0.344
K. Sujana et al / J Biomed Sci and Res., Vol 2 (2), 2010, 110-115
113
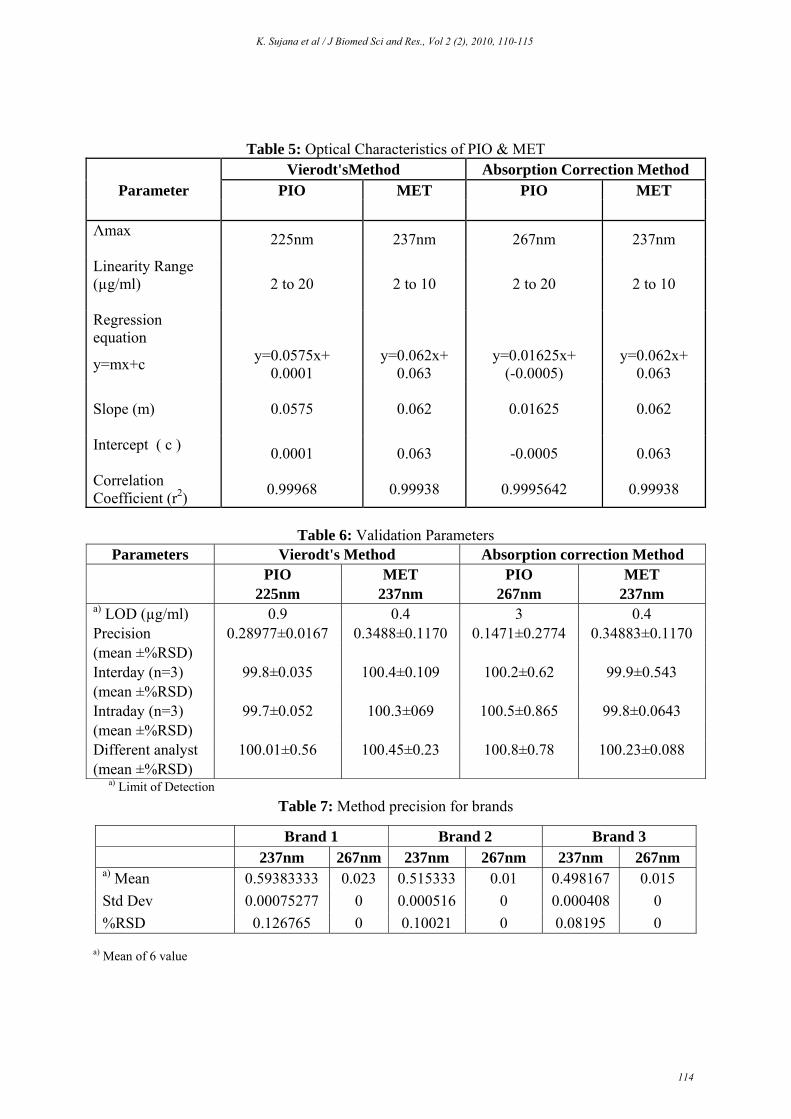
Table 5: Optical Characteristics of PIO & MET Vierodt'sMethod Absorption Correction Method
Parameter PIO MET PIO MET
Λmax
225nm 237nm 267nm 237nm
Linearity Range (µg/ml)
2 to 20 2 to 10 2 to 20 2 to 10
Regression equation
y=mx+c y=0.0575x+
0.0001 y=0.062x+
0.063 y=0.01625x+
(-0.0005) y=0.062x+
0.063 Slope (m)
0.0575 0.062 0.01625 0.062
Intercept ( c )
0.0001 0.063 -0.0005 0.063
Correlation Coefficient (r2)
0.99968 0.99938 0.9995642 0.99938
Table 6: Validation ParametersParameters Vierodt's Method Absorption correction Method
PIO MET PIO MET 225nm 237nm 267nm 237nm a) LOD (µg/ml) 0.9 0.4 3 0.4 Precision 0.28977±0.0167 0.3488±0.1170 0.1471±0.2774 0.34883±0.1170 (mean ±%RSD) Interday (n=3) 99.8±0.035 100.4±0.109 100.2±0.62 99.9±0.543 (mean ±%RSD) Intraday (n=3) 99.7±0.052 100.3±069 100.5±0.865 99.8±0.0643 (mean ±%RSD) Different analyst 100.01±0.56 100.45±0.23 100.8±0.78 100.23±0.088 (mean ±%RSD) a) Limit of Detection
Table 7: Method precision for brands
a) Mean of 6 value
Brand 1 Brand 2 Brand 3 237nm 267nm 237nm 267nm 237nm 267nm
a) Mean 0.59383333 0.023 0.515333 0.01 0.498167 0.015
Std Dev 0.00075277 0 0.000516 0 0.000408 0
%RSD 0.126765 0 0.10021 0 0.08195 0
K. Sujana et al / J Biomed Sci and Res., Vol 2 (2), 2010, 110-115
114
The absorbance spectral analysis shows the maximum absorbance at 225nm and 267 nm for PIO and 237nm for MET. Method I is based on vierodt’s (simultaneous equation) method which involves generation and solving of simultaneous equations using absorptivity coefficient values and absorbance at 225.0 and 237.0 nm for estimation of PIO and MET in sample solution. Method II is based on absorbance correction method which involves correction of absorbance at 237.0 nm for estimation of MET and the estimation of PIO was done at 267 nm directly with no interference of MET. Beer’s law obeyed in the concentration range of 6-14 μg/mL and 1-5 μg/mL for both the drugs. The correlation coefficients were found to be in between 0.999which shows the good linear relationship for both components. The results of optical characteristics such as Beer’s law limits, correlation coefficient, slope, intercept and absorptivity coefficient values were summarized in Table No: v for method I and method II. The tablet assay results obtained by proposed methods were very closed to labeled claim and low value of standard deviation, suggesting that the developed methods has high precision. In order to check the accuracy of the developed methods, known quantities of standard drugs of PIO and MET in three different levels were added to its preanalyzed tablet sample and analyzed by the developed methods. The results of recovery studies are shown in Table No.iii. The mean percentage recoveries were found in the range of 99.0-101.0 and it indicated the non interference of the excipients in the tablet formulation. Ruggedness test was determined between different time intervals, days and analysts. The result shows (Table No.vi) no statistical difference between different analysts, time
and days, suggesting that the developed methods were rugged. Conclusion: The proposed two analytical UV spectrophotometric methods were developed and validated thoroughly for quantitative determination of PIO and MET in tablets. The developed methods were found to be simple, rapid, accurate, precise and economical and give an acceptable recovery of the analytes, which can be directly and easily applied to the analysis of PIO and MET in pharmaceutical tablet formulations. Acknowledgements: Authors are thankful for the Matrix and Aurobindo Pharmaceuticals for providing the gift samples of drugs Pioglitazone and Metformin. References: [1] Indian Pharmacopoeia, Government of India
Ministry of Health and Family Welfare, Indian Pharmacopoeia Commission, Ghaziabad 3, 1674 (2007).
[2] United states Pharmacopoeia 30 NF 25 “The official compendia of standards”, Asian edition, 2007, vol: 1.
[3] ICH Guidelines Q2BValidation of Analytical Procedures: Methodology (1996)
[4] A.H.Beckett,J.B.Stenlake,PracticalPharmaceutical chemistry, IV-Edition, part two, CBS Publishers and distributors, 2004 ,p.no.326.
[5] Dunge, N. Sharda, B. Singh and S. Singh, J. Pharm.Biomed. Anal., 2005, 37, 1109.
[6] B. M. Rao, M. K. Srinivasu, G. Sridhar, P. R. Kumar,K. B. Chandrasekhar and A. Islam, J. Pharm. Biomed. Anal., 2005, 39, 503.
[7] L. Huber and S. George, eds., “Diode-array detection in HPLC”, New York, Marcel Dekker, 1993.
[8] L. Huber, “Validation and qualification in analytical laboratories”, Interpharm, 2002.
[9] R.T. Sane, S.N. Menon, Shafi Inamdar , Mandar Mote and Gunesh Gund, “Simultaneous Determination of Pioglitazone and Glimepiride by High-Performance liquid Chromatography” , Chromatographia 2004, 451-453.
[10] P. K. Sahoo, R. Sharma,* and S. C. Chaturvedi, “Simultaneous Estimation of Metformin Hydrochloride and Pioglitazone Hydrochloride by RPHPLC Method from Combined Tablet Dosage Form”, Indian J Pharm Sci. 2008 May–Jun; 70(3): 383–386.
K. Sujana et al / J Biomed Sci and Res., Vol 2 (2), 2010, 110-115
115