simulations of air and water flow in a model dike during
TRANSCRIPT

Computational Geosciences (2019) 23:325–337https://doi.org/10.1007/s10596-018-9796-7
ORIGINAL PAPER
Simulations of air and water flow in a model dike during overflowexperiments
Witold Tisler1 ·WiolettaGorczewska-Langner1 ·Danuta Lesniewska2 · StanisławMaciejewski3 · Rafał Ossowski1 ·Adam Szymkiewicz1
Received: 30 January 2018 / Accepted: 5 November 2018 / Published online: 23 November 2018© The Author(s) 2018
AbstractFlow in flood dikes, earth dams, and embankments occurs in variably saturated conditions, with pores of the earth materialfilled partly with water and partly with air. In routine engineering analysis, the influence of pore air is neglected and theair pressure is assumed equal to atmospheric. In some circumstances, for example, during overtopping of the dike by water,the effect of pore air on water flow and stability of the structure can be important. These features cannot be captured withthe commonly used Richards equation. In this paper, we analyze earlier experiments on the overtopping of a model dikemade of fine sand. During the experiments, a significant amount of air was trapped near the outer slope of the dike, whichlater escaped through a fracture formed in wet sand. The observations were compared with numerical simulations using theRichards equation and the two-phase immiscible flow model. The deformation and damage of the dike were not modelled,but the initial evolution of the entrapped air pressure (before damage occurred) was in a good agreement with two-phaseflow simulations.
Keywords Richards equation · Two-phase flow · Infiltration · Unsaturated soils
1 Introduction
Water flow in the shallow, partially saturated soils is rou-tinely described by the Richards equation. This equation isbased on the assumption that the air (gas phase) in soil poresis connected with atmosphere and can freely escape fromthe pore space. Therefore, the pore air does not influencethe water flow. These assumptions are often used in seepageand stability analysis of earth dams, flood dikes, natural andengineered slopes, and similar earth structures. However, itis well recognized that in many cases, the pore air has a non-negligible effect on water flow and mechanical behavior of
� Witold [email protected]
1 Department of Geotechnics, Geology and Marine CivilEngineering, Faculty of Civil and Environmental Engineering,Gdansk University of Technology, ul. Narutowicza 11/12,80-233 Gdansk, Poland
2 Institute of Hydro-Engineering of the Polish Academyof Sciences, Gdansk, Poland
3 Koszalin University of Technology, Koszalin, Poland
porous material (e.g., [13, 14, 20, 34, 35, 54, 55, 62]). Dur-ing infiltration on large areas, where there is no immediateescape route for the pore air, the advance of the wetting frontis slowed down with respect to the solution predicted by theRichards equation [10, 16]. Similar effects were observedduring infiltration in closed columns [45–47]. Moreover, ithas been noted that compression of air in pores and the cor-responding increase of air pressure may lead to rapid burstmovement of air toward the soil surface. This phenomenonis sometimes accompanied by significant damage to the soilstructure, with possible dangerous consequence to the soilstability [3, 23, 61].
In real-life conditions, water infiltration in a hydrophilicporous medium (such as the majority of soils or rocks)nearly always leads to air trapping, i.e., creation of isolatedpockets of air, surrounded from all sides with water.Residual air bubbles are often observed at the pore scale,because water preferentially flows as films along thepore walls and portions of air occupying central parts oflarger pores can be snapped off [27, 28]. Porous mediawith occluded gas bubbles in liquid-filled pores are oftentermed quasi-saturated [12]. Gas bubbles in pores can alsooccur due to cavitation (e.g., [15]). In some situations,air (or other gases) form larger bubbles, with dimensions

326 Comput Geosci (2019) 23:325–337
exceeding several times the average size of soil grains andregular pores—these so-called gassy soils were studied,e.g., by [56, 57] and [31]. Trapping of air (or non-wettingfluid in general) is also observed at larger (macroscopic)scale, where the porous medium can be considered acontinuum. This can be related to the presence of materialheterogeneities, such as layers or coarse inclusions orlenses (having low air-entry pressure) surrounded with finermaterial (having higher air-entry pressure) [22, 32, 39, 48,52]. In this case, during capillary dominated flow the finematerial outside inclusions becomes saturated with waterat an elevated value of the capillary pressure, for whichthe water saturation in coarse material is still low. The airremaining in inclusions cannot escape unless its pressureexceeds the entry pressure of the background material. As aresult, local unsaturated zones are formed, with continuousair phase in the pores of coarse inclusion [11, 36, 40, 42].
Macroscopic air trapping can be observed in homoge-neous media as well. Such a situation occurs when waterinfiltrates the domain from all sides, leaving no continu-ous path for air to escape. This occurs, for example, inflood dikes or earth dams during extreme flood events, whenwater flows over the top of the structure [43, 44]. In orderto investigate this phenomenon, a series of experimentswere carried out in the Institute of Hydro-Engineering ofthe Polish Academy of Sciences in Gdansk. They includedinfiltration in closed columns [58–60] and infiltration andoverflowing on a model sand slope [1, 5, 24], and on amodel sand dike [4, 23, 24]. Overflowing experiments onvarious model structures in 2D flumes showed formation ofair pockets and subsequent damage of the structure, whichwas attributed to the increase of air pressure.
In this paper, we describe numerical modeling of one ofthe experiments performed on a model dike. We focus on thephenomenon of air trapping and the associated increase of
the air pressure in pores, which ultimately led to a damageto the soil structure. In particular, we attempt to verify ifthe pressure can be represented with a standard two-phase(air and water) flow model, where parameters are predictedfrom knowledge about the material only. For the sake ofcomparison, we also perform simulations with the Richardsequation. While the Richards equation is inherently unableto describe changes of the air pressure, it is widely usedin studies related to the seepage in dikes (e.g., [19, 29, 49]and is the basis of many software packages available to thescientific and engineering community, e.g., VS2DTI [18,38], Plaxis [6], or HYDRUS [33].
In the following sections, we describe the experiment(Section 2) and the numerical model (Section 3). Next, wepresent the method used to obtain material parameters, i.e.,the water retention and relative permeability functions ofthe soil materials (Section 4). Simulation results are shownin Section 5. A sensitivity analysis was carried out in orderto assess the influence of different hydraulic parameters.Finally, concluding remarks are given in Section 6.
2 Experiment
The experiment was carried out in the laboratory of theInstitute of Hydro-Engineering of the Polish Academyof Sciences in Gdansk. The main part of the experi-mental setup was a Plexiglas flume having dimensions200 × 100× 4.5 cm (Fig. 1) which allowed to create two-dimensional fluid flow and two-dimensional plane strainconditions for soil deformation.
Two types of fine sand were used in the physical model,FSa1 for the bottom layer and FSa2 for the main structure.Both types of sands were well sorted, with steep gran-ulometric curves (Fig. 2). The structure was created by
Fig. 1 Scheme of theexperimental setup. Dimensionsin centimeters

Comput Geosci (2019) 23:325–337 327
Fig. 2 Grain size curves of sands FSa1 and FSa2
the sandy rain method, i.e., gently pouring the sand with-out compaction, using a specially designed device. Conse-quently, the obtained angle of the slope was very close to thefriction angle of the soil, which was equal to 34◦ for FSa2and 37◦ FSa1. The porosities were respectively 0.55 and0.52 [4, 25].
As the first step of the experiment, the bottom layer ofsand was saturated and water table established at the baseof the dike (Fig. 1). After that, an overtopping simulationwas performed. The water table at the left-hand side of thedike was raised to the level of the crest within a period of480 s, allowing water to flow over the top of the dike. Inorder to stabilize the dike, which was undergoing significant
displacements, the water table was raised also at the right-hand slope until its level reached half of the height of thedam (this process took 60 s).
As a consequence of overflowing, a large unsaturatedarea surrounded from all sides with saturated or quasi-saturated material occurred in the inner part of the dike, nearthe right-hand slope. The air pressure in the entrapped airzone was measured by a pressure sensor. Its position waschosen based on preliminary overflowing tests (Fig. 1). Themeasured air pressure values (relative to the atmosphericpressure) are shown in Fig. 3, with pictures showing thesaturation distribution in dike at the different stages of theexperiment.
Fig. 3 Pressure change inunsaturated area: 1, beforeovertopping; 2, just afterovertopping; 3, statecorresponding to the max. valueof pressure in the area; 4 and 5,decreasing of the air pressurecaused by the increasing volumeof the macropore [23–25]

328 Comput Geosci (2019) 23:325–337
A slight pressure buildup in the air phase was observedsince the beginning of the infiltration. In the eighth minuteof the test, water flowed over the crest of the dike andair pressure raised up as the connection between closedunsaturated pore space and atmosphere was lost becauseof a thin layer of flowing water on the slope and a layerof saturated sand at the surface of the slope. Due to theimposed boundary constraints (Fig. 1), the left-hand slopeand lower part of the right-hand slope submerged withwater), the overall pattern of the pore air flow was towardthe upper-right part of the dike. Further infiltration of watercaused reducing the volume of the unsaturated area andnoticeable increase in pressure (Fig. 3, between stages 1and 2). A void space (macropore) appeared at the boundarybetween the unsaturated and (quasi-)saturated zones inthe form of a cavity surrounded by porous material andoccupying the whole thickness of the model. Its volumeincreased as the air entrapment zone was reduced. Then,there was a drop in the pressure due to air escaping throughthe channels (cracks) appearing in the thin saturated layerin the upper part of the right-hand slope. Subsequently, dueto ongoing infiltration and deformation of the slope surface,porous channels were closed, and as a result, the air pressurerose again. The maximum was reached in the eleventhminute when a narrow crack appeared again, linking theunsaturated area to the outer slope. The volume of this crackgrew with a simultaneous drop of the air pressure (Fig. 3,between stages 4 and 5).
The cracks appeared when the air pressure measured bythe sensor is in the range of 400 to 650 Pa. This correspondsto the weight of a layer of 2–3 cm of water-saturated sand(assuming density of about 2 g/cm3). While this is a verycrude approximation, it shows that the increased air pressuremight be sufficient to reduce the effective stress in the soilskeleton near the surface of the left-hand slope and causethe damage to the soil structure.
3 Numerical model
Numerical simulations of the experiments were carriedout using the two-phase immiscible flow model and theRichards equation. Since our models do not take intoaccount the deformation and damage of the soil skeleton,we focus on the part of experiments before the appearanceof cracks. We assumed that fluids are immiscible, soilparticles are incompressible, the process is isothermal, thesoil skeleton is rigid, and has isotropic permeability. Underthese assumptions, the governing equation can be written inthe following form (e.g., [17]:
∂(ραSαn)
∂t− ∇ ·
[ρακkrα
μα
∇(pα + ραgz)
]= 0 (1)
where α means air (a) or water (w) phase, respectively, ρα
is the density (kg/m3), Sα is the saturation (Sa + Sw = 1)(–), n is the porosity (–), t is the time (s), κ is the intrinsicpermeability (m2), μα is the dynamic viscosity (Pa s), krα isthe relative permeability (–), pα is the pressure in fluid (Pa),g is the gravity (m/s2), and z is the depth (m). In the two-phase flow model (2PH), we have two separate equations,where in the first one index α is replaced by “w” and in thesecond one by “a”. The flow model proposed by Richards(RE) is obtained by retaining only one equation, wherethe considered phase is water. Both fluids are assumedto be compressible, with water compressibility coefficientof 4.5×10⁻¹⁰ Pa−1. The relationship between density andpressure of air is taken into account by the ideal gas law.The density of pore air varies according to the changes inthe content of water vapor, but these effects are neglected inthe present work.
The pressure difference between the non-wetting fluid(air) and the wetting fluid (water) is called capillary pres-sure or suction. The value of the suction pressure is relatedto the water saturation. This relationship is called soil watercharacteristic curve (SWRC) or soil water retention curve(SWRC) and is required as a model input together withfunctions describing the dependence of relative permeabil-ities on saturation. Here, we use the well-known formula-tions of van Genuchten-Mualem [30, 50]:
Sew = [1 − (pc/pg)
ng]−mg (2)
krw = √Sew
[1 − (1 − (Sew)1
/mg)mg
]2(3)
kra = √1 − Sew
[1 − (Sew)1
/mg
]2mg
(4)
and Brooks-Corey-Burdine [7, 8]:
Sew =(
pc
pe
)λ
(5)
krw = Sew(3+2/n) (6)
kra = (1 − Sew)2(1 − Sew(1+2/n)) (7)
where Sar is the residual saturation of fluid (–), Sew is theeffective water saturation (–), pg is the scaling pressure(inverse of the parameter α of the original van Genuchtenmodel) (Pa), ng (–) and mg (–) are the exponents in theretention function, pe is the air entry pressure (Pa), λ is theshape parameter (–). In contrast with the van Genuchtenmodel, the Brooks-Corey capillary curve includes a distinctvalue of the air entry pressure.
The governing equations for unsaturated and two-phaseflow were solved using an in-house code implementedin Fortran. The algorithm is based on the control-volumefinite-element approach, which combines features of the

Comput Geosci (2019) 23:325–337 329
finite volume method (FVM) and the finite element method(FEM)—for details, see, e.g., [17] and [37]. In order toavoid the differences between solutions, all numerical sim-ulations described in this paper were carried out using thesame approach to discrete 2PH and RE mathematical mod-els. The algorithm is based on vertex-centered finite volumediscretization in space (Fig. 4). In this case, we used quadri-lateral elements as the primary grid, on which the dual gridof finite volumes was superimposed. The gradients of waterand air pressures through each segment of the control vol-ume boundary are approximated using shape functions forthe corresponding finite element and the relative permeabil-ities were calculated as upstream values. All simulationswere performed on the same numerical grid consisting of779 nodes. As shown in Fig. 4, the grid included the upperstructure of the dike and a major part of the base (weassumed that flow in the outermost regions of the base canbe neglected).
For time discretization, we used the fully implicit first-order finite difference method. In each time step, thediscretization results in a system of nonlinear algebraicequations, which must be solved with respect to the primaryunknowns. In the case of two-phase flow, we choose thewater pressure and water saturation as the primary variables,in accordance with the most common pressure-saturationformulation. For RE, we have only one unknown per node,which is the water pressure. The nonlinear algebraic systemarising at each time step are solved using Newton-Raphsoniterative scheme with line search. The time step variedin the range from 6.2×10⁻⁴ to 3.147 s. It was adjustedautomatically based on the performance of the iterativesolver.
The boundary conditions varied in time according toFig. 1. At each stage of the experiment, we imposed hydro-static value of the water pressure pw and Sw = 1 on thesubmerged parts of the slope, while on the dry parts weassumed no water flow and atmospheric air pressure. Thebase and vertical sides of the flume were considered imper-meable for both water and air. Initially, the area above thewater table is in unsaturated state. Water pressure in thedomain is assumed to vary hydrostatically from 5.39 kPaon the bottom to − 4.14 kPa on the top. Overtopping isrepresented by a time-dependent pressure condition. For
example, for the top boundary in the beginning of thesimulation, we assume that the water pressure is negative(− 5395.5 Pa which is equal to the product of water den-sity, gravity, and dike high) but after overtopping this valuechanges to 0.
4 Estimation of material parameters
Since no measurements of the SWRC or permeability forthe sand materials were available, we estimated their hydraulicparameters from the granulometric curves. Such an approachis well established in the literature, although it cannot beconsidered very accurate. A number of formulas, known aspedotransfer functions, were proposed to compute hydraulicfunction parameters from basic soil properties, such asgranulometric curve, bulk density or porosity. Here, we usedthe modified Kovacs (MK) method, developed by [2].
The MK model assumes that water is held by capillaryforces, responsible for capillary saturation (Swc) and adhesiveforces, causing saturation by adhesion (Swa). The proposedequation is expressed as:
Sw = θw
n= Swc + (1 − 〈1 − Swa〉)(1 − Swc) (8)
where 〈〉 denotes the Mackauley brackets 〈x〉 = 0.5(x + |x|).Swc and Swa depend on ψ (suction expressed in centimetersof H2O):
Sw = 1 −[(hc
/ψ)2 + 1
]m · exp[−m(hc
/ψ)2
](9)
Swa = acCψ
(hco)2/3
e1/3(ψ)1/6(10)
Cψ = 1 − ln(1 + ψ/ψr)
ln(1 + ψ0/ψr)
(11)
where hc (cm H2O) is the equivalent capillary rise,described below, m and ac are dimensionless parameters(for granular and soils m = 0.091 and ac = 0.013), ψ0 is themaximum suction in oven-dry conditions, equal to 107 cmH2O and ψr is related to hc:
ψr = 0.86h1.2c (12)
Fig. 4 Numerical grid used inthe simulations

330 Comput Geosci (2019) 23:325–337
Table 1 Hydraulic parameters of fine sands obtained from the RETCprogram
FSa2 FSa1 (Lubiatowo)
van Genuchten
n – 5.47 nb – 5.22
pg Pa 1672 pg Pa 1380
Brooks-Corey
nb – 2.55 nb – 2.42
pe Pa 1388.6 pe Pa 1135
The equivalent capillary rise hc is defined as:
hc = σw cos βw
ρwg
α
eDH(13)
where σw = 0.073 N/m is the surface tension of water,βw = 0 is the contact angle between water and solid phase,α = 10 is a shape factor, e is the void ratio, and DH isan equivalent particle diameter, which can be approximatedusing the following function [2]:
DH = [1 + 1.17 log(CU)]d10 (14)
where d10 is diameter corresponding to 10% passing onthe cumulative grain size distribution curve and CU is thecoefficient of uniformity (CU = d60/d10).
The MK retention functions of both sands, obtained intabular form, were converted to VGM and BC functionsusing the RETC computer program [51]. The residualsaturations were assumed Srw = 0 for water and Sra = 0.02for air. The fitted parameters pg and ng are given in Table 1,and the curves are shown in Fig. 5.
Table 2 Hydraulic parameters for the sands obtained from the RETCprogram
k (m/day) κ (m2) × 10−11
Author FSa1 FSa2 FSa1 FSa2
K-C 27.84 11.95 3.29 1.41
Zunker 41.40 18.32 4.90 2.17
Hazen 38.88 20.28 4.60 2.40
USBR 11.22 6.09 1.33 0.72
The permeability coefficient can also be estimated basedon the granulometric curve. There is a large number ofavailable formulas, developed to estimate permeability withrespect to water in saturated conditions (kws = κρwg/μw),from which the intrinsic permeability κ can be also calcu-lated. For a review of such methods, see, e.g., [9, 41, 53].Here, we used four well-established formulas. Kozeny-Carman and Zunker equations were taken from [41]. Theyinclude dependence of kws on porosity. They also requirea representative grain diameter, which is calculated as anaverage value based on the whole granulometric curve. TheHazen and USBR equations are respectively kws = 1200 ·d2
10 and kws = 311 d2.320 . where d10 and d20 are diameters
corresponding to 10 and 20% content of grains in Fig. 2.The calculated values are listed in Table 2.
The differences in computed permeability values aresignificant, but such discrepancies between empirical for-mulas occur commonly (e.g., [41]). For the core of the dike(FSa2), the largest value was obtained with the Hazenformula and the smallest values with the USBR formula.
Fig. 5 Soil water retention curvefor FSa1 (left) and FSa2 (right)

Comput Geosci (2019) 23:325–337 331
Fig. 6 Two-phase simulationresults using VGM modelinfluence of permeabilitycoefficient
5 Simulations and sensitivity analysis
Figures 6 and 7 show the measured and computed valuesof the air pressure, respectively, for the van Genuchten andBrooks-Corey models, using different permeability estima-tions. It can be seen that up to the time of about 540 s,when the macropores occur for the first time, the agreementbetween all numerical solutions and the measurements israther good. At this stage, the air can move freely inside thestructure and there is only a small buildup of the air pres-sure, regardless of the infiltration rate. The Brooks-Coreymodel seems to better represent the accelerated increaseof the air pressure about 500 s, as compared with the vanGenuchten model.
After 540 s, significant differences are observed betweenthe experimental results and computations. This is due tothe escape of air through macropores, which leads to oscil-lations and reduction of the measured pressures. This effectcannot be represented in our numerical model. Note thatoscillatory behavior of the pore air pressure and relatedair flux between subsurface and the atmosphere was mod-elled by [10] using the leakage concept, where an additionalset of parameters was assigned to the ground-atmosphereinterface. Such an attempt was not undertaken here, and itmay be a topic of further study.
Numerical solutions start to diverge significantly approx-imately at the same time as the air breakthrough occurs inthe experiment. This time corresponds to the full development
Fig. 7 Two-phase simulationresults using BC modelinfluence of permeabilitycoefficient

332 Comput Geosci (2019) 23:325–337
Fig. 8 Comparison of saturation, pore air pressure, and normalized pore air pressure maps for the BC and VGM models, t = 580 s
Fig. 9 Air pressure evolution inthe observation point fordifferent values of ng in theVGM model
Fig. 10 Air pressure evolutionin the observation point fordifferent values of pg in theVGM model

Comput Geosci (2019) 23:325–337 333
Fig. 11 Air pressure evolutionin the observation point fordifferent values of nb in the BCmodel
of an entrapped air region inside the dike, separated fromthe right-hand slope by a layer of quasi-saturated sand. Inthe numerical model, further infiltration causes air compres-sion, proportional to the permeability of the medium. Notehowever, that even though the numerical simulations do notreproduce the measured pressure drop, there is a visiblechange of shape in the pressure evolution curve at the break-through time. This corresponds to the start of air outflowthrough the quasi water-saturated layer, which developedalong the surface of the slope during overflow. For thelargest permeability estimate (the Hazen formula), a goodagreement with measurements is obtained again for the sec-ond peak value of the air pressure. However, the numericalsimulation predicts further buildup of the air pressure up tothe final value of 1605 Pa (results not shown here). However,
these high values of the air pressure correspond to the stateof residual air saturation and are determined by the elevatedvalues of the water pressure, imposed by the external watertable. Other estimates of permeability lead to significantlylower rate of the pressure increase.
Figure 8 shows the distribution of water saturation, poreair pressure, and normalized pore air pressure at time 580 s,shortly after the appearance of cracks. The air pressure iscalculated from the primary variables of the 2PH model,pa = pw + pc (Sw). The largest air pressure values occurin the lower-left part of the dike. In this region, air is atresidual saturation, with capillary pressure close to 0, butthe water pressure is high, because of the position of thewater table, which means that the calculated air pressureis also high. We also show the “normalized” air pressure,
Fig. 12 Air pressure evolutionin the observation point fordifferent values of pe in the BCmodel
334 Comput Geosci (2019) 23:325–337
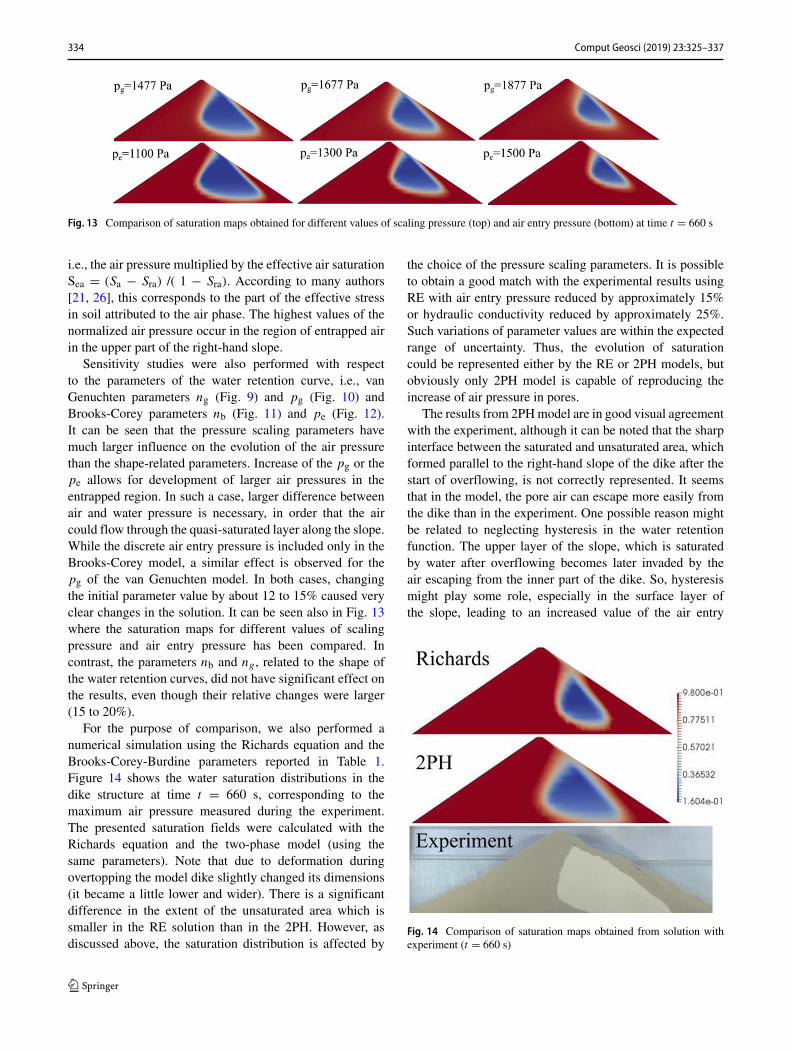
Fig. 13 Comparison of saturation maps obtained for different values of scaling pressure (top) and air entry pressure (bottom) at time t = 660 s
i.e., the air pressure multiplied by the effective air saturationSea = (Sa − Sra) /( 1 − Sra). According to many authors[21, 26], this corresponds to the part of the effective stressin soil attributed to the air phase. The highest values of thenormalized air pressure occur in the region of entrapped airin the upper part of the right-hand slope.
Sensitivity studies were also performed with respectto the parameters of the water retention curve, i.e., vanGenuchten parameters ng (Fig. 9) and pg (Fig. 10) andBrooks-Corey parameters nb (Fig. 11) and pe (Fig. 12).It can be seen that the pressure scaling parameters havemuch larger influence on the evolution of the air pressurethan the shape-related parameters. Increase of the pg or thepe allows for development of larger air pressures in theentrapped region. In such a case, larger difference betweenair and water pressure is necessary, in order that the aircould flow through the quasi-saturated layer along the slope.While the discrete air entry pressure is included only in theBrooks-Corey model, a similar effect is observed for thepg of the van Genuchten model. In both cases, changingthe initial parameter value by about 12 to 15% caused veryclear changes in the solution. It can be seen also in Fig. 13where the saturation maps for different values of scalingpressure and air entry pressure has been compared. Incontrast, the parameters nb and ng , related to the shape ofthe water retention curves, did not have significant effect onthe results, even though their relative changes were larger(15 to 20%).
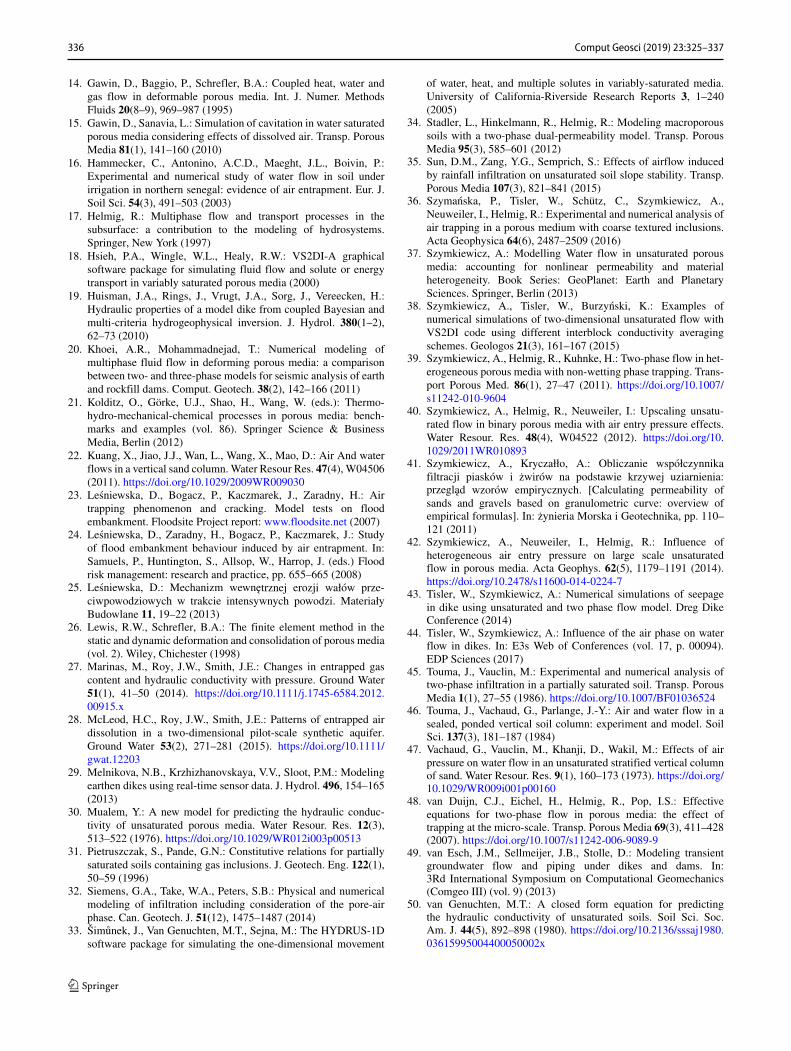
For the purpose of comparison, we also performed anumerical simulation using the Richards equation and theBrooks-Corey-Burdine parameters reported in Table 1.Figure 14 shows the water saturation distributions in thedike structure at time t = 660 s, corresponding to themaximum air pressure measured during the experiment.The presented saturation fields were calculated with theRichards equation and the two-phase model (using thesame parameters). Note that due to deformation duringovertopping the model dike slightly changed its dimensions(it became a little lower and wider). There is a significantdifference in the extent of the unsaturated area which issmaller in the RE solution than in the 2PH. However, asdiscussed above, the saturation distribution is affected by
the choice of the pressure scaling parameters. It is possibleto obtain a good match with the experimental results usingRE with air entry pressure reduced by approximately 15%or hydraulic conductivity reduced by approximately 25%.Such variations of parameter values are within the expectedrange of uncertainty. Thus, the evolution of saturationcould be represented either by the RE or 2PH models, butobviously only 2PH model is capable of reproducing theincrease of air pressure in pores.
The results from 2PH model are in good visual agreementwith the experiment, although it can be noted that the sharpinterface between the saturated and unsaturated area, whichformed parallel to the right-hand slope of the dike after thestart of overflowing, is not correctly represented. It seemsthat in the model, the pore air can escape more easily fromthe dike than in the experiment. One possible reason mightbe related to neglecting hysteresis in the water retentionfunction. The upper layer of the slope, which is saturatedby water after overflowing becomes later invaded by theair escaping from the inner part of the dike. So, hysteresismight play some role, especially in the surface layer ofthe slope, leading to an increased value of the air entry
Fig. 14 Comparison of saturation maps obtained from solution withexperiment (t = 660 s)

Comput Geosci (2019) 23:325–337 335
pressure. On the other hand, the position of the zone ofair outflow on the dike slope is correctly reproduced bythe model. In the numerical simulations, the air escape ismodelled as a continuous process, while in the experiments,discrete outbursts were observed, connected with damagingsoil structure and creation of macropores.
6 Conclusions
The research described in this paper provided insights onthe possible role of the air phase during overflowing ofdikes and similar structures. During the overflow experi-ment on a model dike, a large amount of air was trappedwhich finally led to the formation of macropores and cracks.The general pattern of water infiltration observed in theexperiment was in qualitative agreement with earlier numer-ical simulations for real-sized dikes [43, 44]. In this work,an attempt was undertaken to reproduce the experimentalresults with numerical simulations based on a two-phaseflow model with parameters estimated from the granulo-metric curve using the modified Kovacs method by [2].The agreement with the experiment was good for the initialstage of infiltration, especially when the Brooks-Corey-Burdine model was used together with the intrinsic per-meability calculated according to the Hazen formula. Dueto the limitations of the applied model, it was not possi-ble to reproduce the later oscillations and dissipation ofthe pore air pressure, related to the formation of macro-pores. In this regard, further studies are necessary. Futuremodeling efforts could include coupling between flow anddeformation model, introduction of the air escape mecha-nism similar to the one described by [10] and/or hysteresisof the water retention curve.
Sensitivity analysis showed that in the earlier stage ofinfiltration, before the formation of macropores the evolu-tion of the air pressure is not sensitive to the changes of thepermeability and the retention function parameters. In thelater stage, the air pressure values are sensitive to the pressurescaling parameters of the Brooks-Corey and van Genuchtenretention curves and to the intrinsic permeability value. Theshape parameters ng and nb influence the results to a muchlower degree
The changes in pore air pressure seem to have animportant influence on the mechanical behavior of thestructure. Their evolution cannot be reproduced with theRichards equation. Also, in terms of the distribution of thewater saturation, the two-phase model was closer to theexperimental results than the Richards model. However, itwas possible to reproduce the saturation pattern by changingthe hydraulic parameters in the Richards equation. Theseresults highlight the importance of using multiphase flowmodels for mechanical analysis of structures made of earth
materials, confirming observations from other authors (e.g.,[20, 34, 35, 62]).
Acknowledgements The laboratory experiment was conducted in theframework of a research project from the National Science Foundation(Poland) NN 506 31 70 39 “Investigation of microstructure changes insoil and their influence on water and air flow and contaminant transportin flood dikes,” carried out at the Institute of Hydro-Engineering of thePolish Academy of Sciences (IBW PAN) in Gdansk (2010-2013).
Open Access This article is distributed under the terms of theCreative Commons Attribution 4.0 International License (http://creativecommons.org/licenses/by/4.0/), which permits unrestricteduse, distribution, and reproduction in any medium, provided you giveappropriate credit to the original author(s) and the source, provide alink to the Creative Commons license, and indicate if changes weremade.
Publisher’s Note Springer Nature remains neutral with regard tojurisdictional claims in published maps and institutional affiliations.
References
1. Abo Elela, M.M.I.: Filtration phenomena in earth dike duringintensive precipitation. PhD Thesis, Polish Academy of Sciences,Institute of Hydro-Engineering, Gdansk, Poland (1996)
2. Aubertin, M., Mbonimpa, M., Bussiere, B., Chapuis, R.P.: Amodel to predict the water retention curve from basic geotechnicalproperties. Can. Geotech. J. 40(6), 1104–1122 (2003)
3. Banerjee, M., Singh, V.P., Singh, H.N., Shankar, D., Singh, U.S.:Ground rupturing due to entrapped air/gas in the unconfined zone.Int. J. Geosci. 1(03), 149 (2010)
4. Bogacz, P.: Degradation of flood embankments—results ofobservation of the destruction mechanism and comparison with anumerical model. Open Eng. 7(1), 237–243 (2017)
5. Bogacz, P., Kaczmarek, J., Lesniewska, D.: Influence of airentrapment on flood embankment failure mechanics—model tests.Technol. Sci. 11, 188–201 (2008)
6. Brinkgreve, R.B.J., Vermeer, P.A.: Plaxis manual, version 7, 5–1(1998)
7. Brooks, R.H., Corey, A.T.: Hydraulic Properties of Porous Media.Technical Report Hydrology Paper 3. Colorado State University,Fort Collins, Colorado, USA (1964)
8. Burdine, N.T.: Relative permeability calculations from poresize distribution data. Transactions of the American Institute ofMining. Min. Metall. Pet. Eng. 198, 71–77 (1953)
9. Chapuis, R.P.: Predicting the saturated hydraulic conductivity ofsoils: a review. Bull. Eng. Geol. Environ. 71(3), 401–434 (2012)
10. Delfs, J.O., Wang, W., Kalbacher, T., Singh, A.K., Kolditz, O.: Acoupled surface/subsurface flow model accounting for air entrap-ment and air pressure counterflow. Environ. Earth Sci. 69(2),395–414 (2013). https://doi.org/10.1007/s12665-013-2420-1
11. Dunn, A.M., Silliman, S.E.: Air and water entrapment in thevicinity of the water table. Ground Water 41, 729–734 (2003)
12. Faybishenko, B.A.: Hydraulic behavior of quasi-saturated soilsin the presence of entrapped air: laboratory experiments. WaterResour. Res. 31(10), 2421–2435 (1995)
13. Gamnitzer, P., Hofstetter, G.: Fully coupled multi-phase modellingof pumping induced settlements, air-and water flow in multi-layered normally consolidated soils. Comput. Geotech. 79, 10–21(2016)
336 Comput Geosci (2019) 23:325–337
14. Gawin, D., Baggio, P., Schrefler, B.A.: Coupled heat, water andgas flow in deformable porous media. Int. J. Numer. MethodsFluids 20(8–9), 969–987 (1995)
15. Gawin, D., Sanavia, L.: Simulation of cavitation in water saturatedporous media considering effects of dissolved air. Transp. PorousMedia 81(1), 141–160 (2010)
16. Hammecker, C., Antonino, A.C.D., Maeght, J.L., Boivin, P.:Experimental and numerical study of water flow in soil underirrigation in northern senegal: evidence of air entrapment. Eur. J.Soil Sci. 54(3), 491–503 (2003)
17. Helmig, R.: Multiphase flow and transport processes in thesubsurface: a contribution to the modeling of hydrosystems.Springer, New York (1997)
18. Hsieh, P.A., Wingle, W.L., Healy, R.W.: VS2DI-A graphicalsoftware package for simulating fluid flow and solute or energytransport in variably saturated porous media (2000)
19. Huisman, J.A., Rings, J., Vrugt, J.A., Sorg, J., Vereecken, H.:Hydraulic properties of a model dike from coupled Bayesian andmulti-criteria hydrogeophysical inversion. J. Hydrol. 380(1–2),62–73 (2010)
20. Khoei, A.R., Mohammadnejad, T.: Numerical modeling ofmultiphase fluid flow in deforming porous media: a comparisonbetween two- and three-phase models for seismic analysis of earthand rockfill dams. Comput. Geotech. 38(2), 142–166 (2011)
21. Kolditz, O., Gorke, U.J., Shao, H., Wang, W. (eds.): Thermo-hydro-mechanical-chemical processes in porous media: bench-marks and examples (vol. 86). Springer Science & BusinessMedia, Berlin (2012)
22. Kuang, X., Jiao, J.J., Wan, L., Wang, X., Mao, D.: Air And waterflows in a vertical sand column. Water Resour Res. 47(4), W04506(2011). https://doi.org/10.1029/2009WR009030
23. Lesniewska, D., Bogacz, P., Kaczmarek, J., Zaradny, H.: Airtrapping phenomenon and cracking. Model tests on floodembankment. Floodsite Project report: www.floodsite.net (2007)
24. Lesniewska, D., Zaradny, H., Bogacz, P., Kaczmarek, J.: Studyof flood embankment behaviour induced by air entrapment. In:Samuels, P., Huntington, S., Allsop, W., Harrop, J. (eds.) Floodrisk management: research and practice, pp. 655–665 (2008)
25. Lesniewska, D.: Mechanizm wewnetrznej erozji wałow prze-ciwpowodziowych w trakcie intensywnych powodzi. MateriałyBudowlane 11, 19–22 (2013)
26. Lewis, R.W., Schrefler, B.A.: The finite element method in thestatic and dynamic deformation and consolidation of porous media(vol. 2). Wiley, Chichester (1998)
27. Marinas, M., Roy, J.W., Smith, J.E.: Changes in entrapped gascontent and hydraulic conductivity with pressure. Ground Water51(1), 41–50 (2014). https://doi.org/10.1111/j.1745-6584.2012.00915.x
28. McLeod, H.C., Roy, J.W., Smith, J.E.: Patterns of entrapped airdissolution in a two-dimensional pilot-scale synthetic aquifer.Ground Water 53(2), 271–281 (2015). https://doi.org/10.1111/gwat.12203
29. Melnikova, N.B., Krzhizhanovskaya, V.V., Sloot, P.M.: Modelingearthen dikes using real-time sensor data. J. Hydrol. 496, 154–165(2013)
30. Mualem, Y.: A new model for predicting the hydraulic conduc-tivity of unsaturated porous media. Water Resour. Res. 12(3),513–522 (1976). https://doi.org/10.1029/WR012i003p00513
31. Pietruszczak, S., Pande, G.N.: Constitutive relations for partiallysaturated soils containing gas inclusions. J. Geotech. Eng. 122(1),50–59 (1996)
32. Siemens, G.A., Take, W.A., Peters, S.B.: Physical and numericalmodeling of infiltration including consideration of the pore-airphase. Can. Geotech. J. 51(12), 1475–1487 (2014)
33. Simunek, J., Van Genuchten, M.T., Sejna, M.: The HYDRUS-1Dsoftware package for simulating the one-dimensional movement
of water, heat, and multiple solutes in variably-saturated media.University of California-Riverside Research Reports 3, 1–240(2005)
34. Stadler, L., Hinkelmann, R., Helmig, R.: Modeling macroporoussoils with a two-phase dual-permeability model. Transp. PorousMedia 95(3), 585–601 (2012)
35. Sun, D.M., Zang, Y.G., Semprich, S.: Effects of airflow inducedby rainfall infiltration on unsaturated soil slope stability. Transp.Porous Media 107(3), 821–841 (2015)
36. Szymanska, P., Tisler, W., Schutz, C., Szymkiewicz, A.,Neuweiler, I., Helmig, R.: Experimental and numerical analysis ofair trapping in a porous medium with coarse textured inclusions.Acta Geophysica 64(6), 2487–2509 (2016)
37. Szymkiewicz, A.: Modelling Water flow in unsaturated porousmedia: accounting for nonlinear permeability and materialheterogeneity. Book Series: GeoPlanet: Earth and PlanetarySciences. Springer, Berlin (2013)
38. Szymkiewicz, A., Tisler, W., Burzynski, K.: Examples ofnumerical simulations of two-dimensional unsaturated flow withVS2DI code using different interblock conductivity averagingschemes. Geologos 21(3), 161–167 (2015)
39. Szymkiewicz, A., Helmig, R., Kuhnke, H.: Two-phase flow in het-erogeneous porous media with non-wetting phase trapping. Trans-port Porous Med. 86(1), 27–47 (2011). https://doi.org/10.1007/s11242-010-9604
40. Szymkiewicz, A., Helmig, R., Neuweiler, I.: Upscaling unsatu-rated flow in binary porous media with air entry pressure effects.Water Resour. Res. 48(4), W04522 (2012). https://doi.org/10.1029/2011WR010893
41. Szymkiewicz, A., Kryczałło, A.: Obliczanie wspołczynnikafiltracji piaskow i zwirow na podstawie krzywej uziarnienia:przeglad wzorow empirycznych. [Calculating permeability ofsands and gravels based on granulometric curve: overview ofempirical formulas]. In: zynieria Morska i Geotechnika, pp. 110–121 (2011)
42. Szymkiewicz, A., Neuweiler, I., Helmig, R.: Influence ofheterogeneous air entry pressure on large scale unsaturatedflow in porous media. Acta Geophys. 62(5), 1179–1191 (2014).https://doi.org/10.2478/s11600-014-0224-7
43. Tisler, W., Szymkiewicz, A.: Numerical simulations of seepagein dike using unsaturated and two phase flow model. Dreg DikeConference (2014)
44. Tisler, W., Szymkiewicz, A.: Influence of the air phase on waterflow in dikes. In: E3s Web of Conferences (vol. 17, p. 00094).EDP Sciences (2017)
45. Touma, J., Vauclin, M.: Experimental and numerical analysis oftwo-phase infiltration in a partially saturated soil. Transp. PorousMedia 1(1), 27–55 (1986). https://doi.org/10.1007/BF01036524
46. Touma, J., Vachaud, G., Parlange, J.-Y.: Air and water flow in asealed, ponded vertical soil column: experiment and model. SoilSci. 137(3), 181–187 (1984)
47. Vachaud, G., Vauclin, M., Khanji, D., Wakil, M.: Effects of airpressure on water flow in an unsaturated stratified vertical columnof sand. Water Resour. Res. 9(1), 160–173 (1973). https://doi.org/10.1029/WR009i001p00160
48. van Duijn, C.J., Eichel, H., Helmig, R., Pop, I.S.: Effectiveequations for two-phase flow in porous media: the effect oftrapping at the micro-scale. Transp. Porous Media 69(3), 411–428(2007). https://doi.org/10.1007/s11242-006-9089-9
49. van Esch, J.M., Sellmeijer, J.B., Stolle, D.: Modeling transientgroundwater flow and piping under dikes and dams. In:3Rd International Symposium on Computational Geomechanics(Comgeo III) (vol. 9) (2013)
50. van Genuchten, M.T.: A closed form equation for predictingthe hydraulic conductivity of unsaturated soils. Soil Sci. Soc.Am. J. 44(5), 892–898 (1980). https://doi.org/10.2136/sssaj1980.03615995004400050002x

Comput Geosci (2019) 23:325–337 337
51. van Genuchten, M.V., Leij, F.J., Yates, S.R.: The RETC code forquantifying the hydraulic functions of unsaturated soils (1991)
52. Vasin, M., Lehmann, P., Kaestner, A., Hassanein, R., Nowak, W.,Helmig, R., Neuweiler, I.: Drainage in heterogeneous sand columnswith different geometric structures. Adv. Water Resour. 31(9),1205–1220 (2008). https://doi.org/10.1016/j.advwatres.2008.01.004
53. Vukovic, M., Soro, A.: Determination of hydraulic conductivityof porous media from grain-size composition. Water ResourcesPubns (1992)
54. Wang, Z., Feyen, J., Nielsen, D.R., Genuchten, M.T.: Two-phaseflow infiltration equations accounting for air entrapment effects.Water Resour. Res. 33(12), 2759–2767 (1997)
55. Wang, Z., Feyen, J., Genuchten, M.T., Nielsen, D.R.: Airentrapment effects on infiltration rate and flow instability. WaterResour. Res. 34(2), 213–222 (1998)
56. Wheeler, S.J.: A conceptual model for soils containing large gasbubbles. Geotechnique 38(3), 389–397 (1988a)
57. Wheeler, S.J.: The undrained shear strength of soils containinglarge gas bubbles. Geotechnique 38(3), 399–413 (1988b)
58. Zaradny, H.: Experiment setup for simulation of the flow of waterand pollutants. Report IBW PAN, 10 pp. 14 figs (1992)
59. Zaradny, H.: Physical modeling of infiltration into dikes forstability purposes. The second term. Report IBW PAN, ContractNo. DWW-510 24 pp (1993)
60. Zaradny, H.: Physical modelling of infiltration into dikes forstability purposes. The final report. Report IBW PAN, ContractNo. DWW-510 29 pp (1994)
61. Zaradny, H.: Entrapped air–reason for the unexpected porepressure behaviour in levees and earth dams. In: Proceedings ofXXVIII IAHR Congress—hydraulic engineering for sustainablewater resources management at the turn of the millennium, Graz,Austria (p. 7) (1999)
62. Zhang, X.Y., Zhu, Y.M., Fang, C.H.: The role of air flow in soilslope stability analysis. J. Hydrodyn. Ser. B 21(5), 640–646 (2009)