debris coolability simulations with different particle ... coolability simulations with different...
TRANSCRIPT

RESEARCH REPORT VTT-R-00257-13
Debris coolability simulations with different particle materials and comparisons to COOLOCE experiments Authors: Eveliina Takasuo
Confidentiality: Public

RESEARCH REPORT VTT-R-00257-13
1 (17)
Report’s title Debris coolability simulations with different particle materials and comparisons to COOLOCE experiments Customer, contact person, address Order reference SAFIR2014 Finnish Research Programme on Nuclear Power Plant Safety
3/2012SAF
Project name Project number/Short name Core debris coolability and environmental consequence analysis
77421 COOLOCE-E
Author(s) Pages Eveliina Takasuo 17 + 1 appendix Keywords Report identification code nuclear power safety, severe accident, MEWA code, core debris, coolability, COOLOCE experiments
VTT-R-00257-13
Summary Simulations modelling debris bed coolability have been assessed against the COOLOCE experiments. Two different particle materials were used as debris simulant in the experiments; irregular gravel in COOLOCE-8 and spherical ceramic beads in COOLOCE-7 and all the preceding test runs. For both materials, the effective particle diameter used as input in the simulations has been estimated by separate single-phase pressure loss measurements. Parameter variations have been done for particle size and porosity. In addition, the simulation results are compared to the dryout heat flux measured in the STYX experiments with the same gravel material. It was found that with the measured effective particle diameter and porosity, the simulation models predict dryout heat flux with a relatively good accuracy in the case of spherical particles. In the case of irregular gravel, for which the uncertainties of porosity and representative particle diameter are larger, the discrepancy between the simulations and experiments is greater.
Confidentiality Public Espoo 16.1.2013 Written by Eveliina Takasuo Senior Scientist
Reviewed by Tuomo Sevón Senior Scientist
Accepted by Timo Vanttola Technology Manager
VTT’s contact address P.O. Box 1000, 02044 VTT, Finland Distribution (customer and VTT) SAFIR2014 Reference Group 5 VTT: Timo Vanttola, Kaisa Simola, Vesa Suolanen, Eija Karita Puska, Mikko Ilvonen, Ville Hovi, Jarto Niemi, Veikko Taivassalo, Tuomo Sevón, Niina Könönen, Anna Nieminen, Tommi Kekki, Kari Ikonen The use of the name of the VTT Technical Research Centre of Finland (VTT) in advertising or publication in part of
this report is only permissible with written authorisation from the VTT Technical Research Centre of Finland.

RESEARCH REPORT VTT-R-00257-13
2 (17)
Contents
1 Introduction ............................................................................................................. 3
2 Goal ........................................................................................................................ 4
3 Experimental specifications .................................................................................... 4
4 Simulation specifications ........................................................................................ 5
4.1 Drag force models for porous medium ............................................................ 5 4.2 Simulation set-up ............................................................................................ 6
5 Simulation results ................................................................................................... 9
5.1 Cylindrical debris beds with gravel (COOLOCE-8 and STYX) ........................ 9 5.2 Cylindrical debris beds with spherical particles (COOLOCE-3-5) ................. 11 5.3 Conical debris bed with spherical particles (COOLOCE-6-7) ........................ 12
6 Discussion ............................................................................................................ 13
6.1 Model limitations ........................................................................................... 14
7 Conclusions .......................................................................................................... 15
References ................................................................................................................ 16
APPENDIX A. Dryout heat flux and power density in the experiments and simulations
RESEARCH REPORT VTT-R-00257-13
3 (17)
1 Introduction
A porous particle bed - or debris bed - that consists of solidified corium may be formed as a result of a core melt accident in a nuclear power reactor. Depending on the design of the reactor, such a debris bed may be formed in the containment in a deep water pool (ex-vessel) or inside the pressure vessel. In the Nordic boiling water reactors, the coolability of the ex-vessel debris bed plays an important role in the severe accident management strategy. In order to ensure the coolability of the core debris and to prevent dryout and possible re-melting of the material, decay heat has to be removed by boiling and two-phase flow circulation. In addition, the issue is highly topical due to the accident at Fukushima which apparently resulted in various degrees of core damages in Units 1-3. The COOLOCE test facility has been used to experimentally investigate the coolability of porous particle beds of different geometries. The experiments have been conducted within the frame of the SAFIR2010 and SAFIR2014 national research programmes on nuclear power plant safety. The experimental programme has been described in earlier reports by Takasuo et al. ([1-6]). An important goal of the work is to obtain data for code validation and development. The analyses of the coolability of the molten and/or solidified core in reactor scale are done by severe accident simulation codes. The capabilities of the simulation codes are evaluated by comparing the simulated and experimental results. It is important that this work includes the debris bed configurations that are considered representative based on the latest knowledge of the accident scenarios. On the other hand, it is often difficult, if not impossible, to accurately reproduce the conditions of a reactor scenario in a laboratory (e.g. the heating methods are different). The limitations of experimental set-ups and instrumentation should be carefully evaluated by comparing results obtained in separate but well-defined experimental conditions. This is one of the tasks of the on-going NKS DECOSE project conducted jointly by VTT and KTH (Royal Institute of Technology, Sweden). Comparisons of experimental results and modelling results with models that have already gone through validation against earlier experiments also help to identify these limitations.
One of the coolability simulation codes is MEWA 2D which has been developed by the IKE institute at Stuttgart University specifically for severe accident assessment [7]. The code has been used at VTT in several previous studies to predict the dryout heat flux in different experiments [8-11]. In the present study, the analysis of the COOLOCE experiments has been continued with the MEWA code. The issues of effective particle diameter and porosity considering two different particle materials used in the experiments have been addressed. Parameter variations have been performed for the simulations of conical and cylindrical debris beds.

RESEARCH REPORT VTT-R-00257-13
4 (17)
2 Goal
The objectives of the presented simulations are as follows: 1) Modelling of the COOLOCE-8 experiments performed in 2012 with measured
effective particle size and estimating a. the effect of the particle material b. the possible test facility specific differences by comparison to STYX
experiments
2) Re-evaluation of the result of the conical and cylindrical bed experiments conducted in 2011 with
a. measured effective particle size and porosity b. variations of particle size and porosity c. improved power step accuracy
3 Experimental specifications
The experiments COOLOCE-3-5 with a cylindrical test bed and COOLOCE-6-7 with a conical test bed were performed with spherical zirconia/silica (ZrO2/SiO2) beads with the mean particle size of approximately 0.97 mm [3, 4]. The size was estimated by using image processing software. The follow-up test sequence, COOLOCE-8, performed in July 2012 was conducted with irregular alumina (Al2O3) gravel as the simulant material [5]. The same material was used in the STYX experiments [12, 13]. Otherwise, the test arrangements in COOLOCE-3-5 and -8 were similar. The detailed facility specifications can be found in the aforementioned references. Samples of the materials are shown in Fig. 1.
Fig. 1.The alumina gravel used in COOLOCE-8 (left) and the zirconia/silica
beads used in COOLOCE-3 – COOLOCE-7 (right). Note: the scale of the images is not the same.
The gravel consists of particles of variable size and shape with the size range being 0.25-10 mm. According to measurements performed at Royal Institute of Technology (KTH), the “effective” particle diameter of a batch of the gravel was 0.65 mm [14]. This effective diameter is estimated by single-phase flow pressure loss measurements by fitting the pressure loss at different flow velocities to the Ergun’s equation [15], assuming that porosity is known.

RESEARCH REPORT VTT-R-00257-13
5 (17)
The bed porosity for which the 0.65 mm diameter was obtained was 40.8%. The result is slightly different from a similar type of measurement that was originally conducted for the STYX experiments even though the particle size distribution in COOLOCE-8 was adjusted to closely correspond to the original size distribution [5]. For the STYX experiments, an effective diameter of 0.8 mm was estimated for 40% porosity. The difference might be related to the test set-ups or to minor shifts in the properties of the particle batches in the measurements. The size range of the spherical beads is 0.82-1.11 mm according to a sample of about 1000 beads. According to the measurement at KTH, the effective particle diameter of the spheres is 0.8 mm and the porosity 39.9% [14]. This means that the representative diameter considering the flow resistance would be close to the smallest particles in the distribution, rather than the mean of 0.97 mm. The material densities of the gravel and the beads are 3930 kg/m3 and 4230 kg/m3, respectively. The densities were verified for the measurements of effective particle diameter. The approximate thermal conductivities of 20 W/m·K for alumina and 2 W/m·K for zirconia/silica are used in the simulations.
4 Simulation specifications
4.1 Drag force models for porous medium
The MEWA code models the transient behaviour of the debris bed in 2D with cylindrical or Cartesian geometry by solving the conservation equations for mass, momentum and energy [7]. The momentum conservation equations for the liquid and gas phases appear in a simplified form with no temporal derivatives or viscous shear stress term:
−∇ = +
(1 − ) +
(1 − ) (1)
−∇ = +
+
(2)
where p is pressure [Pa], ρ is density [kg/m3], ε is porosity, α is void fraction, and are the drag forces between the liquid and gas [N/m3], respectively, and is the gas-liquid drag (interfacial drag) [N/m3]. In the cylindrical bed simulations, we have used the “basic” drag force models derived from the two-phase extension of the Ergun’s equation in which the interfacial drag is not explicitly considered. In this approach, is omitted and the particle-fluid drag forces are = (1− ) + | | (3)

RESEARCH REPORT VTT-R-00257-13
6 (17)
= + (4)
where is superficial velocity [m/s] and μ is viscosity [kg/m/s]. The relative permeability Kr [-] and relative passability ηr [-] are defined by powers of void fraction as follows = (1 − ) , = (5)
= (1− ) , = (6)
The powers n and m vary depending on the author; Lipinski suggested that n=3 and m=3 [16], according to Reed n=3 and m=5 [17] and Hu and Theofanous proposed that n=3 and m=6 [18]. The assumption of Reed is the most commonly used and has shown to fit most experimental data well. The single-phase permeability K [m2] and passability η [m] according to Ergun are
= 150(1− ) , = 1.75(1− ) (7)
In all the cylindrical bed simulation cases, we have used the Reed model for relative passability. A model variation is considered in the case of gravel where the simulation with the effective particle diameter (dp = 0.65 mm) and porosity (ε = 40.8%) is run with the Hu and Theofanous model which yields a somewhat increased pressure drop compared to the Reed model (see the simulation matrix in the next section).
For the conical bed cases, the Tung and Dhir model with the modifications for particles smaller than 6 mm is applied (“modified Tung and Dhir model”) [19, 20]. This model includes a separate expression for the gas-liquid drag . The drag forces in this model are dependent on flow regime with weighting functions to account for the transition zones between the flow regimes. We have chosen this model for the conical bed because it has been well-established that the role of interfacial friction is significant in cases with multi-dimensional flooding, and because the particle size averages addressed are clearly smaller than 6 mm. Since the formulation of the model is rather complex, we do not repeat the model equations here. A summary of the models can be found in [20].
4.2 Simulation set-up
The MEWA code as distributed by Stuttgart University in August 2008 to VTT and KTH has been used in the simulations. Minor modifications were done later to e.g. the output files of the code but no changes have been done to the models and numerical solution. Simple 2D axisymmetric grids that have the cell size of

RESEARCH REPORT VTT-R-00257-13
7 (17)
2.5 mm have been used for the spatial discretization. The grids are shown in Fig. 2.
Fig. 2. The computational grids for the COOLOCE simulations: the cylindrical
bed (left) and the conical bed (right).The red area is the pool volume and the blue area is the particle bed.
The simulation cases are listed in Table 1. Each case in the table (1-9) contains a set of simulations which cover the pressure levels of the experiments to which the simulation results will be compared, i.e. 1-7 bar for the cylindrical beds and 1-3 bar for the conical bed. The variation range of particle diameter takes into account the different estimates of effective/average particle diameter and the porosity range is kept at a very realistic value (37-40.8%). It should be emphasized that in the simulations the different sizes and morphology of the ceramic beads and the gravel are accounted for only by the different average diameter and porosity and - concerning heat transfer solution - by different thermal properties. Otherwise, the inputs for the cylindrical bed simulations are similar (cases 1-6). The conical bed cases (7-9) have a different geometry but the material properties are the same as in cases 4-6. Since the simulations deal with the pre-dryout steady-states without significant temperature gradients and aim to determine the conditions at which such steady-states can no longer be reached, we assume that the differences in thermal properties do not play a significant role in the simulations.

RESEARCH REPORT VTT-R-00257-13
8 (17)
Table 1. The simulation matrix.
Cylindrical bed cases Gravel (COOLOCE-8 and STYX)
Case Porosity Particle diameter [mm]
1 0.408 0.65 1b 0.408 0.65 2 0.37 0.65 3 0.38 0.8
Beads (COOLOCE-3-5) Case Porosity Particle
diameter [mm] 4 0.40 0.97 5 0.37 0.97 6 0.40 0.80
Conical bed cases Beads (COOLOCE-6-7)
Case Porosity Particle diameter [mm]
7 0.38 0.90 8 0.40 0.80 9 0.38 0.97
The dryout power has been searched by using a stepwise power increase scheme and detecting which power level leads to local dryout. The size of the power step is 0.5 kW (this is the accuracy of the simulations). The time taken by the development of dryout is dependent on the power level; the greater the excess power, the faster the water remaining in the debris bed is evaporated. According to the simulations, the dryout delay time for the cylindrical debris bed with 0.5 kW accuracy is - in most cases - more than 3400s. In the cases of conical bed, there is no strong dependence of the dryout delay time on power. According to the simulation, the conical bed reaches a new steady-state in about 100-200 s. The accuracy in the experiments is 2 kW which corresponds to a dryout delay time of 20-30 minutes. Using the aforementioned power steps, the dryout heat flux can be determined with the accuracy of 7 kW/m2 in the simulations and 27 kW/m2 in the experiments. The dryout heat flux is defined as the dryout power divided by the surface area of the top of the debris bed.

RESEARCH REPORT VTT-R-00257-13
9 (17)
5 Simulation results
The experimental and simulation results are presented in this Chapter. The comparisons are arranged correspondingly to the groups of cases in Table 1. In the cases of cylindrical bed, the dryout heat flux (DHF) is presented and in the cases of conical bed, the dryout power density (DPD) as no surface area corresponding to the top of the cylinder can be easily determined for the conical geometry. The exact values of DHF and DPD for each case can be found in Appendix A in which the results are tabulated.
5.1 Cylindrical debris beds with gravel (COOLOCE-8 and STYX)
The measured and simulated dryout heat fluxes as a function of pressure in the case of the cylindrical bed and irregular gravel are shown in Fig. 3. It is seen that in near-atmospheric pressure, three of the four cases agree well with the simulation. The lower boundary case with the lowest porosity and particle diameter (37%, 0.65 mm) yields a lower DHF by about 55 kWm2 (30%). However, the pressure dependence in the experiments deviates from that of the simulations: the greater the pressure, the lower is the measured DHF compared to simulation results. For increased pressure, the three cases which predict the atmospheric DHF well overestimate the dryout heat flux, including the case with the estimated effective particle diameter (40.8%, 0.65 mm) while the closest estimate is given by the lower boundary case (37%, 0.65 mm). The simulated values of DHF at 7 bar vary between 328 and 486 kW/m2 with the experimental one being 342 kW/m2. The model variation case calculated using the model of Hu and Theofanous shows a moderate difference compared to the effective diameter case calculated by the Reed model. This is due to the increased drag force in the inertial (quadratic) terms of Eqs. 3-4. The DHF obtained by the Reed model is greater by 7-70 kW/m2.

RESEARCH REPORT VTT-R-00257-13
10 (17)
Fig. 3. Experimental and simulated dryout heat flux for the cylindrical bed with irregular
particles.
Next, the heat flux obtained by the simulations is compared to that of the STYX-8 experiments in which the same particle material was used [12]. However, the debris bed properties might be slightly different compared to the original ones as suggested by the differences in the estimates of effective particle diameter. Fig. 4 shows the dryout heat flux of the STYX experiments and the simulation results for the cases with effective particle diameters according to the new estimate (0.65 mm) [14] and the old estimate for the STYX test bed (0.8 mm) [13]. A lower boundary for DHF is represented by the case with 0.65 mm diameter and 37% porosity. Concerning the pressure dependence, a similar trend is seen as in the COOLOCE experiment. Experimental DHF does not increase as steeply as the simulated one and the models tend to underestimate DHF for lower pressure and overestimate it for higher pressures. However, the 7 bar point in the STYX experiments seems to be more in accordance with the simulation results than the corresponding point in the COOLOCE experiment in which the 7 bar DHF was pronouncedly low. Otherwise, for pressures below 7 bar, the measured DHF in COOLOCE is about 40 kW/m2 lower than in STYX. In general, the results are in accordance with previous simulations of the STYX experiments in which the best agreement was found with 37% porosity and 0.8 mm diameter [21].

RESEARCH REPORT VTT-R-00257-13
11 (17)
Fig. 4. Experimental and simulated dryout heat flux for the STYX experiments with irregular
particles.
5.2 Cylindrical debris beds with spherical particles (COOLOCE-3-5)
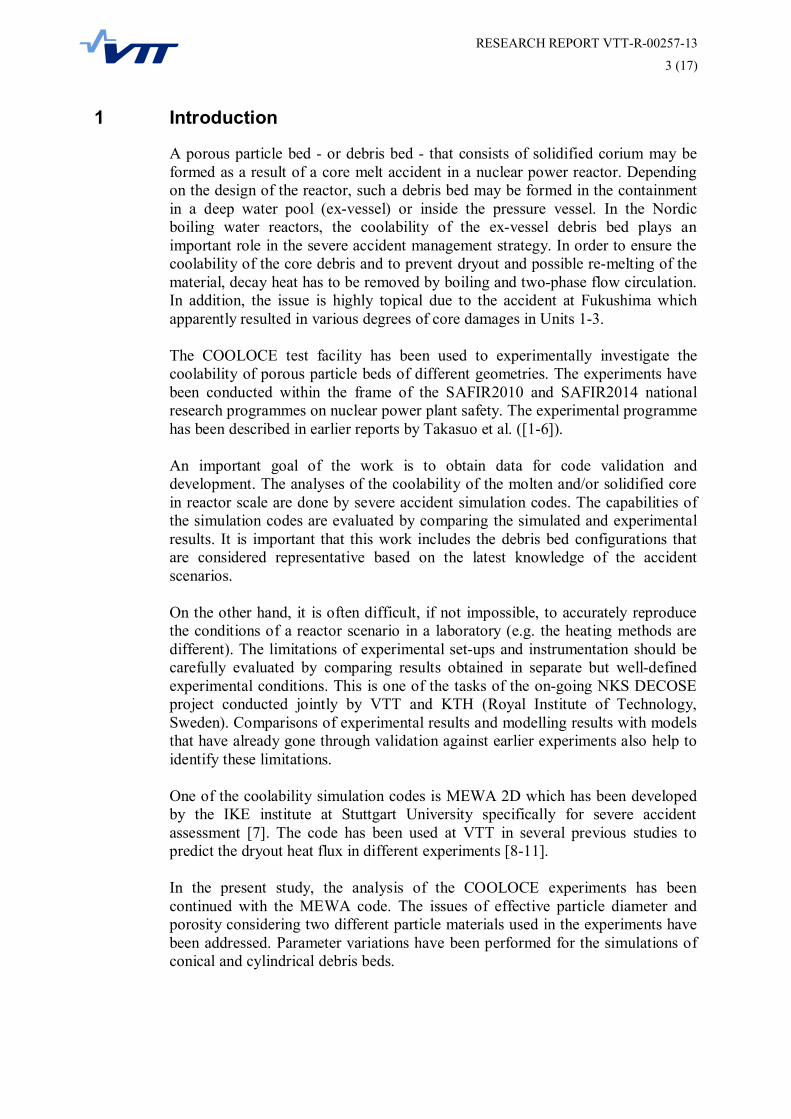
The comparison of experimental and simulated dryout heat fluxes in the case of cylindrical bed with ceramic beads is presented in Fig. 5. Contrary to the experiment addressed in the previous section, the particle size distribution with the ceramic beads is small and the particles are (nominally) spherical. It is seen that the cases with the separately measured effective diameter (40%, 0.8 mm) and the average diameter with a denser packing (37%, 0.97 mm) yield very similar results, both of which are in a good agreement with the experimental DHF for pressures above 1 bar. Assuming the looser packing of 40% and the arithmetic mean size of the particles, 0.97 mm, the DHF is somewhat overestimated. The pressure dependence in the experiments does not exactly follow the one in the simulations: at atmospheric pressure, there is a maximum deviation of about 90 kW/m2. However, the difference is not as notable as in the case of gravel particles in Fig. 3.
RESEARCH REPORT VTT-R-00257-13
12 (17)
Fig. 5. Experimental and simulated dryout heat flux for the cylindrical bed with spherical
particles.
5.3 Conical debris bed with spherical particles (COOLOCE-6-7)
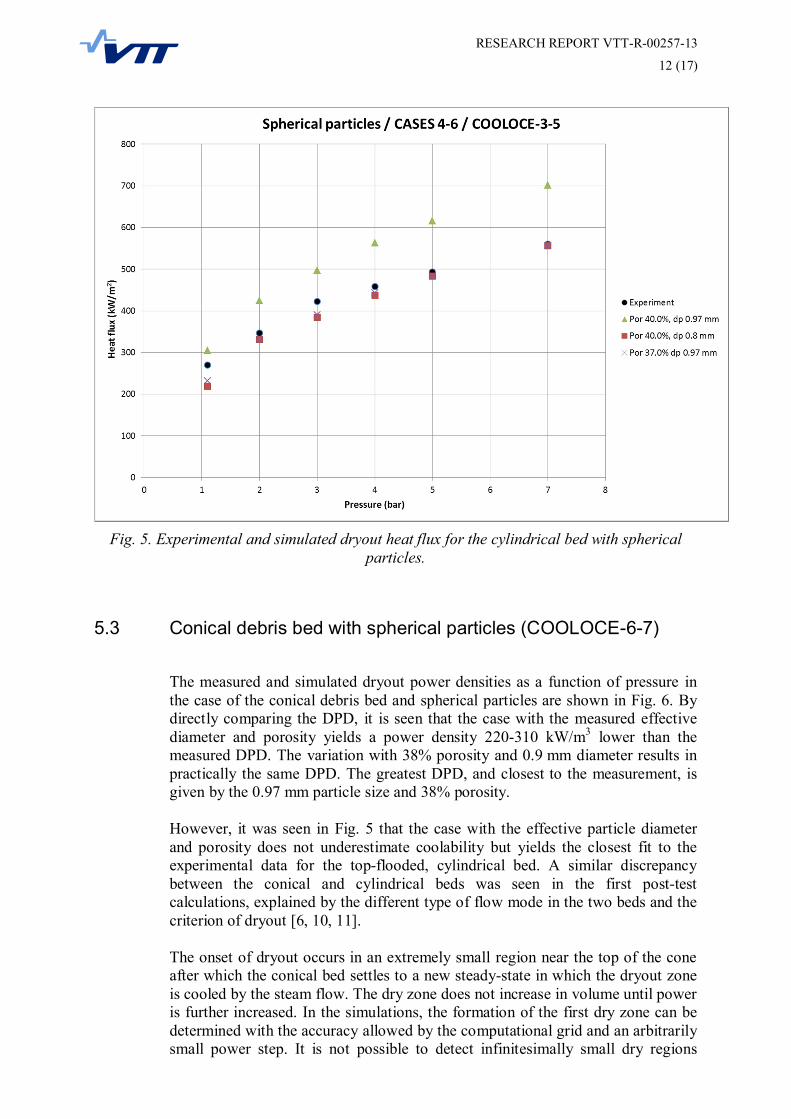
The measured and simulated dryout power densities as a function of pressure in the case of the conical debris bed and spherical particles are shown in Fig. 6. By directly comparing the DPD, it is seen that the case with the measured effective diameter and porosity yields a power density 220-310 kW/m3 lower than the measured DPD. The variation with 38% porosity and 0.9 mm diameter results in practically the same DPD. The greatest DPD, and closest to the measurement, is given by the 0.97 mm particle size and 38% porosity. However, it was seen in Fig. 5 that the case with the effective particle diameter and porosity does not underestimate coolability but yields the closest fit to the experimental data for the top-flooded, cylindrical bed. A similar discrepancy between the conical and cylindrical beds was seen in the first post-test calculations, explained by the different type of flow mode in the two beds and the criterion of dryout [6, 10, 11]. The onset of dryout occurs in an extremely small region near the top of the cone after which the conical bed settles to a new steady-state in which the dryout zone is cooled by the steam flow. The dry zone does not increase in volume until power is further increased. In the simulations, the formation of the first dry zone can be determined with the accuracy allowed by the computational grid and an arbitrarily small power step. It is not possible to detect infinitesimally small dry regions

RESEARCH REPORT VTT-R-00257-13
13 (17)
using the test facility; dryout zone volume has to increase at least as much to be captured by one of the thermocouples. Rather than adjusting the model parameters to fit the experimental DPD data at the critical power level (i.e. minimum power leading to dryout), it is more feasible to examine the dryout zone size and location in the simulations at different power levels and compare them to the experimental dryout power and location. Earlier investigations (not including the full pressure range) suggest a reasonable agreement between the experimental dryout conditions and the simulations run at the experimental power level, above the minimum dryout power [10, 11]. Pressure dependence shows a similar trend as the previous case of cylindrical bed with the spherical beads: it is only slightly different from the model predictions with lower DPD in the upper end of the pressure range.
Fig. 6. Experimental and simulated dryout power density for the conical bed with spherical
particles.
6 Discussion
The MEWA simulations show that a good prediction of DHF is obtained by using the separately measured effective particle diameter (and porosity) in case of the spherical particles. On the other hand, an equally good result is achieved by assuming a smaller porosity and a larger particle diameter (arithmetic mean of the particle size). The latter case may even be better representative of the COOLOCE test bed since its estimated porosity is 38-39.5 % which is slightly smaller than the

RESEARCH REPORT VTT-R-00257-13
14 (17)
40% porosity in the measurement of effective particle diameter with POMECO-FL. This means that the effective particle diameter should be increased to “compensate” the reduced porosity to yield an equal pressure loss as in the measurement with POMECO-FL. (The pressure loss fitted into Ergun’s equation does not distinguish between the contributions of particle diameter and porosity.) The porosity and particle diameter in both cases are within a realistic range, i.e. porosity is typical for a packed bed but greater than the minimum porosity of randomly packed spheres (~37%) and the diameter is within the particle size variation range. In the case of irregular particles, the experimental DHF tends to be lower than the simulated DHF with the exception of near-atmospheric pressure. The separately measured effective particle diameter and porosity do not produce as good results as in the case of spherical particles. Uncertainties related to porosity are a likely explanation. The maximum packing density of the gravel is greater than that of randomly packed spheres because the smallest particles can fill the pores between the larger particles, e.g. for soil gravel the minimum porosity is the order of 25%. In the experiments, the debris bed packing was intentionally left loose to avoid stratification and to simulate a bed formed by pouring of mixed-size particles. It is possible that the bed has shifted during the experiments, gradually creating a denser packing whose true porosity is unknown. (Note that a porosity shift of e.g. from 40% to 37% is so small that it would be difficult to note as a change of gravel surface in the test container). In contrast, the test bed with spherical particles was initially packed as dense as possible. At 7 bar pressure, the best agreement with the experimental result is given by the case with 0.65 mm effective diameter and 37% porosity. The “basic” case with 0.65 m diameter and 40.8% porosity notably overestimates the DHF. A somewhat better estimate is apparently given by the Hu & Theofanous model. However, in earlier studies no support has been found for this model to fit experimental data better than the Reed model. On the contrary, recent studies by Yakush et al. [22] suggest that the optimal values for the powers of relative permeability and passability (Eqs. 5-6) could be even lower than in the Reed model.
On its part, the same study confirms by methods of global sensitivity analysis that DHF is highly sensitive to the discussed physical model parameters – porosity and especially particle size. Uncertainty in these parameters can obscure other error sources to DHF. When investigating the uncertainty related to the effects of different test facilities and heating arrangements, the uncertainty of porosity and particle diameter should be minimized, e.g. by using particles as uniform and spherical as possible packed to the maximum packing density (minimum porosity).
6.1 Model limitations
In all the simulations, it is assumed that heating is homogenous in the debris bed (constant power density) as in an internally heated debris bed. The test bed heaters

RESEARCH REPORT VTT-R-00257-13
15 (17)
are not taken into account in the modelling and, when only the overall coolability is concerned, it is assumed that the test bed behaves similarly to a homogenously heated bed. More discussion of the possible effects of the heating arrangement is presented in earlier reporting of the experiments and simulations [5, 10]. The experimental work to distinguish the possible effect of heating arrangements continues within the NKS DECOSE project jointly performed by VTT and KTH. Conclusions will be presented when enough experimental data for comparison of the three test facilities, POMECO-HT, COOLOCE and STYX, is available. It should be noted that the applied models are designed to solve flows in porous media. The free-flow volume (pool) is not modelled in a detailed, mechanistic manner which would require the solution of the full momentum equation with the time derivatives and wall friction now omitted from Eqs.1-2. Instead, the pool is treated similarly as the debris bed region but with a large porosity and particle diameter to provide “background friction”. Heat losses are also not taken into account, the wall boundaries are adiabatic.
7 Conclusions
Simulations aiming to model debris bed coolability have been assessed against the COOLOCE experiments. Two different particle materials were used as debris simulant in the experiments, irregular gravel in COOLOCE-8 and spherical ceramic beads in COOLOCE-7 and in all the preceding test runs. For both materials, the effective particle diameter used as input in the simulations has been estimated by separate single-phase pressure loss measurements. Parameter variations have been done for particle size and porosity. In addition, the simulation results are compared to the to the dryout heat flux measured in the older STYX experiments with the same gravel material. It was found that with the measured effective particle diameter and porosity, the simulation models predict dryout heat flux (DHF) with a relatively good accuracy in the case of spherical particles. In the case of irregular gravel, there is more discrepancy between the simulations and experiments, especially for higher pressure levels. The uncertainty in the results is greater in the case of gravel because the variation range of true bed porosity and particle diameter are larger. It appears to be well possible that the gravel bed has been shifted towards denser packing during the experiments. Comparison of the DHFs measured with two test facilities, STYX and COOLOCE, shows that the measured DHF is smaller in COOLOCE. However, it is not certain whether the difference is specific to the test facility or process, or the test bed has been more densely packed in COOLOCE.

RESEARCH REPORT VTT-R-00257-13
16 (17)
References
1. Takasuo, E., Kinnunen, T. Pankakoski P.H., Holmström, S. Description of the COOLOCE test facility – Conical particle bed. Research Report VTT-R-08956-10. Espoo, 2010. 18 p.
2. Takasuo, E., Kinnunen, T. Pankakoski P.H., Holmström, S. The COOLOCE-2 coolability experiment with a conical particle bed. Research Report VTT-R- 02427-11. Espoo, 2011. 15 p.
3. Takasuo, E., Kinnunen, T. Pankakoski P.H., Holmström, S. The COOLOCE particle bed coolability experiments with a cylindrical geometry: Test series 3–5. Research Report VTT-R-07099-11. Espoo, 2011. 27 p.
4. Takasuo, E., Kinnunen, T. Pankakoski P.H., Holmström, S. The COOLOCE particle bed coolability experiments with a conical geometry: Test series 6–7. Research Report VTT-R-07097-11. Espoo, 2011. 26 p.
5. Takasuo, E., Kinnunen, T., Holmström, S. COOLOCE particle bed coolability experiments with a cylindrical test bed: Test series 8–9. Research Report VTT-R-07224-12. Espoo, 2012. 44 p.
6. Takasuo, E., Holmström, S., Kinnunen, T., Pankakoski, P.H. The COOLOCE experiments investigating the dryout power in debris beds of heap-like and cylindrical geometries. Nuclear Engineering and Design 250 (2012), p. 687-700.
7. Bürger, M., Buck, M., Schmidt, W., Widmann, W. Validation and application of the WABE code: Investigations of constitutive laws and 2D effects on debris coolability. Nuclear Engineering and Design 236 (2006), p. 2164–2188.
8. Takasuo, E., Hovi, V., Ilvonen, M. PORFLO modelling of the coolability of porous particle beds. Research Report VTT-R-09376-10. Espoo, 2011. 41 p.
9. Takasuo, E., Holmström, S., Kinnunen, T., Pankakoski, P.H., Hosio, E., Lindholm, I. The effect of lateral flooding on the coolability of irregular core debris beds. Nuclear Engineering and Design 241 (2011), p. 1196–1205.
10. Takasuo, E., Hovi, V. 2012. MEWA and PORFLO calculations of the COOLOCE experiments. Research Report VTT-R-00967-12. Espoo, 2012. 36 p.
11. Takasuo, E., Hovi, V. Ilvonen, M., Holmström, S. 2012. Modeling of Dryout in Core Debris Beds of Conical and Cylindrical Geometries. Proceedings of the 20th International Conference on Nuclear Engineering, Anaheim, California, USA, July 30 – August 3, 2012. ICONE20-54159.

RESEARCH REPORT VTT-R-00257-13
17 (17)
12. Holmström, S., Pankakoski, P.H. STYX dry-out heat flux testing with different test bed thicknesses. Part II: homogenous and stratified tests with 600 mm and 400 mm test beds. VTT Industrial Systems, Research Report BTUO74-051381. Espoo, 2005.
13. Lindholm, I., Holmström. S., Miettinen, J., Lestinen, V., Hyvärinen, J., Pankakoski, P., Sjövall, H. 2006. Dryout Heat Flux Experiments with Deep Heterogenous Particle Bed. Nuclear Engineering and Design 236 (2006), p. 2060-2074.
14. Ma, W. 2012. Study of irregular multi-sized particles bed using POMECO-FL facility (Draft). E-mail communications from Weimin Ma, December 4, 2012.
15. Ergun, S. 1952. Fluid flow through packed columns. Chemical Engineering Progress 48, p. 89-94.
16. Lipinski, R.J. 1982. A Model for Boiling and Dryout in Particle Beds. Sandia National Laboratories, SAND 82-9765, NUREG/CR-2646.
17. Reed, A.W. 1982. The effect of channeling on the dryout of heated particulate beds immersed in a liquid pool. PhD. Thesis. Massachusetts Institute of Technology, Cambridge.
18. Hu, K., Theofanous, T.G. 1991. On the measurement of dryout in volumetrically heated coarse particle beds. International Journal of Multiphase Flow 17, No. 4, 519-532.
19. Tung, V.X. and Dhir, V.K., 1988. A Hydrodynamic Model for Two-Phase Flow through Porous Media. International Journal of Multiphase Flow 14 No. 1, 47-65.
20. Schmidt, W., 2004. Influence of Multidimensionality and Interfacial Friction on the Coolability of Fragmented Corium. Doctoral Thesis, Institut für Kernenergetik und Energiesysteme, Universität Stuttgart, 2004.
21. Takasuo, E. 2009. Numerical analysis of the STYX particle bed coolability tests with different bed thicknesses and downcomers. VTT Research Report VTT-R-06318-09. Espoo, 2009.
22. Yakush, S.E., Kudinov, P., Lubchenko, N.T. 2013. Coolability of heat releasing debris bed. Part 1: Sensitivity analysis and model calibration. Annals of Nuclear Energy 52 (2013), 59-71.

RESEARCH REPORT VTT-R-00257-13
A
APPENDIX A. Dryout heat flux and power density in the experiments and simulations
Units: Heat flux kW/m2, power density kW/m3, pressure bar (absolute)
COOLOCE-8 Experimental HF Simulated HF Pressure CASE1 CASE1b CASE2 CASE3 1.1 177.93 177.93 171.09 123.18 191.62 2.0 235.42 260.05 239.52 184.78 280.58 3.0 262.79 314.80 287.43 218.99 335.33 4.0 290.17 362.71 328.49 253.21 383.24 5.0 318.91 396.92 355.86 280.58 424.30 7.0 342.18 465.36 410.61 328.49 485.89
COOLOCE-3-5 Experimental HF Simulated HF Pressure CASE4 CASE5 CASE6 1.1 270.28 304.73 231.86 218.61 2.0 347.13 423.97 331.23 331.23 3.0 422.65 496.84 390.85 384.22 4.0 458.42 563.09 443.85 437.22 5.0 492.87 616.08 483.59 483.59 7.0 560.44 702.20 556.46 556.46
COOLOCE-6-7 Experimental DPD Simulated DPD Pressure CASE7 CASE8 CASE9 1.1 1471.30 1160.06 1160.06 1301.53 1.6 1799.51 1527.89 1527.89 1697.65 2.0 2037.18 1782.54 1754.24 1952.30 3.0 2427.64 2206.95 2206.95 2376.71
STYX-8 Experimental HF Pressure 1.0 213.62 2.0 273.04 4.0 328.21 5.0 356.51 7.0 428.66