simulation study of soil organic matter dynamics as affected by land use and agricultural practices...
TRANSCRIPT

Simulation study of soil organic matter dynamics as affected by land use andagricultural practices in semiarid Cordoba, Argentina
H.P. Apezteguıa a,*, R.C. Izaurralde b, R. Sereno a
a Grupo de Gestion Ambiental de Suelo y Agua, Facultad de Ciencias Agropecuarias, Universidad Nacional de Cordoba, Av. Valparaıso s/n, Ciudad Universitaria, CC 509,
5000, Cordoba, Argentinab Joint Global Change Research Institute (Pacific Northwest National Laboratory and University of Maryland), 8400 Baltimore Avenue, Suite 201, College Park, MD 20740-2496, USA
Soil & Tillage Research 102 (2009) 101–108
A R T I C L E I N F O
Article history:
Received 3 December 2007
Received in revised form 1 July 2008
Accepted 27 July 2008
Keywords:
Environmental Policy Integrated Climate
Climate change
Soil carbon
No till
Corn
Soybean
A B S T R A C T
Soil carbon sequestration has been recognized as an effective, low-cost technology to mitigate climate
change. Simulation models, alone or in combination with soil sampling and other techniques, can help
monitor changes in soil carbon levels as affected by climate, soil, and management conditions. The
objective of this paper is to test the ability of the Environmental Policy Integrated Climate (EPIC) model to
simulate total organic carbon (TOC) dynamics in soils of the central region of the Province of Cordoba
(Argentina) and evaluate, through modeling, the capacity of Cordoba’s agricultural soils to act as sources
or sinks of atmospheric CO2. We tested EPIC against measurements made in a spatially distributed 40-
year chronosequence of a temperate shrubland forest transitioning to agricultural use with conventional
practices and in two long-term tillage (moldboard plow, chisel plow, and no till) and crop rotation (maize
[Zea mays L.]–soybean [Glycine max L. Merr.]) field studies. Overall, the EPIC model demonstrated a good
capability for simulating TOC dynamics. In the chronosequence, the TOC lost during 40 years of
cultivation after deforestation was calculated at 38.4 Mg ha�1 while that simulated by the model was
44.1 Mg ha�1. These values represented losses of 44% and 45% of the original TOC content, respectively. In
the two long-term field experiments, the TOC simulated over the entire depth was close to the observed
values and reflected the trends of the various treatments. For the most common conditions of croplands
in Cordoba, crops grown in rotation with conservation tillage, particularly no till, would make soils act as
sinks of atmospheric CO2.
� 2008 Elsevier B.V. All rights reserved.
Contents lists available at ScienceDirect
Soil & Tillage Research
journa l homepage: www.e lsev ier .com/ locate /s t i l l
1. Introduction
Soil organic matter (SOM) plays a key role in ensuringagroecosystem productivity and the long-term conservation ofsoil resources. Adequate levels of soil organic matter areessential to maintain or improve chemical fertility, soil porosity,infiltration capacity, moisture retention, and resistance to waterand wind erosion. On a global scale, SOM functions as a largerepository of C (�1500 Pg C) and, thus, it is a key component ofthe modern C cycle. Changes in land use and management canhave profound effects on both the quantity and dynamics ofSOM, which in practice is measured as soil total organic carbon(TOC). These management impacts on TOC have been so large ona global scale that they contributed to increase the concentrationof atmospheric CO2 (Cole et al., 1996; Allmaras et al., 2000). Alarge-scale implementation of C sequestration practices offers
* Corresponding author. Tel.: +54 351 4334105; fax: +54 351 4334103.
E-mail address: [email protected] (H.P. Apezteguıa).
0167-1987/$ – see front matter � 2008 Elsevier B.V. All rights reserved.
doi:10.1016/j.still.2008.07.016
the potential to mitigate the increase in atmospheric CO2 andthus attenuate the effects of global warming (Rosell andGalantini, 1998; Izaurralde et al., 2001; McCarl and Schneider,2001).
It is well established that converting natural forests orgrasslands into agricultural fields generally leads to a decline inTOC (Ellert and Gregorich, 1996; Apezteguıa, 2005) and thatdifferent tillage systems and crop rotations can increase ordecrease it (Lal et al., 1998; Post and Kwon, 2000; Apezteguıaand Sereno, 2002). The final impact of management on TOC cannotbe easily predicted since many environmental variables (Trumboreet al., 1996; Huggins et al., 1998) and initial conditions (Nyborget al., 1995) can influence the trajectory of TOC.
The study of the effects of land use and management practiceson TOC dynamics can be greatly enhanced by the use of simulationmodels (McGill, 1996; Parton et al., 1995; Molina and Smith, 1998;Izaurralde et al., 2006). Simulation models could be useful forestimating the influence of management practices on TOC stocksand extrapolating these changes over large regions (Izaurraldeet al., 2001). This latter point is important because field

H.P. Apezteguıa et al. / Soil & Tillage Research 102 (2009) 101–108102
measurements of soil TOC changes are relatively expensive tomake and time consuming.
The Environmental Policy Integrated Climate (EPIC) modelwas originally designed to quantify the effects of erosion on soilproductivity (Williams et al., 1984; Williams, 1990). Numerousimprovements and tests conducted since its first versionreleased in 1984 have transformed it into a model capable ofdescribing many agroecosystem processes including cropgrowth, water and nutrient balances, erosion, CO2 fertilizationeffects, and pesticide fate (Williams, 1995). In one of theseimprovements, concepts and equations from the Century model(Parton and Rassmussen, 1994; Vitousek et al., 1994) were usedto build a sub model describing C and N transformations andflows in as many as 15 soil layers (Izaurralde et al., 2006). TheSOM sub model in EPIC includes an algorithm to calculatechanges in soil bulk density (Db) as affected by changes in SOMcontent.
While the goodness-of-fit of EPIC has been tested at severalsites in North America (Causarano et al., 2007; He et al., 2006;Izaurralde et al., 2006, 2007), it has never been tested against fielddata in South America. Thus, the objectives of this paper are to (a)test the performance of the EPIC model in simulating plantproductivity and TOC dynamics of Haplustolls of the central regionof the Province of Cordoba (Argentina) and (b) evaluate, throughmodeling, the capacity of these soils to act as source or sink ofatmospheric CO2.
2. Materials and methods
2.1. Description of the EPIC model
The EPIC is a daily-time step, small watershed scale model thatwas originally developed to evaluate the effects of soil erosion andagricultural productivity (Williams et al., 1984; Williams, 1990,1995). Over time, it developed into a comprehensive agroecosys-tem model (Williams, 1995) capable of simulating a wide array ofagricultural management as well as non-agricultural land usessuch as tree plantations, grasslands, and biomass crops (Gassmanet al., 2005). Recent model improvements introduced in EPICinclude new biogeochemical modules to simulate C and Ndynamics (Izaurralde et al., 2006) and microbial denitrification(McGill et al., 2004).
In order to simulate crop growth, EPIC utilizes the concept ofradiation-use efficiency whereby a fraction of the daily photo-synthetically active radiation is intercepted by the plant canopyand converted into plant biomass. Daily gains in plant biomass areaffected by vapor pressure deficits and atmospheric CO2
concentration. Stress factors for water, temperature, nutrients(N, P, and K), aeration, and soil strength are calculated daily andthe most severe is used to reduce potential plant growth anddevelopment. Weather information can be input into the modeleither from daily records or estimated from precipitation, airtemperature, solar radiation, wind, and relative humidity para-meters. A minimum set of soil properties (e.g., soil layer depth,
Table 1Average values of weather variables at INTA Manfredi Experimental Station (Province
January February March April May June
Maximum T (8C) 30.2 28.5 27.0 23.7 20.5 17.0
Minimum T (8C) 17.6 15.9 14.6 11.2 7.3 4.1
Precipitation (mm) 127 109 84 46 23 6
Wind speed (m s�1) 1.8 1.8 1.8 2.0 2.0 2.0
Radiation (MJ m�2) 22.6 20.0 16.4 12.2 9.4 7.9
Relative humidity (fract.) 0.72 0.74 0.76 0.74 0.74 0.75
texture, bulk density, and C concentration) are required to runEPIC.
Three major soil compartments of different turnover times areused in EPIC to distribute C and N: microbial biomass, slow humusand passive humus (Izaurralde et al., 2006). Plant residues C, root C,and manure C added to soil are split into two litter compartments(metabolic and structural) based on lignin and N content. Losses ofC and N from the soil occur via leaching (soluble C, NO3
�), gaseouslosses (CO2, N2O + N2), and erosion (particulate and soluble organicC, particulate N and NO3
�).Changes in Db in EPIC are simulated as a function of tillage,
precipitation, and SOM content (Williams, 1995; Izaurraldeet al., 2006). Soil bulk density decreases as a proportion of themixing efficiency of tillage operations performed to applynutrients, control weeds, or incorporate crop residues (Williams,1995). Soil bulk density of the plow layer also changes betweenrainfalls due to soil settling caused by water infiltration(Williams, 1995). Finally, all soil layers change their Db annuallydue to changes in SOM content according to the Adams equation(Adams, 1973) as described in Izaurralde et al. (2006). Increasesin SOM reduce Db and vice versa. EPIC makes annualadjustments of soil layer depth in order to preserve the balanceof soil mass and SOC.
2.2. Climate and soils
The central part of the province of Cordoba (318S, 638W) islocated in the semiarid region of Argentina (Fig. 1). Spring andsummer temperatures are high. Average temperature in January is23.2 8C, with maximum values reaching sometimes >40 8C.Seventy percent of the 760 mm of annual precipitation occursbetween October and March. The hydrologic balance determinedby the Thornthwaite method (1955) indicates that there is a waterdeficit in every month of the year except during March(Casagrande and Vergara, 1996). The average values of weathervariables at INTA Manfredi Experiment Station during 1983–1999are presented in Table 1.
The soils of the region developed over æolian sedimentscalled the ‘‘Pampean loess’’. The soils are classified as TypicHaplustolls and are generally silt loam in texture. Theapplication of non-conserving agricultural practices, in combi-nation with topographic and climatic factors, has led to the wideoccurrence of water and wind erosion. However, the sites wherethese studies were conducted reveal little if any evidence of soilerosion. Selected characteristics of two Typic Haplustollsdescribed in the chronosequence (series Piquillın) and in thelong-term field trials (series Oncativo) at INTA ManfrediExperiment Station (Province of Cordoba, Argentina) arepresented in Table 2.
2.3. Native vegetation
The natural vegetation is a temperate shrubland forestknown as the ‘‘Espinal’’ ecoregion. This forest has three strata:
of Cordoba, Argentina) during 1983–1999
July August September October November December Annual
16.6 19.4 21.3 25.1 27.6 29.7 23.9
2.5 3.8 6.6 11.0 14.0 17.0 10.5
14 13 33 62 95 147 759
2.3 2.6 2.7 2.7 2.5 2.2 2.2
8.9 11.8 14.4 17.6 20.6 22.4 15.3
0.72 0.68 0.66 0.67 0.70 0.71 0.72

Fig. 1. Geographic distribution of silt loam Haplustolls in the five counties of the central region (lower right) of the province of Cordoba (lower left) in the Republic of Argentina
(upper left). The experimental sites are marked in the lower right map: (1) chronosequence, and (2) INTA Manfredi Experiment Station.
H.P. Apezteguıa et al. / Soil & Tillage Research 102 (2009) 101–108 103
the upper stratum reaches heights of 6–8 m and is dominatedby Prosopis spp., Aspidosperma quebracho blanco and Celtis
spp. The middle stratum (1–3 m) is dominated by shrubssuch as Acacia caven, Celtis spp., and Senecio spp. among otherspecies. The lower vegetation stratum is composed mainly ofherbaceous species such as Stipa spp., Chloris spp., Cyperus spp.,Setaria spp., Cenchrus spp., Plantago spp., Dichondra spp., Oxalis
spp., and Eragrostis spp. Most of the land in this region hasbeen cleared of its native vegetation and converted toagricultural use.
Table 2Selected soil properties from modal profiles in the chronosequence (series Piquillın)
and in the long-term field trials (series Oncativo) at INTA Manfredi Experiment
Station (Province of Cordoba, Argentina)
Soil layer properties Soil horizon
A1 B Ck
Series Piquillın (Typic Haplustoll)
Depth (cm) 0–27 27–63 >63
Total organic carbon (g kg�1) 12.6 5.0 2.4
Total nitrogen (g kg�1) 1.0 0.9 –
Clay (g kg�1) 183 188 142
Silt (g kg�1) 643 657 711
Sand (g kg�1) 174 155 147
pH (1:2.5 soil:water) 7.3 7.1 8.3
Cation exchange capacity (cmol(+) kg�1) 18.2 18.6 –
Sum of bases (cmol(+) kg�1) 16.3 18.5 –
Series Oncativo (Typic Haplustoll)
Depth (cm) 0–23 25–53 >53
Total organic carbon (g kg�1) 11.8 5.6 2.3
Total nitrogen (g kg�1) 1.2 0.9 –
Clay (g kg�1) 167 122 102
Silt (g kg�1) 686 711 719
Sand (g kg�1) 147 167 179
pH (1:2.5 soil:water) 6.4 7.1 8.3
Cation exchange capacity (cmol(+) kg�1) 15.6 14.2 –
Sum of bases (cmol(+) kg�1) 13.3 13.7 –
2.4. Description of field studies
2.4.1. Native vegetation-farm chronosequence
A field under natural vegetation and several others that hadbeen under agricultural use (conventional tillage) during 1–40years were selected for this study (Apezteguıa, 2005). These fieldsare located about 40 km north of the INTA Manfredi ExperimentStation and contain soils classified as Typic Haplustolls. For thepurpose of this study, these fields were considered to constitute aspatially distributed chronosequence.
2.4.2. Tillage and crop rotation studies
Two field studies, one on tillage and the other on crop rotations,were initiated in 1983 at the INTA (Instituto National de TecnologıaAgropecuaria) Manfredi Experimental Station located approxi-mately 40 km to the southeast of the city of Cordoba, Argentina.The tillage experiment consists in growing maize (Zea mays L.) andsoybean (Glycine max L. Merr.) in rotation under three tillagetreatments: no tillage (NT) (a minimum tillage system waspracticed until 1995), moldboard plow tillage (MP), and chiseltillage (CT) (Nunez Vazquez et al., 1996). The rotation experimentconsists of the following crop sequences under reduced tillage:soybean monoculture (Sy), maize monoculture (Co), maize–soybean rotation (C/S) and soybean–maize rotation (S/C). Until1995, grain sorghum (Sorghum bicolor L. Moench) was growninstead of maize. Both experiments were designed in randomizedblocks with four replications.
2.5. Sampling scheme and laboratory analyses
In July 1999, composite soil samples at various depths (0–10,10–20, 20–30, and 30–40 cm) were taken from all replications andphases of the tillage and rotation experiments at the INTA ManfrediExperiment Station and from the chronosequence fields. Totalorganic carbon was determined on all samples by the drycombustion method. To guarantee absence of inorganic carbonfrom the soil was performed a test with HCl (Nelson and Sommers,

Fig. 2. Simulated and observed yields of (a) all crops and years and (b) soybean in a
corn–soybean rotation under moldboard plow tillage. Simulated soybean averaged
2.4 Mg ha�1 while those observed averaged 2.2 Mg ha�1.
H.P. Apezteguıa et al. / Soil & Tillage Research 102 (2009) 101–108104
1996). Concentration values of TOC were expressed as mass of TOCusing Db values determined by the soil core method.
2.6. Input datasets and model initialization
Currently, EPIC lacks the plant parameters to simulate thegrowth and development of this temperate shrubland forest. Thus,we assumed that at the time of forest conversion to agriculturaluse, the soils were approximately at steady state and initialized thefractions of the three soil C compartments as follow: microbial C(0.05), slow C (0.45), and passive C (0.5). The total soil organic Cpresent at the beginning of the chronosequence (time 0) was43.6 Mg C ha�1 in the top 10 cm soil depth and 85.2 Mg C ha�1 inthe top 40 cm soil depth.
Daily weather (solar radiation, maximum and minimumtemperature, precipitation, wind speed, and relative humidity)during the 40-year simulation period was simulated using weatherparameters developed from 20 years (1980–1999) of meteorolo-gical data collected at the INTA Manfredi Experiment Station(Table 1). The agricultural management simulated during the 40-year period (assumed to correspond to 1941–1981) consisted of 3years of watermelon (Citrullus lanatus (Thunb.) Matsum andNakai), 6 years of continuous maize (Z. mays L.), 1 year of oat (Avena
sativa L.) and sweet clover (Melilotus alba Med.), 4 years of grainsorghum (S. bicolor L. [Moench]), 6 years of maize, 1 year of sweetclover, 5 years of sorghum, 4 years of soybean (G. max L. [Merr.]),and 10 years of a maize–soybean rotation.
In the EPIC model, the lignin content of the residues is animportant variable that together with N content controls the splitof residue C and residue N into the metabolic and structural litterfractions (Izaurralde et al., 2006). Lignin content values of soybean(0.11 kg kg�1), maize (0.075 kg kg�1) and grain sorghum(0.071 kg kg�1) residues were taken from Buchanan and King(1993) and Powell et al. (1991).
Tillage practices were assumed to be conventional andconsisted of moldboard plow followed by offset disk, fieldcultivators and spike harrows. Weed control on row crops wasachieved with row cultivators. This history of land use andmanagement was reconstructed based on interviews with localfarmers and interpretation of aerial photographs.
Input data forthe INTAManfrediExperimentalStation simulationruns (e.g. crop sequences, cultural practices) were obtained from thetwo tillage studies described in the previous section (Apezteguıa,2005). Historical crop yields and management information wereobtained from the INTA Manfredi Experiment Station.
Soil profile data – including soil C data from the top 20-cm soildepth – were used to initialize the model runs (Table 2). The TOCcontent of the modal profile of the soil series to a depth of 60 cmwas used to complete the soil inputs. Since the initial value of Db
was not available, we assumed this value to be equal to that ofmoldboard plow tillage plots obtained during the July 1999 soilsampling. A soil characterization was performed at each of thechronosequence sites. All the soils have a Ck horizon (free CaCO3).Samples from profiles having the Ck horizon between 0.5 and0.85 m depth were included in the analysis. The initialization of thesoil C compartments was obtained from the last year of thechronosequence simulation as follows: microbial C (0.01), slow C(0.17), and passive C (0.82). The 17-year simulations were runreading the daily weather data collected at the INTA ManfrediExperiment Station during 1983–1999.
2.7. Statistical analyses
Simple correlation coefficient (r) and determination coefficients(R2) analysis was performed to verify the degree of association
between observed and simulated values (Smith et al., 1996). Thepercent error was calculated as follow: (simulated � observed) �100/observed (Smith et al., 1996).
3. Results and discussion
3.1. Crop yield simulations
The first step to verify the performance of the model was tocompare simulated vs. observed crop yields (Fig. 2). This is animportant verification step because it represents the inputs of Cinto the soil system. Fig. 2a shows the relationship betweensimulated and observed yields under different tillage systems.While the simulated and observed yields are correlated, it isobserved that the predicted yields for sorghum/maize under CT orNT are generally lower than the observed yields. Fig. 2b shows theestimated and observed yields of soybean, in the maize/soybeanrotation with MP. Notably, the yield trend (year-to-year varia-bility) was adequately simulated by EPIC. The simulated averageyields were very close to the observed with an error in estimationof less than 10%. However, not all simulations were able toadequately reproduce the observed data. For example, the r
coefficient varied from 0.84 (p < 0.05) to 0.56 (p < 0.05) whilethere was no correlation (r = �0.23, ns) between simulated andobserved yields of grain sorghum and maize under NT. Theperformance of the model was better for soybean than for the grainsorghum and maize crops, and was good for MP, satisfactory for CTand poor for NT. In all cases, simulated yields of grain sorghum andmaize were lower than the observed yields. Other researchers havereported similar or even better performance of EPIC for simulatingcrop yields recorded in North American long-term experiments.Izaurralde et al. (2006) reported an r = 0.84 for data from Breton,Alberta; He et al. (2006) reported r = 0.98 for data from Arlington,Wisconsin; and Causarano et al. (2007) reported r = 0.94 for datafrom Shorter, Alabama.

H.P. Apezteguıa et al. / Soil & Tillage Research 102 (2009) 101–108 105
3.2. Simulation of Db
Soil bulk density is a master soil property affected by andaffecting many soil properties and processes (Lal and Kimble,2001). One key property highly correlated with Db is SOM content.As discussed in Section 2.1, EPIC simulates Db as a function of theSOM content (Izaurralde et al., 2006) based on the equationproposed by Adams (1973). Fig. 3 shows the temporal evolution ofDb after the clearing of the native forest (time 0). The observedvalues are greater than the simulated ones, especially during the40th year of the simulation. The time after clearing of thismeasurement point has some uncertainty. The time was set at 40years through an interpretation of aerial photographs andtopographic charts; however, the difference between observedand estimates of TOC remains even if this point were to be locatedin between 50 and 70 years.
A comparison of the influence of TOC on the Db in thechronosequence study is shown in Fig. 4. We can observe a greaterinfluence of TOC on Db in the observed values than in the simulatedvalues.
Fig. 3. Simulated and observed values of bulk density (Db) in the chronosequence.
Fig. 4. Bulk density (Db) vs. TOC in the chronosequence: (a) observed and (b)
simulated values.
Fig. 5. Simulated and observed (a) bulk density and (b) total organic carbon values
under no tillage, and moldboard plow tillage.
Accurate simulation of Db is paramount for accurate estimationof TOC sequestration amounts and rates. While it is recognized thaterrors in the simulation of Db may lead to errors in the estimationof SOC sequestration rates, He et al. (2006) demonstrated that EPICsimulations of TOC and Db dynamics were able to reproduce fairlyaccurately the changes in TOC sequestration rates caused by long-term N fertilization in a 25-year experiment with continuousmaize in Arlington, WI.
In order to simulate the tillage-rotation experiment, the modelwas initialized with the Db of the MP treatment (Fig. 5) and it can beobserved that Db remains unchanged over all the simulationperiods, clearly because TOC does not change significantly.However, the observed Db increases in the NT and CT treatments,likely reflect the influence of vehicle traffic over the plots. Table 3shows the regression parameters of the observed values havingsimulated values like independent variable and reflect the degreeof accuracy for all the treatments.
3.3. Simulation of TOC in the chronosequence fields
After forest clearing, TOC content decreased sharply and theestimates produced by the model reflected this tendency (Fig. 6).Considering only the surface layer (0–10 cm), the model over-estimates the TOC content (Fig. 6a), but considering the 0–20 and0–40 cm the simulation results agree better with the observations.In all cases the correlation coefficients (r) are high and significant(0.95, p < 0.01; 0.90, p < 0.01; and 0.87, p < 0.01). While it isaccepted that most of the changes in TOC occur in the top 15–20 cm soil depth, the results of this simulation study demonstratethe ability of the EPIC model in capturing TOC processes anddynamics to 40-cm soil depth.
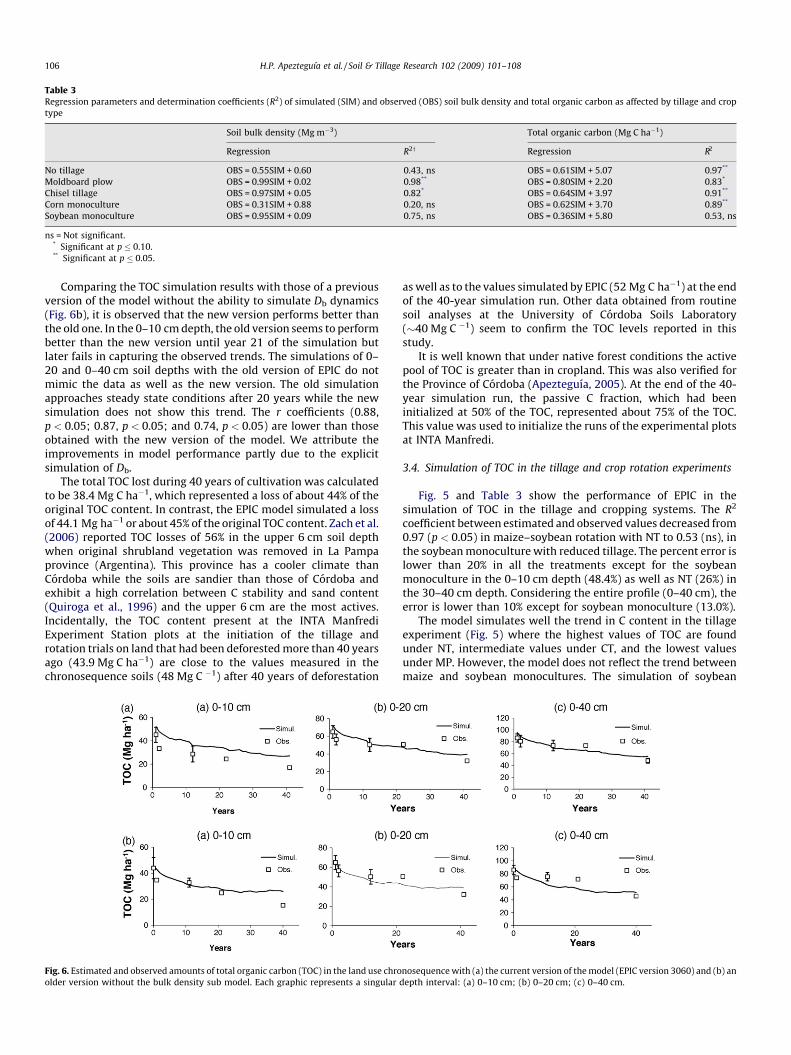
Table 3Regression parameters and determination coefficients (R2) of simulated (SIM) and observed (OBS) soil bulk density and total organic carbon as affected by tillage and crop
type
Soil bulk density (Mg m�3) Total organic carbon (Mg C ha�1)
Regression R2y Regression R2
No tillage OBS = 0.55SIM + 0.60 0.43, ns OBS = 0.61SIM + 5.07 0.97**
Moldboard plow OBS = 0.99SIM + 0.02 0.98** OBS = 0.80SIM + 2.20 0.83*
Chisel tillage OBS = 0.97SIM + 0.05 0.82* OBS = 0.64SIM + 3.97 0.91**
Corn monoculture OBS = 0.31SIM + 0.88 0.20, ns OBS = 0.62SIM + 3.70 0.89**
Soybean monoculture OBS = 0.95SIM + 0.09 0.75, ns OBS = 0.36SIM + 5.80 0.53, ns
ns = Not significant.* Significant at p � 0.10.** Significant at p � 0.05.
H.P. Apezteguıa et al. / Soil & Tillage Research 102 (2009) 101–108106
Comparing the TOC simulation results with those of a previousversion of the model without the ability to simulate Db dynamics(Fig. 6b), it is observed that the new version performs better thanthe old one. In the 0–10 cm depth, the old version seems to performbetter than the new version until year 21 of the simulation butlater fails in capturing the observed trends. The simulations of 0–20 and 0–40 cm soil depths with the old version of EPIC do notmimic the data as well as the new version. The old simulationapproaches steady state conditions after 20 years while the newsimulation does not show this trend. The r coefficients (0.88,p < 0.05; 0.87, p < 0.05; and 0.74, p < 0.05) are lower than thoseobtained with the new version of the model. We attribute theimprovements in model performance partly due to the explicitsimulation of Db.
The total TOC lost during 40 years of cultivation was calculatedto be 38.4 Mg C ha�1, which represented a loss of about 44% of theoriginal TOC content. In contrast, the EPIC model simulated a lossof 44.1 Mg ha�1 or about 45% of the original TOC content. Zach et al.(2006) reported TOC losses of 56% in the upper 6 cm soil depthwhen original shrubland vegetation was removed in La Pampaprovince (Argentina). This province has a cooler climate thanCordoba while the soils are sandier than those of Cordoba andexhibit a high correlation between C stability and sand content(Quiroga et al., 1996) and the upper 6 cm are the most actives.Incidentally, the TOC content present at the INTA ManfrediExperiment Station plots at the initiation of the tillage androtation trials on land that had been deforested more than 40 yearsago (43.9 Mg C ha�1) are close to the values measured in thechronosequence soils (48 Mg C �1) after 40 years of deforestation
Fig. 6. Estimated and observed amounts of total organic carbon (TOC) in the land use chro
older version without the bulk density sub model. Each graphic represents a singular
as well as to the values simulated by EPIC (52 Mg C ha�1) at the endof the 40-year simulation run. Other data obtained from routinesoil analyses at the University of Cordoba Soils Laboratory(�40 Mg C �1) seem to confirm the TOC levels reported in thisstudy.
It is well known that under native forest conditions the activepool of TOC is greater than in cropland. This was also verified forthe Province of Cordoba (Apezteguıa, 2005). At the end of the 40-year simulation run, the passive C fraction, which had beeninitialized at 50% of the TOC, represented about 75% of the TOC.This value was used to initialize the runs of the experimental plotsat INTA Manfredi.
3.4. Simulation of TOC in the tillage and crop rotation experiments
Fig. 5 and Table 3 show the performance of EPIC in thesimulation of TOC in the tillage and cropping systems. The R2
coefficient between estimated and observed values decreased from0.97 (p < 0.05) in maize–soybean rotation with NT to 0.53 (ns), inthe soybean monoculture with reduced tillage. The percent error islower than 20% in all the treatments except for the soybeanmonoculture in the 0–10 cm depth (48.4%) as well as NT (26%) inthe 30–40 cm depth. Considering the entire profile (0–40 cm), theerror is lower than 10% except for soybean monoculture (13.0%).
The model simulates well the trend in C content in the tillageexperiment (Fig. 5) where the highest values of TOC are foundunder NT, intermediate values under CT, and the lowest valuesunder MP. However, the model does not reflect the trend betweenmaize and soybean monocultures. The simulation of soybean
nosequence with (a) the current version of the model (EPIC version 3060) and (b) an
depth interval: (a) 0–10 cm; (b) 0–20 cm; (c) 0–40 cm.

Fig. 8. Evolution of TOC in an Haplustoll in Cordoba, Argentina, when the native
vegetation (temperate shrubland forest) is changed to agricultural use under
traditional practices for 40 years and then followed by 17 years of a maize–soybean
rotation under three tillage systems (moldboard plow, chisel tillage, and no tillage).
H.P. Apezteguıa et al. / Soil & Tillage Research 102 (2009) 101–108 107
monoculture has greater TOC than the maize (sorghum)monoculture. We attribute these results to the inability of themodel to capture the yield trends of grain sorghum and maize aswell to the overestimation of the contribution of soybeanmonoculture to TOC.
Within the observed data there are greater differences in TOC intillage treatments than in the cropping systems treatments. Notillage produced the greatest observed values in both experiments.Thus, the experimental results demonstrate that in order toconserve or increase (sequester) TOC under the environmental andproduction conditions prevailing in the Province of Cordoba it ismore important to reduce soil disturbance than to considerdifferences in quality and quantity of crop residues. Thishypothesis is supported by previous work by Abril et al. (1995)who found that moldboard plow tillage induced an importantincrease of cellulolityc microorganisms leading to a rapidmineralization of C substrates and a loss of SOM. The EPIC modelsimulated this increase in biological activity, represented by theincrease of the emission of CO2 after tillage as can be observed inFig. 7. In related work, Apezteguıa and Sereno (2002) andApezteguıa (2005) found a statistically significant differencebetween measured values of TOC (0–40 cm) under NT and theother two treatments, but no difference between MP and CT. Themodel captured this trend.
3.5. Scaling up soil C losses and sequestration at regional levels
Fig. 8 shows the overall dynamics of TOC of Haplustolls in thesemiarid region of Cordoba, Argentina, when land under nativevegetation is converted to agricultural use under traditionalmanagement for several decades and then followed by theadoption or maintenance of alternative practices including NT.Upon the adoption of these alternative practices, it can be observedthat TOC content in the maize–soybean rotation increased underNT, decreased under MP, and remained unchanged under CT. Themodel was initialized with a value of 44.1 Mg ha�1 of C. Thus, NTsequestered 1.9 Mg C �1 during the 17-year simulation period, MPemitted 1.6 Mg C �1, and CT practically remained unchanged. The
Fig. 7. Simulated CO2 emissions from soil under moldboard plow and no tillage: (a)
during a humid period and (b) during a dry period.
difference between the additional C lost by MP and thatsequestered by NT is 3.5 Mg ha�1.
According to Gorgas and Tassile (2006), the Haplustolls onwhich these tests were conducted are representative of a largefarming region. In the Colon, Santa Marıa, Rıo Primero, RıoSegundo, y Tercero Arriba counties of the Province of Cordoba,there are �1,300,000 ha with silty loam Haplustolls (Fig. 1). Thesesoils are homogeneous in terms of their morphology as well astheir physical and chemical properties. The entire region has a longagriculture tradition and only �10% of the area remains as nativeforest. Thus, we estimate that the soil organic matter of about1,170,000 ha may have exhibited a similar dynamics compared tothe one measured and simulated in the chronosequence. Based onthe C emission simulated by EPIC (44.1 Mg C �1) during a 40-yearperiod, we estimate that this region may have been contributing tothe atmosphere �1.29 Tg C year�1 (1.10 Mg C �1 year�1) due toconversions of a temperate shrubland forest to agricultural use.Conversely, in these soils the adoption of sustainable practices likemaize–soybean rotation under NT can produce a capture of117,600 Mg C �1 year�1.
4. Conclusions
(a) T
he EPIC model adequately described plant productivity andsoil C dynamics of land use change and crop systemsexperiments of the Haplustolls of the central region of theprovince of Cordoba, Argentina.(b) A
s tested here, the EPIC model provided clear evidence ofwhether Haplustolls of central Cordoba behave as sources orsinks of atmospheric CO2. The model was able to mimic theobserved effect of land use change from forest to agriculture inreleasing CO2 from soil to the atmosphere. Conversely, the EPICmodel also captured the observed effect of soil C sequestrationunder conservation tillage (particularly NT) and crop rotationpractices.The results of this study give confidence for using EPIC tosimulate TOC dynamics and soil C sequestration at the regionalscale in other temperate regions of Argentina and South America.
Acknowledgements
The authors are grateful to agricultural producer Mr. AbelChialva for allowing us to sample his farm and for providinginformation on historical land use and management. We also thankIng. Agr. Pedro Salas and Geol. Edgar Lovera, from INTA (InstitutoNacional de Tecnologıa Agropecuaria) Manfredi ExperimentalStation, for their technical expertise. The project was supportedby CONICET (Argentina), Agencia Cordoba Ciencia (Cordoba,

H.P. Apezteguıa et al. / Soil & Tillage Research 102 (2009) 101–108108
Argentina), Secretarıa de Ciencia y Tecnologıa de la UniversidadNacional de Cordoba (Argentina), the Fulbright Commission, theUSDOE Consortium for Research on Enhanced Carbon Sequestra-tion in Terrestrial Ecosystems (CSiTE), and the USDA Consortiumfor Agricultural Soils Mitigation of Greenhouse Gases (CASMGS)research programs.
References
Abril, A., Caucas, V., Nunez Vazquez, F., 1995. Sistemas de labranza y dinamicamicrobiana del suelo en la region central de la provincia de Cordoba (Argentina).Ciencia Suelo 13, 104–106.
Adams, W.A., 1973. The effect of organic matter on the bulk and true densities ofuncultivated podzolic soils. J. Soil Sci. 24, 10–17.
Allmaras, R.R., Schomberg, H.H., Douglas Jr., C.L., Dao, T.H., 2000. Soil organic carbonsequestration potential of adopting conservation tillage in U.S. croplands. J. SoilWater Conserv. 55, 365–373.
Apezteguıa, H.P., 2005. Dinamica de la materia organica de los suelos de la regionsemiarida central de Cordoba (Argentina). PhD thesis, Escuela para Graduados,Facultad de Ciencias Agropecuarias, Universidad Nacional de Cordoba.
Apezteguıa, H.P., Sereno, R., 2002. Influencia de los sistemas de labranza sobre lacantidad y calidad del carbono organico del suelo. Agricultura Tecnica 62, 418–426.
Buchanan, M., King, L.D., 1993. Carbon and phosphorus losses from decomposingcrop residues in no-till and conventional till agroecosystems. Agron. J. 85, 631–638.
Casagrande, G.A., Vergara, G.T., 1996. Caracterısticas climaticas de la region. In:Buschiazzo, D.E., Panigatti, J.L., Babinec, F.J. (Eds.), Labranzas en la RegionSemiarida Argentina, INTA Centro Regional La Pampa-San Luis y Secretarıade Agricultura Pesca y Alimentacion. pp. 11–17.
Causarano, H.J., Shaw, J.N., Franzluebbers, A.J., Reeves, D.W., Raper, R.L., Balkcom,K.S., Norfleet, M.L., Izaurralde, R.C., 2007. Simulating field-scale soil organiccarbon dynamics using EPIC. Soil Sci. Soc. Am. J. 71, 1174–1185.
Cole, V., Cerri, C., Minami, K., Mosier, A., Rosenberg, N., Sauerbeck, D., 1996.Agricultural options for mitigation of greenhouse gas emissions. In: Watson,R.T., Zinyowera, M.C., Moss, R.H. (Eds.), Climate Change 1995: Impacts, Adapta-tions, and Mitigation of Climate Change: Scientific-Technical Analyses, Con-tribution of Working Group II to the Second Assessment Report of theIntergovernmental Panel on Climate Change. Cambridge University Press, Cam-bridge and New York. pp. 744–771.
Ellert, B.H., Gregorich, E.G., 1996. Storage of carbon, nitrogen and phosphorus incultivated and adjacent forested soils of Ontario. Soil Sci. 161, 587–603.
Gassman, P.W., Williams, J.R., Benson, V.W., Izaurralde, R.C., Hauck, L.M., Jones, C.A.,Atwood, J.D., Kiniry, J.R., Flowers, J.D., 2005. Historical development and appli-cations of the EPIC and APEX models. Working Paper 05-WP 397, Center forAgricultural and Rural Development, Iowa State University, Ames, IA (availableonline at www.card.iastate.edu; June 24, 2007).
Gorgas, J.A., Tassile, J.L. (Eds.), 2006. Recursos Naturales de la Provincia de Cordoba.Los Suelos, Nivel de Reconocimiento. Agencia Cordoba Ambiente and EEA INTAManfredi.
He, X., Izaurralde, R.C., Vanotti, M.B., Williams, J.R., Thomson, A.M., 2006. Simulatinglong-term crop productivity and soil organic carbon dynamics with the EPICmodel using data from Arlington, WI. J. Environ. Qual. 35, 1608–1619.
Huggins, D.R., Buyanovsky, G.A., Wagner, G.H., Brown, J.R., Darmody, R.G., Peck, T.R.,Lesoing, G.W., Vanotti, M.B., Bundy, L.G., 1998. Soil organic C in the tall grassprairie-derived region of the Corn Belt: effects of long term crop management.Soil Tillage Res. 47, 219–234.
Izaurralde, R.C., Rosenberg, N.J., Lal, R., 2001. Mitigation of climate change by soilcarbon sequestration: issues of science, monitoring and degraded lands. Adv.Agron. 70, 1–75.
Izaurralde, R.C., Williams, J.R., McGill, W.B., Rosenberg, N.J., Quiroga Jakas, M.C.,2006. Simulating soil C dynamics with EPIC: model description and testingagainst long-term data. Ecol. Model. 192, 362–384.
Izaurralde, R.C., Williams, J.R., Post, W.M., Thomson, A.M., McGill, W.B., Owens, L.B.,Lal, R., 2007. Long-term modeling of soil C erosion and sequestration at thesmall watershed scale. Climatic Change 80, 73–90.
Lal, R., Kimble, J.M., 2001. Importance of soil bulk density and methods of itsimportance. In: Lal, R., Kimble, J.M., Follett, R.F., Stewart, B.A. (Eds.), Assess-ment Methods for Soil Carbon. Lewis Publishers, Boca Raton, FL, pp. 31–44.
Lal, R., Kimble, J., Follett, R., Stewart, B.A. (Eds.), 1998. Management of CarbonSequestration in Soil. CRC Press, Boca Raton, Florida.
McCarl, B.A., Schneider, U.A., 2001. Greenhouse mitigation in U.S. agriculture andforestry. Science 294, 2481–2482.
McGill, W.B., 1996. Review and classification of ten soil organic matter models. In:Powlson, D.S., Smith, P., Smith, J.U. (Eds.), Evaluation of Soil Organic MatterModels Using Existing Long-Term Datasets, NATO ASI Series I, 38. Springer-Verlag, Heidelberg, pp. 111–132.
McGill, W.B., Izaurralde, R.C., Williams, J.R., 2004. A selfish microbe model ofnitrogen trace gas metabolism. Agron. Abs. CD-Rom.
Molina, J.E., Smith, P., 1998. Modeling carbon and nitrogen processes in soil. Adv.Agron. 62, 253–298.
Nelson, D.W., Sommers, L.E., 1996. Total carbon, organic carbon, and organic matter.In: Sparks, D.L., Bartels, J.M. (Eds.), Methods of Soil Analysis: Chemical Methods.Part 3. SSSA Book Series number 5. Madison, WI. pp. 961–1009.
Nunez Vazquez, F., Salas, H.P., Bachmeier, O., Robledo, W., Lovera, E.F., Rollan, A.,1996. Labranzas en la Region Central de la Provincia de Cordoba. In: Buschiazzo,D.E., Panigatti, J.L., Babinec, F.J. (Eds.), Labranzas en la Region Semiarida Argen-tina, INTA Centro Regional La Pampa-San Luis y Secretarıa de Agricultura Pescay Alimentacion. pp. 49–66.
Nyborg, M., Solberg, E.D., Malhi, S.S., Izaurralde, R.C., 1995. Fertilizer N, crop residue,and tillage alter soil C and N contents after a decade. In: Lal, R., Kimble, J., Levine,E.,Stewart, B.A. (Eds.),Soil Management and Greenhouse Effect. Lewis Publishers,CRC Press, Boca Raton, Florida, USA, pp. 93–100.
Parton, W.J., Rassmussen, P.E., 1994. Long-term effects of crop management inwheat-fallow. II. Century model simulations. Soil Sci. Soc. Am. J 58, 530–536.
Parton, W.J., Ojima, D.S., Schimel, D.S., 1995. Models to evaluate soil organic matterstorage and dynamics. In: Carter, M.R., Stewart, B.A. (Eds.), Structure andOrganic Matter Storage in Agricultural Soils. CRC Press, Lewis Publisher, NewYork, pp. 421–448.
Post, W.M., Kwon, K.C., 2000. Soil carbon sequestration and landuse change:processes and potential. Global Change Biol. 6, 317–327.
Powell, J.M., Hons, F.M., McBee, G.G., 1991. Nutrient and carbohydrate partitioningin sorghum stover. Agron. J. 83, 933–937.
Quiroga, A., Buschiazzo, D., Peinemann, N., 1996. Soil organic mater particle sizefractions in soils of semi-arid Argentine pampas. Soil Sci. 161, 104–108.
Rosell, R.A., Galantini, J.A., 1998. Soil organic carbon dynamics in native and culti-vated ecosystems of South America. In: Lal, R., Kimble, J.M., Follett, R.F., Stewart,B.A. (Eds.), Management of Carbon Sequestration in Soil. CRC Press, Boca Raton,New York, pp. 11–33.
Smith, J., Smith, P., Addiscott, T., 1996. Quantitative methods to evaluate and compareSoil Organic Matter (SOM) models. In: Powlson, D.S., Smith, P., Smith, J.U. (Eds.),Evaluation of Soil Organic Matter Models Using Existing Long-Term Datasets,NATO ASI Series I, 38. Springer-Verlag, Heidelberg, pp. 181–199.
Thornthwaite, C.W., Mather, J.R., 1955. The Water Balance. Publications in Clima-tology III (1) Drexel Institute of Technology, Centerton, New Jersey, 104 pp.
Trumbore, S.E., Chadwick, O.A., Amundson, R., 1996. Rapid exchange between soilcarbon and atmospheric carbon dioxide driven by temperature change. Science272, 393–396.
Vitousek, P.M., Turner, D.R., Parton, W.J., Sanford, R.L., 1994. Litter decomposition onthe Mauna Loa environmental matrix, Hawaii: patterns, mechanisms, andmodels. Ecology 75, 418–429.
Williams, J.R., 1990. The Erosion Productivity Impact Calculator (EPIC) Model: a casehistory. Phil. Trans. R. Soc. Lond. 329, 421–428.
Williams J.R., 1995. The EPIC model. In: Singh, V.P. (Ed.), Computer Models ofWatershed Hydrology, Water Res. Public., Highlands Ranch, CO. pp. 909–1000.
Williams, J.R., Jones, C.A., Dyke, P.T., 1984. A modeling approach to determining therelationship between erosion and soil productivity. Trans. ASAE 27, 129–144.
Zach, A., Tiessen, H., Noellemeyer, E., 2006. Carbon turnover and Carbon-13 naturalabundance under land use change in semiarid savanna soils of La Pampa,Argentina. Soil Sci. Soc. Am. J. 70, 1541–1546.