simulation of pollution load capacity using qual2kw in
TRANSCRIPT
The 2nd International Conference Integrated Solution to Overcome the Climate Change Impact on Coastal and Delta Areas
Semarang, Indonesia – November 19th, 2015
1
Simulation of Pollution Load Capacity using QUAL2Kw
in Babon River
Hermin Poedjiastoeti 1*, Rosiana Indrawati2** 1Faculty of Engineering, UNISSULA Semarang, Jalan Raya Kaligawe Km.04,
Semarang, Jawa Tengah, Indonesia 2Institut Teknologi Yogyakarta (ITY), Jalan Janti Km. 4 Gedong Kuning
Yogyakarta, Indonesia *[email protected], **[email protected]
Abstract.- Babon River is one of the important rivers in Central Java through the Semarang
Regency, Semarang City and Demak Regency. However, the amount of domestic, agricultural and
industrial waste dumped into Babon River leads to increased pollution load and decrease in
capacity. This study aimed to calculate the pollution load capacity using the Streeter Phelps
method with appllied QUAL2Kw program to describing the quality of river water through the
profiles of BOD, COD and TSS. And then it was compared with the standard stream due to
Government Regulation No. 82/2001 about Management of Water Quality and Water Pollution
Control. The study area includes Babon River from upstream to downstream that divided into 8
segments. The simulation BOD’s curve, COD’s curve and TSS’s curve results that maximum
pollution load capacity of the Babon River for BOD and COD parameters contained in the
segment 8 and the TSS parameter is in segment 2, while for the minimum pollution load capacity
for BOD parameter contained in segment 1, COD in segment 6 and TSS in segment 7. The result
of simulation due to pollution load capacity uses minimum flow rate is compared with
Government Regulation No. 82/ 2001, it indicate that in segment 8 has no capacity for water
quality standard class I, II and III with pollution load capacity of BOD ranged 24, 5 kg / day –
54,2 kg / day, and then the pollution load capacity of COD has exceeded the water quality
standard class I of 42,1 kg / day, while pollution load capacity of TSS parameter meet the
capacity of all classes.
Keywords: Babon River, Pollution Load Capacity, Water Quality, QUAL2Kw
I. Introduction Babon River ecosystem is one form of which is divided into upstream, midstream
and downstream. Physically Babon River is the boundary region of the eastern city of Semarang with Demak Regency. Babon River is one of the rivers that have an important role in the three (3) regions in its path, namely the Semarang Regency, Semarang City and Demak Regency. In the flow of the river was constructed weir Pucang Gading that serves as a weir irrigation and flood control, but it is also used as a source of raw water (intake) taps the city, as well as utilization for domestic activities. Another utilization tends negative connotation is functioning as a Babon River effluent discharge both domestic and industrial.
The diversity of human activities around the Babon River will impact the water quality of the river from upstream to downstream. Domestic and agricultural activities that are in a watershed Babon s are a major source of pollutants along the river (BLH Semarang, 2013). The effect could be caused by pollution of the river is a decrease in the quality of water resources, health problems, and sedimentation downstream. It is necessary for river management as a basis for improvement of the environmental condition of the river through the control of the amount of pollution load and
The 2nd International Conference :
Integrated Solution to Overcome the Climate Change Impact on Coastal Area Semarang, Indonesia – November 19th, 2015
Paper No. C-V-261
The 2nd International Conference Integrated Solution to Overcome the Climate Change Impact on Coastal and Delta Areas
Semarang, Indonesia – November 19th, 2015
2
environmental damage control to maintain water quality in accordance with the class determined by means of calculating pollution load capacity.
River pollution load capacity is the ability of water to a source of water in this river, to receive input pollution load without causing the river water becomes blackened. Capacity Load of Pollution of the river is a complicated process because of the river water flowing continue and river water quality varies from upstream to downstream. The closer the distance the more sampling points can describe the actual water quality conditions. However, this will result in high cost of observation. Calculation of Pollution Load Capacity using modeling methods can minimize the cost of observation. One method of modeling that can be used is QUAL2Kw program, which is very efficient in simplifying an event and be able to model the water quality of the river from upstream to downstream (Rusnogroho, 2012). QUAL2Kw program also presented a stream based on the impact of the two sources is derived from a point source of pollution and non point source pollution (Pelletier, 2008).
This study was conducted to determine the water quality condition and the large amount of pollution load capacity of the Babon River by applying methods based on simulation QUAL2Kw with 3 scenarios.
2. Research Methods
2.1. Regional Scope
The study was conducted in Babon River, from upstream to downstream past the three (3) the regency / city, the Semarang Regency, Semarang City and Demak Regency.
2.2. Segmentation of Babon River
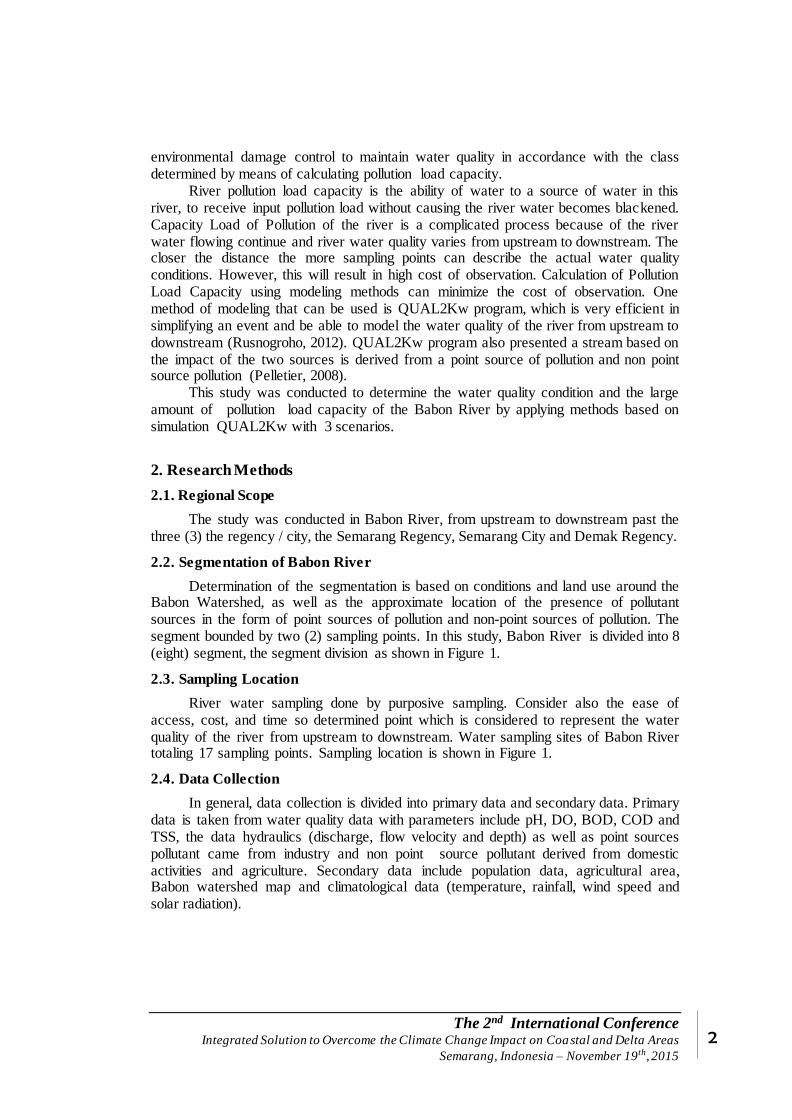
Determination of the segmentation is based on conditions and land use around the Babon Watershed, as well as the approximate location of the presence of pollutant sources in the form of point sources of pollution and non-point sources of pollution. The segment bounded by two (2) sampling points. In this study, Babon River is divided into 8 (eight) segment, the segment division as shown in Figure 1.
2.3. Sampling Location
River water sampling done by purposive sampling. Consider also the ease of access, cost, and time so determined point which is considered to represent the water quality of the river from upstream to downstream. Water sampling sites of Babon River totaling 17 sampling points. Sampling location is shown in Figure 1.
2.4. Data Collection
In general, data collection is divided into primary data and secondary data. Primary data is taken from water quality data with parameters include pH, DO, BOD, COD and TSS, the data hydraulics (discharge, flow velocity and depth) as well as point sources pollutant came from industry and non point source pollutant derived from domestic activities and agriculture. Secondary data include population data, agricultural area, Babon watershed map and climatological data (temperature, rainfall, wind speed and solar radiation).
The 2nd International Conference Integrated Solution to Overcome the Climate Change Impact on Coastal and Delta Areas
Semarang, Indonesia – November 19th, 2015
3
Figure 1. Segment Division and Sampling Location Map
2.5. Data Analysis
Load Capacity in principle is the ability of water bodies receive certain pollution load without being contaminated by the pollutant source. The pollution load is obtained from the results of water quality modeling by QUAL2Kw program based scenarios. Load the initial condition is a burden which is owned by a natural river. The maximum pollution load of the river water quality is under Government Regulation No. 82/ 2001. This capability will have a range of pollutant load to the maximum that can be tolerated by the receiving water bodies. In the data analysis, simulation techniques will be conducted to determine the pollution load capacity. This technique will be divided into several scenarios (see Table 1).

The 2nd International Conference Integrated Solution to Overcome the Climate Change Impact on Coastal and Delta Areas
Semarang, Indonesia – November 19th, 2015
4
Table 1. Scenario Simulation Techniques
Scenario Water Quality in the
Upper River
Pollutant Sources River Water Quality
1 Existing Existing Models
2 Quality standard Class II * Without pollutant source Models
3 Quality standard Class II * Trial and Error Quality standard Class II*
Remarks: * Water Quality Standard according to Government Regulation No. 82 of 2001
Load Capacity = maximum pollution load – initial condition load ...... 1)
Calculation of pollution load capacity of Babon River will use the 2nd scenario and
3rd scenario. In 2nd scenario is the initial condition of the river without pollution load. At this scenario was conducted to determine the proccess of the river if there is no pollution load entering. The quality of waste from pollutant sources indeterminate considered to meet the quality standard of wastewater. The pollution load in the form of tributaries will be assumed to meet the water quality standard. The 3rd scenario is the condition in which the results of the model in accordance with water body quality standard of class II, because the Babon River has not been established designation. The sources of pollution from point sources and non point source at the trial an error until the data model of approaching the results of quality standard class II.
3. Results And Discussion
3.1. Segment Division of Babon River
Based on the results of the map and image processing using geographic information systems, Babon River has a length from upstream to downstream along the
44.679 km. Here is the segment distribution of Babon River (see Table 2 and Figure 2).
Table 2. Segment Distribution of Babon River
Source : Analysis results, 2015
The 2nd International Conference Integrated Solution to Overcome the Climate Change Impact on Coastal and Delta Areas
Semarang, Indonesia – November 19th, 2015
5
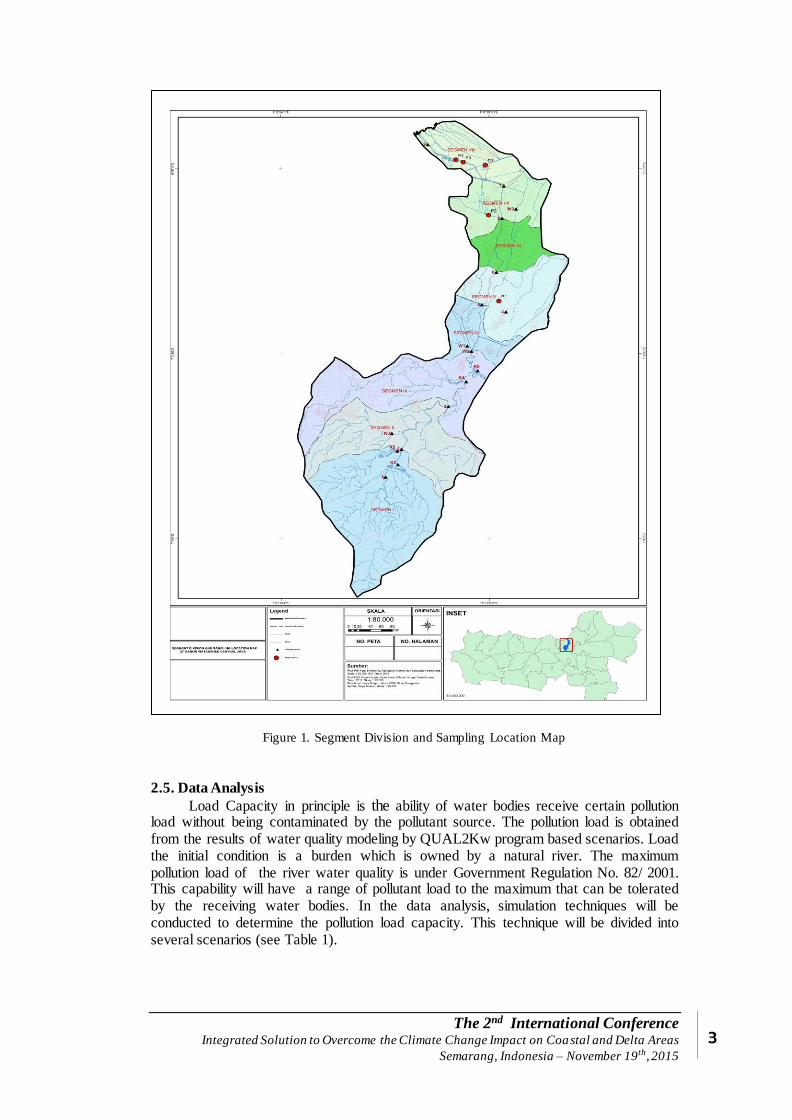
Figure 2. Scheme of Distribution Segment of Babon River and Point Location Sampling
(Source: Analysis results, 2015)
3.2. Pollutants Source
Estimated potential pollutant load of non-point source pollution is calculated based
on data of population and agricultural area that is passed directly by the Babon River. The calculation results of each segment of the total population and the potential burden of domestic wastewater for each parameter in 2015 as shown in the following table (Table 2 and Table 3).
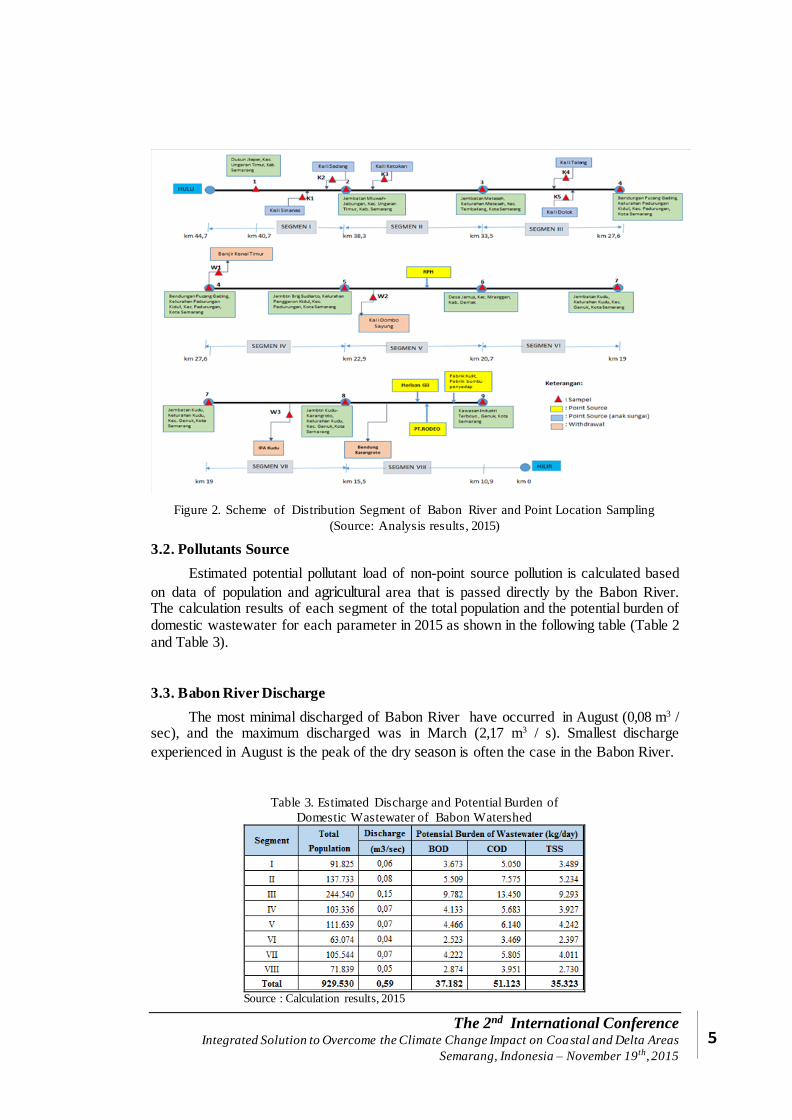
3.3. Babon River Discharge
The most minimal discharged of Babon River have occurred in August (0,08 m3 / sec), and the maximum discharged was in March (2,17 m3 / s). Smallest discharge
experienced in August is the peak of the dry season is often the case in the Babon River.
Table 3. Estimated Discharge and Potential Burden of
Domestic Wastewater of Babon Watershed
Source : Calculation results, 2015
The 2nd International Conference Integrated Solution to Overcome the Climate Change Impact on Coastal and Delta Areas
Semarang, Indonesia – November 19th, 2015
6
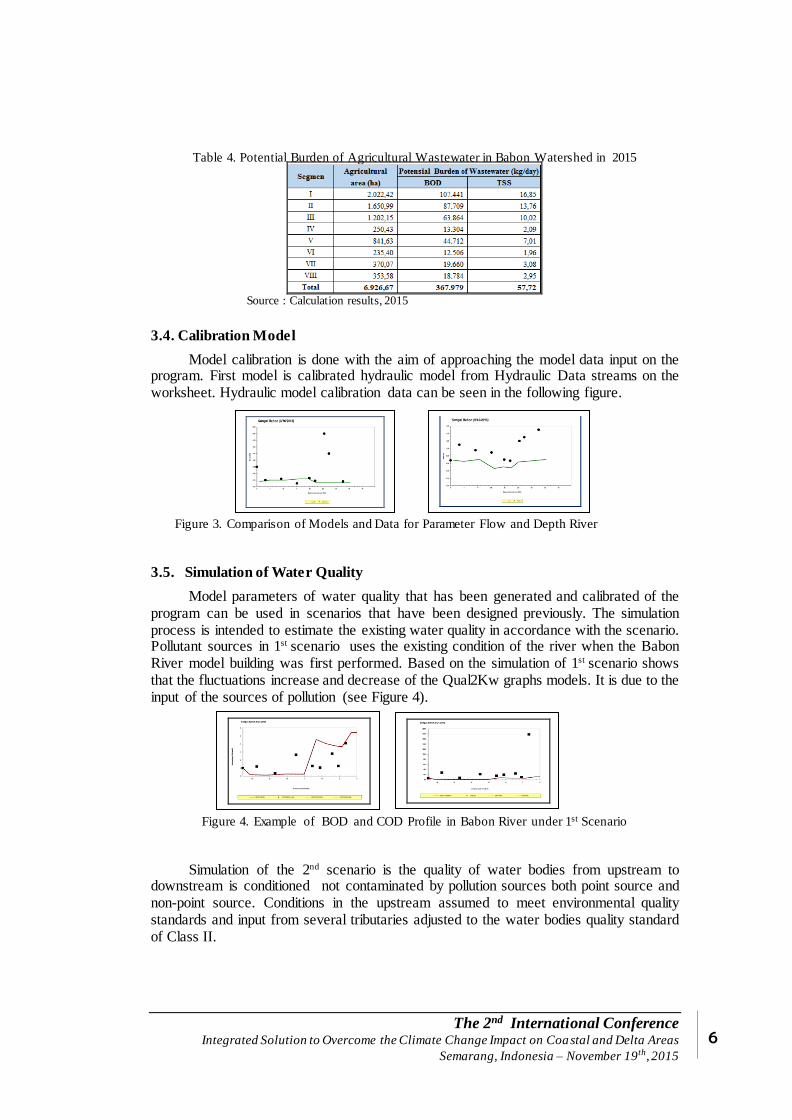
Table 4. Potential Burden of Agricultural Wastewater in Babon Watershed in 2015
Source : Calculation results, 2015
3.4. Calibration Model
Model calibration is done with the aim of approaching the model data input on the program. First model is calibrated hydraulic model from Hydraulic Data streams on the worksheet. Hydraulic model calibration data can be seen in the following figure.
Figure 3. Comparison of Models and Data for Parameter Flow and Depth River
3.5. Simulation of Water Quality
Model parameters of water quality that has been generated and calibrated of the program can be used in scenarios that have been designed previously. The simulation process is intended to estimate the existing water quality in accordance with the scenario. Pollutant sources in 1st scenario uses the existing condition of the river when the Babon River model building was first performed. Based on the simulation of 1st scenario shows that the fluctuations increase and decrease of the Qual2Kw graphs models. It is due to the input of the sources of pollution (see Figure 4).
Figure 4. Example of BOD and COD Profile in Babon River under 1st Scenario
Simulation of the 2nd scenario is the quality of water bodies from upstream to downstream is conditioned not contaminated by pollution sources both point source and non-point source. Conditions in the upstream assumed to meet environmental quality standards and input from several tributaries adjusted to the water bodies quality standard of Class II.
The 2nd International Conference Integrated Solution to Overcome the Climate Change Impact on Coastal and Delta Areas
Semarang, Indonesia – November 19th, 2015
7
Figure 5. Example of BOD and COD Profile in Babon River Based on 2nd Scenario
Simulation of the 3rd scenario is the source of pollutants that enter the state has
met the environmental quality standards in order to get the data model according to the quality standard class II. Furthermore, for water quality conditions in accordance with quality standards, is done by trial and error concentration of the parameters of the point source and non-point source.
Figure 6. Example of BOD and TSS Profile in Babon River Based on 3rd Scenario
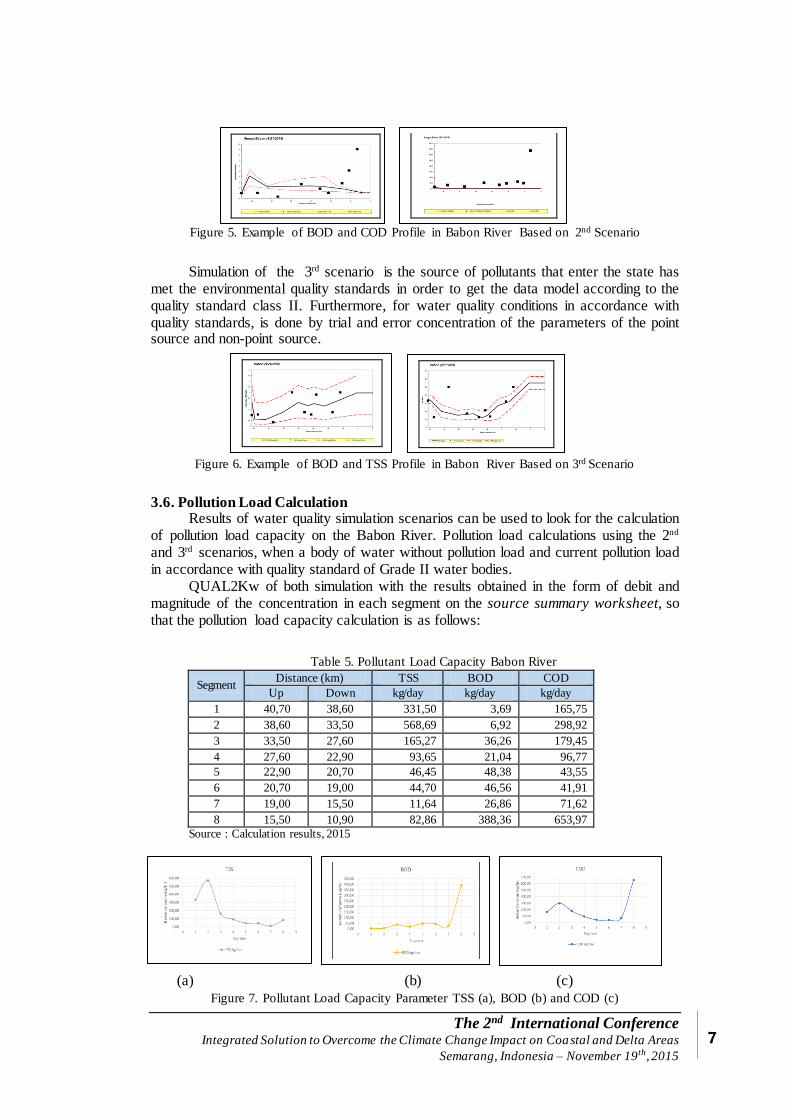
3.6. Pollution Load Calculation Results of water quality simulation scenarios can be used to look for the calculation
of pollution load capacity on the Babon River. Pollution load calculations using the 2nd and 3rd scenarios, when a body of water without pollution load and current pollution load in accordance with quality standard of Grade II water bodies.
QUAL2Kw of both simulation with the results obtained in the form of debit and magnitude of the concentration in each segment on the source summary worksheet, so that the pollution load capacity calculation is as follows:
Table 5. Pollutant Load Capacity Babon River
Segment Distance (km) TSS BOD COD
Up Down kg/day kg/day kg/day
1 40,70 38,60 331,50 3,69 165,75
2 38,60 33,50 568,69 6,92 298,92
3 33,50 27,60 165,27 36,26 179,45
4 27,60 22,90 93,65 21,04 96,77
5 22,90 20,70 46,45 48,38 43,55
6 20,70 19,00 44,70 46,56 41,91
7 19,00 15,50 11,64 26,86 71,62
8 15,50 10,90 82,86 388,36 653,97
Source : Calculation results, 2015
(a) (b) (c)
Figure 7. Pollutant Load Capacity Parameter TSS (a), BOD (b) and COD (c)
The 2nd International Conference Integrated Solution to Overcome the Climate Change Impact on Coastal and Delta Areas
Semarang, Indonesia – November 19th, 2015
8
3.7. Decrease Pollution Load
According to the existing condition of 1st scenario, is necessary to decrease the pollution load of the river so that the water quality of Babon River can still qualified the quality standard requirement of Class II. Based on the difference between the pollution load in scenario 1 and 3, obtained the results as shown in the following table.
Table 6. Decrease Pollution Charges
Segment Distance (km) TSS BOD COD
up down kg/day % kg/day % kg/day %
I 40,70 38,60 209,94 39 0,69 16 30,06 15
II 38,60 33,50 355,56 38 1,37 17 50,93 15
III 33,50 27,60 28,04 15 7,55 17 5,2 3
IV 27,60 22,90 260,59 74 44,28 69 485,2 83
V 22,90 20,70 674,8 94 685,21 93 1456,79 97
VI 20,70 19,00 416,82 90 534,27 92 925,53 96
VII 19,00 15,50 1,70 13 4,27 14 11,1 13
VIII 15,50 10,90 5,91 7 184,52 32 892,66 58
Source : Calculation results, 2015
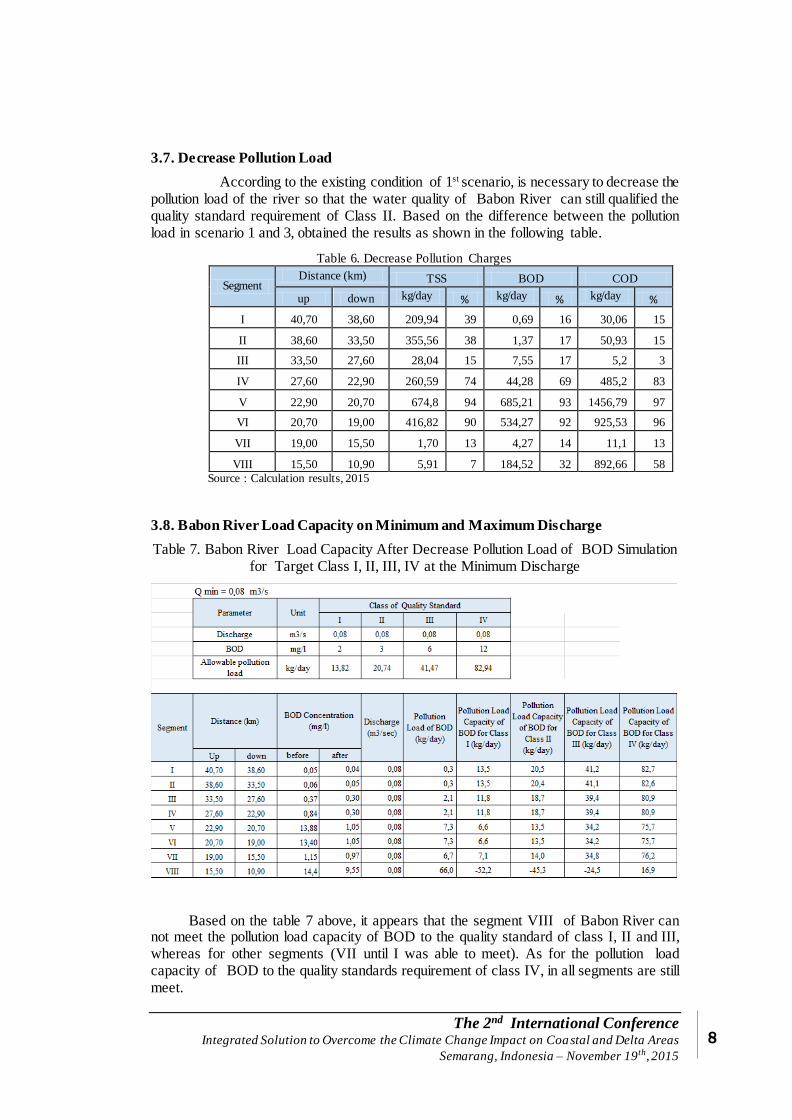
3.8. Babon River Load Capacity on Minimum and Maximum Discharge
Table 7. Babon River Load Capacity After Decrease Pollution Load of BOD Simulation for Target Class I, II, III, IV at the Minimum Discharge
Based on the table 7 above, it appears that the segment VIII of Babon River can not meet the pollution load capacity of BOD to the quality standard of class I, II and III, whereas for other segments (VII until I was able to meet). As for the pollution load capacity of BOD to the quality standards requirement of class IV, in all segments are still meet.

The 2nd International Conference Integrated Solution to Overcome the Climate Change Impact on Coastal and Delta Areas
Semarang, Indonesia – November 19th, 2015
9
Table 8. Babon River Load Capacity After Decrease Pollution Load of COD Simulation for Target Class I,
II, III, IV at the Minimum Discharge
Based on the table 8 shows that the highest COD load of contamination exist in the VIII segment in the amount of 111,2 kg / hr. If seen Babon River pollution capacity after the simulation decrease pollution load at minimum discharge, only segment VIII can not meet the quality standard requirement of class I, for other segments still meet quality standards class I. For Class II, III and IV all segments still meet the standard quality.
Table 9. Babon River Load Capacity After Decrease Pollution Load of TSS Simulation for
Target Class I, II, III, IV at the Minimum Discharge

The 2nd International Conference Integrated Solution to Overcome the Climate Change Impact on Coastal and Delta Areas
Semarang, Indonesia – November 19th, 2015
10
Based on the table 9, it appears that thr pollution load capacity of TSS at minimum discharge of all segmen in Babon River meet the quality standards for all classes.
Table 10. Babon River Load Capacity After Decrease Pollution Load of BOD Simulation for
Target Class I, II, III, IV at the Maximum Discharge
The amount of pollution load of BOD is highest in the segment VIII. Pollution load capacity in the segment VIII does not meet the quality standard of the target class I, II and III, and just meets the fourth grade. For other segments meet the target of the quality standards of all classes.
Table 11. Babon River Load Capacity After Decrease Pollution Load of COD Simulation for
Target Class I, II, III, IV at the Maximum Discharge
The 2nd International Conference Integrated Solution to Overcome the Climate Change Impact on Coastal and Delta Areas
Semarang, Indonesia – November 19th, 2015
11
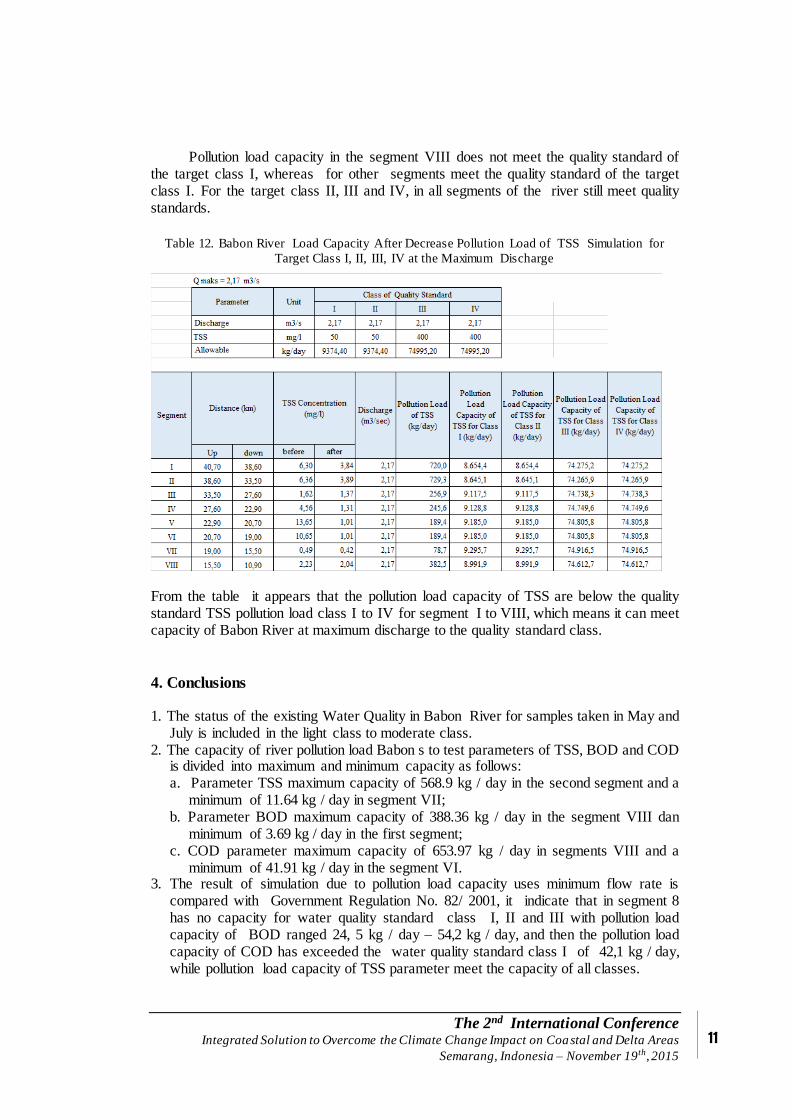
Pollution load capacity in the segment VIII does not meet the quality standard of the target class I, whereas for other segments meet the quality standard of the target class I. For the target class II, III and IV, in all segments of the river still meet quality standards.
Table 12. Babon River Load Capacity After Decrease Pollution Load of TSS Simulation for
Target Class I, II, III, IV at the Maximum Discharge
From the table it appears that the pollution load capacity of TSS are below the quality standard TSS pollution load class I to IV for segment I to VIII, which means it can meet capacity of Babon River at maximum discharge to the quality standard class.
4. Conclusions 1. The status of the existing Water Quality in Babon River for samples taken in May and
July is included in the light class to moderate class. 2. The capacity of river pollution load Babon s to test parameters of TSS, BOD and COD
is divided into maximum and minimum capacity as follows: a. Parameter TSS maximum capacity of 568.9 kg / day in the second segment and a
minimum of 11.64 kg / day in segment VII; b. Parameter BOD maximum capacity of 388.36 kg / day in the segment VIII dan
minimum of 3.69 kg / day in the first segment; c. COD parameter maximum capacity of 653.97 kg / day in segments VIII and a
minimum of 41.91 kg / day in the segment VI. 3. The result of simulation due to pollution load capacity uses minimum flow rate is
compared with Government Regulation No. 82/ 2001, it indicate that in segment 8 has no capacity for water quality standard class I, II and III with pollution load capacity of BOD ranged 24, 5 kg / day – 54,2 kg / day, and then the pollution load capacity of COD has exceeded the water quality standard class I of 42,1 kg / day, while pollution load capacity of TSS parameter meet the capacity of all classes.

The 2nd International Conference Integrated Solution to Overcome the Climate Change Impact on Coastal and Delta Areas
Semarang, Indonesia – November 19th, 2015
12
Acknowledgments
This work was supported by the Environment Agency of Central Java Province and CV Studi Teknik Semarang.
References _____, 2003. Penilaian dan Pengelolaan Lingkungan Hidup Strategis Daerah Aliran
Sungai Babon. Buku I: Identifikasi Kondisi Lingkungan Daerah Aliran Sungai Babon. Pro-LH/GTZ – BAPPEDAL Propinsi Jawa Tengah.
_____, 2013. Laporan Analisis Tren Kualitas Air Sungai Babon . Badan Lingkungan Hidup Kota Semarang.
BPS. 2013. Kota Semarang dalam Angka 2013 . Semarang: Badan Pusat Statistik Kota Semarang.
BPS. 2013. Kabupaten Semarang dalam Angka 2013 . Semarang: Badan Pusat Statistik Kabupaten Semarang.
BPS. 2013. Kabupaten Demak dalam Angka 2013 . Demak: Badan Pusat Statistik Kabupaten Demak.
Chapra, S.C.; Pelletier, G.J.; Tao, H. 2006. QUAL2K: A Modeling Framework for Simulating River and Stream Water Quality, Version 2.04: Documentation and Users Manual; Department of Civil and Environmental Engineering, Tufts University: Medford, OR, USA.
Corbitt, R.A., 2004. Standard Handbook of Environmental Engineering : 2nd Edition. Mc-Graw Hill Companies, New York.
Pelletier, G. J. And S. Chapra. 2008. QUAL2Kw Theory and Documentation (Version 5.1) : A Modelling Framework for Simulating River and Stream Water Quality . Washington: Departement of Ecology.
Rusnugroho, A., 2012. Penentuan Daya Tampung Beban Pencemaran Kali Madiun (Segmen Wilayah Kota Madiun) Menggunakan QUAL2Kw. Jurusan Teknik Lingkungan ITS Surabaya.
Saraswaty, M. N, Karnaningroem, N dan S. Bambang, D. 2013. Analisis Daya Tampung Beban Pencemaran Sungai Mangetan Kanal Kabupaten Sidoarjo dengan Metode QUAL2Kw. Jurusan Teknik Lingkungan. ITS. Surabaya.
Sari, T.E., 2010. Kajian Sedimentasi dengan Model MUSLE pada DAS Babon . Jurusan Geografi. Universitas Negeri Semarang.
Widyastuti, M. dan Marfai, M.A. 2004. Kajian Daya Tampung Sungai Gadjahwong terhadap Beban Pencemaran. Majalah Geografi Indonesia, Vol. 18, No. 2, hal. 81-97.
Wiwoho. 2010. Model Identifikasi Daya Tampung Beban Cemaran Sungai dengan QUAL2E (Study Kasus Sungai Babon). Tesis. Semarang: Program Pascasarjana Universitas Diponegoro.
Zhang, R., Qian, X., Yuan, X., Ye, R., Xia, B. and Wang, Y. Simulation of Water Environmental Capacity and Pollution Load Reduction Using QUAL2K for Water Environmental Management. 2012. Int. J. Environ. Res. Public Health 2012, 9 4504-4521; doi:10.3390/ijerph9124504.