modeling pollutant load reductions for tmdl...
TRANSCRIPT

Modeling Pollutant Load Reductions for TMDL and Pollution Reduction
Plans in Pennsylvania

Welcome to the Webcast
• To Ask a Question – Submit your question in the chat box located to the left of the
slides. We will answer as many as possible during Q&A.
• To Answer a Poll Question – Simply select the preferred option. For those viewing this session
alongside several colleagues, respond in a manner that represents your organization as a whole.
• We ARE Recording this Session – All comments and questions will be recorded and included in the
archives. We will notify you as soon as the recording and related resources are loaded on the web.
• We Appreciate Your Feedback– Fill out our evaluations – our funders need to hear it!

To learn how you can have access to: FREE Webcasts
Free 1-day design, inspection & maintenance workshops
Intensive master stormwater seminarsDirect On-site technical assistance
Self guided web-based learning modules
Visit: www.chesapeakestormwater.net
Chesapeake Bay Stormwater Training Partnership

Upcoming Webcasts
http://chesapeakestormwater.net/events/categories/webcasts/2016-webcast-series/
• Feb. 25: Potential Benefits of Nutrient and Sediment Practices to Reduce Toxic Contaminants in the Chesapeake Bay Watershed

Poll Question #1
How many people are watching with you today?
• Just me
• 2-5 people
• 6-10 people
• > 10 people

Poll Question #2
In what sector do you work?
• Academia
• Federal Government
• Local Government
• State Government
• Non-profit
• Private
• Other…tell us in the chat box

Poll Question #3
Level of Modeling Experience?
• Expert-Show me a modeling program and I’ll blow your mind
• Novice- I have used some models but not a regular task.
• Beginner- I used to build model airplanes when I was a kid.

Speaker Info
Dr. Barry Evans, Penn State University
Bryan Seipp, Center for Watershed
Protection
Deb Caraco, P.E.Center for Watershed
Protection

Today’s Agenda
• MapShed Overview
• Watershed Treatment Model Overview
• Chesapeake Bay Assessment and Scenario Tool and BayFast Overview

Using MapShed to Evaluate Potential Load Reductions Associated with
MS4/TMDL/Reduction Plan Requirements
Barry M. Evans, Ph.D.
Penn State University

Estimating Pollutant Loads with MapShed

General sequence of steps:
• Run MapShed to establish current load without BMPs/mitigation activities
• Determine “target” load• Use “BMP Editor” within GWLF-E to estimate
load reductions with various BMP “scenarios”• Iteratively run model and compare results with
“initial” load to see if “percent reduction” target has been achieved
• Use “Urban Area Tool” to assess load reductions by “urban area” as needed
• Case study located on central PA• TP reduction of 26% required by local
TMDL

Run MapShed to EstablishInitial Load

Using the Project Manager

Loading Data

Selecting a Watershed

Specify Initial Input Parameters for Pre-Processing

Initiate Data Pre-processing

Open up the GWLF-E Model

Load and Review Input File (Optional)

Provide Output File Name and Run Model

Review Output from Initial Model Run

Review Output from Initial Model Run

Determine Target Reductions/Loads
At requirement for 26% reduction of TP:
• Required P reduction = 3188 kg * 0.26 = 829 kg• Target load = 3188 – 829 = 2359 kg
Run BMP Editor within GWLF-E to Estimate Load Reductions
Given Various BMP Types and Implementation Levels

Load Input File into GWLF-E

Add New and Proposed Rural Land BMPs

Add New and Proposed Urban Land BMPs

Re-Run the Model with Edited Input File

Compare New Loads with Initial Loads

Before and After Load Comparisons
With requirement for 26% reduction of TP:
• Required P reduction = 3188 kg * 0.26 = 829 kg• Target load = 3188 – 829 = 2359 kg
• New TP load with BMPs = 2087• This is below the target load of 2359• Actual reduction was about 35%
Re-running the model using the “BMP Editor” can be repeated as necessary to evaluate a range of BMP options and potential load reductions

Township

Urbanized Areas


MapShed available at:
www.mapshed.psu.edu
• Data currently available for PA, NY, and New England• User manual describes process for creating data in
other areas• Video tutorials also available for download• MapShed soon to be available through a web
application (summer 2016)

Questions?

Watershed Treatment Model
1. Overview of the WTM
– Background
– Terminology
– Model Structure (Versions)
2. Example Application

What is the WTM?
• Simple Spreadsheet-Based Model
• Predicts Annual Rates of TN, TP, TSS, Fecal Coliform and Runoff Volume
• Four Major Components
– Sources
– Practices (Existing)
– Practices (Future)
– New Development
WTM Overview

WTM Terminology
• Primary Sources
• Secondary Sources
• Management Practices
• Discount Factors
WTM Overview - Terminology

Primary Sources
• Determined entirely from land use/cover
– Residential
– Commercial
– Industrial
– Forest
– Rural
WTM Overview - Terminology

Secondary Sources
• Cannot be calculated solely by land use
• Secondary Sources in the WTM:– Sanitary: CSOs, SSOs, OSDSs,
Illicit Connections– Channel Erosion– Livestock– Marinas– Road Sanding– Point Sources
WTM Overview - Terminology

Existing Management Practices
• Structural: ponds, swale, LID, etc.
• Turf Management• Erosion and Sediment
Control• Catch Basin Cleanouts• Pet Waste Education• Street Sweeping• Riparian Buffers• Marina Pumpout Station
WTM Overview - Terminology

Future Management Practices
• Most Existing Practices, plus• Lawn Care Education• Urban Downsizing,
Redevelopment• Stream Restoration• OSDS Education, Repair, or
Retirement• Stormwater Retrofit
(Structural Practices)• Illicit Discharge, CSO, and
SSO Repairs• Point Source Reduction

Discount Factors
• Ideal load reductions can rarely be achieved
– Lack of space
– Imperfect practice application
– Inability of programs to be completely effective
• Discount factors "discount" load reductions to account for less than perfect application of practices.
WTM Overview - Terminology

Example: Erosion and Sediment Control
(ESC)
• Base Conditions– Load from “uncontrolled”
construction is 1000 lb TSS/year
– Practices can achieve 70% effectiveness (base efficiency), or 700 lb/year
WTM Overview - Terminology
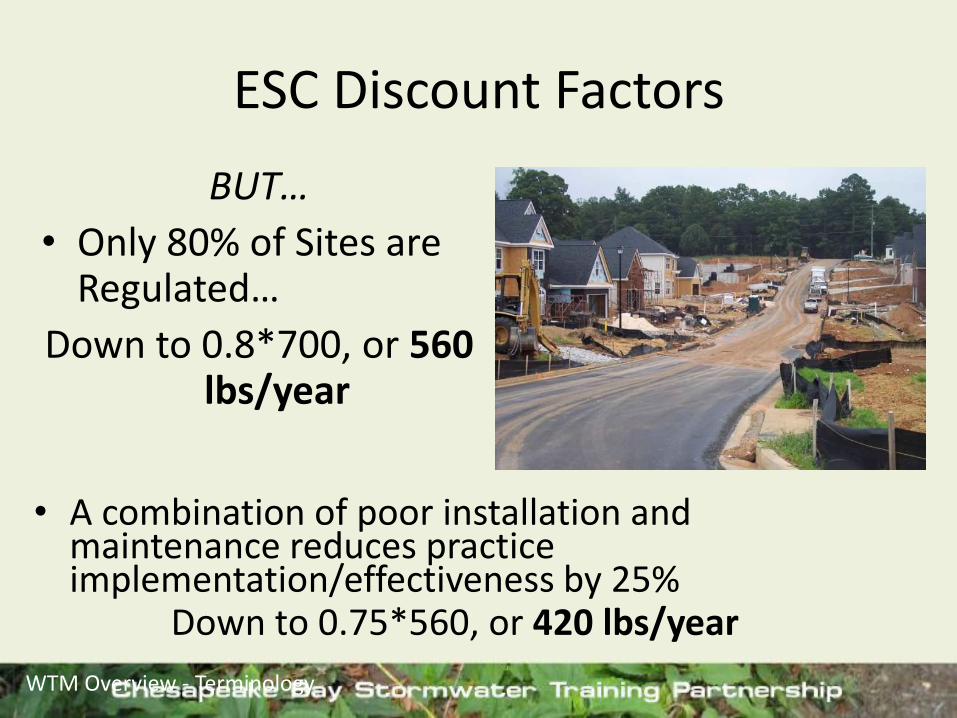
ESC Discount Factors
BUT…
• Only 80% of Sites are Regulated…
Down to 0.8*700, or 560 lbs/year
• A combination of poor installation and maintenance reduces practice implementation/effectiveness by 25%
Down to 0.75*560, or 420 lbs/year
WTM Overview - Terminology

WTM 2013 Version – Two Versions
• WTM “Custom”– Spreadsheet model
– Easily adapted, but
– Lots of information presented at one time, so
– Not easy to pick up and use
• WTM “Off the Shelf”– Spreadsheet model
– Incorporates more features to make it more user friendly, but
– While we tried to make it adaptable, you CANNOT ADD MORE ROWS
– This might make it difficult to adapt for some applications
WTM Overview – Model Structure

WTM “Off the Shelf” Worksheets
• Input Sheets– Sources– Existing Management Practices– Future Management Practices– New Development
• Output Sheets– Results– Results – Unlocked
• Other Sheets– Defaults– Calculations
WTM Overview – Model Structure

Example: Mill Creek in Springettsbury
• Overview
– Used Land Use Data from the Mill Creek Watersehd in Springettsbury
– Made assumptions to estimate other sources.
– Example options to reduce pollutant loads.
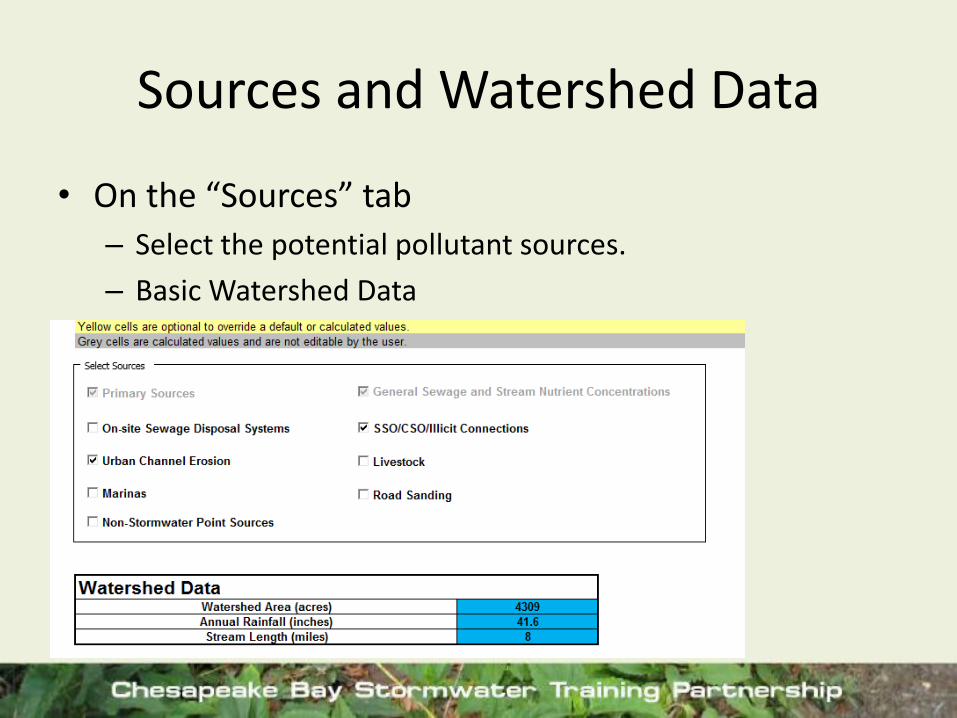
Sources and Watershed Data
• On the “Sources” tab
– Select the potential pollutant sources.
– Basic Watershed Data

Primary Sources: Input Data
• Use GIS Data to identify land use and soils in the watershed.
• Land Use should be zoning classes (e.g., High Density Residential, etc.)
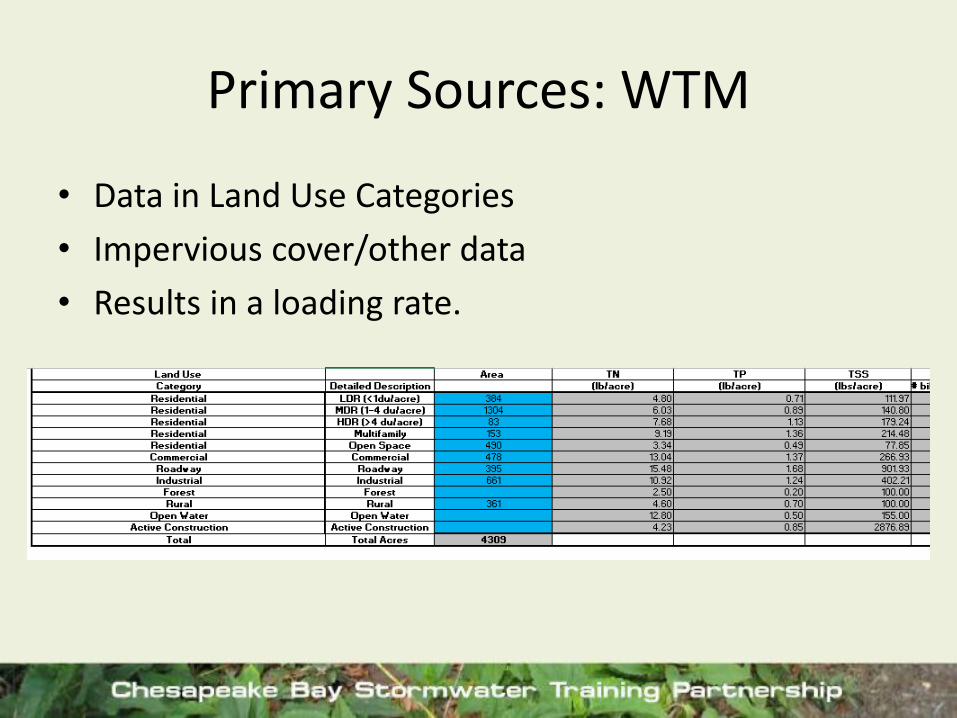
Primary Sources: WTM
• Data in Land Use Categories
• Impervious cover/other data
• Results in a loading rate.

Secondary Sources
• Include:
– Illicit Connections
– CSOs
– Channel Erosion
• Channel Erosion
– 3 Methodologies

Existing Practices
• Documents existing practices in the watershed
• In this case, only accounted for turf management.

Future Practices
• Identify Options
– Lawn Care Education
– Pet Waste Education
– Stream Restoration
– Stormwater Retrofits
– Illicit Connection Removal
– CSO/SSO Repair

Future Practices: Enter Extent
• Some Notes
– Different types of data depending on the practice.
– Some practices have different options available.

Example: Stream Restoration
• Two Options:
– Base on miles stabilized
– Identify individual projects

Results: Output Options
• Can Display:
– Source Loads
– Loads with Existing Practices
– Benefits of Existing Practices
– Benefits of Future Practices
– Loads with Future Practices
– Loads with new Development

Results: Summary

Results: Benefits of Future Practices

Other Tabs (not used)
• New Development
• Output (Unlocked)
• Defaults
• Calculations

WTM Is on OWL
• Download files at:
http://www.cwp.org/online-watershed-library/cat_view/65-tools/91-watershed-treatment-model

Questions?

Chesapeake Assessment and Scenario Tool
(CAST)
&
Chesapeake Bay Facility Assessment
Scenario Tool
(BayFAST)
65

Overview
• Designed as simple planning tools– Complex calculations and information hidden behind the
interface
– Users only need to know general information
• Commonly used for – Milestones
– NFWF proposals and reports
– 319 Plans
– WLAs for MS4s
– Nutrient and sediment local TMDL development and watershed management plans
Features
• Designed provide local jurisdictions with a tool to provide evaluate strategies for the Chesapeake Bay TMDL .
• The load calculations performed by CAST are identical to the current Bay Model.
• The tools use the same assumptions and calculation methods as the Bay Model.

Typical Uses
• Target the highest loading land uses by looking at the baseline lb/acre using a no BMP scenario.
• Choose BMPs that have the highest load reductions/efficiencies.
• Comparing costs for various BMP scenarios.
• Test cost-effectiveness of adopting alternative implementation strategies.


Land Use Download
Includes:
• Land river segment
• Land use
• Land Use abbreviation
• Total acres in each category
FacilityName Landuse ShortName Acres
Webcast MS4 animal feeding operations afo 4.227
Webcast MS4 concentrated animal feeding operations cfo 1.199
Webcast MS4 alfalfa alf 221.885
Webcast MS4 regulated construction rcn 18.845
Webcast MS4 regulated extractive rex 77.356
Webcast MS4 forest for 101.012
Webcast MS4 hightill without manure hom 11.769
Webcast MS4 harvested forest hvf 1.02
Webcast MS4 hightill with manure hwm 1106.479
Webcast MS4 hay without nutrients hyo 53.534
Webcast MS4 hay with nutrients hyw 191.216
Webcast MS4 regulated impervious developed rid 341.063
Webcast MS4 nonregulated impervious developed nid 0
Webcast MS4 pasture pas 163.139
Webcast MS4 regulated pervious developed rpd 1002.636
Webcast MS4 nonregulated pervious developed npd 0
Webcast MS4 degraded riparian pasture trp 6.35
Webcast MS4 nursery urs 3.536
Webcast MS4 water wat 18.46
Webcast MS4 CSS pervious developed cpd 0
Webcast MS4 CSS impervious developed cid 0
Webcast MS4 CSS extractive cex 0
Webcast MS4 CSS construction ccn 0
Webcast MS4 nonregulated extractive nex 0


Urban BMP Scenario

Select BMP

Apply BMP to Land Use

BMP Data

Sector Bmp Full NameLifespanYears Capital
Cap.Unit O&M
O&Munit
Opportunity Opp. Unit
Urban Abandoned Mine Reclamation 20 7134$/acre 43$/acre/year 0$/acre
UrbanAdvanced Grey Infrastructure Nutrient Discovery Program 10 0 0 0
Urban Forest Conservation 1 0$/acre 0$/acre/year 0$/acre
Urban Impervious Surface Reduction 20 100994$/acre 3610$/acres/year 50000$/acre
Urban Urban Growth Reduction 75 0$/acre 0$/acre/year 0$/acreUrban Forest Buffers 75 2986.67$/acre 0$/acre/year 0$/acre
Urban Grass Buffers 10 524.44$/acre 0$/acre/year 0$/acreUrban Stream Restoration 20 645$/ft 8.6$/feet/year 0$/feet/year
Urban
Dirt & Gravel Road Erosion & Sediment Control - Driving Surface Aggregate + Raising the Roadbed 20 10.39$/ft 0$/feet/year 0$/feet/year
Urban Shoreline Management 20 63.56$/ft 0$/feet/year 0$/feet/yearUrban Street Sweeping Pounds 20 1.53$/lbs 0.11$/lbs/year 0$/lbs
Urban Wet Ponds and Wetlands 50 4418.64$/acres treated 63.02
$/acre treated/year 507.71$/acre treated
UrbanDry Detention Ponds and Hydrodynamic Structures 50 10281
$/acres treated 165
$/acre treated/year 635$/acre treated
Urban Dry Extended Detention Ponds 50 4096.4$/acres treated 54.77
$/acre treated/year 1269.27$/acre treated
UrbanInfiltration Practices w/o Sand, Veg. - A/B soils, no underdrain 50 13454.55
$/acres treated 292.89
$/acre treated/year 1269.27$/acre treated
UrbanInfiltration Practices w/ Sand, Veg. - A/B soils, no underdrain 50 13454.55
$/acres treated 292.89
$/acre treated/year 1269.27$/acre treated
Urban Filtering Practices 25 20517.31$/acres treated 837.44
$/acre treated/year 634.64$/acre treated
Cost Data Download

Results

Loads from Each Sector

Comparing Scenarios

Percent Change

File Download

Summary
• BayFAST & CAST scenarios closely replicate the results of the Chesapeake Bay Model. – Uses CBP-approved BMPs and efficiencies
– Consistent with the CBP Phase 5.3.2 Watershed Model and updates
– Users may quantify the impacts of various management actions
– designed to be useful to people with a general knowledge of BMPs.
– Available on-line to users with a login and password (Free)

Questions?

Webcast Resources
Mapshed Website– www.mapshed.psu.edu
• Download tool and base GIS files
• Instructional Videos
• Documentation
Watershed Treatment Model
-http://www.cwp.org/online-watershed-library/cat_view/65-tools/91-watershed-treatment-model
CAST Website– www.casttool.org
BayFast Website– www.bayfast.org
www.chesapeakestormwater.net


Please take a few moments to answer our 6 question survey to help us better serve your needs in future
webcasts.
https://www.surveymonkey.com/r/Modeling-Webcast
We use this information to report it to assess our work, your needs and to report it to our funders for future
webcasts !
Evaluation