simulation based optimization of a propulsion system for ...€¦ · dr. yiannis papelis is a...
TRANSCRIPT
MODSIM World 2018
2018 Paper No. 0055 Page 1 of 12
Simulation Based Optimization of a Propulsion System For an Unmanned
Surface Vessel
Taylor Franklin, Justin Crowe Dr. Yiannis Papelis
Students of Mechanical Engineering Research Professor, Virginia Modeling Analysis & Simulation Center
Old Dominion University 5115 Hampton Blvd, Norfolk, VA 23529
Old Dominion University 1030 University Blvd, Suffolk, VA 23435
[email protected], [email protected] [email protected]
Ian Hobson, John Winn Dr. Miltos Kotinis
Students of Mechanical Engineering Associate Professor, Mechanical and Aerospace Engineering
Old Dominion University 5115 Hampton Blvd, Norfolk, VA 23529
Old Dominion University 5115 Hampton Blvd, Norfolk, VA 23529
[email protected], [email protected] [email protected]
John Zimmerman
Student of Mechanical Engineering
Old Dominion University 5115 Hampton Blvd, Norfolk, VA 23529
ABSTRACT
Unmanned surface vehicles (USVs) have become a key technology for payload delivery, remote sensing, and
surveillance. Most development involves converting existing manned vehicles to unmanned, but several vessels are
specifically designed for unmanned operation. One such vessel is the Wave Adaptive Modular Vessel (WAM-V),
manufactured by Marine Advanced Research. To maintain flexibility, the WAM-V leaves the design of the propulsion system to the user. This paper describes the use of simulation to optimize the mechanical design of a WAM-V
propulsion system. Given the wide availability of marine propulsion approaches and design options, it is impractical
to experiment with physical prototypes. Simulation-based optimization is the most viable approach for optimizing
system performance. The paper describes the initial analysis and use of simulation to finalize the propulsion system
design. This is an interesting engineering case study because it combines multiple levels and types of simulation for
system optimization based on multiple constraints.
ABOUT THE AUTHORS
Taylor Franklin is a veteran of the United States Navy with experience in shipboard engineering systems,
replenishment operations and ship driving as a certified master helmsman. Upon separation under honorable
conditions he pursued his dream of attaining a Bachelors degree. He has attended Old Dominion University in Norfolk,
VA since 2014 and will graduate in May of 2018 with a B.S. Mechanical Engineering, a minor in Engineering
Management, and a concentration in Mechanical Design. His research interests include, structural analysis, modeling
simulation, vibrations analysis, and autonomous vehicle design. Having passed the FE exam and pending EIT
certification, he is seeking engineering opportunities in the Portland, Maine area.
Justin Crowe is a mechanical engineering apprentice at Newport News Shipyard and has spent time in multiple
engineering departments since 2015. Rotations within the engineering department include test engineering, welding
engineering, propulsion plant engineering, and work on the new Columbia Class SSBNs. Prior to working in

MODSIM World 2018
2018 Paper No. 0055 Page 2 of 12
engineering, he spent three years as a marine designer working on the new class of nuclear powered aircraft carriers. He is currently attending the Batten College of Engineering at Old Dominion University pursuing a BS in Mechanical
Engineering and is working towards completing his apprenticeship through the Apprentice School at Newport News
Shipyard.
Ian Hobson is a Mechanical Engineering Undergraduate at Old Dominion University. He will complete his degree in May 2018 with a concentration in Mechanical Design.
John Winn is a mechanical engineering apprentice at Newport News Shipbuilding. He completed The Apprentice
School in 2013 through the Shipfitter trade and in the Advanced Shipyard Operations Curriculum (ASOC) program.
Through The Apprentice Schools advance program, he continued his education and in 2015 graduated Tidewater
Community College with Associate of Engineering in Mechanical Engineering. Since the spring of 2016 he has been enrolled at Old Dominion University and will graduate in the summer of 2018 with a Bachelors of Science in
Mechanical Engineering and a concentration in aerospace. He is still working at Newport News Shipbuilding and has
held multiple progressing job titles since graduating The Apprentice School, with the most recent promotion being a
Quality Analyst. After graduating Old Dominion University, he will be focusing his degree towards his career.
John Zimmerman is a Mechanical Engineering Undergraduate at Old Dominion University. He will graduate in 2018
with a concentration in Mechanical Systems/Design. His main research interests include Computational Fluid
Dynamics and Advanced Marine Coating Systems.
Dr. Yiannis Papelis is a Research Professor at the Virginia Modeling Analysis & Simulation Center at Old Dominion
University. He received a Bachelor’s degree in Electrical & Computer Engineering (ECE) with a minor in Computer
Science at Southern Illinois University Carbondale in 1988, a Master’s in ECE from Purdue University and Ph.D. in
ECE from the University of Iowa in 1989 and 1993 respectively. His research interests include unmanned/autonomous
systems, semi-autonomous behaviors in robotics and virtual environments and use of simulation to accelerate technical
developments. Dr. Papelis has been funded extensively by military and government agencies in R&D projects and has
been selected twice as a summer faculty fellow at the US Navy’s Carderock division focusing in M&S for autonomy in
unmanned surface vehicles.
Dr. Miltos Kotinis is an associate professor of Mechanical & Aerospace Engineering at Old Dominion University in
Norfolk, VA. He received his Diploma in Naval Architecture and Mechanical Engineering from the National
Technical University of Athens (Greece) in 2000 and his M.S.E. and Ph.D. in Naval Architecture and Marine
Engineering from the University of Michigan in 2001 and 2005, respectively. He has published articles in various
journals including the Journal of Ship Research, Engineering Optimization, Structural and Multidisciplinary Optimization, and Soft Computing. His research interests are in the areas of Marine Hydrodynamics, Computational
Intelligence, and Engineering Optimization.

MODSIM World 2018
2018 Paper No. 0055 Page 3 of 12
Simulation Based Optimization of a Propulsion System For an Unmanned
Surface Vessel
Taylor Franklin, Justin Crowe Dr. Yiannis Papelis
Students of Mechanical Engineering Research Professor, Virginia Modeling Analysis & Simulation Center
Norfolk, VA Old Dominion University 1030 University Blvd, Suffolk, VA 23435
[email protected], [email protected] [email protected]
Ian Hobson, John Winn Dr. Miltos Kotinis
Students of Mechanical Engineering Associate Professor, Mechanical and Aerospace Engineering
Norfolk, VA Old Dominion University 5115 Hampton Blvd, Norfolk, VA 23529
[email protected], [email protected] [email protected]
John Zimmerman
Student of Mechanical Engineering
Norfolk, VA
INTRODUCTION
The Wave Adaptive Modular Vessel can be outfitted for purpose-built operations such as inner coastal protection and
coastal research. An example of such an application is topographical mapping of the ocean floor. The WAM-V was
designed as a pontoon-based catamaran with a payload platform that is intended to carry mission-oriented equipment.
As the name “Wave Adaptive” suggests, the vessel has the ability to encounter varying sea states, with the added
benefit of keeping the payload platform relatively stable and level. Its ability to adapt comes from a suspension system
consisting of articulating joints and shock absorbers that allow the vessel to conform to fluctuating wave patterns
(WAM-V Technology OLD, n.d.). In the past quarter century, research has been ramping up for unmanned surface
vessels (Manley, 2008). However, the market sector of advanced autonomous marine vessels is still relatively narrow
and most of the research conducted has been by private companies and defense contractors. As a result, there is a
growing demand at the collegiate level for maritime research on methods and capabilities that maximize performance
of the WAM-V.
To inspire research beyond companies and contractors, the Association for Unmanned Vehicle Systems International Foundation (AUVSI) and U.S. Office of Naval Research hold the biennial Maritime RobotX Competition; in which,
collegiate teams from around the world compete in autonomous boating skills such as navigation, pattern
identification, and obstacle detection and avoidance (Maritime RobotX Challenge. n.d.). With the desire to participate
in the competition, Old Dominion University started a WAM-V team that set out to complete the first stage of
preparation by designing, mounting, and testing the propulsion system that makes the catamaran autonomous.
Attempting to outfit the WAM-V with remotely controlled propulsion systems is a challenging task. The decision was
made to utilize retail-market trolling motors that are often found on recreational fishing boats. Trolling motors are
auxiliary propulsions systems that operate off of an electrical supply, are reliable, relatively easy to control and come
in varying sizes and associated thrust levels. While they are easily mounted to recreational vessels, adapting them to
the WAM-V creates unique challenges due to the customizable nature of the catamaran. Both trolling motors and the fixtures designed to mount them are subject to varying forces and loading conditions. Unlike recreational boats that
utilize such motors for travel at 1 to 2 mph, when mounted on the WAM-V such motors can propel it to its maximum
speed of approximately 10 knots. Therefore, a ground up design and analysis is required for proper selection and sizing
of mounting equipment and it occurs in a three-step process: analytical, computational, and finite element analysis
(FEA).

MODSIM World 2018
2018 Paper No. 0055 Page 4 of 12
Our combination of available retail trolling motors and simulation techniques creates a template for designing and selecting components that meet desired performance characteristics of a WAM-V. Additionally, it eliminates the brute
force method of “buy-and-try”. Engineering is about optimizing solutions and our method does so by joining first
principal engineering curriculum and simulation based engineering design. Using simulation software allows for
multiple trials and scenarios to be evaluated more efficiently because it reveals unforeseen failures and responses of a
particular system prior to production. The knowledge that comes from multiple simulations helps an engineer select
appropriate material and implement design changes to steering mechanisms and mounting structures.
Hydrodynamic Drag Effect As a submerged body travels through a liquid medium it encounters forces due to drag. The shape, velocity, flow area,
and fluid properties are conditions that contribute to the loads experienced by the body. In the case of the propulsion
system the forces acting upon the trolling motors are transmitted to the structural members and steering mechanisms.
The mounts and shafts will need to withstand stresses due to bending and torsional moments. The steering mechanism
will be a servomotor that will need to withstand operating torque experienced during maneuvering. In our research
efforts there were no publications found that included drag analysis and the WAM-V that took into account the types
of components we intended to utilize. This paper will address the need for this analysis by using the analytical
procedure, computational procedure, and finite element analysis procedure to simulate loading experienced due to
drag and contribute drag analysis techniques to the USV community as a whole.
Analytical Procedure The first step prior to entering the simulation environment was to use fundamental engineering concepts to develop a
model; what can be referred to as the analytical procedure. It involved hand drafting a trolling motor cross section that
would be subjected to worst-case scenario drag conditions. That scenario would be the point at which the motors and mounting fixtures are perpendicular to current direction of travel while at maximum operating speed. In this orientation
the greatest amount of drag on the system will occur and thus create the highest loading and risk of failure. The results
from the hand calculation would provide a comparison for first round simulation of simple model cross-section drag
analysis in the computational procedure. This was important because it was the link between proper understanding of
physics at work and proper use of simulation tools prior to conducting complex analysis.
Computational Procedure The second step is conducting computational fluid dynamic analysis (CFD). This procedure allows a 3D model to be
analyzed in a simulation environment that replicates the effect of fluid flow over the model. Using AutoDesk CFD
(AutoDesk, Mill Valley, CA), our 3D model and all of the submerged components of the propulsion system was
subjected to flow conditions similar to that of operational conditions. Velocity of the fluid would vary from 1-8 knots
and angle of the motor would range from 0 to ±90 degrees. The results would output the center of drag on the
propulsion motor and thus help select an optimal location for shaft placement such that torque on the steering system
would be minimized.
Finite Element Procedure The third and final step is performing finite element analysis. This procedure uses the same 3D model from before
and is discretized into smaller quadrilateral elements. The finite element analysis was carried out using FEMAP
(Siemens PLM Software, Plano, TX) for stress visualization purposes. The designed mounting structure would be evaluated at minimum and maximum loading for visual stress representation during operation. Choosing maximum
and minimum stress orientations for evaluation would help create boundary limits that would cover a range of
performance characteristics of the WAM-V during maneuvering. Additionally, the visual results would clarify areas
that needed reinforcement and refinement of the design in order to withstand stresses at the boundaries.
DESIGN OVERVIEW
The first goal of the design process was creating a structure that adapts the propulsion motors to the pontoon extensions
that were provided with the WAM-V. The ideal assembly would be crafted from saltwater compatible materials, carry
the weight of the motor plus steering components, and withstand the stress of operational loading conditions at any steering angle. The second goal was developing automated steering control. A desirable solution would allow the
intended thrust vector range to be an arc of ±90 degrees from the longitudinal axis (Figure 1). This would be achieved

MODSIM World 2018
2018 Paper No. 0055 Page 5 of 12
by estimating static and dynamic torsional effects during maneuvering as a means to choose an appropriate servomotor for steering control.
Figure 1. Trolling Motor Desired Range of Motion
The torque limit of the steering servomotor is published as a graphical range from the factory (Figure 2). The chart displays operating boundaries in a three-colored range: green, yellow, and red. Each section specifies the operating
and required cooling cycles. The first section or “green-range” is the only area that allows uninterrupted operation. It
was decided as a team to not exceed maximum limits of the first section (8 Nm) in order to operate the WAM-Vs
steering system continuously and without risk of damage due to overheating or overloading. Therefore, it was essential
to maximize low speed maneuverability by determining green-range operating limits for speed and angle, which would
come from the CFD loading and torque results.
Figure 2. Servomotor Operating Limits
A road map for completing these tasks is outlined below (Figure 3). First the structure was modeled using 3D software,
then CFD simulations were run, followed by optimizing the shaft position for torque reduction on servomotors, and
finally, performing FEA for stress analysis.

MODSIM World 2018
2018 Paper No. 0055 Page 6 of 12
Figure 3. Design Flow Chart
Modeling A mounting plate was designed-using AutoDesk Inventor-such that it aligns to the existing mounting plate and holes
on the flange of each pontoon extension. Two parallel struts were extruded from the base plate with concentric holes
for shafting. The result was an assembly that mechanically allowed the motors to rotate ±90 degrees (Figure 4).
Figure 4. Conceptual Motor Mount Assembly
A key design goal was minimizing the torque required to steer the motor assembly during operation. The polymer
frame that surrounds the motor has mounting holes that are forward from the geometric center of the motor body.
Aligning the mounting holes with the shaft would create a large moment arm, which would require a very powerful
steering actuator. Instead, to minimize steering torque, a plate was designed that located shaft rotation-of-center inline
with the geometric center of gravity for the motor, hence reducing the steering torque.

MODSIM World 2018
2018 Paper No. 0055 Page 7 of 12
RESULTS
Analytical Results
The governing equation used to determine the drag force was:
𝑭𝑫 =1/2𝝆𝑪𝒅𝑨𝑽𝟐 (1)
Using the hand-drafted model the following assumptions and values were calculated in Table 1:
Table 1. Drag Force of Analytical Model
Drag Equation Components Analytical Model
Density: 𝝆 (𝐥𝐛/𝐟𝐭𝟑) 64.1 @ 50°F
Velocity: 𝑽 (𝐟𝐭/𝐬) 16.8781
Area: 𝑨 (𝒎𝟐) 0.5621
Coefficient of Drag: 𝑪𝒅 1
Force of Drag: 𝑭𝑫 (𝒍𝒃𝒇) 159.38
Computational Results We utilized CFD simulation to calculate the magnitude and location of the drag force on the motor body and in turn
estimate the torque based on the offset between the vertical
shaft and motor mount location. These same forces will
later be used for FEA in order to ensure adequate strength of the mount. The coefficient of drag, Cd, was approximated
as 1 due to the profile of the drag area. The density of seawater was chosen based on the conditions the WAM-V
prototype would most likely be tested in. The total surface
area of the motor and its frame were modeled as a 2- dimensional plate that represented an approximate version
of the true presentation area, and then it was analyzed using CFD (Figure 5). The results were compared to the analytical
approximation and were within 3 lbf of each other. As a result, the data was deemed acceptable to move forward
with complex modeling.
Figure 5. Simple Model for Initial CFD Analysis
The CFD analysis was then performed on the three-dimensional motor model and analyzed at varying velocities and
angles. Initially, each scenario was processed
through 100 iterations, such that accuracy of each
scenario converged to specific data points. The
environment around the model was represented as
an infinite volume box to ensure no contribution to
drag came from surface effects at the walls. Inlet
boundary conditions were applied from 1-8 knots to
replicate the motor traveling through seawater, and
exit boundary conditions were given a pressure of
0.0 psi to simulate a steady state flow over the motor. These assumptions and parameters allow the
model to be analyzed and the pressure to be
visualized. Figure 6 shows an analysis iteration to
illustrate the pressure gradient produced from CFD
Figure 6. Pressure Gradient Complex Model analysis. The CFD program also computes the total drag force on the 3D model in each direction. After
all iterations were complete, data was tabulated for center of drag (COD), shaft location, and resulting torque about
the shaft location.
MODSIM World 2018
2018 Paper No. 0055 Page 8 of 12
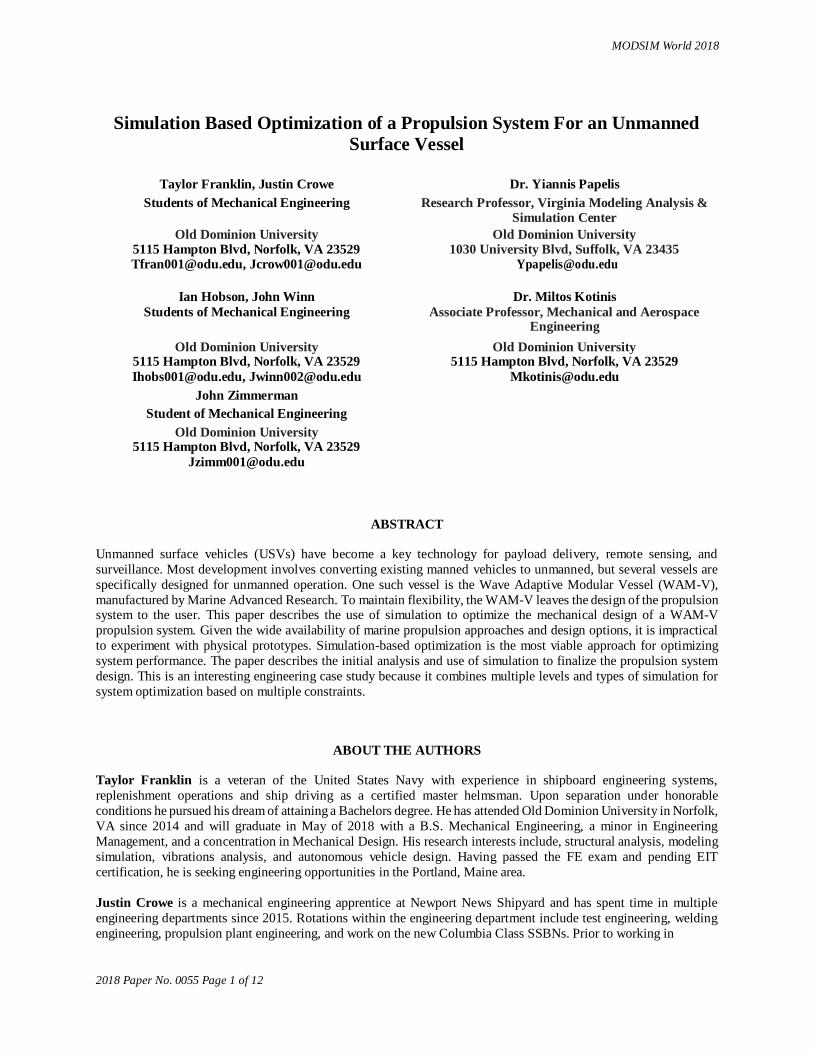
Computational Results Continued The torque results from CFD were extremely helpful in realizing the limitations of the prospective servomotors. The
manufacturer published a torque limit of 70.8 in-lbf (8 Nm) for continuous operation. In the three-dimensional data plot (Figure 7), the intersecting plane represents the torque limit and the curved surface region shows all the areas that
torque limit is violated.
Figure 7. 3D Plot of Torque VS Speed VS Angle
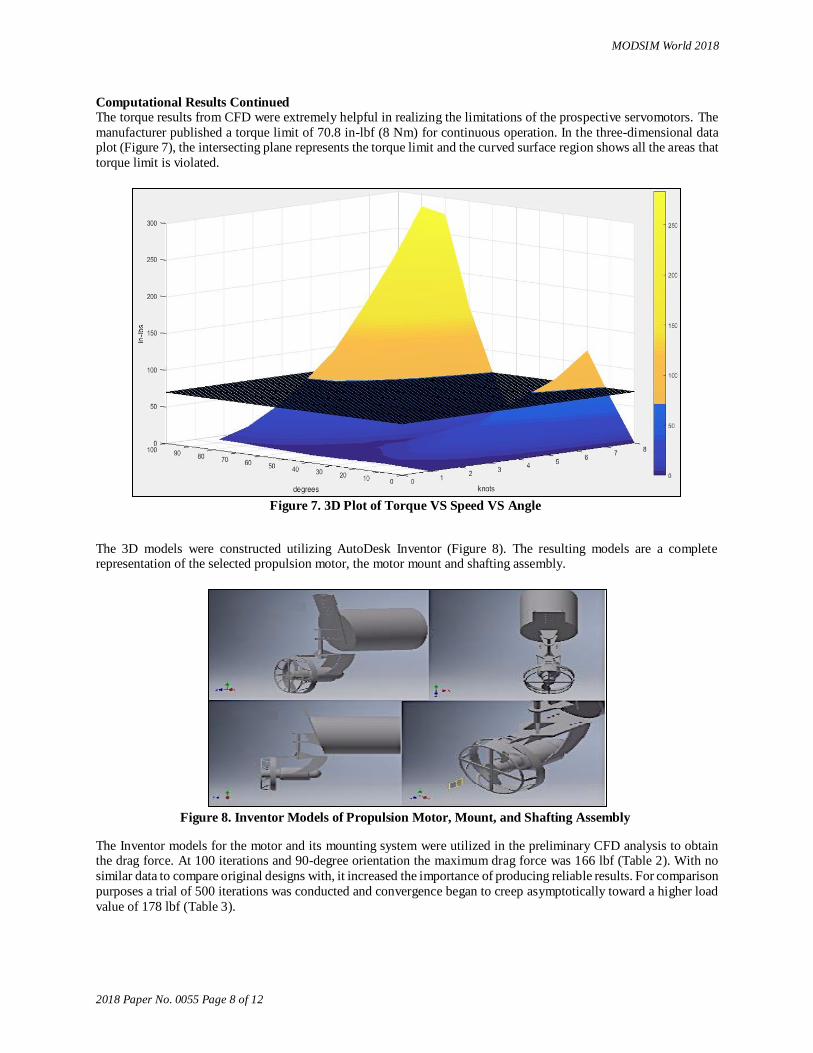
The 3D models were constructed utilizing AutoDesk Inventor (Figure 8). The resulting models are a complete representation of the selected propulsion motor, the motor mount and shafting assembly.
Figure 8. Inventor Models of Propulsion Motor, Mount, and Shafting Assembly
The Inventor models for the motor and its mounting system were utilized in the preliminary CFD analysis to obtain the drag force. At 100 iterations and 90-degree orientation the maximum drag force was 166 lbf (Table 2). With no
similar data to compare original designs with, it increased the importance of producing reliable results. For comparison
purposes a trial of 500 iterations was conducted and convergence began to creep asymptotically toward a higher load
value of 178 lbf (Table 3).

MODSIM World 2018
2018 Paper No. 0055 Page 9 of 12
Table 2. CFD Results, Maximum Speed, First Run 100 Iterations
Speed = 8 Knots
Angle from
streamline
(Degrees)
Center of Drag From
Front of Mounting Plate
(in)
Force in X
(lbf)
Shaft Location From
Front of Plate
(in)
Offset
Moment Arm
(in)
Torque About
the Shaft
(in*lbs)
90 -9.5368 166.024 -8.6 0.9368 155.5312832
80 -9.5153 165.306 -8.6 0.9153 151.3045818
70 -9.1602 153.414 -8.6 0.5602 85.9425228
60 -8.6772 153.153 -8.6 0.0772 11.8234116
50 -8.3108 135.403 -8.6 0.2892 39.1585476
40 -7.8024 115.063 -8.6 0.7976 91.7742488
30 -7.4499 94.9177 -8.6 1.1501 109.1648468
20 -6.8584 63.7857 -8.6 1.7416 111.0891751
10 -6.3477 34.2008 -8.6 2.2523 77.03046184
0 -13.3803 -0.461735 -8.6 0 0
Table 3. CFD Results, Maximum Speed, Second Run 500 Iterations
Speed = 8 Knots
Angle from
streamline
(Degrees)
Center of Drag From
Front of Mounting Plate
(in)
Force in X
(lbf)
Shaft Location From
Front of Plate
(in)
Offset
Moment Arm
(in)
Torque About
the Shaft
(in*lbs)
90 -9.941 178.288 -8.35 1.591 283.656
80 -9.880 180.860 -8.35 1.5302 276.752
70 -9.241 175.724 -8.35 0.891 156.535
60 -8.733 182.248 -8.35 0.383 69.819
50 -8.386 168.297 -8.35 0.036 6.008
40 -8.101 152.880 -8.35 0.249 38.128
30 -7.753 128.368 -8.35 0.597 76.636
20 -7.085 92.877 -8.35 1.265 117.498
10 -7.371 57.528 -8.35 0.979 56.3252
0 -67.980 -0.016 -8.35 0 0

MODSIM World 2018
2018 Paper No. 0055 Page 10 of 12
Utilizing the operating limits provided by the manufacturer, an optimization technique using conditional statements and boundary limits from the graph was performed for shaft location determination. Each time a new position was
entered the data would alter and the output of values were assigned a color and a percentage in Table 4. Ultimately
the most suitable location was found to be 8.35 inches from the front of the motor mounting plate. At this position
82.5% of the operating range of the servomotor was less than 8 Nm. Additionally, the total overload area of the table
(red) was minimized to just 7.5%. As inputs in shaft position approached and departed from 8.35 inches the percentage
of green area decreased and both yellow and red areas increased. This absolute maximum characteristic indicated that
the position of the shaft was optimized.
Table 4. Speed, Angle and Torque Operating Limits for Shaft Location At 8.35 inches
Knots 8 7 6 5 4 3 2 1
Angle Torque (Nm)
Torque (Nm)
Torque (Nm)
Torque (Nm)
Torque (Nm)
Torque (Nm)
Torque (Nm)
Torque (Nm)
90 32.148 24.573 17.959 11.828 7.771 4.378 1.851 0.498
80 31.365 22.462 15.340 11.873 6.960 4.054 1.697 0.450
70 17.741 12.706 10.079 6.497 4.256 2.342 1.058 0.254
60 7.913 6.063 4.274 2.729 2.029 0.951 0.444 0.131
50 0.681 0.389 0.329 0.580 0.204 0.254 0.027 0.018
40 4.321 4.725 2.537 2.148 1.182 0.765 0.224 0.059
30 8.685 6.170 4.535 3.532 1.904 1.152 0.586 0.132
20 13.316 9.774 7.896 5.259 3.518 1.906 0.786 0.212
10 6.384 4.767 3.553 2.465 1.527 0.836 0.377 0.097
0 0.000 0.000 0.000 0.000 0.000 0.000 0.000 0.000
The established operating limits were deemed acceptable at this point because the nature of marine vessel
maneuverability is such that, at higher speed reduced steering angle of the motor is required to cause large direction
change. The hydrodynamic characteristics of the motor create a rudder effect. The effect is a consequence of increased
pressure acting over the surface area of the motor as the WAM-V travels at a higher rate. At speeds below 4 knots the
boat motors will be able to achieve full range of motion-180 degrees-without concern.
Finite Element Analysis Results A Finite Element Model (FEM) of the mount
was created using Nastran v10.2 (MSC
Software, Newport Beach, CA) to represent
the motor at two orientations, 0-degrees and
90-degrees. These two orientations were
chosen because they represent the best and
worst case scenario for drag on the propulsion
system. The discretized FEM illustrates the 0-
degree orientation (Figure 9). The loads
determined from the CFD analysis were
applied to the model, along with the weight of
the motor and the maximum thrust load listed
in the motor’s manual. The model was
constrained in 6 degrees of freedom at the top
of the mounting plate where it attaches to the flange of the pontoon extension. Finally, a
static analysis was performed to show
potential failure points in the model due to
plastic deformation.
Figure 9. FEM of Motor Mount Assembly
Beam elements representing 1” hollow aluminum shaft
3/16” wall thickness

MODSIM World 2018
2018 Paper No. 0055 Page 11 of 12
Finite Element Analysis Results Continued Contour plots displaying maximum Von Mises stress are shown below (Figures 10 & 11). The area concentrated in
red indicated the rear mount would experience plastic deformation (Figure 10). After modifications to material thickness of the model, the FEA was performed again and the results were below yield stress.
Figure 10. FEA Results, 90-Degree Orientation Figure 11. FEA Results, 0-Degree Orientation
The inputs into the FEA were re-evaluated with the larger forces from the 500 iteration trials, with worst-case scenario at 6 knots and 60-degree orientation. At a load of 104 lbf the mounting plate and shafting remained below the yield
stress (Figure 12), which opens up the opportunity for further improvement. Although an optimized solution that
includes weight minimization was still pending, it was deemed acceptable to move forward with manufacturing a
mounting assembly for mockup and fitting.
Figure 12. FEA Results From 500 Iterations, 6 Knots and 60-Degree Orientation
MODSIM World 2018
2018 Paper No. 0055 Page 12 of 12
DISCUSSION
The purpose of this project was to meet criteria for entrance into the RobotX competition by designing, mounting, and
testing the propulsion system. Once again, those criteria are: it must be able to propel itself and have automated
steering controls. The purpose of this case study was to meet competition requirements using simulation based
optimization techniques complete the tasks of designing a propulsion system and steering system. The added benefit
of the case study is a design and analysis procedure plan that can be applied to the WAM-V and other USV systems.
The CFD results of the simplified plate model were compared with the analytical results and deemed acceptable.
However, after searching through research publications involving drag analysis and the WAM-V, it was apparent that
identifying comparable results for the complex CFD and FEA modeling would be an extremely difficult task. The
results from the drag analysis on the propulsion motors and loading conditions were specific to the design of the mounting plate and shafting assembly created by the propulsion team. The higher iteration trials demonstrated better
convergence and created more confidence in the analysis.
The 3D plot of the CFD results made it possible to determine the preferred location of the steering shaft in relation to
the motor center of drag. The optimized location minimized the torque on the steering mechanisms from a visual
standpoint. However, the regions of the plot that show torque increases above the operating limits of the servomotor
required re-evaluation of the operating capabilities of the steering system. It was decided that the servomotor would
be programmed to restrict motor orientation for each region of the plot that torque and speed would violate torque
limits.
The depiction of theoretical stress concentrations from each finite element analysis was beneficial because it was the last line of defense against failure in the development process. From the visual results it appeared that the mount would
not fail under operational loading conditions, as such, it was decided to move forward with manufacturing a mock up
assembly for testing.
As mentioned in the beginning a desirable solution to our propulsion system would be an assembly that is made of
saltwater compatible materials, carry the weight of the motor plus steering components, and withstand the stress of
operational loading conditions at any steering angle. We have chosen to use 6061-T6 aluminum for its corrosion
resistance to saltwater and material strength properties. This material will carry the weight of all components and
withstand projected operational loading conditions. The servomotor will be capable of meeting most of the desired performance characteristics. However, it will have to be restricted during particular combinations of speed and angle.
CONCLUSION
Ultimately, future WAM-V project groups can realize the end product of the propulsion team efforts. Once the
propulsion and steering systems are finalized the vessel will be robust, reliable, and autonomous. Therefore, other
groups will be able to focus on advancement of new areas of the WAM-V. It is also important to recognize that the
benefits of this research are not singular to the RobotX competition. Researchers can repeat the simulation and analysis
techniques utilized in this project to design a purpose built WAM-V, while attempting to improve on our tactics and
designs. As a result, the advancement of USV technology would also increase and expand upon the relatively narrow
field of research.
REFERENCES
WAM-V Technology OLD. (n.d.). Retrieved January 21, 2018, from http://www.wam-v.com/wam-v-technology/
JManley, J.E. (2008). Unmanned surface vehicles, 15 years of development. Oceans 2008.
doi:10.1109/oceans.2008.5289429
Maritime RobotX Challenge. (n.d.). Retrieved January 21, 2018, from https://www.robotx.org/index.php/about-
robotx