simulating the 2020 census - urban.org
TRANSCRIPT

RE S E A R C H RE P O R T
Simulating the 2020 Census Miscounts and the Fairness of Outcomes
Diana Elliott Steven Martin Jessica Shakesprere Jessica Kelly
November 2021
C E N T E R O N L A B O R , H U M A N S E R V I C E S , A N D P O P U L A T I O N

A B O U T T H E U R BA N I N S T I T U TE The nonprofit Urban Institute is a leading research organization dedicated to developing evidence-based insights that improve people’s lives and strengthen communities. For 50 years, Urban has been the trusted source for rigorous analysis of complex social and economic issues; strategic advice to policymakers, philanthropists, and practitioners; and new, promising ideas that expand opportunities for all. Our work inspires effective decisions that advance fairness and enhance the well-being of people and places.
Copyright © November 2021. Urban Institute. Permission is granted for reproduction of this file, with attribution to the Urban Institute. Cover image by Angelina Bambina/Shutterstock.

Contents Acknowledgments iv
Executive Summary v
Simulating the 2020 Census 1 The State of the 2020 Census 3
Factors Affecting the 2020 Census Count 4 Methodology 8
Projecting the US Population 9 How the Microsimulation Model Works 9
Findings 11 Assessments of 2020 Census Performance for States and Large Metropolitan Areas 11 Probable Miscounts for Major Demographic Groups in the 2020 Census 16 How the 2020 Census Relates to Potential Funding and Apportionment Scenarios 19
Data Considerations 23 Conclusion 25
Appendix. Detailed Methodology 27
Notes 38
References 42
About the Authors 44
Statement of Independence 46

i v A C K N O W L E D G M E N T S
Acknowledgments This report was funded by the New Venture Fund 2020 Census Project. We are grateful to them and to
all our funders, who make it possible for Urban to advance its mission.
The views expressed are those of the authors and should not be attributed to the Urban Institute,
its trustees, or its funders. Funders do not determine research findings or the insights and
recommendations of Urban experts. Further information on the Urban Institute’s funding principles is
available at urban.org/fundingprinciples.
We are grateful to the many people who helped develop ideas for this project and produce the final
report. Rob Santos was critical for guiding our ideas on this project, and we are incredibly grateful that
he generously shared his expertise. Michelle Menezes and Silke Taylor were integral team members,
and we are grateful for the considerable time and effort they invested in programming to ensure the
microsimulation model worked successfully. A special thanks to Liza Hagerman for her editorial work
and Laura Swanson for her writing contributions to this report.
Finally, we would like to thank our report reviewers Andrew Reamer, Karen Smith, and John
Thompson for their thoughtful comments and helpful suggestions. We are grateful for Kyle Ueyama’s
help reviewing the programming. Finally, we thank Denice Ross for providing strategic guidance
throughout the development process.
E X E C U T I V E S U M M A R Y v
Executive Summary Population censuses have never been and never will be perfect. The 2020 Census was not likely perfect,
either. The challenges and obstacles to conducting the 2020 Census were numerous and varied—from
its politicization to the pandemic—and accuracy and fairness were likely affected.
Questions and concerns have been raised about the quality of the 2020 Census and whether the
data will be as accurate as previous censuses (GAO 2020c; Thompson 2021). The goal of the Urban
Institute’s study was to address such questions about quality and provide additional data about the
2020 Census’s accuracy and fairness. Urban created an innovative methodology—a simulation of the
2020 Census—to better understand the decennial census’s performance.
Exploring the 2020 Census’s Accuracy and Utility
To offer additional insights on the 2020 Census’s accuracy and utility, the Urban Institute constructed a
person-level microsimulation model to explore these questions. A microsimulation model allows us to
simulate different plausible scenarios for miscounts and fairness in the 2020 Census to understand how
factors may influence its accuracy and corresponding implications for political representation and
allocation of federal resources.
In this case, our “what if” scenarios explore what both a simulated 2020 Census count and a
hypothetical full count could look like for the United States by geography and demographics, as well as
scenarios for apportionment and Medicaid funding.
This novel approach creates plausible 2020 Census counts and then tests them under various
evidence-based conditions. As the findings in this report demonstrate, these data serve as an additional
check on the quality of the census count and further elucidate the real implications of an imperfect
2020 Census for the nation over the next decade. Specifically, we show the following:
The 2020 Census likely had a net undercount—disproportionately larger for specific groups
and places—which suggests less accuracy than in the 2010 Census.
Such undercounts have implications for the fair allocation of funding and congressional
representation across the states.
Urban’s microsimulation model illustrates how a hypothetical full count would produce fairer
results.
v i E X E C U T I V E S U M M A R Y
What Factors Contribute to the Final Count’s Accuracy and Fairness?
The past decade was marked by internal and external factors that have implications for the count. They
include demographic change in the US, the political climate, the COVID-19 pandemic, natural disasters,
and the resulting operational changes made to the 2020 Census to account for changing times and
realities.
Events and decisions in the decade leading up to 2020 Census Day may have had more impact on
the final counts than in previous decades. Traditionally hard-to-count groups increased as a share of the
population. Precensus funding shortfalls at key times limited the testing of new census procedures, and
late disputes over census content exacerbated uncertainty. Then the pandemic affected living
arrangements, complicated in-person follow-up counts, and delayed postenumeration data cleaning and
other processes.
This report describes the events leading up to Census Day, the prolonged period of fieldwork and
data processing because of the pandemic, and how these factors contribute to the final count’s accuracy
and fairness. The challenging environment in which the 2020 Census was conducted suggests the need
for additional benchmarks—such as Urban’s microsimulation model—to assess the 2020 Census’s
quality, accuracy, and fairness.
Estimating Census Counts, Testing Scenarios, and Exploring Outcomes
Urban created the unique data presented in this report for this project as an important benchmark to
assess the quality of the 2020 Census. They were created in a two-step process. First, we projected the
US population as of April 1, 2020, or Census Day. Second, we adjusted our projected population with
known factors likely to affect the census and tested two scenarios: a simulated 2020 Census and
hypothetical full count. We then explored potential outcomes, such as apportionment and the
allocation of federal Medicaid funding.
This study is based on the best data available and is grounded in robust projections and
microsimulation methodologies. However, as is true with any data and analyses, limitations exist and we
urge caution in interpreting the findings.

E X E C U T I V E S U M M A R Y v i i
The undercount was likely not as severe as expected, but who was undercounted and
overcounted varies. Our simulation of the 2020 Census finds the following:
1. There likely was an overall 0.5 percent net undercount of the US population. Although
different from the 2010 count, which had nearly perfect net accuracy, it was perhaps not as
severe an undercount as some have feared.
2. Considerable variation exists in who was undercounted and overcounted overall in the 2020
Census. Net accuracy is important, but fairness also matters.
» We find that the true total populations of Mississippi and Texas were undercounted in our
simulated 2020 Census by 1.3 and 1.28 percent, respectively, while Minnesota’s population
was net overcounted by 0.76 percent. Such differences matter for these states for the next
decade—Mississippi and Texas residents will receive less of their fair share of federal
funding for infrastructure, health care, and children’s programs. In contrast, Minnesota
residents will receive more.
» For example, we find in our simulations that if the residents had been counted accurately in
the 2020 Census, Texas would receive over $247 million more and Minnesota would
receive $156 million less in 2021 federal Medicaid reimbursements. A fair and accurate
census impacts people’s well-being, and these outcomes can be disparate across the nation.
3. Those hardest to count in recent decennial censuses were again likely undercounted in the
2020 Census. For each hardest-to-count group, equity issues arise with the count’s fairness,
how resources will be distributed, and who will miss out on their fair share of political
representation and funding:
» Black and Hispanic/Latinx people had a net undercount of more than 2.45 and 2.17
percent, respectively, in our simulated 2020 Census.
» Young children, or those younger than age 5, were likely to be net undercounted by 4.86
percent.
» Nationwide, renters were likely to be undercounted by 2.13 percent overall.
» Households with a noncitizen present were likely undercounted by 3.36 percent overall.
Counting the nation’s population fully is becoming increasingly complicated. Innovations are
needed to better understand the quality of the census, its fairness, and its implications for the following
decade.

v i i i E X E C U T I V E S U M M A R Y
It is impossible to change the outcomes of the 2020 Census, but with adequate planning and
innovation, the 2030 Census can be improved for the hardest-to-count groups and places. These efforts
require us to collectively recognize how critical it is to invest in the decennial census and value it as a
core component of our democracy.

S I M U L A T I N G T H E 2 0 2 0 C E N S U S 1
Simulating the 2020 Census Population censuses—including decennial censuses conducted in the US—have never been and never
will be perfect. Recent history points to examples of imperfections in enumerating the country. The
1990 Census had such notable flaws in miscounts by race that a statistical adjustment to boost accuracy
was attempted and then rejected by the US Supreme Court.1 In 2010, the census was touted as highly
accurate because its count came within a fraction of a percentage point of an independently generated
survey-based estimate. Yet this was the propitious result of counterbalancing about 10 million people
who were erroneously included with about 10 million people who were omitted overall.2 Further,
accuracy in 2010 came at the expense of fairness; those who were overcounted were more often white,
while those undercounted were more often people of color.
The 2020 Census was not likely perfect either. The challenges and obstacles to conducting the 2020
Census were numerous and varied—from its politicization to the pandemic—and its accuracy and
fairness were likely affected. Our previous research offered a sense of the magnitude of possible
miscounts in the 2020 Census under milder challenges than what unfolded (Elliott et al. 2019). In that
research, we showed that historically undercounted groups, including Black, Hispanic/Latinx, and young
children were at greater risk of not being enumerated in 2020 than their counterparts.
Because no census has ever been perfectly accurate, the issue is not whether accuracy was achieved,
but its utility for specific purposes such as apportionment and allocation of federal resources. At
present, many researchers are investigating the data quality of the 2020 Census to better understand
its accuracy and its subsequent utility. Since April 2021, the US Census Bureau has released various
operational measures that indicate the quality of the data collection efforts,3 and outside researchers,
including an American Statistical Association task force, independently reviewed these quality metrics
(ASA 2021). Even with such scrutiny, the magnitude of inaccuracies in the 2020 Census can never be
known with certainty and will undoubtedly vary by geography and subpopulations. The need for
additional research on this topic is considerable.
To offer additional insights on the 2020 Census’s accuracy and utility, Urban constructed a person-
level microsimulation model to explore these questions. A microsimulation model allows us to simulate
different plausible scenarios for miscounts and fairness in the 2020 Census to understand how factors
may influence its accuracy and corresponding implications for political representation and allocation of
federal resources.4 In contrast to others’ work analyzing data quality, this is a novel approach that
creates plausible 2020 Census counts and then tests them under various evidence-based conditions. As
the findings in this report demonstrate, these data serve as an additional check on the quality of the

2 S I M U L A T I N G T H E 2 0 2 0 C E N S U S
census count and further elucidate the real implications of an imperfect 2020 Census for the nation
over the next decade. Specifically, we show the following:
The 2020 Census likely had a net undercount—disproportionately larger for certain groups and
places—which suggests less accuracy than in the 2010 Census.
Such undercounts have implications for the fair allocation of funding and congressional
representation across the states.
Urban’s microsimulation model illustrates how a hypothetical full count would produce fairer
results.
BOX 1
Glossary
Throughout this report, we use technical terms—some also used by the US Census Bureau—which we
describe below.
Administrative records. These are data sources, typically pulled from other federal sources, that
will be used to supplement address and resident information on the 2020 Census when there are
information gaps or when households do not respond.
Enumeration. This is the count of people, households, firms, or other important items in a
geographic level at a particular time.
Erroneous enumerations (or overcounts). These are people or housing units who were counted
but should not have been enumerated. This includes counting the same person at two different
locations, a household counting a person who died before or was born after Census Day, or the
inclusion of vacant or short-term housing units (such as vacation rentals).
Federal Medical Assistance Percentage (FMAP). This is the federal funding formula used to
determine the percentage of each state’s expenditures on medical programs that will be
reimbursed by the federal government. It is a ratio of per capita state income to per capita total
US income, which both depend on census counts.
Imputation. This is the process of assigning data, through statistical procedures, when they are
missing. This is one of the last data-processing steps before the census is finalized.
Internet self-response (ISR). This option was available on the 2020 Census for residents to
answer questions online. The Census Bureau prioritized the “Internet First” mode in the 2020
Census, encouraging responses to be submitted online rather than by phone or paper form.
Microsimulation model. This is a computer program that mimics the operation of government
programs and demographic processes on individual (i.e., people and households) members of a

S I M U L A T I N G T H E 2 0 2 0 C E N S U S 3
population to estimate how demographic, behavioral, and/or policy changes might affect these
members and better understand the effects of current programs.
Nonresponse follow-up (NRFU). This is the period during decennial census operations when field
staff, like enumerators, are sent to nonresponsive residences to conduct the count in-person.
Omissions (or undercounts). These are people and households that should have been counted
but for various reasons were missed in the final census count.
Post enumeration survey (PES). This survey is part of the Census Coverage Measurement (CCM)
program conducted after the 2010 Census to understand how successful the census was in
counting the American public.
Urban’s data and analytic scenarios used in the report are as follows:
Initial projections. Urban created projected data for the entire US population on April 1, 2020,
based on US Census Bureau data.
Simulated 2020 Census. This scenario is Urban’s simulation of the 2020 Census that accounts for
known measurement limitations that could promote miscounts and applies adjustments for such
factors to Urban’s initial projections.
Hypothetical full count. This scenario takes our simulated 2020 Census and eliminates omissions
and removes any erroneous enumerations. It assumes no missing or duplicated people in the
2020 Census count.
Official 2020 Census counts. We refer to published resident population and apportionment
census counts for the nation and states that were released on April 26, 2021, from the Census
Bureau compared with Urban’s data.
The State of the 2020 Census
Censuses are not conducted in perfect worlds; perfect censuses are impossible. Questions of accuracy
and fairness always emerge with the release of final counts, and the 2020 Census was no exception.
Court cases were launched in advance of the first release of 2020 Census numbers challenging its
accuracy.5 What matters, however, is not that a perfectly executed census occurred, but that the
magnitude of likely errors is tolerable and that resulting counts have utility for their intended purposes.
Events that occurred and decisions that were made in the decade leading up to Census Day on April
1, 2020, may have had more impact on the final counts than in previous decades. Traditionally hard-to-
count groups increased as a share of the population. Precensus funding shortfalls at key times limited

4 S I M U L A T I N G T H E 2 0 2 0 C E N S U S
the testing of new census procedures, and uncertainty was exacerbated by late disputes over census
content. Then the pandemic affected living arrangements, complicated in-person follow-up counts, and
delayed postenumeration data cleaning and other processes.
In this section, we describe the events leading up to Census Day, the prolonged period of fieldwork
and data processing because of the pandemic, and how these factors contribute to the accuracy and
fairness of the final counts. The challenging environment in which the 2020 Census was conducted
suggests the need for additional benchmarks—such as Urban’s microsimulation model—to assess the
2020 Census’s quality, accuracy, and fairness.
Factors Affecting the 2020 Census Count
The past decade was marked by several factors—both external to the census and driven by operational
changes within it—that have implications for the count’s completeness and fairness. They include
demographic change in the US, the political climate, the COVID-19 pandemic, natural disasters, and the
resulting operational changes made to the 2020 Census to account for changing times and realities.
DEMOGRAPHIC CHANGE
Since the 2010 Census, the United States has changed in ways that affect the overall accuracy and
fairness of the census counts. Data from the intervening decade suggest that there have been shifts in
the population that likely affected self-response and data quality in the 2020 Census; this is especially
important given what we know about those who have historically been the hardest to count (GAO
2018). Demographic changes such as an aging population, greater racial/ethnic diversity, shifts in
noncitizens, and lower rates of homeownership could contribute to differences in the count regardless
of other factors. We document demographic changes here and why they were factored into the 2020
Census projection data developed for this study.
Since 2010, the average age of the US population has increased.6 Historically, those ages 50 and
older have had higher percentages of overcounts in the census and those younger than age 5 have been
historically undercounted (Fernandez, Shattuck, and Noon 2018; O’Hare 2015). On balance, a shift to
an older population in the US in 2020 would have produced a smaller net undercount for the overall US
population but not necessarily a fairer count if children continued to be missed at higher rates.
Between 2010 and 2020, the US also became more racially and ethnically diverse.7 This has
implications for the 2020 Census because historically households with a non-Hispanic/Latinx white
head of household have had higher percentages of overcounts and lower percentages of being missed

S I M U L A T I N G T H E 2 0 2 0 C E N S U S 5
by the census, compared with Hispanic/Latinx, non-Hispanic/Latinx Black, Asian and Pacific Islander,
and American Indian and Alaska Native households (Elliott et al. 2019). For these reasons, we expect
greater racial/ethnic diversity likely contributed to a larger net undercount for the overall US
population.
Finally, homeownership decreased slightly from 2010 to 2020.8 Census researchers have found
that economically advantaged homeowners have the highest self-response rates, including by the
internet (Baumgardner, Griffin, and Raglin 2014). Further, renters are often noted as among the hardest
to count (GAO 2018). So a shift away from homeownership could have contributed to a larger net
undercount in the 2020 Census.
POLITICIZATION OF THE CENSUS
Political discourse about immigration, including attempts to add a citizenship question, may have
affected people’s willingness to participate in the 2020 Census. As early as September 2017,
researchers within the US Census Bureau found increased reluctance to participate in research
activities amid anti-immigration policies and rhetoric.9 This included the Muslim Ban, dissolution of the
DACA (Deferred Action for Childhood Arrival) program, and actions of ICE (Immigrant and Customs
Enforcement).10 This rhetoric contributed to unprecedented confidentiality concerns, particularly
among immigrants and people of color (Meyers 2017). Further, a 2020 Census study found that nearly
half of the study’s participants expressed some level of concern about the confidentiality of their
responses (McGeeney 2019).
Controversy over the last-minute addition of the citizenship question could have also heightened
growing fears and suppressed household participation. The untested question gained national media
attention, raising concerns of a potential chilling effect among some groups, including Hispanic/Latinx
people and immigrants (Baum et al. 2019; Kissam et al. 2019).11 In July 2019, a divided Supreme Court
ruled that the Commerce Department’s decision to include this question violated federal law.12 Even
with the question’s exclusion, the administration planned to use administrative records to try to
determine the US citizenship status of every adult at the block level (Deaver 2020, 6). For these reasons,
many experts assume that some households likely did not participate and noncitizens were missing from
household rosters, even when households responded, because of fear and government distrust. This
suggests possible further reduction of the 2020 count’s accuracy.

6 S I M U L A T I N G T H E 2 0 2 0 C E N S U S
COVID-19
As part of operational and budget planning, the Census Bureau factors in the possibility of a natural
disaster affecting its decennial data collection. In 2017, its cost estimate included a cushion of 10
percent additional funding in case of “unknown unknowns” that might emerge during fieldwork
(Goldenkoff and Powner 2018, 26). However, 2020 proved to be an extraordinary year, with natural
disasters like hurricanes, wildfires, and most notably, the COVID-19 pandemic.
The US government declared a pandemic on March 13, 2020,13 a day after the 2020 Census began
mailing information to households to participate (GAO 2020a). This timing likely affected census
participation in multiple ways. For those who were homebound and most likely to self-respond, having a
web-based option likely enhanced participation; nearly two-thirds of US households self-responded to
the census and primarily online.14 For those who are hardest to count, however, field operations and
staff hiring were delayed by the pandemic, in-person community-based outreach was halted, and public
health concerns about the safety of conducting in-person follow-up to nonresponsive households were
heightened (GAO 2020b). Indications exist that enumerating apartment dwellers became harder in
2020, in part because of the pandemic, further contributing to concerns about coverage.15
Such delays and postponements have prompted concerns about equity in the census. Communities
hardest hit by COVID-19 early in the pandemic tended to be those inhabited by the hardest to count,
including areas with lower incomes and Black and Hispanic/Latinx communities.16 Further, many
households and those living in dormitories and college towns relocated at the start of the pandemic,
raising concerns about how people would answer the census based on their usual residence during
COVID-19.17 In addition to delayed fieldwork, the schedules for data-processing activities and data
releases, such as the official apportionment counts and redistricting data released to the states, were
also extended.18 Overall, the full scope of the pandemic’s effects on the 2020 census, and particularly on
the hardest-to-count communities, will be better understood when additional quality metrics are
released from the Census Bureau and analyzed in depth (GAO 2020a).
OPERATIONAL CHANGES
Every decennial census adjusts its operational procedures to reflect technological advancements, the
changing patterns of society, or funding limitations. For the 2020 Census, the most significant
technological advancement was the introduction of a web-based option, or the Internet Self-Response
(ISR), for households to complete the count (Decennial Census Management Division 2018). This
change reflects the growing reach of technology, as well as the need to save on costs (US Census Bureau
2018). Although the Census Bureau had been using web-based approaches in other data-collection

S I M U L A T I N G T H E 2 0 2 0 C E N S U S 7
efforts—notably the American Community Survey—2020 was the first time it was not only available on
the census, but also actively encouraged as an option (US Census Bureau 2018).
Overall, the ISR was a successful operational change with 53.5 percent of US households answering
via the Internet, contributing to a total US self-response rate of 67 percent,19 surpassing what was
projected in official operational plans (US Census Bureau 2018). Higher self-response on the census is
generally associated with better quality data. A looming question, however, is whether duplications
increased because of ISR; households could respond via the Internet whether they provided their
household’s Census ID or not (Decennial Census Management Division 2018). Although other
identifiers can be used to deduplicate records if no Census ID is provided,20 it is likely that some
duplications persisted and contributed to a net overcount. Until additional data are released by the
Census Bureau about the ISR’s performance we will not know how it contributed to error.
Another advancement in the 2020 Census was the expanded use of administrative records—using
other government or private entity data—to verify addresses, improve nonresponse follow-up by
enumerators working in the field, and provide proxy data when households did not complete the census
(Deaver 2020). Originally, the Census Bureau intended to use administrative records in the 2020
Census only if multiple data sources substantiated the household and its residents (Deaver 2020).
Toward the end of the fieldwork period, which was curtailed by the pandemic and hurricanes, the
Census Bureau began using administrative records data for nonresponse households, even if only a
single source of such data were available because of perceived higher quality relative to alternatives
like imputation.21 Overall, 5.6 percent of all households were enumerated with administrative records
nationwide, but it remains unclear whether these data improved 2020 Census performance.22
Finally, to trim funding, better leverage field staff, and create a more efficient nonresponse follow-
up period, the 2020 Census introduced an innovative adaptive design that used technology and
paradata to assign work to enumerators in real time as cases opened and closed (Decennial Census
Management Division 2018). The approach was developed, tested, and researched throughout the
preceding decade to develop the dynamic approach applied in the 2020 Census (Konicki and Adams
2015). Based on developmental research, adaptive design likely improved data collection and reduced
errors.
As discussed, the COVID-19 pandemic created major operational adjustments, including delays in
the fieldwork and data-processing periods, a shortened field operations schedule, and changes in
protocols to accommodate new schedules. Funding shortfalls in the decade leading up to the 2020
Census also increased risks to its successful implementation (Goldenkoff and Powner 2018).
Innovations, whether planned or implemented mid-census, may have improved the quality of the final

8 S I M U L A T I N G T H E 2 0 2 0 C E N S U S
2020 Census data, but we will not have such insights until findings from the 2020 PES are released in
the coming year (GAO 2020a).
ACCOUNTING FOR FACTORS IN URBAN’S SIMULATED 2020 CENSUS
Overall, factors that may have influenced the 2020 Census—from real demographic change in the past
decade to operational changes to external factors like COVID-19 and political forces—have created a
situation with many unknowns. The data quality and outcomes of the 2020 Census could be less
predictable than in previous decades. Although self-response rates were higher than anticipated, early
evidence suggests that differential self-response rates by age and race could generate unfairness in the
final counts (O’Hare and Lee 2021; Santos 2020). Although groups external to the US Census Bureau,
including an American Statistical Association sponsored research panel, are investigating the quality of
the 2020 Census, such research relies on the Census Bureau’s own data quality indicators.23
Benchmarks external to the US Census Bureau that explore the quality of the 2020 Census are
needed. Urban’s microsimulation model is an effort to create external, yet plausible benchmarks
grounded in census data and derived independently. Accordingly, our simulated 2020 Census controls
for factors such as demographic shifts over the past decade and self-response rates to the 2020 Census
and adjusts for estimates of how households with noncitizens may respond to the census. Our simulated
2020 Census cannot control for factors that are harder to measure, such as pandemic-related obstacles,
elevated distrust in government, and late operational changes such as increased use of administrative
records. Nevertheless, Urban’s microsimulation data presents an innovative way to independently
evaluate the census by simulating it and creating alternative scenarios that help us better understand
the bounds of data quality and implications for our nation’s population from our once-a-decade count.
Methodology
The unique data presented in this report were created for this project as an additional benchmark to
assess the quality of the 2020 Census. They were created in a two-step process. First, we projected the
US population as of April 1, 2020, or Census Day, to estimate census counts overall and by demographic
groups and geography. Second, we used the projected census counts to adjust the population in
different ways to test scenarios and explore potential outcomes, such as apportionment and allocation
of federal Medicaid funding.

S I M U L A T I N G T H E 2 0 2 0 C E N S U S 9
Projecting the US Population
As a basis for our microsimulation model, we began with a single projection of the actual population on
April 1, 2020, or Census Day. In this section, we briefly describe our method for projecting the
populations of US states at census time, with specific details available in the appendix.
We started with estimates of 2015–19 combined American Community Survey (ACS) data from the
US Census Bureau with a total of 15,947,000 person-level cases. For every US state, we projected the
population by racial/ethnic groups, specifically non-Hispanic/Latinx white, Black, American Indian and
Alaska Native, Asian, Hawaiian and Pacific Islander, and Hispanic/Latinx of any race. Then, within each
racial/ethnic group in a state, we projected the population by age group. We then projected the
population living in households owned or mortgaged versus rented and finally projected the population
by household citizenship status.24 These population estimates provide the foundation for projecting
2020 miscounts.
We estimated the Census Day population by adjusting person-level analytic weights. We used
Demographic Analysis (DA) Population Estimates (Jensen et al. 2020), with populations by single years
of age, to calibrate and mature the US population weights from that provided in the 2015–19 ACS
dataset to the US Census Bureau estimates for April 1, 2020. We made separate adjustments at the
state level so the population estimates were consistent with the actual 2020 Census apportionment
counts by state.
How the Microsimulation Model Works
In the social sciences, a microsimulation model is a computer program that mimics the operation of
government programs and demographic processes on individual (“micro”) members of a population,
such as people, households, or businesses. For each observation in a large-scale, population-based
survey dataset, the computer program simulates outcomes of interest—such as how likely someone will
be undercounted or overcounted in the 2020 Census—by applying actual or hypothetical program rules
to the survey data about that observation. Each individual result is multiplied by whatever “weight” is
associated with the unit in the survey data that contributes to a population projection according to the
person’s demographic characteristics. The weighted individual results are added together to obtain
aggregate results, which, in this study, reflect the entire population of the US.
Microsimulation models require substantial time to develop and maintain but allow analyses usually
not supported by other models. Microsimulation models capture interactions between multiple
programs or policies, tabulate results by a wide variety of socioeconomic characteristics, and allow

1 0 S I M U L A T I N G T H E 2 0 2 0 C E N S U S
almost unlimited “what if” testing of prospective government policies. In this case, our “what if”
scenarios explore what both a simulated 2020 Census count and a hypothetical full count could look like
for the US by geography and demographics, as well as scenarios for apportionment and Medicaid
funding. See the appendix for additional methodological details about the microsimulation model’s
construction.
BOX 2
Urban’s Microsimulation Scenarios
Urban’s findings are derived from scenarios tested with our microsimulation model. These scenarios
start with Urban’s projected population data, calibrated to April 1, 2020, as their foundation.
First, we explore a “simulated 2020 Census” scenario to determine what the final 2020 Census
count—including miscounts—is most likely to be for the US population. We make a series of
adjustments to our projected US population based on factors known to influence the count’s
accuracy, including housing tenure, age, race and ethnicity, the presence of a noncitizen in a
household, and self-response rates to the 2020 Census. Thus, we simulate the likely 2020
Census environment and its limitations to achieving a complete count. This scenario answers
the question, “What will the final 2020 Census count be if we replicate known factors that will
produce miscounts?” In this scenario, we find that nationally, the 2020 Census likely produced
an average overcount of 3.6 percent and an average undercount of 4.1 percent, yielding a total
net undercount of the US population of 0.5 percent.
Second, we explore a “hypothetical full-count” scenario where we assume that there are no
overcounts or undercounts among anyone in the US population. For this scenario, we nullify
effects of net overcounts and net undercounts for all people. This scenario answers the
question, “What if the true resident population of the US were counted completely, accurately,
and only once?” Through this scenario, we explore the outcomes that a fair and accurate count
would produce.

S I M U L A T I N G T H E 2 0 2 0 C E N S U S 1 1
Findings
In this section, we present data for these scenarios for all states and the 20 largest metropolitan areas,
key demographic groups, and outcomes such as apportionment and Medicaid reimbursements by state.
Assessments of 2020 Census Performance for States and Large Metropolitan Areas
URBAN’S ASSESSMENT OF NATIONAL AND STATE MISCOUNTS IN THE 2020 CENSUS
According to the official 2020 Census counts released on April 26, 2021, the US population had
331,449,281 residents living in the 50 states and Puerto Rico on April 1, 2020.25 Urban produced a
simulated 2020 Census to understand how the 2020 Census likely performed when enumerating the
total resident population as of April 1, 2020. In this simulated 2020 Census, we account for shifting
demographics, past decennial census performance, operational changes, and self-response rates to the
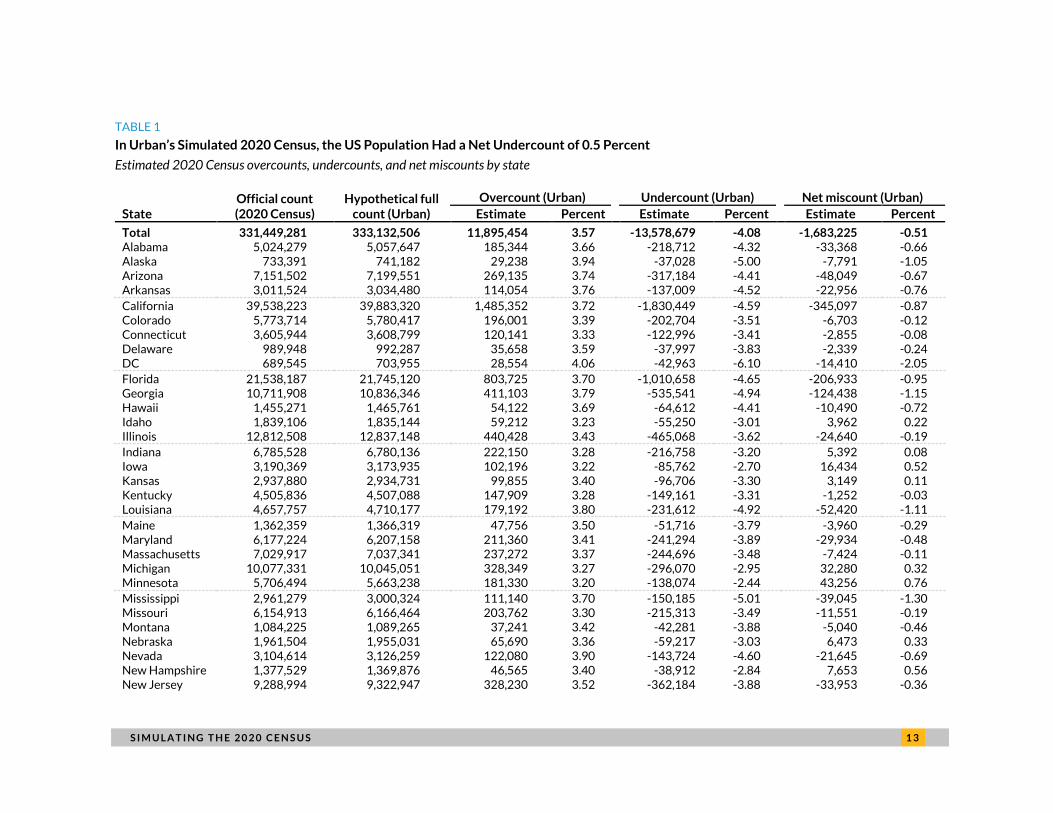
2020 Census. In Urban’s model, we find that the 2020 Census likely had 4.1 percent omissions
(undercounts) and 3.6 percent erroneous inclusions (overcounts), culminating in an overall net
undercount of 0.5 percent (table 1).
For comparison, the US Census Bureau’s PES found that the 2010 Census had 3.3 percent
omissions (i.e., undercounts not captured by imputation) counterbalanced by about 3.3 percent
overcounts, which produced a net undercount close to zero.26 We will not know the official accuracy
assessment of the 2020 Census until the US Census Bureau releases its PES results in late 2021 or early
2022.
If the 2020 Census were a full count—if all people were enumerated—we would have different
outcomes. In Urban’s hypothetical full-count scenario, we assume that being overcounted or
undercounted would not vary by demographic and other factors, as they do in Urban’s simulated 2020
Census, and it would be a fairer count. In other words, with our hypothetical full-count scenario, we
show what the true resident population is and assume everyone was counted once. In our hypothetical
full-count scenario, the US resident population is 333,132,506. This suggests that the US failed to count
1,683,225 people in 2020, with a net undercount of 0.51 percent (table 1).
In Urban’s simulated 2020 Census, some states had higher percentages of miscounts than others.
For example, Alaska, Georgia, Louisiana, Mississippi, New Mexico, New York, and Texas all had likely
undercounts that were greater than 1 percent of their population. Excluding the District of Columbia,
the highest net undercounts for states in Urban’s simulated 2020 Census were in Mississippi and Texas,
where 1.3 and 1.28 percent, respectively, of each state’s “true” total population was undercounted in

1 2 S I M U L A T I N G T H E 2 0 2 0 C E N S U S
our model. Because Texas has such a large population, this means that 377,187 residents in the true
population of Texas were not counted in the 2020 Census. Framed in different terms, this means that
more than one-fifth of all people not counted in the 2020 Census resided in Texas. A combination of
factors—including demographic diversity and lower self-response rates—contributed to undercounts in
these states. In Urban’s model, Texas had the largest undercount among the 50 states at 5.16 percent,
which is consistent with historical patterns (Elliott et al. 2019).
In contrast, four states—Iowa, Minnesota, New Hampshire, and Wisconsin—all had overcounts of
0.5 percent or more in Urban’s simulated 2020 Census. Minnesota had the highest net overcount in
Urban’s simulated 2020 Census, where 0.76 percent of its population was overcounted overall. This is
not surprising; Minnesota had the highest self-response rate with 75.1 percent of its population having
completed the 2020 Census on their own.27 This is reflected in Minnesota’s other notable distinction in
Urban’s model; it had the lowest undercount (2.44 percent) in the nation.
S I M U L A T I N G T H E 2 0 2 0 C E N S U S 1 3
TABLE 1
In Urban’s Simulated 2020 Census, the US Population Had a Net Undercount of 0.5 Percent
Estimated 2020 Census overcounts, undercounts, and net miscounts by state
State Official count (2020 Census)
Hypothetical full count (Urban)
Overcount (Urban) Undercount (Urban) Net miscount (Urban) Estimate Percent Estimate Percent Estimate Percent
Total 331,449,281 333,132,506 11,895,454 3.57 -13,578,679 -4.08 -1,683,225 -0.51 Alabama 5,024,279 5,057,647 185,344 3.66 -218,712 -4.32 -33,368 -0.66 Alaska 733,391 741,182 29,238 3.94 -37,028 -5.00 -7,791 -1.05 Arizona 7,151,502 7,199,551 269,135 3.74 -317,184 -4.41 -48,049 -0.67 Arkansas 3,011,524 3,034,480 114,054 3.76 -137,009 -4.52 -22,956 -0.76 California 39,538,223 39,883,320 1,485,352 3.72 -1,830,449 -4.59 -345,097 -0.87 Colorado 5,773,714 5,780,417 196,001 3.39 -202,704 -3.51 -6,703 -0.12 Connecticut 3,605,944 3,608,799 120,141 3.33 -122,996 -3.41 -2,855 -0.08 Delaware 989,948 992,287 35,658 3.59 -37,997 -3.83 -2,339 -0.24 DC 689,545 703,955 28,554 4.06 -42,963 -6.10 -14,410 -2.05 Florida 21,538,187 21,745,120 803,725 3.70 -1,010,658 -4.65 -206,933 -0.95 Georgia 10,711,908 10,836,346 411,103 3.79 -535,541 -4.94 -124,438 -1.15 Hawaii 1,455,271 1,465,761 54,122 3.69 -64,612 -4.41 -10,490 -0.72 Idaho 1,839,106 1,835,144 59,212 3.23 -55,250 -3.01 3,962 0.22 Illinois 12,812,508 12,837,148 440,428 3.43 -465,068 -3.62 -24,640 -0.19 Indiana 6,785,528 6,780,136 222,150 3.28 -216,758 -3.20 5,392 0.08 Iowa 3,190,369 3,173,935 102,196 3.22 -85,762 -2.70 16,434 0.52 Kansas 2,937,880 2,934,731 99,855 3.40 -96,706 -3.30 3,149 0.11 Kentucky 4,505,836 4,507,088 147,909 3.28 -149,161 -3.31 -1,252 -0.03 Louisiana 4,657,757 4,710,177 179,192 3.80 -231,612 -4.92 -52,420 -1.11 Maine 1,362,359 1,366,319 47,756 3.50 -51,716 -3.79 -3,960 -0.29 Maryland 6,177,224 6,207,158 211,360 3.41 -241,294 -3.89 -29,934 -0.48 Massachusetts 7,029,917 7,037,341 237,272 3.37 -244,696 -3.48 -7,424 -0.11 Michigan 10,077,331 10,045,051 328,349 3.27 -296,070 -2.95 32,280 0.32 Minnesota 5,706,494 5,663,238 181,330 3.20 -138,074 -2.44 43,256 0.76 Mississippi 2,961,279 3,000,324 111,140 3.70 -150,185 -5.01 -39,045 -1.30 Missouri 6,154,913 6,166,464 203,762 3.30 -215,313 -3.49 -11,551 -0.19 Montana 1,084,225 1,089,265 37,241 3.42 -42,281 -3.88 -5,040 -0.46 Nebraska 1,961,504 1,955,031 65,690 3.36 -59,217 -3.03 6,473 0.33 Nevada 3,104,614 3,126,259 122,080 3.90 -143,724 -4.60 -21,645 -0.69 New Hampshire 1,377,529 1,369,876 46,565 3.40 -38,912 -2.84 7,653 0.56 New Jersey 9,288,994 9,322,947 328,230 3.52 -362,184 -3.88 -33,953 -0.36

1 4 S I M U L A T I N G T H E 2 0 2 0 C E N S U S
State Official count (2020 Census)
Hypothetical full count (Urban)
Overcount (Urban) Undercount (Urban) Net miscount (Urban) Estimate Percent Estimate Percent Estimate Percent
New Mexico 2,117,522 2,139,618 82,674 3.86 -104,770 -4.90 -22,096 -1.03 New York 20,201,249 20,425,887 769,813 3.77 -994,452 -4.87 -224,638 -1.10 North Carolina 10,439,388 10,519,940 390,533 3.71 -471,085 -4.48 -80,552 -0.77 North Dakota 779,094 779,105 27,499 3.53 -27,509 -3.53 -11 0.00 Ohio 11,799,448 11,780,818 389,774 3.31 -371,144 -3.15 18,630 0.16 Oklahoma 3,959,353 3,990,397 151,670 3.80 -182,714 -4.58 -31,044 -0.78 Oregon 4,237,256 4,234,697 143,637 3.39 -141,078 -3.33 2,559 0.06 Pennsylvania 13,002,700 12,978,273 430,383 3.32 -405,956 -3.13 24,427 0.19 Rhode Island 1,097,379 1,103,296 37,866 3.43 -43,782 -3.97 -5,917 -0.54 South Carolina 5,118,425 5,165,533 192,617 3.73 -239,725 -4.64 -47,108 -0.91 South Dakota 886,667 884,886 28,904 3.27 -27,122 -3.07 1,781 0.20 Tennessee 6,910,840 6,938,559 245,177 3.53 -272,896 -3.93 -27,719 -0.40 Texas 29,145,505 29,522,692 1,144,787 3.88 -1,521,974 -5.16 -377,187 -1.28 Utah 3,271,616 3,266,586 108,421 3.32 -103,392 -3.17 5,030 0.15 Vermont 643,077 646,050 21,729 3.36 -24,702 -3.82 -2,973 -0.46 Virginia 8,631,393 8,642,370 292,085 3.38 -303,062 -3.51 -10,977 -0.13 Washington 7,705,281 7,697,407 255,717 3.32 -247,843 -3.22 7,874 0.10 West Virginia 1,793,716 1,802,367 64,598 3.58 -73,250 -4.06 -8,651 -0.48 Wisconsin 5,893,718 5,859,430 192,516 3.29 -158,228 -2.70 34,288 0.59 Wyoming 576,851 578,095 20,915 3.62 -22,159 -3.83 -1,244 -0.22
Sources: Urban’s Simulated 2020 Census data and the US Census Bureau’s 2020 Census Total Resident Population Counts.

S I M U L A T I N G T H E 2 0 2 0 C E N S U S 1 5
PERFORMANCE OF THE 20 LARGEST METRO AREAS IN THE 2020 CENSUS
According to Urban’s simulated 2020 Census, performance varied across different metro areas (figure 1).
The outcomes in different metro areas reflect their diverse populations, as well as whether they were in
areas with above- or below-average self-response rates. Minnesota and Wisconsin had above-average
self-response rates and an overcount in Urban’s model, so it is not surprising that the Minneapolis-St. Paul-
Bloomington, MN-WI metro area had an overcount in Urban’s model of more than 1 percent. In contrast,
the Miami, Los Angeles, and Houston metropolitan statistical areas (MSAs) had the largest undercounts
among the 20 largest MSAs at -1.7, -1.39, and -1.38 percent, respectively. The diversity of these metro
areas’ populations, including large numbers of Hispanic/Latinx, Black, and foreign-born residents who
have historically been undercounted in decennial censuses, as well as low self-response rates in the 2020
Census, culminate in higher percentages of undercounts relative to other metro areas.
FIGURE 1
The Miami Metropolitan Area Has an Undercount of More Than 1.7 Percent
Percent of total miscounts for the 20 largest metropolitan statistical areas
URBAN INSTITUTE
Source: Urban’s Simulated 2020 Census data.
-1.70%
-1.39%
-1.38%
-1.16%
-1.02%
-0.96%
-0.96%
-0.57%
-0.52%
-0.50%
-0.44%
-0.42%
-0.23%
-0.15%
-0.14%
0.08%
0.12%
0.33%
0.39%
1.07%
Miami-Fort Lauderdale-Wast Palm Beach, FL
Los Angeles-Long Beach-Anaheim, CA
Houston-The Woodlands-Sugar Land, TX
New York-Newark-Jersey City, NY-NJ-PA
Riverside-San Bernardino-Ontario, CA
Dallas-Fort Worth-Arlington, TX
Atlanta-Sandy Springs-Roswell, GA
Phoenix-Mesa-Scottsdale, AZ
Tampa-St. Petersburg-Clearwater, FL
San Diego-Carlsbad, CA
Washington-Arlington-Alexandria, DC-VA-MD-WV
Chicago-Naperville-Elgin, IL-IN-WI
San Francisco-Oakland-Hayward, CA
Philadelphia-Camden-Wilmington, PA-NJ-DE-MD
Boston-Cambridge-Newton, MA-NH
Seattle-Tacoma-Bellevue, WA
Denver-Aurora-Lakewood, CO
St. Louis, MO-IL
Detroit-Warren-Dearborn, MI
Minneapolis-St. Paul-Bloomington, MN-WI
1 6 S I M U L A T I N G T H E 2 0 2 0 C E N S U S
Probable Miscounts for Major Demographic Groups in the 2020 Census
Certain demographic groups have been historically harder to count in decennial censuses than others.
These groups include people of color, renters, and young children (GAO 2018). Structural inequalities
often contribute to this, and the pandemic exacerbated such challenges.28 Black and Hispanic/Latinx
adults were hardest hit by job loss and financial hardships during the first six months of the pandemic
(Karpman, Zuckerman, and Kenney 2020). Communities of color were hotspots for COVID-19 at the
same time the 2020 Census was beginning field operations in earnest.29 Apartment dwellers were
challenging to enumerate in the 2020 Census during the pandemic because of entry restrictions and a
lack of cooperation from building managers.30 Government distrust was high among foreign-born
communities because of politicization of the census in the years leading up to it.31 Considering the
additional health concerns, economic and political stressors, and access challenges affecting those who
are often hardest to count, it may have been even more challenging to enumerate them in 2020 amidst
so much uncertainty.32
Urban’s simulated 2020 Census data show that the demographic groups who have been historically
under- and overcounted will follow those same patterns in the 2020 Census (figure 2).33 Looking at
breakdowns by racial and ethnic identification, we see that more than 2 percent of Hispanic/Latinx
(2.17 percent) and Black people (2.45 percent) likely had a net undercount in the 2020 Census. In
contrast, the data show that 0.39 percent of the white population was net overcounted in the 2020
Census. These differences in Urban’s simulated 2020 Census are primarily driven by higher omissions in
the data for Black and Hispanic/Latinx people relative to white people (table 2).34
The implications of these miscounts are important for racial equity. Because the US has patterns of
residential segregation, an undercount of Black and Hispanic/Latinx people means that the communities in
which they live will miss out on their fair share of funding and resources. An overcount of white people
nationwide in the 2020 Census means their communities will receive more resources than they should.
This reinforces existing inequities in how health care, infrastructure, and political representation are
distributed for the next decade.

S I M U L A T I N G T H E 2 0 2 0 C E N S U S 1 7
FIGURE 2
More Than 2 percent of Black and Hispanic/Latinx People Were Likely Undercounted Overall
Percent of total miscounts by race and ethnicity in the 2020 Census
URBAN INSTITUTE
Source: Urban’s simulated 2020 Census data.
TABLE 2
Undercounts Drive Net Miscounts for Key Demographic Groups
Estimated 2020 Census overcounts, undercounts and net miscounts by key demographic groups
Demographic group Overcount
(Urban) Undercount
(Urban) Net miscount
(Urban)
Total 3.57 4.08 -0.51%
Race or ethnicity
Hispanic/Latinx, any race 4.15 6.32 -2.17% White or other 3.21 2.82 0.39% Black 4.46 6.91 -2.45% American Indian or Alaska Native 4.94 5.30 -0.36% Asian 3.44 4.04 -0.60% Hawaiian or other Pacific Islander 4.31 5.83 -1.52%
Age group
Birth to age 4 4.13 8.99 -4.86% Ages 5 to 9 3.50 3.62 -0.13% Ages 10 to 17 3.81 3.18 0.63% Ages 18 to 29 5.00 5.86 -0.87% Ages 30 to 49 2.93 4.78 -1.85% Ages 50 to 99 3.25 2.29 0.96%
Housing tenure
Owner 3.02 2.70 0.32% Renter 4.88 7.02 -2.13%
Noncitizen in household
No 3.46 3.51 -0.05% Yes 4.30 7.66 -3.36%
Source: Urban’s simulated 2020 Census data.
-2.17%
0.39%
-2.45%
-0.36% -0.60%
-1.52%
Hispanic/Latinx,any race
White Black American Indianor Alaska Native
Asian Hawaiian orother Pacific
Islander
US average,-0.5%

1 8 S I M U L A T I N G T H E 2 0 2 0 C E N S U S
In decennial censuses, young children have been historically undercounted, while older Americans
have tended to be overcounted (King, Ihrke, and Jensen 2018; O’Hare 2015). In 2010, children younger
than age 5 had the highest omission rates of any age group, which drove the undercount of young children
in that census (Decennial Statistics Studies Division 2016). In Urban’s simulated 2020 Census, we find that
young children again were likely net undercounted at higher rates than any other age group (figure 3). We
estimate that 4.86 percent of children younger than age 5 in the true US population were unlikely included
in the 2020 Census. This is because young children have higher omissions, or undercounts, in the data than
any other group—about 9 percent—which is not compensated for with overcounts. In contrast, nearly 1
percent of those older than age 50 were likely overcounted in the US (table 2).
FIGURE 3
Nearly 5 Percent of Children Younger Than Age 5 Were Likely Undercounted Overall
Percent of total miscounts by age group in the 2020 Census
URBAN INSTITUTE
Source: Urban’s simulated 2020 Census data.
In decennial censuses, renters have historically been among the hardest-to-count people (GAO
2018). This was likely in 2020 too; recent analyses of the 2020 Census show that census tracts with
majorities of renters had an average self-response rate 10 percent lower than all others (O’Hare and
-4.86%
-0.13%
0.63%
-0.87%
-1.85%
0.96%
Birth to age 4 Ages 5 to 9 Ages 10 to 17 Ages 18 to 29 Ages 30 to 49 Ages 50 to 99
US average,-0.51%

S I M U L A T I N G T H E 2 0 2 0 C E N S U S 1 9
Lee 2021). Although self-response is not the only way people and households are counted in the census,
it is an important marker of higher-quality data.35 Urban’s simulated 2020 Census data find that renters
likely had a net undercount of 2.13 percent, while homeowners likely had a 0.32 percent net overcount
(table 3). For renters, the net undercount was driven by high percentages of omissions, or undercounts,
at 7.02 percent.
The months and years leading up to the 2020 Census were also marked by growing hostility toward
foreign-born people. A chilling effect was reported among the foreign-born regarding their participation
in census activities as early as 2017.36 The 2020 Census was also marked by a failed attempt to add a
citizenship question to it37 and contributed to heightened distrust among noncitizens. Researchers
estimated that adding the citizenship question led to a 2.2 percentage point drop in self-response to the
2020 Census overall because of omissions among households with at least one noncitizen (Brown et al.
2019). These factors all suggest that noncitizens were an especially likely undercounted group in the
2020 Census. In Urban’s simulated 2020 Census, we find that those with noncitizens in the household
had a probable net undercount of 3.36 percent, driven by an especially high rate of omissions (7.66
percent) (table 2). These findings reflect research finding that respondents born outside of the US were
significantly more concerned than those born in the US that their answers on the 2020 Census would be
used against them (McGeeney et al. 2019). Lack of trust in the US Census Bureau safeguarding their
data would directly impact whether someone would willingly respond to the census.
How the 2020 Census Relates to Potential Funding and Apportionment Scenarios
The 2020 Census should be fair and accurate, not solely because data quality matters, but also because
so many federal decisions critical to US democracy are built on it. The 2020 Census data are used for
political decisionmaking, such as apportionment and redistricting, which determine representation at
the federal and local levels for the entire following decade. Data from the 2020 Census are also used to
allocate federal spending; more than 316 federal programs have their allocations determined using
decennial census data in some form (Reamer 2019). Thus, ensuring the 2020 Census data are high
quality matters a great deal for political and funding outcomes that affect all US residents.
Apportionment. Article 1, section 2 of the US Constitution states that an enumeration of the country
should be conducted every 10 years to determine how representatives are apportioned between the
states in the Union; apportionment is the reason we have a decennial census.38 To determine how the
435 representatives are allocated every 10 years, the US Census Bureau uses the decennial census data
to assign each state at least one representative, and the remaining 385 seats are then assigned based on

2 0 S I M U L A T I N G T H E 2 0 2 0 C E N S U S
population.39 Urban replicated the “method of equal proportions” used by the US Census Bureau on the
simulated data (see appendix for details).
In Urban’s hypothetical full-count scenario, we assume that all US residents in the true population
are counted once in the 2020 Census. This scenario is never likely to occur but helps us understand how
an optimal census scenario would relate to apportionment. In Urban’s hypothetical full count, we find
that only two states would have a different number of seats in the US House of Representatives than
what they had in the official 2020 Census results. In this scenario, Minnesota would lose a
representative (from 8 to 7) and New York would gain a representative (from 26 to 27).
Medicaid funding. In addition to apportionment, the 2020 Census is used to determine how to
allocate money to federally funded programs. The amount is not trivial, either. One recent estimate
found that more than 1.5 trillion dollars in federal funding is allocated to 316 programs using decennial
census counts, directly and indirectly (Reamer 2019). Medicaid is one of the largest programs that uses
census counts to distribute funds to states. In fiscal year 2017, Reamer (2019) estimated that federal
reimbursements to the states for programs based on the FMAP formula, such as Medicaid, was more
than $405 billion.
Because Medicaid funding is such an important way in which the decennial census counts have
direct relevance for states, their budgets, and their residents’ well-being, it can illustrate the impact of
an incomplete count. We present findings that calculate the FMAP for each state based on our
hypothetical full-count simulation where we assume that everyone is counted accurately and
completely and compare them with the FMAP calculated with the official 2020 Census counts. The
FMAP determines the percentage of a state’s Medicaid expenses that the federal government will
reimburse. It is derived from understanding state per capita income relative to the national estimate
and ranged from 50 to 78 percent in 2021.40 It is important to note that our FMAP calculations are a
proxy; many official data sources used by the Department of Health and Human Services to produce the
official numbers are not publicly available. So we have replicated this with comparable and up-to-date
data sources. See the appendix for additional information about our methodological decisions.
As the table below demonstrates, states where we estimate a net undercount would miss out on
tens of millions of dollars every year in Medicaid reimbursements (table 3). Texas notably would miss an
estimated $247 million in federal reimbursements for Medicaid in 2021. This is about 1 percent of what
they would be estimated to receive with their official census counts. Florida ($88 million), Louisiana
($46 million), Georgia ($47 million), North Carolina ($24 million), and Mississippi ($20 million) are
among those states that could miss out on large federal Medicaid reimbursements in 2021 because of

S I M U L A T I N G T H E 2 0 2 0 C E N S U S 2 1
2020 Census undercounts. The values range from 0.26 to 0.99 percent of the total federal Medicaid
reimbursements for these states.
In Urban’s simulated 2020 Census, we estimate that some states had net overcounts of their
populations. These overcounts mean that in the next decade, such states will receive more federal
Medicaid reimbursement money than if they had an accurate count. If each person were counted in the
2020 Census accurately, Pennsylvania would receive $215 million less in Medicaid reimbursements.
Ohio ($112 million), Minnesota ($156 million), and Michigan ($107 million) would each receive much
lower Medicaid reimbursements from the federal government, attributed to overcounts of their
populations. The values range from 0.74 to 2.33 percent of the total federal Medicaid reimbursements
for these states.
Of note, states with no difference in their funding under this scenario include Alaska, California,
Colorado, Connecticut, Maryland, Massachusetts, New Hampshire, New Jersey, New York,
Washington, West Virginia, and Wyoming. Except for West Virginia, these states have high per capita
income relative to the national per capita income, which means they routinely do not qualify for
reimbursements above the 50 percent minimum for reimbursements. This would not change in a
hypothetical full count either.
TABLE 3
Some States Miss Out on Millions of Federal Reimbursement Dollars by Not Counting All Residents
Estimated 2021 federal reimbursements for Medicaid to states, based on the FMAP (millions of dollars)
State
Federal Medicaid reimbursements using
official census count ($ millions)
Federal Medicaid reimbursement using
hypothetical full count ($ millions)
Difference in what states would receive in a
hypothetical full count ($ millions)
Total 345,744 345,263 -481 Alabama 4,318 4,323 5 Alaska 1,057 1,057 0 Arizona 8,829 8,843 14 Arkansas 4,916 4,926 10 California 44,368 44,368 0 Colorado 4,650 4,650 0 Connecticut 4,299 4,299 0 Delaware 1,331 1,326 -5 Florida 14,731 14,819 88 Georgia 7,257 7,304 47 Hawaii 1,243 1,247 4 Idaho 1,518 1,508 -9 Illinois 9,486 9,429 -57 Indiana 8,322 8,273 -49 Iowa 3,248 3,206 -42 Kansas 2,188 2,171 -18 Kentucky 7,447 7,421 -27

2 2 S I M U L A T I N G T H E 2 0 2 0 C E N S U S
State
Federal Medicaid reimbursements using
official census count ($ millions)
Federal Medicaid reimbursement using
hypothetical full count ($ millions)
Difference in what states would receive in a
hypothetical full count ($ millions)
Louisiana 8,063 8,109 46 Maine 1,855 1,850 -5 Maryland 5,904 5,904 0 Massachusetts 8,811 8,811 0 Michigan 11,909 11,802 -107 Minnesota 6,688 6,533 -156 Mississippi 4,290 4,310 20 Missouri 6,821 6,799 -22 Montana 1,206 1,206 -1 Nebraska 1,265 1,250 -15 Nevada 2,493 2,499 6 New Hampshire 999 999 0 New Jersey 8,046 8,046 0 New Mexico 3,877 3,892 15 New York 30,141 30,141 0 North Carolina 9,220 9,244 24 North Dakota 663 658 -5 Ohio 15,211 15,098 -112 Oklahoma 3,514 3,522 9 Oregon 5,566 5,522 -44 Pennsylvania 16,820 16,605 -215 Rhode Island 1,457 1,458 1 South Carolina 4,559 4,575 16 South Dakota 521 515 -5 Tennessee 6,862 6,856 -7 Texas 24,868 25,115 247 Utah 1,808 1,795 -13 Vermont 962 961 -1 Virginia 5,760 5,718 -42 Washington 7,480 7,480 0 West Virginia 2,932 2,932 0 Wisconsin 5,667 5,588 -78 Wyoming 297 297 0
Sources: US Bureau of Economic Analysis State Annual Personal Income 2020 (Preliminary), Urban’s hypothetical full-count data,
and the US Census Bureau’s 2020 Census Total Resident Population Counts.
Notes: Estimates are subject to rounding; the “Difference” column may be +/- 1 as a result. The District of Columbia is not
included because its FMAP reimbursements are fixed.
Medicaid is a straightforward example that illustrates how the census impacts federal funding
allocations to states because its formula directly uses population counts. In contrast, most other federal
funding allocations rely on counts by characteristics such as age or income to determine a more
selective population of eligibility (Reamer 2018). Consequently, our example may understate the full
effect an undercount could have on a community’s funding. For example, we know that children younger
than age 5 have historically been undercounted (O’Hare 2015). In Texas, the undercount of young
children was likely much higher than in most other states (Elliott et al. 2019). Federal funding allocations

S I M U L A T I N G T H E 2 0 2 0 C E N S U S 2 3
based on counts of young children will further disadvantage those in Texas, relative to other states, over
the next decade.
Data Considerations
This study is based on the best data available and is grounded in robust projections and microsimulation
methodologies. However, there are important limitations in our analyses and the assumptions we make
to produce these data. We feature overarching considerations here.
Our projections of the population used the best data sources available, but they have limits. Our
estimates of the census’s accuracy rely on data with distributions of individual and household
characteristics of states and geographical areas. Such characteristics include age, race, ethnicity,
citizenship, whether households are rented or owned, and local rates of self-response to the 2020
Census. The 2015–19 American Community Survey (ACS) has data on most of these characteristics, but
these data are themselves subject to error and require projection methods to mature the population to
Census Day. The data sources we used to calibrate the “maturing” of the population—namely the
Census Bureau’s 2020 Demographic Analysis and the 2020 Census itself—provided counts for the
national age distribution in 2020 and state population totals in 2020, respectively, but did not provide
information on all population characteristics we projected at the state level and are themselves subject
to uncertainty. As new information is made available and incorporated in our models, it will be possible
to further calibrate our estimates of the starting population on Census Day 2020.
Our models of the 2020 Census data’s accuracy are based on the 2010 Census and follow-up
surveys. We know that population shifts from 2010 to 2020 included some characteristics associated
with lower census accuracy in 2010 (such as an increased share of renter households), as well as some
characteristics associated with higher census accuracy in 2010 (such as an increased share of people
ages 50 and older). However, we cannot know the relationships between these population
characteristics and the 2020 Census’s accuracy until the Census Bureau releases findings from the
2020 PES. Further, there are reasons to anticipate that some relationships between population
characteristics and census accuracy will have changed amid the new circumstances of the 2020 Census.
For example, the shift from mail to internet as the primary mode of self-response will likely change the
relationship between Census accuracy and household renter or ownership status.
Our models of the 2020 Census data’s accuracy assumed no interactions between different
population characteristics. We know that multiple population characteristics affect census accuracy,
but past postcensus surveys such as the PES do not have the precision for estimating the degree of

2 4 S I M U L A T I N G T H E 2 0 2 0 C E N S U S
overlap of those characteristics. For example, part of the reason US people older than 50 had relatively
high rates of census representation in 2010 was that they tended to live in owned rather than rented
households. But the 2010 PES did not have the large sample sizes necessary to estimate how much the
variation in census accuracy by age was because of homeownership, for example. The appendix includes
details about the process for creating the study’s models of census accuracy across multiple individual
and household characteristics.
Some factors new to the 2020 Census were not incorporated in these analyses. Our data on
census accuracy are derived from the 2010 Census. As additional data are released about the 2020
Census’s performance, we will seek to incorporate additional factors in future analyses, including the
following:
More than half of all households responding to the 2020 Census did so via the internet.41 How
accurate were the responses of households who completed the census online rather than by
other modes? How did online responses affect differences in census accuracy by characteristics
of individuals and households (age, household tenure, citizenship, race and ethnicity, and new
factors such as household income)?
How did changes in the questions, new coding rules, and innovations in the use of
administrative records for imputation of missing data42 affect differences in census accuracy by
characteristics of individuals and households (age, household tenure, citizenship, race and
ethnicity)?
How did the special circumstances and population movements of the pandemic affect census
accuracy? For example, were challenges encountered enumerating the group quarters
population—particularly the college and university student housing population (GAO 2021)—
important for the count’s accuracy?
Did political division and government distrust affect 2020 Census participation and accuracy
for different demographic groups and geographic regions?
Because of these cited assumptions, the data we produce will not match the official estimates
precisely—including those for states, metro areas, and demographic groups—and could be subject to
future revisions as new data become available. All data-collection endeavors, including the decennial
census, are imperfect; the “true” number cannot be known. The 2020 PES and various data-quality
measures released by the US Census Bureau over time will shed light on some of these questions. For
now, we urge caution in interpreting these results, because we cannot yet account for the
aforementioned factors.

S I M U L A T I N G T H E 2 0 2 0 C E N S U S 2 5
Conclusion
Counting the US population every decade is an extraordinary effort. Years of research and planning go
into its execution on Census Day on April 1st at the start of each new decade. Typically, the decennial
census happens in predictable environments, and plans made by the US Census Bureau proceed
accordingly. This was not the case in 2020. The 2020 Census was conducted during a pandemic and
amidst politicization of its scientific work—threats to its execution not previously encountered.
Although no census is perfect, questions and concerns have been raised about the quality of the 2020
Census and whether the data will be as accurate as previous censuses (GAO 2020c; Thompson 2021).
The goal of Urban’s study was to address such questions about quality and provide additional data
about the 2020 Census’s accuracy and fairness.
Our simulation of the 2020 Census finds there was likely an overall 0.5 percent net undercount of
the US population. Although this is different from the 2010 count, which had near-perfect net accuracy,
it is perhaps not as severe an undercount as some have feared.43 Net accuracy is important, but fairness
also matters for the 2020 Census. We see considerable variation in who was undercounted and
overcounted overall in the 2020 Census. We find that the true total population of Mississippi and Texas
were undercounted in our simulated 2020 Census by 1.3 and 1.28 percent, respectively, while
Minnesota was net overcounted by 0.76 percent. Such differences matter for these states for the next
decade, as Mississippi and Texas residents will receive less of their fair share of federal funding for
infrastructure, health care, and children’s programs, while Minnesota residents will receive more. For
example, we find in our simulations that if residents had been counted accurately in the 2020 Census,
Texas would receive over $247 million more and Minnesota would receive $156 million less federal
Medicaid reimbursements in 2021. This illustrates the impact that a fair and accurate census has on
people’s well-being and how disparate these outcomes can be across the nation.
Similarly, we find that groups hardest to count in recent decennial censuses again were likely
undercounted in the 2020 Census. Black and Hispanic/Latinx people had a net undercount of more than
2.45 and 2.17 percent, respectively, in our simulated 2020 Census. Young children, or those younger
than age 5, were likely net undercounted by 4.86 percent. Nationwide, renters were likely
undercounted by 2.13 percent overall, and households with a noncitizen present were likely
undercounted by 3.36 percent overall. For these groups, equity issues arise—not only with the count’s
fairness, but also with how resources will be distributed and who will miss out on their fair share of
political representation and funding.
2 6 S I M U L A T I N G T H E 2 0 2 0 C E N S U S
It is impossible to change the outcomes of the 2020 Census, but with adequate planning and
innovation, the 2030 Census can be improved for the hardest-to-count groups and places. First, future
operational changes should be researched to better understand if their implementation will adversely
affect enumerating the hardest to count. The expanded use of administrative records, for example, may
not improve the enumeration of the hardest to count if they are also more likely to be missing from
those data sources (McClure, Santos, and Kooragayala 2017). Second, states and cities should be
supporting efforts to count their communities as completely as possible. Some have argued that
Arizona, Florida, and Texas could have lost potential seats in the US House of Representatives, in part,
because they did not sufficiently promote the census.44 Promoting participation in the 2030 Census will
benefit all states, cities, and residents within them. Third, adequate funding for the census matters—not
simply in the years where fieldwork is executed in earnest—and should be consistent and strong in early
years when testing and planning for innovations occur.45 These efforts are all possible but require us to
collectively recognize how critical it is to invest in the decennial census and value it as a core component
of our democracy.
The 2020 Census may have happened in an anomalous year. There may never be another census
conducted amidst attempts to politicize it and as the country shuts down because of a pandemic. What
is known, however, is that fully counting the nation’s population is becoming increasingly complicated.
Innovations are needed to better understand the quality of the census count, its fairness, and its
implications for the following decade. One potential innovation is Urban’s microsimulation model, which
offers insights on the quality of the decennial census from a data source external to the US Census
Bureau. Through our simulated 2020 Census, we provide an important evidence-based benchmark to
better understand the decennial census’s performance. Over the next decade, refinements made to this
model and new techniques from other researchers—both within and external to the US Census
Bureau—will become increasingly important tools to ensure that our once-a-decade enumeration
withstands threats and challenges to its quality in an increasingly complex nation.

A P P E N D I X 2 7
Appendix. Detailed Methodology To best understand the possible under- and overcounts in the 2020 Census, we created data in a two-
part process. First, we created a dataset with projections of the US population to April 1, 2020, and then
used those data to create a microsimulation model. Below we explain these processes, assumptions, and
scenarios for apportionment and Medicaid funding that we applied to the data.
Developing 2020 Population Estimates
We generated Census Day 2020 population estimates by geography, age group, race and ethnicity,
presence of noncitizens in the household, and household ownership or renter status, for the US
Household Resident Population for April 1, 2020 (Census Day). These population estimates provide the
foundation for projecting 2020 undercounts. The following definitions were used in generating the
2020 population estimates.
Race and ethnicity. For this study, we applied a “bridged race” approach to specifying race categories
that correspond with the race specifications used in the 2010 Census Coverage Measurement (CCM)
study—our data source for historical miscounts in the census (Keller and Fox 2012; Mule 2012).46 To be
consistent with racial and ethnic categories published in the CCM, we produce population projections
for the total population and the following categories: Hispanic/Latinx (all races), white (non-
Hispanic/Latinx), Black (non-Hispanic/Latinx), American Indian and Alaska Native (non-
Hispanic/Latinx), Asian (non-Hispanic/Latinx), and Hawaiian/Pacific Islander (non-Hispanic/Latinx).
Age. Age is identified in single years of age; then grouped into categories used in the 2010 CCM study:
from birth to age 4; ages 5 to 9, 10 to 17, 18 to 29, 30 to 49, and 50 and older.
Geography. Geography is identified at the state level and at the level of 2012-defined Public Use
Microdata Areas (PUMAs.) To merge and present information, we also identified the county of
residence and metropolitan area of residence, if applicable.
Household tenure. All individuals residing in households are identified as living in one of two kinds of
households: those owned or mortgaged versus those rented. Group quarters populations are an
additional category not included in the census accuracy estimates.

2 8 A P P E N D I X
Citizenship. All individuals are identified into two categories related to citizenship status: US-born and
naturalized citizens or noncitizens. All individuals are also identified as either living in a household with
at least one noncitizen or living in a household of only citizens.
Methodology for Creating Census Day Population Estimates
Data. The core dataset for our microsimulation model is the 2015–19 combined American Community
Survey (ACS), with a total of 15,947,000 person-level cases. The 2015–19 ACS has a set of analytic
weights that sum to 324,697,795 million US residents, so each “case” in the sample can be thought of as
a weighted entity representing about 20 US residents. The procedure for estimating the Census Day
population involved adjusting the person-level analytic weights for each case to project to April 1, 2020,
using the procedure described below. No person-level cases were added or subtracted from the ACS
dataset during the population estimation procedure—only the person weights were adjusted.
We used respondents’ detailed race self-reports in the ACS, including self-reports of multiple races,
“other race,” and missing data on race to assign all cases to a limited set of racial and ethnic categories.
We imputed categories for those missing race data. Each case with a “multiple race” response was
allocated to a single racial/ethnic category, based on bridged race-allocation ratios (Liebler and
Halpern-Manners 2008) and assignment according to a random draw from a uniform linear distribution.
The categories we assigned are as follows:
Hispanic/Latinx ethnicity, any race selected
non-Hispanic/Latinx ethnicity, white
non-Hispanic/Latinx ethnicity, Black
non-Hispanic/Latinx ethnicity, American Indian and Alaska Native
non-Hispanic/Latinx ethnicity, Asian
non-Hispanic/Latinx ethnicity, Hawaiian and Pacific Islander
We used the ACS person-level citizenship identifier and the household roster for each household to
develop an indicator of whether a person coresided with noncitizens in the same household.
We imputed county of residence from the PUMA variable. For instances where multiple counties
make up a single PUMA, we imputed county using probabilities based on a synthetic weighted total

A P P E N D I X 2 9
population average of the multiple counties. (We used this information to impute census self-response
rates in the respondent’s county of residence.)
Projection procedure. We used Demographic Analysis (DA) Population Estimates (Jensen et al. 2020),
with populations by single years of age, to calibrate and mature the US population weights from those
provided in the 2015–19 ACS dataset to the US Census Bureau estimates for April 1, 2020. Note that
these Census Day population estimates were created before the release of any actual 2020 Census
counts. We also incorporated separate adjustments by state so the population estimates were
consistent with the actual 2020 Census apportionment counts by state. To calibrate our simulated
population totals so the simulated census count would match the actual census count for each state, we
created a weighting adjustment equal to the ratio of each state’s simulated census count to that state’s
actual census count and applied that adjustment to each simulated person in the state. This adjustment
turned out to be minor. Our initial estimation of the census count was about 0.15 percent smaller than
the actual census count, so this additional adjustment had the cumulative effect of increasing the
estimated person weights for the entire US population by 0.15 percent.
Explaining the Microsimulation Model through Examples
The crux of this project and its analysis is tied to Urban’s creation of a microsimulation model to
understand the accuracy (with our simulated 2020 Census) and fairness (with our hypothetical full
count) of the 2020 Census. As described in the report, a microsimulation model is a computer program
that mimics the operation of government programs on individual members of a population. In our study,
we use our simulated 2020 Census scenario to understand likely over- and undercounts in the 2020
Census for the US population. We account for previous data on these patterns, including from the 2010
Census, the 2010 PES, and other census and expert research. In these data, each individual result is
multiplied by whatever “weight” is associated with the unit in the survey data. The weighted individual
results are added together to obtain aggregate results, which in this study reflect the population of the
US and different groups’ likelihood of being overcounted or undercounted in the 2020 Census. We then
take these data to create a hypothetical full-count scenario to explore what a fair count would look like
for the US if every person were counted and likely outcomes for apportionment and the allocation of
federal Medicaid funding.
The following example walks through the process for how a simplified computer program would be
designed to determine if a person would be counted more than one time in the 2020 Census. This
example is a simplification of our full methodology, which is described in more detail in the following

3 0 A P P E N D I X
section. Let’s assume that we have a population drawn from the most recent ACS data containing
information about each person with at least the following variables for adults: gender, age, marital
status, number of children, and a measure of family income.
The first step would be to determine the target number of people counted more than once. We
might, for example, take the rates from tables provided by the self-reported response rates in the
census. Using this rate and multiplying by the corresponding number of people in our survey in the same
group, we would arrive at the target number of people enumerated twice that we need to simulate to
match this assumed rate. For example, using a simple rate of 10 per 1,000 people, if we only had 100
people, we would expect one person to be counted more than once. If we had 10,000 people, we would
expect 100.
Next, we develop a model to calculate the probability that a person is counted multiple times in the
2020 Census. Suppose for our example’s sake that this probability is calculated via an equation and has
values somewhere between 0.015 and 0.03. The table below shows a very simplified example of what
might be calculated for 10 people.
TABLE A.1 Microsimulation Example, Based on Survey Data
Person ID
Probability of being enumerated twice in 2020
Census Uniform random number Probability: random
number 1 0.015 0.1830 -0.1680 2 0.026 0.7156 -0.6896 3 0.030 0.7010 -0.6710 4 0.022 0.6304 -0.6084 5 0.016 0.9937 -0.9777
6 0.015 0.7722 -0.7572 7 0.018 0.0142 0.0038 8 0.027 0.1376 -0.1106 9 0.015 0.3259 -0.3109 10 0.028 0.8894 -0.8614
The last step is to use a uniform random number drawn for each person for this event to choose the
people who will be selected as counted twice.
There are many ways this can be done. In a pure Monte Carlo simulation, we would choose the
people for whom the probability of being counted twice is greater than or equal to a random number. In
this case, that would simply be one person: Person ID 7.
If we want to hit the target rate exactly, we could calculate the expected number of people we want
to select, sort by the difference between the probability and the random number, and choose the

A P P E N D I X 3 1
expected number of people to count twice. If the model has been calibrated well, then running without
this alignment should produce results very close to those using the targets.
Alternately, we could use weights, as we do in practice in this model and describe below. This
weight can be adjusted to hit the targets. Again, if calibrated and performing well, the model will
produce similar results with and without alignment to targets.
Methodology for the 2020 Census Miscount Scenarios
The 2020 Census miscount analysis allows users to examine rates of erroneous enumerations (counts
of one person incorrectly identified as two) and of omissions (counts of one person incorrectly
identified as zero people, grouped according to geographic areas and demographic and household
characteristics).
Simulated 2020 Census: Estimates of Census Accuracy
We estimated the 2020 Census counts using a procedure that assigned each case in our population
dataset to a census outcome of accurately counted, omitted (i.e., not counted), or erroneously
enumerated (i.e., a person counted that was either a duplicate or otherwise associated with a count that
should not have been made, such as a child born on April 2, 2020, or later). The sum of such assignments,
weighted by the appropriate estimated person weights, resulted in weighted estimates of the census
count for each geographic area and for each demographic subpopulation within a demographic area.
Each case in the weighted sample is assigned a probability of an erroneous enumeration according
to the following stepwise process.
STEP 1: ADJUSTING FOR COUNTY CENSUS SELF-RESPONSE RATES:
In the first step, the county-specific percent self-response rate for each case is identified using 2020
Census data on county-specific self-response rates47 and matched to the case’s PUMA using crosswalk
files from the Missouri Census Data Center.48 Using estimates from 2010 Census PES Data (US Census
Bureau 2016), each case is given an initial probability of being erroneously enumerated or omitted
according to the following formula:
First-step probability of erroneous enumeration = P(erroneous enumeration, conditional on self-responding household in 2010)*(county proportion self-responding in 2020 Census)

3 2 A P P E N D I X
+ P(erroneous enumeration, conditional on not self-responding household in 2010)*(1 - county proportion self-responding in 2020 Census)
First-step probability of omission =
P(omission, conditional on self-responding household in 2010)*(county proportion self-responding in 2020 Census)
+ P(omission, conditional on not self-responding household in 2010)*(1 - county proportion self-responding in 2020 Census)
STEP 2: ADJUSTING FOR PRESENCE OF NONCITIZENS IN THE HOUSEHOLD
In the second step, all cases are identified as either residing in a household with only citizens or residing
in a household with at least one noncitizen.
Each case has its probability of an omission adjusted according to the estimated probabilities
reported by Brown and colleagues (2018) for being omitted from the American Community Survey if
one resides in a household with only citizens or in a household with at least one noncitizen, respectively.
To avoid overcounting the probability of omission because of the correlation between county self-
response rates and presence of noncitizens in the household, we summarize the first step probability of
omission at the population level based on the county distribution of cases residing with only citizens and
the county distribution of cases residing with at least one noncitizen, respectively.
Second-step probability of erroneous enumeration =
P(erroneous enumeration, conditional on whether there are noncitizen residents in the household) + First-step probability of erroneous enumeration, conditional on county self-response rate - Adjustment for population correlation between noncitizen residents in household and county self-response rate
Second-step probability of omission =
P(omission, conditional on whether there are noncitizen residents in the household) + First-step probability of omission, conditional on county self-response rate - Adjustment for population correlation between noncitizen residents in household and county self-response rate
STEP 3: ADJUSTING FOR HOUSEHOLD TENURE
In the third estimation step, all cases are identified as living in an owned or rented household (cases in
group quarters settings are not given any adjustments) and have their probabilities of incorrect census

A P P E N D I X 3 3
counts adjusted according to estimated omission and erroneous enumeration rates from the 2010
Census (Mule 2012).
Third-step probability of erroneous enumeration =
P(erroneous enumeration, conditional on whether there the case is in an owned or rented household) + Second-step probability of erroneous enumeration, conditional on county self-response rate and noncitizen households in residence - Adjustment for population correlation between household tenure and second-step probability of erroneous enumeration
Third-step probability of omission =
P(omission, conditional on whether there the case is in an owned or rented household) + Second-step probability of omission, conditional on county self-response rate and noncitizen households in residence - Adjustment for population correlation between household tenure and second-step probability of omission
STEP 4: ADJUSTING FOR RACE AND ETHNICITY
In the fourth estimation step, all cases are identified by combined racial and ethnic group and have their
probabilities of incorrect census counts adjusted according to estimated omission and erroneous
enumeration rates from the 2010 Census (Mule 2012).
Fourth-step probability of erroneous enumeration =
P(erroneous enumeration, conditional on racial and ethnic group) + Third-step probability of erroneous enumeration, conditional on county self-response rate, noncitizen households in residence, and household tenure - Adjustment for population correlation between racial/ethnic group and third-step probability of erroneous enumeration
Fourth-step probability of omission =
P(omission, conditional on racial and ethnic group) + Third-step probability of omission, conditional on county self-response rate, noncitizen households in residence, and household tenure - Adjustment for population correlation between racial/ethnic group and third-step probability of omission
STEP 5: ADJUSTING FOR AGE GROUP
In the fifth estimation step, all cases are identified by age group and have their probabilities of incorrect
census counts adjusted according to estimated omission and erroneous enumeration rates from the
2010 Census (Mule 2012). In addition, because of known correlation between errors in census counts

3 4 A P P E N D I X
for the 0–4 age group and in postenumeration survey counts for the 0–4 age group, an additional 3.9
percent is added to the omission rate for the 0–4 age group (O’Hare 2015).
Fifth-step probability of erroneous enumeration =
P(erroneous enumeration, conditional on age group) + Fourth-step probability of erroneous enumeration, conditional on county self-response rate, noncitizen households in residence, household tenure, and racial/ethnic group - Adjustment for population correlation between age group and fourth-step probability of erroneous enumeration
Fifth-step probability of omission =
P(omission, conditional on age group) + Fourth-step probability of omission, conditional on county self-response rate, noncitizen households in residence, household tenure, and racial/ethnic group - Adjustment for population correlation between age group and fourth-step probability of erroneous enumeration
STEP 6: ASSIGNMENT OF DISCRETE CENSUS COUNT OUTCOMES
As of step five, every case of the 15.947 million person records in our reweighted ACS microsimulation
dataset has a probability of an erroneous enumeration and a different probability of an omission. As a
final sixth step in this microsimulation implementation, each case is assigned a random draw from a
uniform linear distribution between 0 and 1, and then assigned a count of 0 (omission), 1 (accurately
counted), or 2 (erroneously enumerated) based on their random draw compared with their probabilities
of erroneous enumeration and omission.
Finally, these results were then calibrated (or “raked”) to the US Census Bureau’s official 2020
Census counts to derive the probabilities of miscounts among different groups.
Hypothetical Full-Count Scenario Methodology: Comparison with a Fair Census
There are two important ways to estimate census quality: through (1) accuracy, or the correspondence
of the overall count to the true overall population, and (2) fairness, or whether different groups and
geographic areas have similar outcomes. Our simulated 2020 Census scenario described above
assesses accuracy, so to assess fairness we developed a hypothetical full-count scenario for comparison
purposes in which rates of erroneous enumerations and omissions are essentially zero for all people.
This is Urban’s measurement of the true US population. From the six-step methodology described
above, that means that in the hypothetical full-count census scenario, each case in the entire simulation
is counted once.

A P P E N D I X 3 5
Apportionment Analysis
The apportionment of the 435 US House of Representative seats is determined every 10 years based on
resulting state-level population counts from the decennial census. It is a key function of the decennial
census; apportionment counts are the first release of data every decade, typically presented to the US
President on December 31 of a census year. Because of pandemic-related schedule delays, the 2020
apportionment counts were delivered on April 26, 2021.49
Apportionment is based on the Method of Equal Proportions, adopted by Congress in 1941. Under
this approach, the first 50 seats are assigned—one to each state—and the remaining 385 seats are then
allocated using an iterative process using priority values. 50
In this formula, V represents a priority value; P represents a state’s apportionment population; and
n represents the number of seats a state would have if it gained one seat. Because every state receives
at least one seat, calculations begin with n = 2. Consequently, in its first iteration the priority value for
each state’s second seat would equal its apportionment population divided by the square root of 2(2-1).
The calculations are then repeated for each value from n = 2 through n = 70. The value 70 is used for
convenience because no state has more than 60 seats. The resulting values (with associated states) are
then assembled and ranked to reveal the largest 385 values. This ranking determines which states
receive the remaining seats.
Funding Analysis and Hypothetical Full-Count Scenario
Overall, 316 federal programs encompassing more than $1.5 trillion use census counts in formulas that
allocate funding to different geographies, largely to states (Reamer 2019). Many funding formulas are
complex and use the census counts indirectly. But one formula, the Federal Medical Assistance
Percentage (FMAP), uses population counts more directly to determine the percentage of
reimbursement a state will receive on seven different federal programs, most notably Medicaid. These
seven programs constituted 27 percent of census count–based funding and more than $405 billion in
fiscal year 2017, underscoring how important the FMAP and accurate census counts are for states
(Reamer 2019).

3 6 A P P E N D I X
The FMAP formula for a state is: FMAPstate = 1 - ((Per capita incomestate)2 /(Per capita incomeUS.)2 *
0.45) (Mitchell 2020). Specifically, the FMAP is based on a ratio of the state’s per capita income relative
to the US total per capita income, which is then adjusted to ensure that no state’s ratio is lower than the
US ratio. Census counts matter for this process. They are the basis for the population estimates used to
calculate a state’s per capita income.51 In other words, a state’s total personal income (obtained from
sources other than the decennial census) is divided by its population estimate to determine each state’s
per capita income. The resulting per capita income for each state is then used in the FMAP formula.
Because state incomes and populations change routinely, a new FMAP is calculated for each fiscal year.
The FMAP guides the reimbursements states receive, and there is a federally mandated range of
minimum and maximum reimbursements. The minimum and maximum reimbursement rates for states
range from 50 cents to 83 cents for every dollar spent on programs that use the FMAP ratio (Mitchell
2020).52 In FY 2021,53 enhanced benefits were offered because of COVID-19, with a minimum of 65
cents and a maximum of 85 cents reimbursed for every dollar spent.54 Put simply, if a state has an FMAP
of 70 percent, then 70 cents of every dollar spent by that state on Medicaid would be reimbursed by the
federal government.
For FY 2021, 13 states received the minimum reimbursements (FMAPs of 50 percent; enhanced
FMAPs of 65 percent), including Alaska, California, Colorado, Connecticut, Maryland, Massachusetts,
Minnesota, New Hampshire, New Jersey, New York, Virginia, Washington, and Wyoming. For states at
the minimum, year-to-year changes in population counts rarely shift their FMAPs.55 For the other
states, FMAPs can vary from year to year and population counts may be important. In FY 2021,
Mississippi had the highest FMAP at 77.76 percent and an enhanced FMAP of 84.43 percent.
In our report, we explore how changes in the 2020 Census count might theoretically affect each
state’s FY 2021 FMAP and its resulting Medicaid reimbursements. The exercise in this paper is meant to
be illustrative and uses the following assumptions:
First, we use preliminary 2020 estimates of total state income from the Bureau of Economic
Analysis (BEA) rather than three-year averages of older data used in the official calculations.
For example, for the official FY 2021 FMAP calculated by the Department of Health and
Human Services, incomes from 2016, 2017, and 2018 from the US Bureau of Economic Analysis
were averaged and used to moderate year-to-year fluctuations (Mitchell 2020).56 We opt to
use the more recent 2020 preliminary estimates in our analysis.
Second, we produce state population estimates from a unique scenario used in these analyses
that assumes a hypothetical full count for the 2020 Census. To assume a hypothetical full

A P P E N D I X 3 7
count, we eliminate any probabilities of overcounts or undercounts for the entire US
population as determined through our simulated 2020 Census count. Thus, we assume
everyone in the US would be counted accurately and only once.
Third, the FMAP is then calculated using both sets of population counts, including the recently
released census total resident population counts and Urban’s estimates of a hypothetical full
count for the 2020 Census. State and national estimates from the official 2020 Census counts
and the hypothetical full count are used in the FMAP per capita income calculations.
Finally, we apply the new FMAPs to the most recent data on Medicaid spending for each state
from 2019, the most recent data available. This final step illustrates the differences in
reimbursements each state could hypothetically receive in FY 2021.57
Of note, we do not include additional adjustments to the FMAP, such as those for COVID-19, or
other state-specific income- or employer-based considerations.58
The resulting findings are instructive as to how population counts—particularly if they were fairer
in the 2020 Census—would theoretically affect federal funding allocations to the states.

3 8 N O T E S
Notes1 See “History: 1990 Overview,” US Census Bureau, accessed September 27, 2021,
https://www.census.gov/history/www/through_the_decades/overview/1990.html.
2 See also Mule (2012). Specifically, the 2010 Census had 10 million erroneous over-enumerations, which were mostly the same individuals duplicated at multiple locations. This was counterbalanced by about 10 million people omitted on net.
3 “2020 Census Quality and Data Processing Press Kit,” US Census Bureau, last updated September 3, 2021, https://www.census.gov/newsroom/press-kits/2021/2020-census-quality-and-data-processing.html.
4 Federal funding allocation for more than 100 programs, including Medicaid, Head Start, block grant programs for community mental health services, and the Supplemental Nutrition Assistance Program depend on census population counts. See Hotchkiss and Phelan (2017).
5 The state of Alabama challenged the Census Bureau’s policy of counting all US residents in 2018: “Alabama v. United States Department of Commerce,” Brennan Center for Justice, accessed September 27, 2021, https://www.brennancenter.org/our-work/court-cases/alabama-v-united-states-department-commerce.
6 Urban analyzed demographic trends in IPUMS (Integrated Public Use Microdata Series) data: “US Census Data for Social, Economic, and Health Research,” IPUMS USA, accessed September 27, 2021, https://usa.ipums.org/usa/.
7 “US Census Data for Social, Economic, and Health Research,” IPUMS USA.
8 “US Census Data for Social, Economic, and Health Research,” IPUMS USA.
9 Center for Survey Measurement, “Respondent Confidentiality Concerns,” memorandum for the associate directorate for research and methodology, September 20, 2017, https://www2.census.gov/cac/nac/meetings/2017-11/Memo-Regarding-Respondent-ConfidentialityConcerns.pdf.
10 Center for Survey Measurement, “Respondent Confidentiality Concerns.”
11 Mathiowetz Amicus Brief (Case 8:18), Kravitz et al. v. US Department of Commerce (2018).
12 Robert Barnes and Ann E. Marimow. “Supreme Court Puts Census Citizenship Question on Hold,” Washington Post, June 27, 2019, https://www.washingtonpost.com/politics/courts_law/supreme-court-puts-census-citizenship-question-on-hold/2019/06/27/6b2a49cc-93cb-11e9-b570-6416efdc0803_story.html.
13 “COVID-19 Disaster Declarations,” Federal Emergency Management Agency, last updated August 20, 2021, https://www.fema.gov/disasters/coronavirus/disaster-declarations.
14 Michael Bentley, “Examining Operational Quality Metrics,” Random Samplings (blog), US Census Bureau, April 26, 2021, https://www.census.gov/newsroom/blogs/random-samplings/2021/04/examining-operational-metrics.html.
15 Mike Schneider, “Census Takers Worry That Apartment Renters Were Undercounted,” Associated Press, July 5, 2021, https://apnews.com/article/lifestyle-health-coronavirus-pandemic-census-2020-government-and-politics-9aebdfb9c1b834352676d4b95f2d9ea0.
16 Robert Santos and Diana Elliott, “Is It Time to Postpose the 2020 Census?” Urban Wire (blog), Urban Institute, March 13, 2020, https://www.urban.org/urban-wire/it-time-postpone-2020-census.

N O T E S 3 9
17 Diana Elliott and Robert Santos, “Unpredictable Residency during the COVID-19 Pandemic Spells Trouble for
the 2020 Census Count,” Urban Wire (blog), Urban Institute, March 30, 2020, https://www.urban.org/urban-wire/unpredictable-residency-during-covid-19-pandemic-spells-trouble-2020-census-count.
18 US Census Bureau, “Census Bureau Statement on Redistricting Data Timeline,” press release, February 12, 2021, https://www.census.gov/newsroom/press-releases/2021/statement-redistricting-data-timeline.html.
19 “2020 Census: Tracking Self-Response Rates Map,” US Census Bureau, January 28, 2021, https://www.census.gov/library/visualizations/interactive/2020-census-self-response-rates-map.html.
20 Beth Jarosz and Paola Scommegna, “Why Are They Asking That? What Everyone Needs to Know about 2020 Census Questions,” March 23, 2019, https://www.prb.org/resources/why-are-they-asking-that-what-everyone-needs-to-know-about-2020-census-questions/.
21 Thomas Mule, “Administrative Records and the 2020 Census,” Random Samplings (blog), US Census Bureau, April 1, 2021, https://www.census.gov/newsroom/blogs/random-samplings/2021/04/administrative_recor.html.
22 Mule, “Administrative Records and the 2020 Census.”
23 Ron Jarmin, “2020 Census Processing Updates,” Director’s Blog (blog), US Census Bureau, February 2, 2021, https://www.census.gov/newsroom/blogs/director/2021/02/2020-census-processing-updates.html.
24 The group quarters population is included in our projections, but we lacked data to parse out changes for this group separately over the past decade.
25 US Census Bureau, “2020 Census Apportionment Results Delivered to the President,” press release, April 26, 2021, https://www.census.gov/newsroom/press-releases/2021/2020-census-apportionment-results.html.
26 US Census Bureau, “Census Bureau Releases Estimates of Undercount and Overcount in the 2010 Census,” press release, May 22, 2021, https://www.census.gov/newsroom/releases/archives/2010_census/cb12-95.html.
27 “2020 Census: Tracking Self-Response Rates Map,” US Census Bureau..
28 Santos and Elliott, “Is It Time to Postpone the 2020 Census?”
29 Maria Godoy and Daniel Wood, “What Do Coronavirus Racial Disparities Look Like State by State?” NPR, May 30, 2020, https://www.npr.org/sections/health-shots/2020/05/30/865413079/what-do-coronavirus-racial-disparities-look-like-state-by-state.
30 Schneider, “Census Takers Worry.”
31 Center for Survey Measurement, “Respondent Confidentiality Concerns,” memorandum for the US Census Bureau associate director for research and methodology, September 20, 2017, https://www2.census.gov/cac/nac/meetings/2017-11/Memo-Regarding-Respondent-Confidentiality-Concerns.pdf.
32 “Sworn Expert Declaration of Howard Hogan,” US District Court for the District of Maryland, Civil Action No. 8:19-CV-02710-PX, Brennan Center for Justice, September 1, 2020, https://www.brennancenter.org/sites/default/files/2020-09/Hogan_%20filed%202020-09-01_0.pdf.
33 Throughout our report, the terms Black, White, American Indian and Alaska Native, Asian, and Hawaiian and other Pacific Islander all represent non-Hispanic/Latinx people. We use the shorter terms in the text and the more specific terms in the tables.
34 There were coding changes in the US Census Bureau’s approach to race categories for this census; official 2020 Census data show that white counts were much lower than predicted and the Hispanic/Latinx and multiracial counts were much higher than predicted. It is unclear, however, how these coding changes related to patterns of

4 0 N O T E S
overcounts or undercounts by race and ethnicity in the 2020 Census. We assume differences exist, but at this point, we do not have enough evidence for our analysis.
35 “Increasing Self-Response,” US Census Bureau, last updated May 7, 2021, https://www.census.gov/programs-surveys/decennial-census/decade/2020/planning-management/plan/self-response.html.
36 Center for Survey Measurement, “Respondent Confidentiality Concerns.”
37 Barnes and Marimow, “Supreme Court Puts Census Citizenship Question on Hold.”
38 “Census in the Constitution: Why Jefferson, Madison, and the Founders Enshrined the Census in Our Constitution,” US Census Bureau, last updated March 30, 2020, https://www.census.gov/programs-surveys/decennial-census/about/census-constitution.html.
39 Kristin Koslap and Steven Wilson, “How Apportionment Is Calculated,” Random Samplings (blog), US Census Bureau, April 26, 2021, https://www.census.gov/newsroom/blogs/random-samplings/2021/04/how-apportionment-is-calculated.html.
40 For the duration of the pandemic, reimbursements have increased. See MaryBeth Musumeci, “Key Questions about the New Increase in Federal Medicaid Matching Funds for COVID-19,” Kaiser Family Foundation, May 4, 2020, https://www.kff.org/coronavirus-covid-19/issue-brief/key-questions-about-the-new-increase-in-federal-medicaid-matching-funds-for-covid-19/.
41 “2020 Census: Tracking Self-Response Rates Map,” US Census Bureau, accessed October 6, 2021, https://www.census.gov/library/visualizations/interactive/2020-census-self-response-rates-map.html.
42 Hansi Lo Wang, “What the New Census Data Can—and Can’t—Tell Us about People Living in the U.S.,” NPR, August 12, 2021, https://www.npr.org/2021/08/12/1010222899/2020-census-race-ethnicity-data-categories-hispanic.
43 Dartunorro Clark, “Early 2020 Census Data Stir Fears of Possible Latino, Asian Undercounts,” NBC News, May 10, 2021, https://www.nbcnews.com/politics/politics-news/early-2020-census-data-stir-fears-possible-latino-asian-undercounts-n1266633.
44 Dudley L. Poston and Rogelio Sáenz, “A Wasted Chance for a Third House Seat,” The Eagle, May 2, 2021, https://theeagle.com/opinion/columnists/a-wasted-chance-for-a-third-house-seat/article_f03b4cda-aa01-11eb-8af7-3b69fd474251.html.
45 Diana Elliott and Charmaine Runes, “An Underfunded 2020 Census Puts an Accurate Count at Risk,” Urban Wire (blog), Urban Institute, March 18, 2019, https://www.urban.org/urban-wire/underfunded-2020-census-puts-accurate-count-risk.
46 For person data, we used Thomas Mule (2012). For household data, we used Keller and Fox (2012).
47 US Census Bureau, “2020 Census: Tracking Self-Response Rates Map,” accessed September 27, 2021, www2.census.gov/programs-surveys/decennial/2020/data/tracking-response-rates/self-response-rates-map/decennialrr2020.csv.
48 “Geocorr 2018: Geographic Correspondence Engine,” Missouri Census Data Center, last updated December 4, 2018, https://mcdc.missouri.edu/applications/geocorr2018.html.
49 Kristin Koslap and Steven Wilson, “Apportionment Population Counts and What to Expect on Release Day,” US Census Bureau, April 26, 2021, https://www.census.gov/newsroom/blogs/random-samplings/2021/04/apportionment-population-counts.html.
50 Koslap and Wilson, “How Apportionment Is Calculated.”
51 See the definition of how the Bureau of Economic Analysis (BEA) calculates per capita income in “State Quarterly Income, 2020 (Preliminary) and State Quarterly Personal Income, 4th Quarter 2020,” BEA, news
N O T E S 4 1
release, last updated March 25, 2021, https://www.bea.gov/sites/default/files/2021-03/spi0321_3.pdf. Each state’s total personal income is divided by its population estimate to determine per capita income. The resulting per capita income for each state is then used in the FMAP formula.
52 See the definition of how the BEA calculates per capita income in “State Quarterly Income, 2020 (Preliminary) and State Quarterly Personal Income, 4th Quarter 2020,” BEA. Each state’s total personal income is divided by its population estimate to determine per capita income. The resulting per capita income for each state is then used in the FMAP formula.
53 FY 2021 spans from October 1, 2020, to September 30, 2021.
54 See the Federal Register from the Department of Health and Human Services with published FY 2021 FMAP rates here: Federal Financial Participation in State Assistance Expenditures; Federal Matching Shares for Medicaid, the Children’s Health Insurance Program, and Aid to Needy, Aged, Blind, or Disabled Persons for October 1, 2020, through September 30, 2021, 84 Fed. Reg. 66204 (December 3, 2019), https://www.federalregister.gov/documents/2019/12/03/2019-26207/federal-financial-participation-in-state-assistance-expenditures-federal-matching-shares-for.
55 The District of Columbia has its FMAP federally set at 70 percent with an enhanced FMAP of 79 percent in FY 2021. See also Federal Financial Participation in State Assistance Expenditures; Federal Matching Shares for Medicaid, the Children’s Health Insurance Program, and Aid to Needy, Aged, Blind, or Disabled Persons for October 1, 2020, through September 30, 2021, 84 Fed. Reg. 66204 (December 3, 2019).
56 Preliminary state annual income from the BEA can be located here: “State Annual Personal Income, 2020 (Preliminary) and State Quarterly Personal Income, 4th Quarter 2020,” BEA, news release, March 24, 2021, https://www.bea.gov/news/2021/state-annual-personal-income-2020-preliminary-and-state-quarterly-personal-income-4th.
57 State Medicaid expenditure data are available here: “Total Medicaid Spending,” Kaiser Family Foundation, accessed September 27, 2021, https://www.kff.org/medicaid/state-indicator/total-medicaid-spending/?currentTimeframe=0&sortModel=%7B%22colId%22:%22Location%22,%22sort%22:%22asc%22%7D.
58 See the Federal Register announcement about the FMAPs here for more information about specific adjustments that may be made to the FMAP: Federal Financial Participation in State Assistance Expenditures; Federal Matching Shares for Medicaid, the Children’s Health Insurance Program, and Aid to Needy, Aged, Blind, or Disabled Persons for October 1, 2020, through September 30, 2021, 84 Fed. Reg. 66204 (December 3, 2019).

4 2 R E F E R E N C E S
References ASA (American Statistical Association). 2021. “2020 Census State Population Totals: A Report from the American
Statistical Association Task Force on 2020 Census Quality Indicators, Final Report.” Alexandria, VA: ASA.
Baum, Matthew A., Bryce J. Dietrich, Rebecca Goldstein, and Maya Sen. 2019. Estimating the Effect of Asking about Citizenship on the U.S. Census: Results from a Randomized Controlled Trial. Cambridge, MA: Harvard Kennedy School Shorenstein Center on Media, Politics, and Public Policy.
Baumgardner, Stephanie K., Deborah H. Griffin, David A. Raglin. 2014. “The Effects of Adding an Internet Response Option to the American Community Survey.” Suitland, MD: US Census Bureau.
Brown, J. David, Misty L. Heggeness, Suzanne M. Dorinski, Lawrence Warren, and Moises Yi. 2018. “Understanding the Quality of Alternative Citizenship Data Sources for the 2020 Census.” Hillcrest Heights, MD: Center for Economic Studies, US Census Bureau.
———. 2019. “Predicting the Effect of Adding a Citizenship Question to the 2020 Census.” Demography 56 (4): 1173–94. https://doi.org/10.1007/s13524-019-00803-4.
Deaver, Karen D. 2020. Intended Administrative Data Use in the 2020 Census. Suitland, MD: US Census Bureau, Decennial Census Programs Directorate.
Decennial Census Management Division. 2018. 2020 Census Detailed Operational Plan for: 12. Internet Self-Response Operation (ISR). Suitland, MD: US Census Bureau.
Decennial Statistics Studies Division. 2016. Investigating the 2010 Undercount of Young Children - A New Look at 2010 Census Omissions by Age. Suitland, MD: US Census Bureau.
Elliott, Diana, Robert Santos, Steven Martin, and Charmaine Runes. 2019. Assessing Miscounts in the 2020 Census. Washington, DC: Urban Institute.
Fernandez, Leticia, Rachel Shattuck, and James Noon. 2018. The Use of Administrative Records and the American Community Survey to Study the Characteristics of Undercounted Young Children in the 2010 Census. Working Paper 2018-05. Washington, DC: US Census Bureau, Center for Administrative Records Research and Application.
GAO (Government Accountability Office). 2018. 2020 Census: Actions Needed to Address Challenges to Enumerating Hard-to-Count Groups. Washington, DC: GAO.
———. 2020a. “COVID-19 Presents Delays and Risks to Census Count.” Washington, DC: GAO.
———. 2020b. “Recent Decision to Compress Census Timeframes Poses Additional Risks to an Accurate Count.” Washington, DC: GAO.
———. 2020c. Census Bureau Needs to Assess Data Quality Concerns Stemming from Recent Design Changes. Washington, DC: GAO.
———. 2021. Decennial Census: Bureau Should Assess Significant Data Collection Challenges as It Undertakes Planning for 2030. Washington, DC: GAO.
Goldenkoff, Robert, and David A. Powner. 2018. Continued Management Attention Needed to Mitigate Key Risks Jeopardizing a Cost-Effective and Secure Enumeration. Statement before the House Subcommittee on Commerce, Justice, Science, and Related Agencies, Washington, DC: April 18.
Hotchkiss, Marisa, and Jessica Phelan. 2017. Uses of Census Bureau Data in Federal Funds Distribution: A New Design for the 21st Century. Suitland, MD: US Census Bureau.
Jensen, Eric B., Anthony Knapp, Heather King, David Armstrong, Sandra L. Johnson, Larry Sink, and Esther Miller. 2020. Methodology for the 2020 Demographic Analysis Estimates. Suitland, MD: US Census Bureau.

R E F E R E N C E S 4 3
Karpman, Michael, Stephen Zuckerman, and Genevieve M. Kenney. 2020. “Uneven Recovery Leaves Many Hispanic, Black, and Low-Income Adults Struggling: One in Four Adults Say Their Families Are Worse Off Six Months into the Pandemic.” Washington, DC: Urban Institute.
Keller, Andrew, and Tyler Fox. 2012. Census Coverage Measurement Estimation Report: Components of Census Coverage for the Household Population in the United States. Suitland, MD: US Census Bureau, Decennial Statistical Studies Division.
King, Heather, David Ihrke, and Eric Jensen. 2018. Subnational Estimates of Net Coverage Error for the Population Aged 0 to 4 in the 2010 Census. Paper presented at the Annual Meeting of the Population Association of America, Denver, CO, April 26–28.
Kissam, Edward, Richard Mines, Cindy Quezada, Jo Ann Intili, and Gail Wadsworth. 2019. San Joaquin Valley Latino Immigrants: Implications of Survey Findings for Census 2020. San Joaquin Valley Census Research Project.
Konicki, Scott, and Tamara Adams. 2015. “Adaptive Design Research for the 2020 Census.” Paper presented at the Joint Statistical Meetings, Seattle, WA, August 12.
Liebler, Carolyn A., and Andrew Halpern-Manners. 2008. “A Practical Approach to Using Multiple-Race Response Data: A Bridging Method for Public Use Microdata.” Demography 45 (1): 143–55. https://doi.org/10.1353/dem.2008.0004.
McClure, Dave, Robert Santos, and Shiva Kooragayala. 2017. “Administrative Records in the 2020 US Census: Civil Rights Considerations and Opportunities.” Washington, DC: Urban Institute.
McGeeney, Kyley, Brian Kriz, Shawnna Mullenax, Laura Kail, Gina Walejko, Monica Vines, Nancy Bates, and Yazmín García Trejo. 2019. 2020 Census Barriers, Attitudes, and Motivators Study Survey Report. Suitland, MD: US Census Bureau.
Meyers, Mikelyn. 2017. “Respondent Confidentiality Concerns and Possible Effects on Response Rates and Data Quality for the 2020 Census.” Presentation given at the National Advisory Committee on Racial, Ethnic, and Other Populations Fall Meeting, Suitland, MD, November 2.
Mitchell, Alison. 2020. “Medicaid’s Federal Medical Assistance Percentage (FMAP).” Washington, DC: Congressional Research Service.
Morris, Darcy Steeg, Andrew Keller, and Brian Clark. 2016. “An Approach for Using Administrative Records to Reduce Contacts in the 2020 Decennial Census.” Statistical Journal of the IAOS 32 (2): 177–88.
Mule, Thomas. 2012. Census Coverage Measurement Estimation Report: Summary of Estimates of Coverage for Persons in the United States. Suitland, MD: US Census Bureau, Decennial Statistical Studies Division.
O’Hare, William. 2015. The Undercount of Young Children in the U.S. Decennial Census. New York: Springer.
O’Hare, William P., and Jae June J. Lee. 2021. Who Responded in the 2020 Census? Variation in Tract Level Self-Response Rates in the 2020 U.S. Census. Working paper. Washington, DC: Georgetown Center on Poverty and Inequality.
Reamer, Andrew. 2019. Brief 7: Comprehensive Accounting of Census-Guided Federal Spending (FY2017) Part A: Nationwide Analysis. Washington, DC: George Washington University Institute of Public Policy.
Reamer, Andrew. 2018. “Estimating Fiscal Costs of a Census Undercount to States.” Washington, DC: George Washington University Institute of Public Policy.
Santos, Robert L. 2020. “Risk Factors Affecting the Fairness and Accuracy of the 2020 Census.” Statement before the House Committee on Oversight and Reform, Washington, DC, December 3.
Thompson, John. 2021. “Understanding the Quality of the 2020 Census Is Essential.” Harvard Data Science Review 3 (1): 1–8. https://doi.org/10.1162/99608f92.9ce979be.
US Census Bureau. 2018. 2020 Census Operational Plan: A New Design for the 21st Century. Suitland, MD: US Census Bureau.

4 4 A B O U T T H E A U T H O R S
About the Authors
Diana Elliott is a principal research associate in the Center on Labor, Human Services, and Population.
She conducts original research, provides technical assistance, and writes about social and economic
policy issues. Her work focuses on an equitable 2020 Census, work-based learning programs like
apprenticeship, and family financial security and economic mobility. Elliott was previously research
manager of the Pew Charitable Trusts’ work on financial security and economic mobility, where she was
instrumental in fielding a major national survey on American family finances and published numerous
reports and briefs about the state of financial well-being and economic mobility in the United States.
Before joining Pew, Elliott was a family demographer in the fertility and family statistics branch in the
Social, Economic, and Housing Statistics Division at the US Census Bureau. Elliott holds a PhD in
sociology from the University of Maryland, College Park.
Steven Martin is a senior research associate in the Center on Labor, Human Services, and Population,
and a sociologist and demographer with a range of experience working with data on social, economic,
and demographic events. His recent projects include research on the development of projections for
population, housing needs, school enrollment, and census undercounts. Dr. Martin also assists with
designing microsimulation models for how childhood experiences affect lifetime social mobility and the
development of actuarial models for analyzing trends in mortality across the life course. His published
work emphasizes the development of data and methods for studying the relationships between events
across the life course, including time use, quality of life measures, attitudinal measures, and a variety of
other work with survey, census, and vital statistics data. Martin has a PhD in sociology from the
University of Wisconsin–Madison. His undergraduate training was in biology at the University of
California, Berkeley, with an emphasis on evolutionary biology; he also earned teaching credentials for
middle and high school science and mathematics.
Jessica Shakesprere is a research analyst in the Center on Labor, Human Services, and Population. She
applies quantitative and qualitative methods, focusing on place-based economic mobility and
community development as well as public housing service delivery to support families and young
people. Shakesprere holds a BS in biology and a BA in political science from the Ohio State University,
where she graduated with honors and research distinction.

A B O U T T H E A U T H O R S 4 5
Jessica Kelly is the director of research and web technology in the office of technology and data science
at the Urban Institute, where she has worked for 20 years. She leads a team of junior and senior
programmers, developers, and engineers who serve as a bridge between technology and research. Her
team specializes in microsimulation modeling, statistical programming, data analysis, web applications,
web interfaces, and databases. They work with research staff to understand and shape project goals and
produce various technical components for research projects. Kelly also serves as coeditor of
Data@Urban. Kelly is the author of Federal Justice Statistics Program Data Linking System, a technical
report submitted to the US Department of Justice in 2012 on the linking system she developed. Kelly
has a bachelor’s degree in mathematics from Towson University.

ST A T E M E N T O F I N D E P E N D E N C E
The Urban Institute strives to meet the highest standards of integrity and quality in its research and analyses and in the evidence-based policy recommendations offered by its researchers and experts. We believe that operating consistent with the values of independence, rigor, and transparency is essential to maintaining those standards. As an organization, the Urban Institute does not take positions on issues, but it does empower and support its experts in sharing their own evidence-based views and policy recommendations that have been shaped by scholarship. Funders do not determine our research findings or the insights and recommendations of our experts. Urban scholars and experts are expected to be objective and follow the evidence wherever it may lead.

500 L’Enfant Plaza SW
Washington, DC 20024
www.urban.org