simple lock-in technique for thickness measurement of metallic plates
TRANSCRIPT

IEEE TRANSACTIONS ON INSTRUMENTATION AND MEASUREMENT, VOL. 63, NO. 2, FEBRUARY 2014 479
Simple Lock-In Technique for ThicknessMeasurement of Metallic Plates
Ermanno Pinotti and Ezio Puppin
Abstract— Eddy-current techniques are largely employed formeasurements of thickness and conductivity of metallic plate,and layers. In these measurements, an alternating voltage isapplied to a magnetizing coil placed over the metallic plate andits impedance is measured as a function of the frequency. Theeddy currents induced into the plate produce a magnetic field thatcouples with the coil, and the resulting impedance depends on themetal plate conductance and thickness. It has been found that thephase of the inductance is an especially useful parameter. In thispaper, we propose a lock-in method to extract the phase signatureand to relate it to the plate conductance and thickness and to thethickness of possible insulating coatings. The equipment neededfor the measurement is simple and inexpensive if compared toimpedance meters usually employed.
Index Terms— Eddy current, frequency peak, lock-in, thicknessmeasurement, variable frequency.
I. INTRODUCTION
IF A MAGNETIZING coil, powered by an alternatingcurrent, is placed near a metallic object, the variable
magnetic field induces into this latter a distribution of eddycurrents, whose amplitude and phase depends on many para-meters: object material and geometry, coil dimensions andposition, signal amplitude, and frequency. These induced cur-rents generate their own magnetic field, which depends onthe object geometry and its electrical and magnetic properties.By detecting this field, these characteristics could in principlebe extracted, giving important information about the objectproperties. However, in the general case, this problem ismathematically intractable, and it has been solved only forsimple geometries [1]: a cylindrical coil above a metal plate,or wound around a cylindrical conductor. Even in this case, theexact solutions are quite complex and can be managed only bynumerical methods or by suitable approximations. This com-plexity notwithstanding, the method of eddy-current testinghas been considerably developed and became an importanttechnological tool [2].
One of the most important applications of this method isthe determination of conductance and thickness of metal platesand layers, where a considerable precision can be attained [3].In this kind of measurements, a field coil is placed abovethe metal plate, it is excited with an alternating current, andits impedance is measured. This latter is then compared to
Manuscript received February 5, 2013; revised June 20, 2013; acceptedJune 21, 2013. Date of publication September 20, 2013; date of current versionJanuary 2, 2014. The Associate Editor coordinating the review process wasDr. Sergey Kharkovsky.
The authors are with CNISM, Milano 20133, Italy, and also with Politec-nico di Milano, Department of Physics, Milano 20133, Italy (e-mail:[email protected]; [email protected]).
Color versions of one or more of the figures in this paper are availableonline at http://ieeexplore.ieee.org.
Digital Object Identifier 10.1109/TIM.2013.2278999
the coil impedance as measured without the metal plate: theimpedance difference contains information about the platethickness and conductance. Depending on the measurementmethod, the real [3] or imaginary [5] part of the impedanceis studied. The work of Yin et al. [4] demonstrated that thephase signature is of particular interest when measuring theplate thickness, as it is sensitive to this parameter and relativelyinsensitive to other measurement circumstances, as, e.g., theliftoff, i.e., the distance between the plate and the measuringcoil [6]. However, the coil impedance technique has somedrawbacks.
1) The phase dependence on the frequency demonstrated in[4] is relatively featureless, as it smoothly decreases forincreasing frequencies. In order to simplify and possiblyautomate the measurement, it would be useful to havea prominent feature, like a peak at a given frequencyrelated to the plate thickness. It has to be pointed outthat such a peak exists in the imaginary part of theimpedance [5].
2) Measuring the impedance with a good precision requiresan impedance bridge or impedance meter, which can becomplex and expensive. By concentrating the measure-ment on the phase only, it is possible to use simple phasecomparators, already existing as inexpensive integratedcircuits.1
In this paper, we show how it is possible to overcome thesedrawbacks, and obtain a simple instrument, which could inprinciple be automated.
II. THEORY
Let us consider a field coil, having radius r0, length h, andn turns per unit length, placed above a metal plate of thick-ness c (Fig. 1) and very large lateral extension. The metal isnonmagnetic and has conductivity σ . The distance between thefield coil and the metal place (the liftoff) is l1. A sinusoidalcurrent I0 × sin(ωt) in this coil produces a magnetic field thatinduces eddy currents into the metal plate. These currents, inturn, produce a magnetic field, which adds to the main field;both are detected by a pickup coil having radius rp placed atthe lower end of the field coil and concentric to it.
The voltage signal induced in one turn of the pick-up coilis given by [1]
V = jω × 2π × rp × A(rp, l1
)(1)
where A(rp, l1) is the vector potential generated by both themagnetizing coil current and the eddy currents, evaluated at
1An example, employed in this paper, is the CD4046 phase comparator,belonging to the 4000 series of digital building blocks.
0018-9456 © 2013 IEEE

480 IEEE TRANSACTIONS ON INSTRUMENTATION AND MEASUREMENT, VOL. 63, NO. 2, FEBRUARY 2014
Fig. 1. Schematic representation of the experimental arrangement. Field coilproduces a varying magnetic field that induces eddy currents into the metalplate. Pickup coil senses the total magnetic field.
the position of the pick-up coil. This potential is given by [1]
A(rp, l1
) = 1
2μ0 × I ×
∞∫
0
1
αJ1 (α · r0) × J1
(α · rp
)
× [1 − exp(−αh)
] ×[1 − F (α)×e−2αl1
]×dα
(2)
where I is the complex (magnitude and phase) magnetizingcurrent, α is an integration parameter, J1 is the Bessel func-tions of first kind and first order, and F(α) is the function
F (α) =(α2
1 − α2) − (
α21 − α2
) × exp (2α1c)
(α1 − α)2 − (α1 + α)2 × exp (2α1c)(3)
with
α1 =√
α2 + jω × μ0 × σ . (4)
The complexity of these expressions makes difficult the ana-lytical calculation of the phase of the pickup signal V (ω).A great simplification is possible by using an approximation,already described in [5], which we will extend further. TheBessel functions can be approximated with a damped sine [8],
and (2) becomes
A(rp, l1
) = μ0
2I ×
∞∫
0
2
π√
rpr0× 1
α2 sin(αrp − π
4
)
× sin(αr0 − π
4
)× [
1 − exp(−αh)]
×[1 − F (α) × e−2αl1
]× dα.
This expression makes clear the oscillating behavior of theintegrand; there is a shorter oscillation period of 2π /r0 anda longer one of 2π /rp (in terms of the α variable). Withthe dimensions of our coil, the shorter period is ∼500 andthe longer one ∼4000; with such numbers, the term 1/α2
makes the integrand negligible after a few short periods orone long period at most. Instead, the function F(α) is aratio between two quantities having the same exponential (andpower) dependence on α, and therefore does not change verymuch in such a short interval.
This means that, as done in [5], the expression 1 − F(α) ×exp(−2αl1) can be evaluated at a suitable value α0 of theintegration variable, and taken out of the integral
A(rp, l1
) ∼= 1
2μ0 × I ×
[1 − F (α0) × e−2α0l1
]
×∞∫
0
1
αJ1 (α · r0)×J1
(α · rp
)×[1−exp (−αh)
]dα.
(5)
The integral is now a purely real function, and therefore affectsonly the signal magnitude, while the phase is entirely con-tained in the term between square brackets before the integral.An important point is the value α0 at which the function F(α)is evaluated. This value is related to the product of Besselfunctions appearing into the integral; an argument based totheir asymptotic expansion [8] suggests that it should be thereciprocal of the geometrical mean between the dimensions offield coil and pickup coil
α0 = 1√r0rp
. (6)
Approximation of (5) in (1) yields the phase differencebetween the pickup signal V and the magnetizing current I
� V − � I = π
2+ �ϕ = π
2− �
[1 − F (α0) × e−2α0l1
](7)
where π /2 is the fundamental phase shift from the Faraday’slaw and �ϕ is the additional phase shift due to the metal plate.This term contains the information about the plate thicknesswe want to extract.
The above expression is easier to evaluate than the exactresult, but it can be further simplified and expressed in termsof a universal function. By series expansion of the exponentialterms in (3) and after a lengthy algebra, it turns out that thephase difference can be expressed as
�ϕ ∝ − 2z
1 + z2 (8)

PINOTTI AND PUPPIN: SIMPLE LOCK-IN TECHNIQUE 481
102 103 104 105 106-30
-25
-20
-15
-10
-5
0
Pha
se d
iffer
ence
Δϕ
[de
g]
Frequency [Hz]
Thickness(mm)
0.03 0.1 0.3 1 3
Fig. 2. Theoretical phase difference, calculated after (7), between themagnetizing current and pickup voltage as a function of the current frequencyfor copper plates of increasing thickness. Fundamental phase shift of π /2 ofthe Faraday’s law has been subtracted from the phase.
where z is a normalized frequency
z = ω
ωN(9)
with
ωN = 2α03√
α0l1× 1
μ0σ× 1
c. (10)
This approach yields a universal equation (8), which gives afunction for the phase difference �ϕ(z) valid for any platematerial and thickness, and measurement parameters. Thefitting of the curve to the actual case is made by a singleparameter, i.e., the normalization frequency ωN .
In order to assess this result, we evaluated numerically thephase difference given by (3) and (7) for a series of copperplates, with thickness ranging from 30 μm to 3 mm, for theexperimental arrangement described in the following sections;the results are shown in Fig. 2. Then, we scaled the frequencyaxis for each curve, as specified by (9) and (10) by using theappropriate thickness c for each plate. The resulting curves(normalized to the maximum phase) are shown in Fig. 3: it isevident that they collapse to this universal form of (8), alsoplotted in Fig. 3.
The phase difference shows a clear peak, which is shiftedtoward lower frequencies as the plate thickness increases. Thepresence of the peak can be broadly explained as follows. Thepickup coil senses the sum of two magnetic fields: the mainfield (due to the field coil) and the induced field, generatedby the eddy currents. These two fields are in time-quadrature,because the latter is induced by the former after the Faraday’slaw. Therefore, the phase angle of the resulting total field (withrespect to the main field, taken as a reference) depends on their
10-2 10-1 1 10 102
-1.0
-0.8
-0.6
-0.4
-0.2
0.0
Nor
mal
ized
pha
se d
iffer
ence
Normalized frequency z
Thickness (mm) 0.03 0.1 0.3 1 3
Fig. 3. Phase curves of Fig. 2 normalized to their peak value, and plottedagainst the normalized frequency of (9) and (10), collapse to a single curve.
relative magnitudes (cfr. Fig. 4): if the main field dominates,the phase angle is small; if the induced field dominates, thephase angle tends to π /2. The main field remains constantas the frequency changes, if the latter is sufficiently lowto ignore the coil self-inductance and the skin effect in itswinding. Therefore, it is the magnitude of the induced fields,which establishes the total phase angle. When the frequencyincreases, two opposed effects are at play in establishingthe magnitude of the induced field. First, by increasing thefrequency the rate of change dB/dt of the main field increases,and so does the induced electrical field that generates the eddycurrents in the plate. When these currents increase, the inducedfield grows and so does the phase difference sensed by thepickup coil. But, as the frequency increases further, the skineffect confines the eddy currents in a progressively thinnerlayer near the surface, whose resistance is higher. Thus, theeddy currents magnitude decreases, and so does the inducedfield. Therefore, the magnitude of the induced field (and thusthe phase angle) benefits from higher frequencies, up to thepoint where the eddy currents do not fill any more the entiremetal thickness, but begin to be confined to a progressivelythinner region. Roughly speaking, the largest effect shouldhappen at the maximum frequency at which the whole metalplate is still occupied by the eddy currents, just before the skineffect kicks in. The peak frequency thus increases for smallerplate thickness.
III. EXPERIMENTAL
The experimental arrangement is shown in Fig. 5. A mag-netizing coil having diameter 2.5 cm, height 4 cm, andself-inductance of 140 μH is powered through a resistorR =120 �. Parasitic inductance and capacitance of thisresistor were < 1 nH and 10 pF, respectively, and its frequency
482 IEEE TRANSACTIONS ON INSTRUMENTATION AND MEASUREMENT, VOL. 63, NO. 2, FEBRUARY 2014
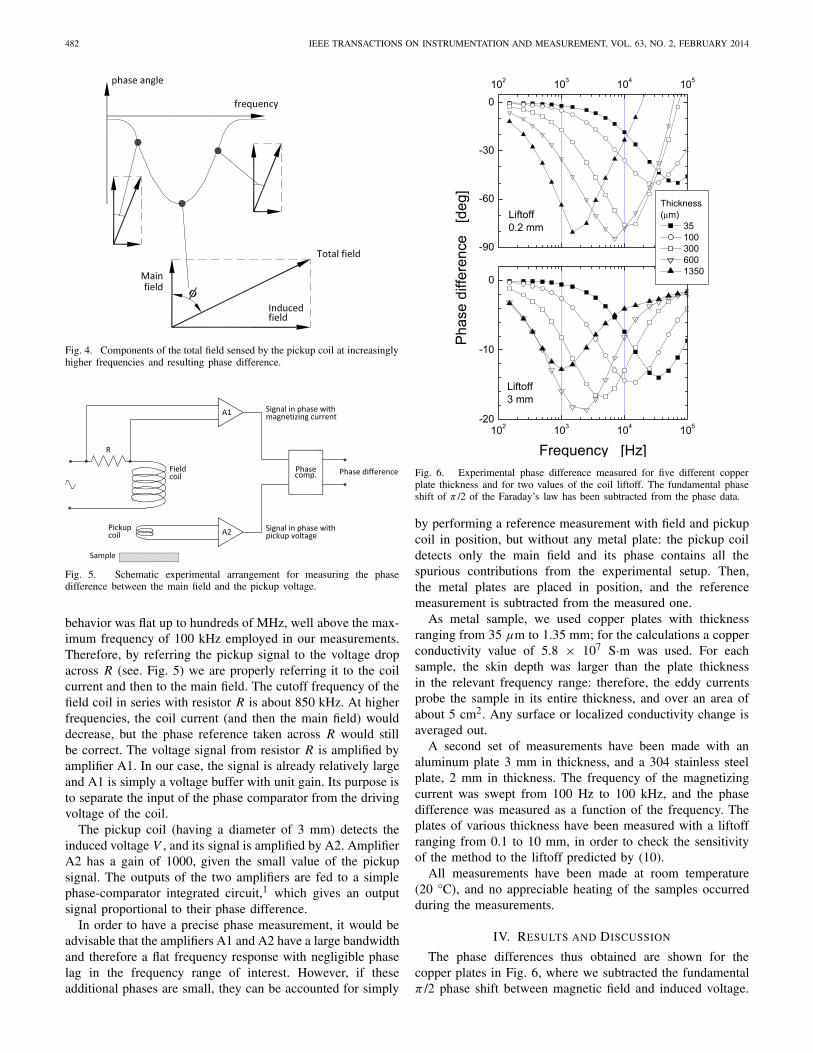
Fig. 4. Components of the total field sensed by the pickup coil at increasinglyhigher frequencies and resulting phase difference.
Fig. 5. Schematic experimental arrangement for measuring the phasedifference between the main field and the pickup voltage.
behavior was flat up to hundreds of MHz, well above the max-imum frequency of 100 kHz employed in our measurements.Therefore, by referring the pickup signal to the voltage dropacross R (see. Fig. 5) we are properly referring it to the coilcurrent and then to the main field. The cutoff frequency of thefield coil in series with resistor R is about 850 kHz. At higherfrequencies, the coil current (and then the main field) woulddecrease, but the phase reference taken across R would stillbe correct. The voltage signal from resistor R is amplified byamplifier A1. In our case, the signal is already relatively largeand A1 is simply a voltage buffer with unit gain. Its purpose isto separate the input of the phase comparator from the drivingvoltage of the coil.
The pickup coil (having a diameter of 3 mm) detects theinduced voltage V , and its signal is amplified by A2. AmplifierA2 has a gain of 1000, given the small value of the pickupsignal. The outputs of the two amplifiers are fed to a simplephase-comparator integrated circuit,1 which gives an outputsignal proportional to their phase difference.
In order to have a precise phase measurement, it would beadvisable that the amplifiers A1 and A2 have a large bandwidthand therefore a flat frequency response with negligible phaselag in the frequency range of interest. However, if theseadditional phases are small, they can be accounted for simply
102 103 104 105-20
-10
0
-90
-60
-30
0
102 103 104 105
Liftoff3 mm
Pha
se d
iffer
ence
[d
eg]
Frequency [Hz]
Thickness(μm)
35 100 300 600 1350
Liftoff0.2 mm
Fig. 6. Experimental phase difference measured for five different copperplate thickness and for two values of the coil liftoff. The fundamental phaseshift of π /2 of the Faraday’s law has been subtracted from the phase data.
by performing a reference measurement with field and pickupcoil in position, but without any metal plate: the pickup coildetects only the main field and its phase contains all thespurious contributions from the experimental setup. Then,the metal plates are placed in position, and the referencemeasurement is subtracted from the measured one.
As metal sample, we used copper plates with thicknessranging from 35 μm to 1.35 mm; for the calculations a copperconductivity value of 5.8 × 10⁷ S·m was used. For eachsample, the skin depth was larger than the plate thicknessin the relevant frequency range: therefore, the eddy currentsprobe the sample in its entire thickness, and over an area ofabout 5 cm2. Any surface or localized conductivity change isaveraged out.
A second set of measurements have been made with analuminum plate 3 mm in thickness, and a 304 stainless steelplate, 2 mm in thickness. The frequency of the magnetizingcurrent was swept from 100 Hz to 100 kHz, and the phasedifference was measured as a function of the frequency. Theplates of various thickness have been measured with a liftoffranging from 0.1 to 10 mm, in order to check the sensitivityof the method to the liftoff predicted by (10).
All measurements have been made at room temperature(20 °C), and no appreciable heating of the samples occurredduring the measurements.
IV. RESULTS AND DISCUSSION
The phase differences thus obtained are shown for thecopper plates in Fig. 6, where we subtracted the fundamentalπ /2 phase shift between magnetic field and induced voltage.

PINOTTI AND PUPPIN: SIMPLE LOCK-IN TECHNIQUE 483
10-2 10-1 1 10 102-1.2
-1.0
-0.8
-0.6
-0.4
-0.2
0.0
Aluminum 3 mm
304 steel 2 mm
Nor
mal
ized
pha
se d
iffer
ence
Normalized frequency
Copper (μm) 1350 600 300 100 35
Fig. 7. Experimental curves of Fig. 6 (copper plates) and additional curvesfor a 304 steel plate and an aluminium one, normalized to their peak value,and plotted against the normalized frequency of (9) and (10).
The behavior found in our experiment confirms the theoreticalbackground, and generally agrees with the expected one shownin Fig, 2.
In order to check the universal curve predicted by (8),the phase curves obtained for the copper, aluminum, andsteel plates have been normalized to their peak, and plottedas a function of the normalized frequency of (9) and (10).The result is shown in Fig. 7, where all curves collapse tothe universal form, notwithstanding the large difference inconductivity and thickness of the individual plates.
The frequencies of the phase peak have been compared withthe theoretical predictions of (10), and the results are shownin Fig. 8, where the peak frequency is shown as a functionof the plate thickness for two different values of liftoff; theagreement is reasonably good for a liftoff of 0.2 mm, and verygood for a liftoff of 2 mm.
A second set of measurements have been made in orderto study the effect of the liftoff: the phase measurementshave been repeated for the same copper plate (thickness300 μm) with different liftoffs. The results are shown in Fig. 9,where the peak frequency shows the dependence on the liftoffpredicted by (10). This explains also the different qualities ofthe results shown in Fig. 8: at small values of liftoff, it wasdifficult to be precise enough in maintaining the same liftoffwhen changing the sample plate. A variation of ±0.1 mm,e.g., is small in absolute value, but large if compared to thenominal 0.2 mm value. Fig. 8 shows that in this range a smallchange in the liftoff results in relatively large changes of thepeak frequency. Instead, at a liftoff of 2 mm, a variation of±0.1 mm has a negligible effect. Therefore, a higher liftoff isless sensitive to positioning errors; the trade-off is a smallerphase difference (compare the two panels of Fig. 6) and then areduced sensitivity. It is at present unclear why this technique
10µm 100µm 1mm 10mm102
103
104
105
Theory
Experiment: Liftoff 0.2 mm Liftoff 2 mm
Pea
k fre
quen
cy
[Hz]
Metal plate thicknessFig. 8. Comparison between the experimental peak frequencies of the phase(symbols) and the theoretical values expected from (10), for copper plates attwo different liftoffs.
leads to a liftoff dependence of the frequency peak, whereasno such dependence of the phase signature has been foundfor the measurements described in [6]. However, it has to bepointed out that the geometry and the configuration of oursystem are quite different from the double-coil one employedin [6]. This point requires further investigation.
V. ANALYSIS OF ERRORS
Measurement errors arise mainly from three sources:
1) error in locating the peak frequency;2) error in the assumed conductance;3) error in estimating the liftoff.
Their impact on the thickness estimation is quite different.Let us analyze first the error in locating the frequency ofthe phase peak, arising mainly from measurement made atdiscrete frequencies too spaced apart. From Eq. (10), it canbe readily shown that a (small) uncertainty �ω in locating thepeak frequency translates in an uncertainty �c on the thicknessvalue given by
�c (�ω) ≈ ctrue × �ω
ωpeak. (11)
Therefore, if the measurement system has a fixed frequencyuncertainty, the peaks at lower frequencies (corresponding tothicker plates) will suffer the highest relative uncertainty.
The error in the assumed metal conductance has the sameeffect
�c (�σ) ≈ ctrue × �σ
σ. (12)
The metal conductance can change considerably, e.g., for tem-perature variation, mechanical stress, presence of impurities,change in metal composition, this is the most serious source

484 IEEE TRANSACTIONS ON INSTRUMENTATION AND MEASUREMENT, VOL. 63, NO. 2, FEBRUARY 2014
0.1 1 102kHz
10kHz
20kHz
Slope -1/3Pea
k fre
quen
cy
Liftoff [mm]Fig. 9. Comparison between the experimental peak frequencies of the phase(symbols) and the values expected from (10), for a copper plate of fixedthickness (300 m) and variable liftoff. The solid line shows the dependenceon reciprocal of the cubic root of liftoff, predicted by (10).
of error. If a high precision is needed, it would be advisableto measure the effective conductance of the sample.
Instead, an error in estimating the liftoff has a lesser impact
�c (�l1) ≈ ctrue × 1
3× �l1
l1. (13)
This error source can be made small, because in most casesthe liftoff l1 can be made much larger than its uncertainty�l1. For example, if the uncertainty is of the order of 0.1 mm(mechanically feasible in most cases), its effect can be greatlyreduced by keeping the liftoff to the reasonable value of 1 mm.
VI. CONCLUSION
In this paper, we present a method for measuring thethickness of metal plates, based on the phase signature of theeddy currents induced by a field coil. The prominent featureof this method is the presence, in the phase signature, ofa peak whose position is related to the plate thickness andconductance, and to the liftoff of the measuring coil. Thispeak has an universal shape, which scales for different samplesby a factor containing the above-mentioned quantities. Thepresence of the phase peak allows a simple automatization ofthe method, as it can be translated to a voltage peak by meansof an inexpensive phase comparator IC, in connection with avariable frequency oscillator, also available in various low-costintegrated circuits.2
2Very simple voltage controlled oscillators can be built using the classical555 IC timer.
The results have a certain dependence on the liftoff and itsvariations, which is rather large for small liftoffs (< 0.5 mm).This drawback can be overcome by increasing the liftoffat larger values (> 1 mm), where this dependence becomesrapidly negligible. On the other side, this effect can beexploited if the plate thickness and conductance are alreadyknown, because in this case it can be used for measuring thethickness of an insulating layer deposited on the plate (e.g., apaint).
ACKNOWLEDGMENT
The authors would like to thank A. Gruttadauria for provid-ing us the steel plate used in the measurements.
REFERENCES
[1] C. V. Dodd and W. E. Deeds, “Analytical solutions to eddy-currentprobe-coil problems,” J. Appl. Phys., vol. 39, no. 6, pp. 2829–2838,1968.
[2] G. Birnbaum and G. M. Free, Eddy Current Characterization of Materi-als and Structures. Philadelphia, PA, USA: American Society for Testingand Materials, 1981.
[3] J. C. Moulder, E. Uzal, and J. H. Rose, “Thickness and conductivityof metallic layers from eddy current measurements,” Rev. Sci. Instrum.,vol. 63, no. 6, pp. 3455–3465, 1992.
[4] W. Yin, and A. J. Peyton, “Thickness measurement of metallic plateswith an electromagnetic sensor using phase signature analysis,” IEEETrans. Instrum. Meas., vol. 57, no. 8, pp. 1803–1807, Aug. 2008.
[5] W. Yin and A. J. Peyton, “Thickness measurement of non-magneticplates using multi-frequency eddy current sensors,” NDT&E Int., vol. 40,no. 1, pp. 43–48, 2007.
[6] W. Yin, R. Binns, S. J. Dickinson, C. Davis, and A. J. Peyton, “Analysisof the liftoff effect of phase spectra for eddy current sensors,” IEEETrans. Instrum. Meas., vol. 56, no. 6, pp. 2775–2781, Dec. 2007.
[7] M. Abramowitz and I. A. Stegun, Handbook of Mathematical Functions.New York, NY, USA: Dover, 1965, p. 364.
[8] G. N. Watson, A Treatise on the Theory of Bessel Functions. Cambridge,U.K.: Cambridge Univ. Press, 1922, ch. 13.
Ermanno Pinotti was born in Levate, Italy, in1965. He received the Degree and Ph.D. degrees inelectrical engineering from Politecnico of Milano,Milan, Italy, in 1992 and 1996, respectively.
He developed semiconductor detectors for X-rayastronomy in collaboration with the Max PlanckInstitute for Extraterrestrial Physics of Munich,Munich, Germany, from 1992 to 1997. From 1998to 2003, he was with the University of Milano,Bicocca, Italy, on organic semiconductors growthand characterization. In 2003, he became a Research
Assistant with the Physics Department, Politecnico of Milano, where hestudies magnetic systems and statistical physics.
Ezio Puppin was born in Milan, Italy, in 1956. Hereceived the Degree in nuclear engineering from thePolytechnic of Milan, Milan, in 1984.
He was with SGS, a semiconductor manufacturer,with the Physics Group of the R&D Division. Hisactivity consists in dealing with basic physics issuesdirectly related with the production of semicon-ductor devices. From November 1985 to December1987, he was as a Research Associate with the Elec-trical Engineering Department, Stanford University,Stanford, CA, USA, where he performs synchrotron
radiation experiments. In 1988, he was with the Physics Department, Poly-technic of Milan, Milan, Italy. Since February 2001, he has been a ResearchAssociate. In March 2001, he was an Associate Professor of general physics.He has been researching inverse photoemission since 1993 and, ever since, onthe experimental investigation of magnetism with magnetooptical techniques.He is currently the President of CNISM, a consortium of nearly 40 Italianuniversities which includes 1300 scientists working in the field of condensedmatter physics. His current research interests include the statistical propertiesof magnetic systems and the investigation of the magnetization dynamics withmagnetooptical techniques.