simple drag tests for water rockets
TRANSCRIPT
Simple Drag Tests for Water RocketsA Share Lab Project for Rocket Design
This lab is provided for use free of charge by Seeds Software. However, if you make use ofthis lab, and are satisfied with the results, we request that you submit your test results [email protected] for tabulation and possible inclusion at our web site (seesample submission form on last page - Appendix C - of document for more directions).Please understand that any information and/or pictures provided, are given to SeedsSoftware for use free of duty, copyright, or obligation to sender or their associates.
Seeds Software develops exciting quality software packages, comprehensive andcomplete with lessons and labs. We believe that hands-on activities are an important partof studies because students learn best when they invoke all their senses.
That is why our software always includes innovative labs for students to do alongwith the software; so that students can experience how science really works and gainvaluable insights into their world. We hope this sample lab is useful and that you will comeback to our web site for tips, results, updates, and to consider our other exciting products.
Legal Notice: Rocket launches and related activities are high energy events with considerable risk of injury. Please takeprecautions to keep all such projects safe. To use this lab you must agree that you do so solely at your own risk andwithout warranty of any kind. In no event shall Seeds Software's total liability to you exceed the amount paid for this lab,which is nothing ($0.00). Copyright © 2001 Seeds Software All Rights Reserved. This lab may not be sold or distributed forprofit, published in whole or part, or electronically transmitted to others without Seeds Software’s written permission.
Ver 9.01 Copyright © 2001 Seeds Software All Rights Reserved

Simple Drag Tests for Water Rockets page 2
Objective
1) Use a wind tunnel to compare the drag of different design configurations to help determinethe optimum aerodynamic shape for your water rocket design.2) Make an estimate of the coefficient of drag of your rocket designs to use in a computersimulator to assess the performance of your water rockets before you launch.
Materials
a) Water Rockets to Test (including: Nose Cone shapes, Fin sizes - number - shapes)b) Large Fan (the larger and more powerful, the better -- at least 0.5 meter or 18 inches)c) Triple Beam Mass Balance Scale or Digital Mass Meterd) Several meters of Sting to suspend Rockets over the Fane) Support Structure to hold the Balance Beam and fan above the groundg) Digital or Music CDh) 100 to 120 grams of Clay
Set Up
The strength of your fan will directly effecthow well you can measure and comparedifferent rocket configurations so be sureto use the largest, most powerful, fan youcan find. Set up your fan to blow straightup from the ground. Be sure to supportthe fan a sufficient height above theground (about 0.3 m) so that the air flowthrough the fan is unrestricted, especiallyover the section of the fan you plan tosuspend your rocket designs over.
Set up a stand above the fan for a triplebeam balance. The balance should be atleast 2 rocket lengths above the fan ifpossible. One possibility is to find a highbalcony or deck that you can set your fanup under and have the triple balancebeam on the deck. Another possibility is to secure and support the scale on a wood plankcantilevered off a ladder or shelf. If the support will significantly block the air flow above the fan itis best to have the stand a good distance higher. Always be safe with your set up and do notput anyone at risk. Someone will have to be able to actively make use of the triple balancebeam scale to take drag measurements. This requires a stable platform that keeps the personreading the scale safe as well as preventing the scale from falling down.
Drill a hole exactly centered in the cap of a soda bottle. Put a knot into one end of a long pieceof string and thread the string through the cap hole until it is stopped by the knot. Pull the other
Ver 9.01 Copyright © 2001 Seeds Software All Rights Reserved

Simple Drag Tests for Water Rockets page 3
end of the string up to the scale and thread thestring around the axle on the bottom end of thevertical post of the scale tray. Screw the caponto a rocket you wish to test and suspend therocket by the string above the scale. Adjust thedistance the center of the front end of the waterbottle (not the tip of a nose cone) hangs abovethe fan to be about 10 to 15 cm.
Next find out the best part of the fan face tosuspend your rockets over to conduct your dragtests. Turn the fan on to maximum speed.Determine the amount of mass required on thescale to balance the rocket hanging below inthe air stream. Move the rocket and scalelocation and/or fan position around and readjustthe scale as needed. Establish the position onthe fan face that requires the least amount ofmass to balance the rocket while providing thegreatest stability and consistency in scalereadings. This will be the best position to center
your rockets at for drag tests. You may also need to do some experimentation to find the bestheight to position the rocket above the fan. This is because the ideal suspension height willdepend on the size and airflow output of your fan, and the actual set up you have. Use a plumto mark this spot on the fan face and record the distance the front end of the bottle is above thefan in case you wish to set up again and do more experiments later. To get consistent results, allyour test will need to be conducted with the suspended rockets exactly centered on this samespot and height above the fan face. Be careful not to move the fan or scale out of position untilyou are completely finished testing or your comparisons may become compromised. Instead,remove the rocket from the cap to do modifications and reattach the rocket to do each test.
You are now ready to conduct some drag tests with your setup. Remember that your results willonly be as good as the care you take in conducting the tests. Even then, because the windtunnel is so primitive, you may have to use some judgment in interpreting your results and whatsort of refinements in design you can accurately assess.
Procedure 1 - Determine Air Flow Speed
You can determine the apparent speed of the air flow the fan is generating by measuring thedrag that develops when a shape with a known coefficient of drag is placed into the air stream.In this section we will use a CD to estimate the speed of the air flow produced by the fan. A CDis essentially a flat disk that is known to have a coefficient of drag that is 1.17 (Cd = 1.17) whenplaced perpendicular to the air stream. The velocity of the air flow can be calculated bymeasuring the drag of the CD in the air stream and using that information in the equation fordrag (Eq 1) to solve for the apparent velocity.
Ver 9.01 Copyright © 2001 Seeds Software All Rights Reserved
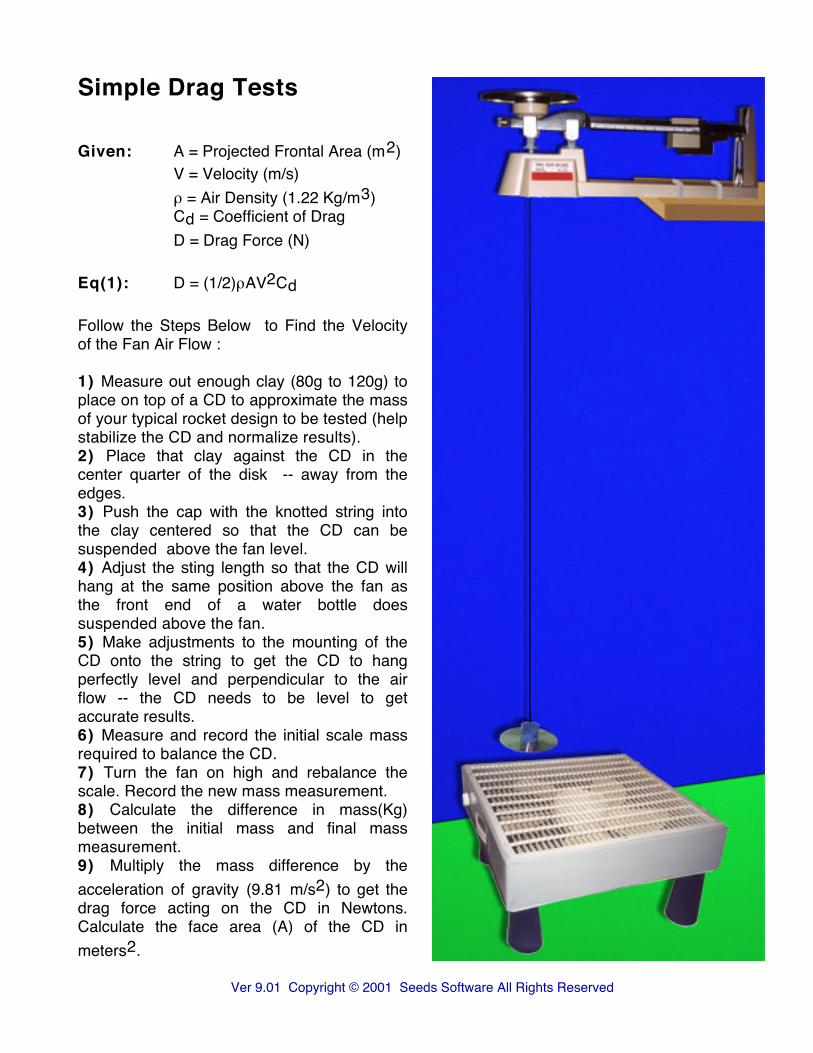
Simple Drag Tests
Given: A = Projected Frontal Area (m2)V = Velocity (m/s)ρ = Air Density (1.22 Kg/m3)Cd = Coefficient of DragD = Drag Force (N)
Eq(1): D = (1/2)ρAV2Cd
Follow the Steps Below to Find the Velocityof the Fan Air Flow :
1) Measure out enough clay (80g to 120g) toplace on top of a CD to approximate the massof your typical rocket design to be tested (helpstabilize the CD and normalize results).2) Place that clay against the CD in thecenter quarter of the disk -- away from theedges.3) Push the cap with the knotted string intothe clay centered so that the CD can besuspended above the fan level.4) Adjust the sting length so that the CD willhang at the same position above the fan asthe front end of a water bottle doessuspended above the fan.5) Make adjustments to the mounting of theCD onto the string to get the CD to hangperfectly level and perpendicular to the airflow -- the CD needs to be level to getaccurate results.6) Measure and record the initial scale massrequired to balance the CD.7) Turn the fan on high and rebalance thescale. Record the new mass measurement.8) Calculate the difference in mass(Kg)between the initial mass and final massmeasurement.9) Multiply the mass difference by theacceleration of gravity (9.81 m/s2) to get thedrag force acting on the CD in Newtons.Calculate the face area (A) of the CD inmeters2.
Ver 9.01 Copyright © 2001 Seeds Software All Rights Reserved
Simple Drag Tests for Water Rockets page 5
Solve the drag equation (Eq 1) for velocity to obtain (Eq 2). Use the calculated drag force,known drag coefficient (Cd =1.17), and CD area in Eq 2 to get an apparent air velocity V(m/s2)**
Eq (2): Vt = sqrt (2D / (1.22*A*Cd) ) = sqrt (2D / (1.427*A))
** Note: To conduct drag investigations and comparisons that will help you streamline yourrockets (Procedure 2) you need to be using a fan that can produce an air flow rate of at least 4(m/s). Otherwise it becomes difficult to compare the drag between different rocket configurationsbecause the differences in drag measured between configurations gets to be too small toreadily distinguish from the turbulence in the air flow. If your test results show that the fan is notpowerful enough to provide a fast air flow, consider finding a more powerful fan beforeproceeding to testing your rocket configurations for drag.
Procedure 2 - Rocket Configurations
Using a fan as a wind tunnel is a pretty primitive setup so don’t expect to get impeccable results.Instead, look for the tests to give you a much better feel of the influence drag has on theperformance of your rockets. By directly comparing the drag values you measure for differentdesigns you can gain some understanding of how the shape and size of rocket componentseffect the amount of drag that develops and hence how well a given rocket performs. Try to useyour fan testing to help you find a shape that streamlines and optimizes the aerodynamicefficiency of your designs, just as aerodynamists do with wind tunnels.
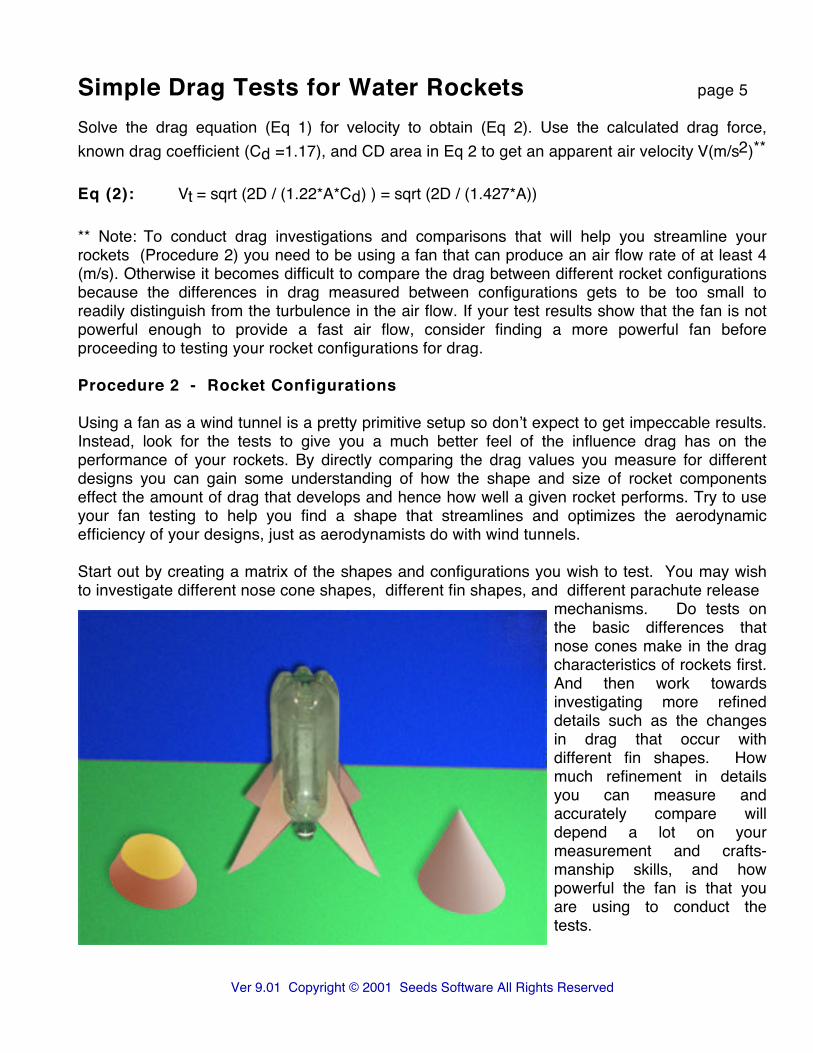
Start out by creating a matrix of the shapes and configurations you wish to test. You may wishto investigate different nose cone shapes, different fin shapes, and different parachute release
mechanisms. Do tests onthe basic differences thatnose cones make in the dragcharacteristics of rockets first.And then work towardsinvestigating more refineddetails such as the changesin drag that occur withdifferent fin shapes. Howmuch refinement in detailsyou can measure andaccurately compare willdepend a lot on yourmeasurement and crafts-manship skills, and howpowerful the fan is that youare using to conduct thetests.
Ver 9.01 Copyright © 2001 Seeds Software All Rights Reserved

Simple Drag Tests for Water Rockets page 6
Sample Test Matrix for 2 Liter Bottle Design
Measured Mass (g)
Test Fan Off Fan On Drag
2 Liter Bottle + Extra Mass _____ _____ _____
Bottle + Nose 1 _____ _____ _____Bottle + Nose 2 _____ _____ _____ Fin ABottle + Nose 3 _____ _____ _____
Bottle + Best Nose + 4 Fin A _____ _____ _____Bottle + Best Nose + 4 Fin B _____ _____ _____Bottle + Best Nose + 4 Fin C _____ _____ _____
Fin B
Nose 1 Nose 2 Nose 3 Fin C
Once you have decided on what tests to conduct, follow the procedures and guidelines below torun each test.
1) Add (water or clay) to your rocket as needed to keep all your tests at about the same mass2) Suspend your rocket above the fan face on the triple beam scale and check the location andheight above the fan to make sure the rocket is properly positioned.3) Measure and record the scale mass required to hold the rocket in balance with the fan off.4) Turn the fan on to full speed.5) Measure and record the amount of scale mass to balance the rocket with the fan on. *6) Calculate and record the apparent mass difference between measurements with the fan offand the fan on. This mass difference is caused by the drag action as the air from the fan flowspast the rocket model. The drag force acts against gravity, reducing the mass required tobalance the rocket with the scale.7) You can calculate the drag force as D= mg -- with gravity being 9.81 (m/s2) and force (N)
Eq (3): D(N) = 9.81 (m/s2) * mass change (g) * 0.001 (g / Kg)
* Note that as you get close to massing out the rocket in each test, you are likely to find the scalebecomes unsteady and more difficult to appraise scale adjustments and progress towards
Ver 9.01 Copyright © 2001 Seeds Software All Rights Reserved

Simple Drag Tests for Water Rockets page 7
balance; even so you should be able to closely estimate the mass that “on average” centers thescale. You may wish to lightly constrain the string laterally right above the rocket for an instant tosteady the rocket, then release and check the scale again to verify your estimation before yourecord your results. If you find that the rocket is spinning with the fan on it is likely that some ofyour fins are slightly off true from up and down and are developing slight lateral forces.
Procedure 3 - Estimation of Drag Coefficient for Apogee Calculations
Use the equations below (Eq 4 & 5) to estimate the actual drag coefficients of your rocketsduring a launch. Use eq(4) to calculate the apparent drag coefficient at the velocity of your tests.Then use eq(5) to adjust the drag coefficient to the actual speeds your rocket will obtain in alaunch.
Equation 5 is a factor that accounts for the transitional nature of drag, from viscous to pressuredominated actions, as the air flow velocities are increased from that of your tests results to thoseof real launches. It is a semi-empirical approximation based on theory and expectations and itshould not be presumed to be precise, but rather a rough cursory estimate from modest testsresults.
Given
Vt = Velocity of Air in Wind Tunnel Tests (m/s)Vr = Velocity of Rocket Launch (m/s) -- use 2/3 maximum velocity to approximate full rangeDr = Dia of Rocket Body (m) D = Measured Drag Force from Tests (N)ρ = Air Density (1.22 Kg/m3) η = 2 (factor based on the ratio of wetted surface area to projected frontal area of the rocket
with a value of 2 being nominal for a typical 2 liter water rocket)
Find the drag coefficient for your rocket at the apparent test velocity (Vt):
Eq (4): Cdt = 8D / (πρDr2Vt2)
Then calculate a velocity adjusted drag coefficient to use in rocket launch apogee simulations:
1 - sqrt ( Vt / Vr)Eq (5): Cdr = Cdt 1 -
η ( 1 + (Cdt / 1.17))
See Appendix A - Background for more information about drag and the need for adjustment.
Ver 9.01 Copyright © 2001 Seeds Software All Rights Reserved

Simple Drag Tests for Water Rockets page 8
Procedure 4 - Experimentation
Using some ingenuity, and careful lab skills, it is possible to investigate various aerodynamiccharacteristics of your rocket designs with your fan setup. One very important aspect ofaerodynamic streamlining is to encourage the air to flow smoothly around your design. If theshape transitions too abruptly at the ends, the air gets plowed (the air flow separates from thebody) instead, causing a pressure drop behind it. The separation will increase the drag actingagainst the motion of your rocket because any pressure drop at the aft end results in thepressure at the front, that remains higher, pushing against your rocket with a greater net force.The drag characteristics of your rocket body essentially become more bluff with flow separation.
You can test to see if your rocket design is streamlined enough to keep the air flow attachedaround the aft end of your rocket with your fan set up.
Additional Materials:
a) Strip of Poster Board or Heavy Stock Paper (6 cm x 36 cm)b) Light Weight Thread cut into 8 to 10 sections of about 4 cm lengthc) Clay mass and/ or nose cone d) Clear Tape
Set Up:
1) Wrap the strip of paper snuglyaround the bottle to form a flushsleeve and lightly tape it to thebottle on the cylindrical portion ofthe bottle just forward of the aftend.2) Use small pieces of tape toattach the thread sections to yourbottle in a spiral pattern to use thethread as air streamers or tufts (asshown on the bottle in red).
Procedures:
Follow section 2 procedures to compare the results between having the sleeve positioned onthe cylindrical portion of the bottle, and slid up about 1 to 2 cm off the tangent point so that thesleeve forms a lip or dam that prevents the air flow from following the bottle contour around theaft end -- it separates the air flow. If your bottle is streamlined you will be able to measure thechange in drag between having the sleeve down or up. Also notice the difference in thebehavior of the thread tufts attached to the aft end. The free ends of the tufts will point aft if theair is streamlined for the sleeve down case, and bend around somewhat to point downwardwhen the air flow separates from the bottle -- causing a turbulent wake -- for the sleeve up case.
Ver 9.01 Copyright © 2001 Seeds Software All Rights Reserved
Air Flow
Slide Slide

Simple Drag Tests for Water Rockets page 9
Appendix A - Background
Most everyone who launches water rockets wants to design their rocket to go as high aspossible (highest apogee). You might consider using trial and error to try to find the best design.But this requires doing many repeated test launches, each with some minor change, to observethe results. And such an approach takes a lot of time, is often difficult to assess, and may notlead you to the best design. It is usually better to take a more scientific approach. The apogeeyour rocket obtains will depend on a number of factors of design. There are simulatorsavailable, like Water Rocket Fun, that you can use to determine the performance to expect fromyour rocket based on the mass, gas pressure, amount of water, and the drag characteristics ofyour rockets. The simulators can be used to determine the optimum mass and water volume touse for your rockets to get the highest apogee. Unfortunately the drag of your rocket , which isone of the key parameters in the analysis, is not readily known and is difficult to calculate byanalytical means. Many get around this short coming by resorting back to trial launches tomeasure apogee and back out the drag characteristics of their rocket and then use thesimulation to determine the amount of water and mass to use in the rocket to optimize itsperformance. To be more effective, you need to use some method of assessing and determiningthe drag characteristics of your rockets as well.
Drag is the resistance to motion that is exerted by a fluid such as air as it flows around a solidbody. Drag takes energy away from a body, slowing it down, by converting motion energy intoheat. The more drag there is against flow around a body, the faster energy is lost over time. Arocket that has a lot of drag will not accomplish nearly as high an apogee as a rocket with thesame amount of launch energy that has much less drag. So it is important to try to minimize thedrag that occurs when you launch your rocket.
The amount of drag that occurs with flow is often characterized by a value called the coefficientof drag (Cd). The Cd of a body is a function of the body shape and the properties of the fluidflowing around the body. Once a coefficient of drag is established for a body one can use thecoefficient in equation (1) below to calculate the drag force a fluid is exerting on a body at agiven speed. Simulations that predict the apogee of water rockets often use this equation toaccount for the effects of drag on the performance of the rocket.
Given: A = Projected Frontal Area of Rocket (m2), V = Velocity (m/s)ρ = Air Density (1.22 Kg/m3), Cd = Coefficient of Drag, D = Drag Force (N)
Eq(1): D = (1/2)ρAV2Cd
Objects that are shaped to minimize the amount of drag that develops moving through a fluidare considered aerodynamically streamlined. Typically finding the best aerodynamic shape isan exercise in compromise. This is because the vehicle designs are almost always limitedsomewhat in form to shapes that allow the vehicle to perform its functions effectively as well asbeing fashioned to minimize drag. For water rockets the challenge is to come up with the mostaerodynamic shape that can also hold compressed air, provide an efficient nozzle for thrust,
Ver 9.01 Copyright © 2001 Seeds Software All Rights Reserved
Simple Drag Tests for Water Rockets page 10
and possibly enclose a parachute that ejects at apogee. Even more restrictive for your waterrocket designs is that often you start off your design with a preexisting body such as a sodabottle which you modify as best you can to achieve your objectives.
Aerodynamists toil over what the drag characteristics of rockets and aircraft are too because theamount of drag that develops can be so critical to how well their designs will perform. In theearly days of flight aerodynamists depended on testing designs in wind tunnels that they coulduse to provide a controlled air flow and measure the drag that developed. Through testing andcomparison of results, the aerodynamist could check their designs and optimize their shape tominimize the drag. In modern times aerodynamists include computer computational fluidmodels (CFM’s) to idealize and predict the drag of fluid flow around a body. With CFM’s theycan better understand and interpret the flow around the vehicle, to get a better handle on howto optimize their designs. However they usually still use wind tunnel testing along with theirmodels to fine tune, and verify their model results. These tools provide assessments that helpthem shape the vehicle to achieve the best drag characteristics before they build their designs.Unfortunately getting meaningful answers with CFM’s takes a lot of experience, and a deepunderstanding of the advanced theory and results these models provide. Luckily wind tunneltesting is not so difficult and is something you can easily do to help you configure your rockets toget the best performance.
Wind tunnels are designed to provide a controlled streamlined flow of air that is both steady andfree of turbulence. This allows aerodynamists to make very precise measurements of the flowaround a body and the lift and drag forces that result. Fortunately drag is not as sensitive of atest to do as determining the lift characteristics of a body -- the flow does not have to be asstreamlined. It is possible to do simple useful comparisons of different rocket designconfigurations for drag using nothing more than a powerful household box fan. Such a tests canhelp you identify the most efficient aerodynamic shape for your rocket design. Furthermore, it ispossible to roughly estimate the coefficient of drag from your test results to use in a water rocketsimulator to predict the apogee performance of your designs.
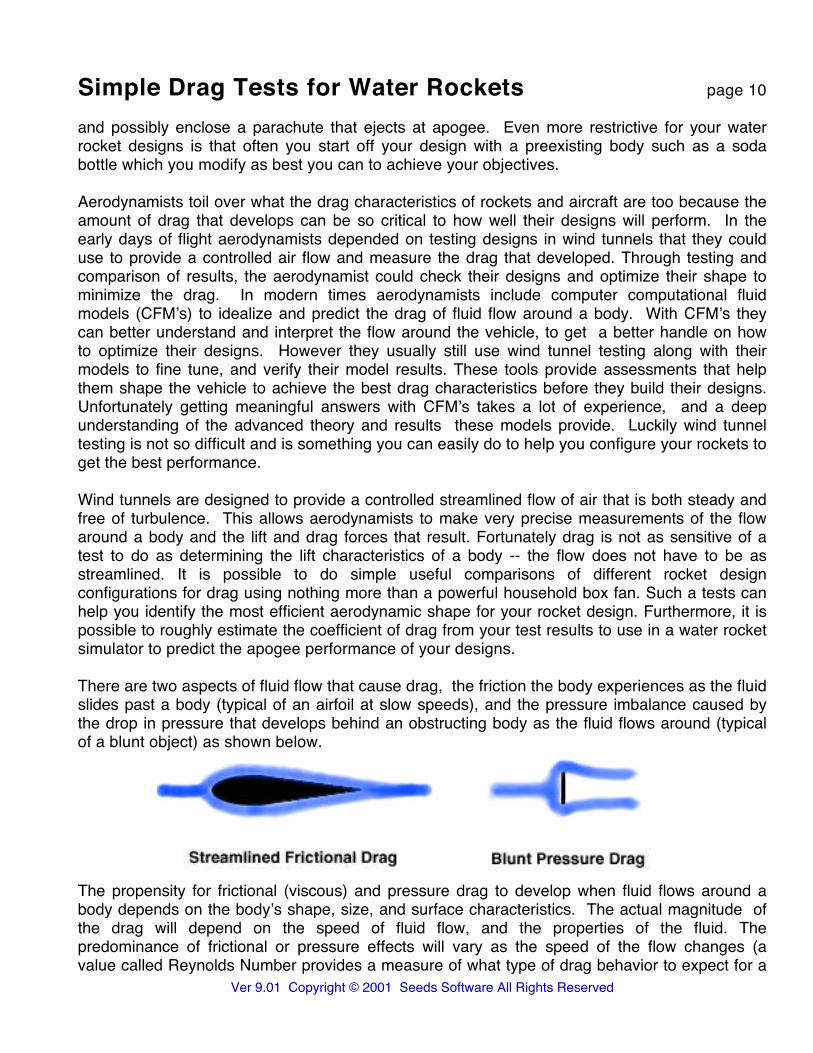
There are two aspects of fluid flow that cause drag, the friction the body experiences as the fluidslides past a body (typical of an airfoil at slow speeds), and the pressure imbalance caused bythe drop in pressure that develops behind an obstructing body as the fluid flows around (typicalof a blunt object) as shown below.
The propensity for frictional (viscous) and pressure drag to develop when fluid flows around abody depends on the body’s shape, size, and surface characteristics. The actual magnitude ofthe drag will depend on the speed of fluid flow, and the properties of the fluid. Thepredominance of frictional or pressure effects will vary as the speed of the flow changes (avalue called Reynolds Number provides a measure of what type of drag behavior to expect for a
Ver 9.01 Copyright © 2001 Seeds Software All Rights Reserved

Simple Drag Tests for Water Rockets page 11
given body and fluid). At low speeds of fluid flow frictional (viscous) drag plays the biggest roleon the resistance a body experiences moving through a fluid. As the flow speed of the fluidincreases the pressure drag becomes more influential, becoming a greater and greater factor.Eventually, as the speed continues to increase, pressure becomes the most dominate aspect ofdrag. In the flow speed ranges where frictional resistance dominates, the coefficient of dragchanges with flow speed but can be calculated using equations derived by theory. And at muchhigher flow rates, where pressure is dominate, the body is said to be “bluff”, with a coefficient ofdrag that more or less becomes a constant value with speed (a range that full size airplanesand rockets more typically operate at). Unfortunately because of their size and rate of climb,water rockets tend to operate in the transitional region of flow where both aspects of frictional
drag and pressure resistance areimportant influences.
To make matters worse, yourrocket will most likely experienceconsiderably faster speeds in areal launch than what you cantest with a fan or homeconstructed wing tunnel (the fanlikely develops an air flow speedof around 4 m/s to 6 m/s while anactual rocket may reach up to 60m/s or faster). Hence, if youdirectly use equation 2 toestimate the coefficient of drag foryour rockets from your test resultsyou will end up with a dragcoefficient that is significantly toohigh. This is because, at thelower air flow speeds of your fantests, the rocket develops a largerproportion of frictional (viscous)drag effects than the rocket willdevelop at the faster speeds of anactual launch.
Aerodynamists often test models at slower speeds in wind tunnels too; but they adjust the sizeof their test models, and the properties of the air or fluid they use, so that they will get the correctflow influences around the test model. Then they use dimensional analysis of the results theyobtain to scale the results to the actual vehicle. Unfortunately it would require a lot of work andskill to build accurate scale models and do the dimensional analysis correctly. And unless youbuild a much more refined wind tunnel, building the scaled model is probably not worth theextra effort. Fortunately there is enough test data and theory around to have a rough idea onjust how to adjust the drag as it transitions with increases in the rate of airflow around a body.
Ver 9.01 Copyright © 2001 Seeds Software All Rights Reserved
Velocity (m/s)
Illustrative Drag Profile (Typical Water Rocket)
1.0 10 100
TestLaunch
Simple Drag Tests for Water Rockets page 12
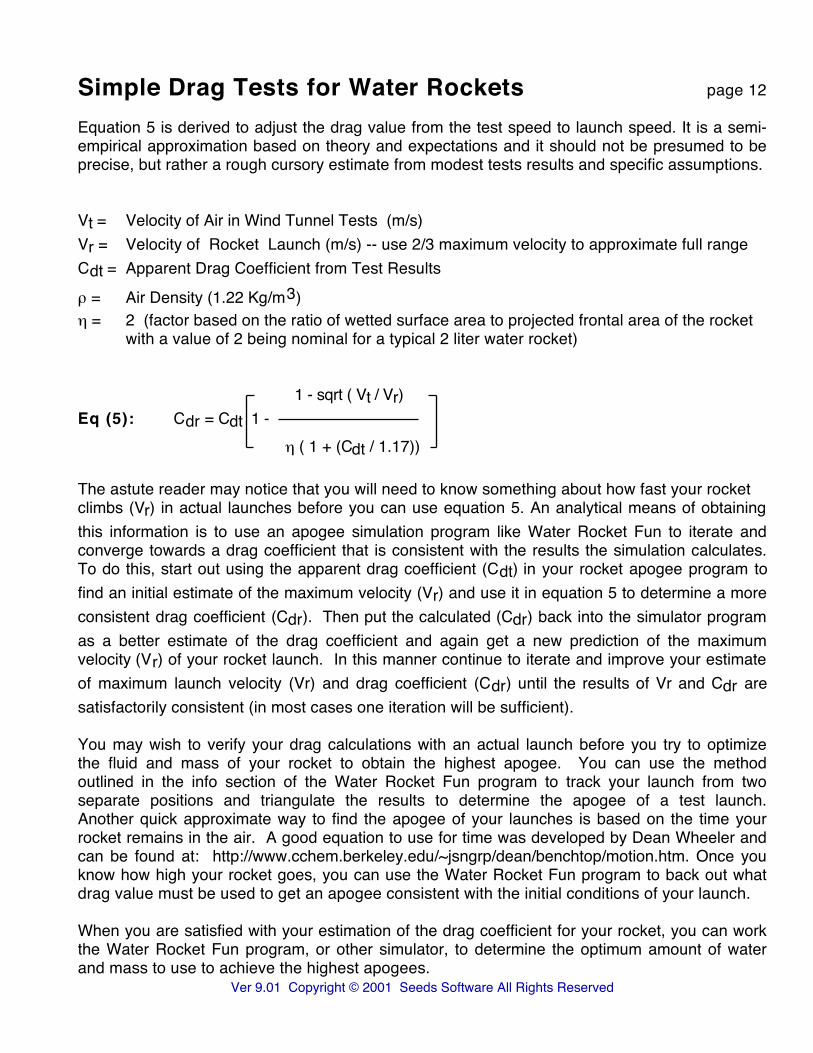
Equation 5 is derived to adjust the drag value from the test speed to launch speed. It is a semi-empirical approximation based on theory and expectations and it should not be presumed to beprecise, but rather a rough cursory estimate from modest tests results and specific assumptions.
Vt = Velocity of Air in Wind Tunnel Tests (m/s)Vr = Velocity of Rocket Launch (m/s) -- use 2/3 maximum velocity to approximate full rangeCdt = Apparent Drag Coefficient from Test Resultsρ = Air Density (1.22 Kg/m3) η = 2 (factor based on the ratio of wetted surface area to projected frontal area of the rocket
with a value of 2 being nominal for a typical 2 liter water rocket)
1 - sqrt ( Vt / Vr)Eq (5): Cdr = Cdt 1 -
η ( 1 + (Cdt / 1.17))
The astute reader may notice that you will need to know something about how fast your rocketclimbs (Vr) in actual launches before you can use equation 5. An analytical means of obtainingthis information is to use an apogee simulation program like Water Rocket Fun to iterate andconverge towards a drag coefficient that is consistent with the results the simulation calculates.To do this, start out using the apparent drag coefficient (Cdt) in your rocket apogee program tofind an initial estimate of the maximum velocity (Vr) and use it in equation 5 to determine a moreconsistent drag coefficient (Cdr). Then put the calculated (Cdr) back into the simulator programas a better estimate of the drag coefficient and again get a new prediction of the maximumvelocity (Vr) of your rocket launch. In this manner continue to iterate and improve your estimateof maximum launch velocity (Vr) and drag coefficient (Cdr) until the results of Vr and Cdr aresatisfactorily consistent (in most cases one iteration will be sufficient).
You may wish to verify your drag calculations with an actual launch before you try to optimizethe fluid and mass of your rocket to obtain the highest apogee. You can use the methodoutlined in the info section of the Water Rocket Fun program to track your launch from twoseparate positions and triangulate the results to determine the apogee of a test launch.Another quick approximate way to find the apogee of your launches is based on the time yourrocket remains in the air. A good equation to use for time was developed by Dean Wheeler andcan be found at: http://www.cchem.berkeley.edu/~jsngrp/dean/benchtop/motion.htm. Once youknow how high your rocket goes, you can use the Water Rocket Fun program to back out whatdrag value must be used to get an apogee consistent with the initial conditions of your launch.
When you are satisfied with your estimation of the drag coefficient for your rocket, you can workthe Water Rocket Fun program, or other simulator, to determine the optimum amount of waterand mass to use to achieve the highest apogees.
Ver 9.01 Copyright © 2001 Seeds Software All Rights Reserved

Simple Drag Tests for Water Rockets page 13
Appendix B - Limitations
Limitations of the lab and methodology:
• The theory, drag profile, and simplifications used to derive equation 5 limit its validity tothose of your basic 1 to 3 liter soda bottle water rocket launches (the basis is a 2 liter bottlebeing tested at 4.5 m/s over a fan). Pyro rockets and water rockets made from long tubes,that achieve a higher rate of climb, are likely to operate within a different Reynold’s numberrange, and may approach a drag coefficient of constant value.
• The value for Vr should not be taken to be more than approximately 70 m/s which is aboutthe speed -- depending on the size of the rocket -- that the influence of friction has becomeminimal. The drag that develops above this speed is likely to be a pressure dominatedaction due to the high momentum of the air and hence more or less constant.
• The stability of the rocket is also an important factor in the apogee performance of yourrocket. You should use the Barrowman equations and/or do a spin test to help you designand check the stability of your rockets. Additional drag is induced by the fins as they work tokeep the flight of the rocket straight and true. The more efficient the fins are at keeping therocket stable, the less drag they will create in doing so. The turbulence in the flow of your fanset-up forces the fins to act, to some extent, to stabilize the rocket and hence in a crudesense include the drag they induce stabilizing your rocket. But the accuracy of this influenceis unknown and should not be considered a substitute for doing stability checks -- theaccuracy of the methodology depends on assuming the rocket will fly stable.
• The actual drag coefficient of a water rocket launch is typically not a constant as the velocityof the rocket changes and most likely is never moving fast enough to become a constant .Sophisticated wind tunnel testing would be required to precisely account for how the dragcoefficient changes with velocity. Since this information is so difficult to acquire and include,most simulators instead assume a constant drag coefficient for the drag profile. Hence thedrag coefficient provided for the simulator usually needs to be a nominal average value thatapproximates the effects of the full range of the drag profile.
• The air flow above the fan is not very consistent. It tends to vary by location and height abovethe fan. Even where you stand relative to the fan can have an influence on the results youmeasure. There are many improvements you can make to build a better wind tunnel. Addingwalls to the sides and a grate to the fan face may make the flow more consistent. However,be careful assuming these modifications bring about better results. Walls that are too closewill influence the flow inside and around the rocket while adding additional grating maymake the flow too slow to get meaningful results. Judicious testing is needed to assesswhether any changes are in fact an improvement. If you are really ambitious there are anumber of plans around for wind tunnels that you can build yourself. As long as any of thesetunnels are big enough for the rocket, they are almost certain to be superior to doing thingswith a fan. With a more refined wind tunnel many of the tests suggested to do in this labcould be done more concisely and probably would give more definitive results.
Ver 9.01 Copyright © 2001 Seeds Software All Rights Reserved

Simple Drag Tests for Water Rockets page 14
Appendix C - Submission Information to Provide
Name or Group: _______________________________________
School or Institution: _______________________________________
Address
Street: _______________________________________________________Street: _______________________________________________________City: _______________ State:_________ Zip: _______Country: ________
Distance of CD above Fan Face: ______ (m) Apparent Fan Velocity: ____ (m/s)
Sample Test Matrix for Bottle Design (Procedure 2)
Measured Mass (g)
Test Fan Off Fan On Drag Cr (estimate)
2 Liter Bottle + Extra Mass _____ _____ _____Bottle + Nose 1 _____ _____ _____Bottle + Nose 2 _____ _____ _____Bottle + Nose 3 _____ _____ _____
Bottle + Best Nose + 4 Fin A _____ _____ _____ _____Bottle + Best Nose + 4 Fin B _____ _____ _____ _____Bottle + Best Nose + 4 Fin C _____ _____ _____ _____
Provide Dimensions, Materials, and Pictures or Illustrations of Components:
Nose Cones Fins Tail Modifications
Any Additional Comments and/or Tests Results
Send to:
email: [email protected] snail mail: Seeds Software, PO Box 30157, Seattle, WA 98103, USA
Thank You for your Consideration!
Ver 9.01 Copyright © 2001 Seeds Software All Rights Reserved

Introduction to Airplane DesignA Theme for Math and Science With Hands-On Lessons
By: Seeds Software
Introduction to Airplane Design is a fun software packagethat provides an incredible way to use technology in theclassroom. This software makes it easy to teach an excit-ing aerospace unit. By using interactive simulations andpowerful design tools you will be impressed at how faststudents learn. Have your students analyze and designtheir own performance gliders on the computer and thenbuild and test their designs off-line. As they learn morethey can advance to powered flight by including arubber band motor and propeller in their designs. Yourstudents can explore their world by taking flight!
About the Software
This software package provides much more than gamefun, it teaches science with challenge, inquiry, and ac-countability, yet it is easy to implement and use, andclassroom tested. The in-depth content of this packagecan provide 1 to 8 weeks of classroom curriculum thatnicely fits learning standards, or can be a comprehensiveresource. For grades 7 -12.
The package includes lessons and numerous activitiesand plans for labs which keeps the students actively in-volved with the software, gives the students the oppor-tunity to test aerodynamic principles using a wind tun-nel simulation and flying aircraft, and helps them to un-derstand how to design their own aircraft that fly well.These lessons will free up more time for you to teach!
Science Principles Include:
Balance of Forces Bernoulli’s PrincipleCentrifugal Action DensityEnergy FluidForce FrictionGeometric Change Line of ActionNewton’s Laws Moment or TorquePower PressureSupersonic Velocity
Important Aerodynamic Concepts:
Gravity LiftThrust DragStability Control
Important Design Principles:
Airfoil Shape Wing ShapeWing Configuration Tail RequirementsControl Surfaces Balance and TrimDihedral Propulsion
Aircraft Design Computer:
Easy input of dimensions3-D visual of the aircraft designIn-depth analysis of performanceDetection and explanations of design problemsSimulation of glide performance
Software Content:
28 computer simulations58 detailed explanations of principles22 colorful and illustrative diagrams10 graphs of aerodynamic trends
Optional Activities and Labs:
16 classroom activity lessons with objectives10 hands-on lab plans with material listsDetailed design and build guidesAnswers, teachers notes, and 5 quizzes
Science of Software
Climb into our software and take your class soaring to new levels of excitement and learning!
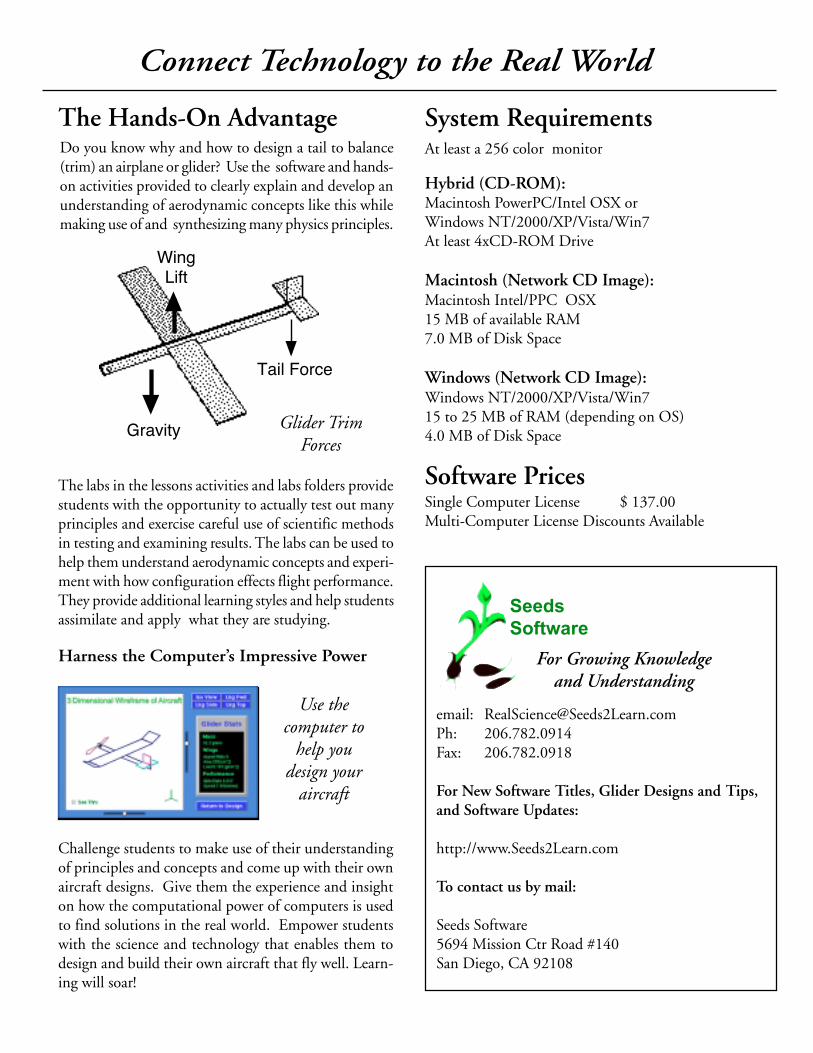
WingLift
Gravity
Tail Force
The Hands-On AdvantageDo you know why and how to design a tail to balance(trim) an airplane or glider? Use the software and hands-on activities provided to clearly explain and develop anunderstanding of aerodynamic concepts like this whilemaking use of and synthesizing many physics principles.
Glider TrimForces
The labs in the lessons activities and labs folders providestudents with the opportunity to actually test out manyprinciples and exercise careful use of scientific methodsin testing and examining results. The labs can be used tohelp them understand aerodynamic concepts and experi-ment with how configuration effects flight performance.They provide additional learning styles and help studentsassimilate and apply what they are studying.
Harness the Computer’s Impressive Power
Challenge students to make use of their understandingof principles and concepts and come up with their ownaircraft designs. Give them the experience and insighton how the computational power of computers is usedto find solutions in the real world. Empower studentswith the science and technology that enables them todesign and build their own aircraft that fly well. Learn-ing will soar!
Software Prices
System RequirementsAt least a 256 color monitor
Hybrid (CD-ROM):Macintosh PowerPC/Intel OSX orWindows NT/2000/XP/Vista/Win7At least 4xCD-ROM Drive
Macintosh (Network CD Image):Macintosh Intel/PPC OSX15 MB of available RAM7.0 MB of Disk Space
Windows (Network CD Image):Windows NT/2000/XP/Vista/Win715 to 25 MB of RAM (depending on OS)4.0 MB of Disk Space
Single Computer License $ 137.00Multi-Computer License Discounts Available
email: [email protected]: 206.782.0914Fax: 206.782.0918
For New Software Titles, Glider Designs and Tips,and Software Updates:
http://www.Seeds2Learn.com
To contact us by mail:
Seeds Software5694 Mission Ctr Road #140San Diego, CA 92108
Connect Technology to the Real World
Seeds
Software
For Growing Knowledgeand Understanding
Use thecomputer to
help youdesign your
aircraft

The Bungee Egg ChallengeA Theme for Math and Science With Hands-On Lessons
By: Seeds Software
The Bungee Egg Challenge is a software package to learnmath and science. Most egg drop projects are big on funbut lacking in science, being trial and error. With theBungee Egg Challenge, students can experience the thrilland fulfillment of using science to achieve success as well!You can use technology wisely to get students to thinkand design.
About the Software
This software package provides much more than gamefun, it teaches science with challenge, inquiry, and ac-countability, yet it is easy to implement and use, andclassroom tested. Students must do experimental sci-ence and make use of realistic design processes to suc-cessfully protect their egg from a reasonable drop height.The software nicely fits many learning standard. It isdesigned for grades 8 to 12.
Additional Egg Activities and Lab write-ups providenumerous lessons to keep the students actively involved.It includes plans for labs which have the students per-form careful experiments to determine the stretch prop-erties of candidate chord materials. The students mustdecide which chord materials to use to suspend their egginside a container and input the properties into the com-puter to predict what happens to the egg when dropped.
Science Principles Include:
Damping ElasticityForces GravityImpact Kinetic & Potential Energy
Important Design Considerations:
Energy AbsorptionEnergy DissipationHarmonic MotionStatistical Design AllowableStiffness and Displacements
Egg Drop Computer Simulation:
Easy input of dimensions and propertiesVisual view of the egg container designSimulation of the drop eventIn-depth analysis of the impact dynamicsDetection and simulation of failuresTime plots of egg motion energy & acting forces
Software Content:
8 detailed explanations of physics principles10 computer simulations17 physical science formulas explained10 interactive graphs of physics trends
Additional Activities and Labs Disk:
11 classroom activity lessons with objectives5 hands-on lab plans with material lists & notesAnswers and teachers notes
Experimental Testing in Labs:
Stretch characteristics of chordsInternal friction in stretching chordsStrength of eggsDynamic impact drop event
Science of Software
Drop eggs the scientific way and rebound with awealth of knowledge and understanding

The Hands-On AdvantageHow do you determine if an egg will survive a givendrop height suspended inside a bottle? Do you knowwhat forces develop, where the best place to positionthe egg is inside the bottle, how much the chords willstretch, how fast energy is dissipated? With this pack-age you can show students how science principles canbe used to answer these questions. You can simplify avery exciting but advanced problem down into under-standable concepts. Students can assemble and assimi-late science and technology to do realistic designs usingan elegant but easy to run computer solution.
If the chords are toosoft, the egg will crash
or slingshot into thebottle and SPLAT!when the bottle hits
the ground
The labs available in the Lessons folders show studentshow to conduct tests to determine the stretching andinternal friction characteristics present in likely chordsuspension materials. The tests give the students anappreciation of how important it is to take careful sci-entific measurements and how these measurements canbe used; test results are used as properties by the soft-ware to calculate what happens to the egg inside thecontainer when it impacts the ground.
Software Prices
System RequirementsAt least a 256 color monitor
Hybrid (CD-ROM):Macintosh PowerPC/Intel OSX orWindows NT/2000/XP/Vista/W in7At least 4xCD-ROM Drive
Macintosh (Network CD Image):Macintosh Intel/PPC OS X6.0 MB of available RAM7.0 MB of Disk Space
Windows (Network CD Image):Windows NT/2000/XP/ V ista/W in78 to 16 MB of RAM (depending of OS)4.0 MB of Disk Space
Single Computer License $ 97.00Multi-Computer License Discounts Available
email: [email protected]: 206.782.0914Fax: 206.782.0918
Get more information and free software atour web site:
http://www.Seeds2Learn.com
To contact us by mail:
Seeds Software5694 M ission C tr Road #140San Diego, CA 92108
Connect Technology to the Real World
If the chords are toostiff, the egg will pullapart and break when
the bottle hits theground
SeedsSoftware
For Growing Knowledgeand Understanding

Global Warming: Understanding Greenhouse Gases
A Theme for Math and Science With Hands-On LessonsBy: Seeds Software
Global warming is an incredibly rich theme to teach yourstudents science while investigating a very importantenvironmental issue. With this package you can pro-vide students with an understanding of the science be-hind global warming instead of just having them look atthe data of predictions. The package includes an au-thentic global climate model to use to find answers andtake ownership of predictions.
About the Software
This software package provides much more than gamefun, it teaches science with challenge, inquiry, and ac-countability, yet it is easy to implement and use, andclassroom tested. The in-depth content of this packagecan provide 1 to 8 weeks of classroom curriculum thatnicely fits many learning standards, or can be a compre-hensive resource. For grades 8-12.
Included in the package are write-ups of lessons andnumerous hands-on labs in a modifiable format. Theselessons and labs keep the students actively involved withthe software, give the students the opportunity to testscientific principles, and help them to get an intuitivefeel of the principles. The lessons will free up more timefor you to teach!
Science Principles Include:
Absorptance Beer -Lambert LawBlackbodies EmittanceEnergy Equilibrium Heat CapacityInverse Sq. Law Kirchoff ’s LawPhotons Planck’s LawPlanet Atmospheres RadianceRadiation Spectrum ResonanceSpecific Heat Stefan-Boltzmann LawTransmittance Waves
Supporting Material:
The content on global warming, and the global climatemodel, are based extensively on the final reports of theIntergovernmental Panel on Climate Change (IPCC1990-2001). These recent reports include the prepara-tion, workings, and review of hundreds of leading scien-tists from 25 counties. The reports represent an infor-mation source of the finest quality and authority.
Simulations & Global Climate Model:
The software provides simulations of many of the im-portant concepts needed to understand global warming.These simulations make the concepts much more acces-sible and meaningful to students than they are in textbooks. The global climate model included has a simpleelegance. It is easy to use with clear understandable re-sults; yet it unleashes the incredible computational powerof computers and uses many advanced methods to de-liver compelling inferences on the future of the Earth.
Activities and Labs:
9 classroom activity lessons with objectives9 hands-on lab plans with material listsAnswers and teachers notes
Science of Software
Study the environment to learn science and physics

The Hands-On AdvantageEveryone has read something about global warming andhow our emissions and activities may be causing cli-mate changes. But how many individuals really under-stand the science behind the information? Consider howmuch more meaningful and comprehensible this im-portant information can be with a working knowledgeof the processes that are causing change.
Computer Simulations:
The concepts of global warming are more than publica-tions of predictions and observation of data, it involvesan astonishing amount of science that is extremely chal-lenging for scientists. By using computer simulations incombination with off-line labs many of the fundamen-tals are made accessible and understandable to students,abstractions and advanced formulas become animatedand intuitive. Students can use the package to learnwhy climate change is a very real environmental issue.
Turn your students onto technology. Give them the ex-perience and insight on how the computational powerof computers and technology are used to study the realworld. Empower students with the science and tech-nology that enables them to understand their environ-ment. Students can do more than play games or look atdata. Don’t be surprised to find your students far moreinterested and intrigued doing real science with power-ful science tools. With our authentic global climatemodel you can give them ownership of global warmingissues and the many science principles involved.
Software Prices
System RequirementsAt least a 256 color monitor
Hybrid (CD-ROM):Macintosh PowerPC/Intel OSX orWindows NT/2000/XP/Vista/Win7At least 4xCD-ROM Drive
Macintosh (Network CD Image):Macintosh PPC/Intel OS X10 MB of available RAM7.0 MB of Disk Space
Windows (Network CD Image):Windows NT/2000/XP/Vista/Win78 to 16 MB of RAM (depending of OS)4.0 MB of Disk Space
Single Computer License $137.00Multi-Computer License Discounts Available
email: [email protected]: 206.782.0914Fax: 206.782.0918
Get more information and free software atour web site:
http://www.Seeds2Learn.com
To contact us by mail:
Seeds Software5694 Mission Ctr Road #140San Diego, CA 92108
Connect Technology to the Real World
Simulations of important concepts improvelearning speed and comprehension
SeedsSoftware
For Growing Knowledgeand Understanding

Science Methods: Searching for Solutions Experimentally
A Theme for Math and Science With Hands-On LessonsBy: Seeds Software
Science Methods: Searching for Solutions Experimen-tally is a software package to teach students how mathand science can be used to find experimental solutions;it introduces students to the important ideas andmethods of Experimental Design.
A simple theme of color mixing and matching is used asa model example of many real world problems that em-body several inputs which combine to form a result. Theproblem is to find how much of each input is neededto get the results that you want. For color mixing, stu-dents have fun trying to find the amounts of the colorsred, green, and blue required to match a specimen colorof unknown formulation.
About the Software
The natural tendency is to try to solve these problemsusing trial and error. With this package students willdiscover how ineffective guessing is and learn to makeuse of math and science methods to efficiently convergeto desired solutions. The software is structured to workover a wide range of abilities and can be used to supportmany learning standards. The package is classroom testedand is recommended for grades 5-12.
Color Theory:
Introduce students to color theory and how monitorsuse primary colors to generate a wide spectrum of hueswhile having fun and doing challenging activities.
Science Methods Include:
Pattern RecognitionInformation ModelingAccuracy and Error MeasurementSystematic Problem SolvingSolution Convergence
Solution Strategies:
GuessError MeasurementBisectionRatioGradient
Software Content:
Five Computer Simulations of Color Mixing &Problem Solving Methods3 Dimensional Information ModelingSimulation of Experimental Design Scenarios
Activities and Labs:
6 classroom activity lessons with objectives2 hands-on lab plans with material lists, notesAnswers and explanations
Applicable Science Curriculum
AstronomyBiologyChemistryOther Physical SciencesPhysics
Science of Software
Illuminate Sciencewith Colors!

The Hands-On AdvantageHow do you match the color, to repaint a car that hasbeen damaged, when the original color of the car hasfaded? How do you mix several color dyes togetherfor an accessory when you wish to match the color of adress? How does an astronomer determine the abun-dance of a certain heavy metal in the photoshere of astar when the observed spectrum is effected by the tem-perature, density, and pressure of the star? Experimen-tal Design problems abound in all aspects of life; thequestion asked often is how much of several known in-puts is needed to get the results desired.
Adding Colors to Find a Match
This package includes lab lessons to ask this question.Students perform experiments mixing food coloringdyes, trying to match a color of unknown formulation.These labs help the students grasp the issues and de-velop an awareness of the difficulties in arriving at anexperimental solution. Direct links between computertechnology and the lab experiments are established bysimulating the same type of experiments on the com-puter.
By doing the same color mixing experiments on thecomputer, students will discover how much more rap-idly they can: do the color mixing tests, investigate so-lution strategies, and develop pattern recognition. Theywill experience how computers are used as a tool to studyreal world problems and learn solution strategies.
The package also includes lessons that help the studentsunderstand the solution strategies that are presented andkeep the students actively involved with the software.
Software Prices
System RequirementsAt least a 256 color monitor
Hybrid (CD-ROM):Macintosh PowerPC/Intel OSXWindows NT/2000/XP/Vista/W in7At least 4xCD-ROM Drive
Macintosh (Network CD Image):Macintosh PPC/Intel OS X8.0 MB of available RAM7.0 MB of Disk Space
Windows (Network CD Image):Windows NT/2000/XP/Vista/W in78 to 16 MB of RAM (depending of OS)4.0 MB of Disk Space
Single Computer License $ 40.00Multi-Computer License Discounts Available
email: [email protected]: 206.782.0914Fax: 206.782.0918
Get more information and free software atour web site:
http://www.Seeds2Learn.com
To contact us by mail:
Seeds Software5694 M ission C tr Road #140San Diego, CA 92108
Connect Technology to the Real World
SeedsSoftware
For Growing Knowledgeand Understanding
Unknown

Seeds Software Order Form
Web:www.Seeds2Learn.com
Email: [email protected] Phone: 206.782.0914 Fax: 206.782.0918
Notes:(#)max. number of computers ~NW is for multi-install, CD is for multiple Hybrid CD’s in Lab or Site
Name: Phone:
Address:
__ Purchase Order # (US schools only)
__ VISA/MasterCard Card #:
Card Holder’s Name: Exp. Date:
P.O. or Card Holder’s Signature:
*Notes: NW are program images on a Medium to install onto computer network hard drives. Hybrid CD’s & Flash Drives load into RAM and run without installation on either Macintosh or Windows.
Ordering: Check options wanted in table above and calculate prices, subtotal, and total (** CA State (residents) x subtotal by 0.0775 for sales tax).
Provide required payment and mailing information.Be sure to specify computer medium choices.
Mail: Seeds Software, 5694 Mission Center Road #140, SD, CA 92108 Fax To: 206-782-0918
Warranty: Send complete package back to Seeds Software by verifiable means within 30 days for your money back if not satisfied.
Title: Software & Lessons
Single (1) License
√ Lab (5)~ License
√ Lab (15)~ License
√ Site (30)~ License
√ Selection Prices
Introduction to Airplane Design
$137.00 Hybrid
$285.50 NW $357.00 CD
$397.00 NW $507.00 CD
$536.00 NW $697.00 CD
The Bungee Egg Challenge
$97.00 Hybrid
$151.50 NW $189.50 CD
$269.00 NW $344.50 CD
$374.00 NW $487.00 CD
Science Methods: Searching for Solutions
$40.00 Hybrid
$95.50 NW $119.50 CD
$215.00 NW $274.50 CD
$321.00 NW $417.00 CD
Global Warming: Greenhouse Gases
$137.00 Hybrid
$309.50 NW $387.00 CD
$443.50 NW $567.00 CD
$613.00 NW $797.00 CD
Science by Design $279.00 Single only Single only Single only
Subtotal
Tax **
S&H (USA) $12.00
Total
Choose Either Medium Choose Either Medium
CD* Flash Drive*
Required for Hybrid or NW Required for Hybrid or NW
(works on Mac & Windows) (works on Mac & Windows)