simon burgess and marcela umaña-aponte september 2011 ... · likely to expect to stay in full time...
TRANSCRIPT

THE CENTRE FOR MARKET AND PUBLIC ORGANISATION
Centre for Market and Public Organisation Bristol Institute of Public Affairs
University of Bristol 2 Priory Road
Bristol BS8 1TX http://www.bristol.ac.uk/cmpo/
Tel: (0117) 33 10952 Fax: (0117) 33 10705
E-mail: [email protected] The Centre for Market and Public Organisation (CMPO) is a leading research centre, combining expertise in economics, geography and law. Our objective is to study the intersection between the public and private sectors of the economy, and in particular to understand the right way to organise and deliver public services. The Centre aims to develop research, contribute to the public debate and inform policy-making. CMPO, now an ESRC Research Centre was established in 1998 with two large grants from The Leverhulme Trust. In 2004 we were awarded ESRC Research Centre status, and CMPO now combines core funding from both the ESRC and the Trust.
ISSN 1473-625X
Raising your sights: the impact of friendship networks on educational aspirations
Simon Burgess and Marcela Umaña-Aponte
September 2011
Working Paper No. 11/271

CMPO Working Paper Series No. 11/271
Raising your sights: the impact of friendship networks on educational aspirations
Simon Burgess
and Marcela Umaña-Aponte
CMPO, University of Bristol
September 2011
Abstract We use a unique longitudinal dataset on an adolescent friendship network to evaluate variations on educational aspirations of young people from disadvantaged and middle income backgrounds. We evaluate whether such people who have friends from wealthier backgrounds have higher aspirations than otherwise similar young people without such links. The results suggest that there are such effects. Individuals from low income families with friends from high income families are 15.2% more likely to expect to stay in full time education after they finish compulsory school. We find similar effects for the educational aspirations and expectations of middle income children. These effects are quantitatively and statistically significant, and robust to the inclusion of a wide range of control variables. We also show that friend’s mother’s aspirations matter too. Having friends whose mothers hope they will go to university increases the wish to carry on full time education by 30% points. This is conditional on the young person’s own mother’s aspirations for her/him. Keywords: Networks, Friendships, Aspirations, Adolescents, Income, Education. JEL Classification: L14, C33, I24, Z13, I3 Electronic version:
www.bristol.ac.uk/cmpo/publications/papers/2011/wp271.pdf
Acknowledgements This work was funded by the ESRC Large Grant RES-060-23-0011 - An Examination of Family Socio-economic Status on Outcomes in Late Childhood and Adolescence. Address for correspondence CMPO, Bristol Institute of Public Affairs University of Bristol 2 Priory Road Bristol BS8 1TX [email protected] www.bristol.ac.uk/cmpo/
1 Introduction
It has become increasingly fashionable for policy makers to cite low aspirations as one factor
behind poor educational performance. There are certainly substantial differences in stated
educational aspirations, with for example white boys from disadvantaged backgrounds gener-
ally having the lowest fraction wanting to stay in education beyond the minimum compulsory
time. Studies also show that high aspirations are associated with high attainment in school,
though obviously establishing causality is not straightforward (see Gregg and Washbrook;
2011; and the review in Portes et al.; 2010). Given this background, there is a search for poli-
cies to raise aspirations as one route to raise attainment. However, this is not straightforward
as we do not have a fully articulated model of the formation of aspirations. Understanding
the forces that influence aspirations may help the formation of better policies to raise the
sights of students.
One factor sometimes discussed in an informal way is the importance of role models (Jodl
et al.; 2001; Calvo-Armengol and Jackson; 2009). The idea is that people observe others
whom they value, and thereafter aspire to be like them. This is very hard to formalise and
test without any view of where the role models may be found. One potential source of role
models for a young person is her set of friends. The growing literature on social networks
emphasises that networks are transmitters of information and values (Jackson; 2010; Jackson
and Yariv; 2010). In this paper, we use data on friendship networks to test a possible source
of influence on aspirations.
We use a unique dataset on adolescent friendship networks that is embedded in a large
scale birth cohort. This cohort gives us the life history of several thousand young people,
born between April 1991 and December 1992 in and around the city of Bristol in the UK.
We have very rich data, fully described below, on many aspects of the young people and
their families, including their educational aspirations. We set up a questionnaire to seek the
names of friends of the respondents in order to map the networks between them (see below
and Burgess et al.; 2011, for further details). This yielded a network of over 14,000 links, of
which we select a sample of almost 7,000 for this study.
As with all models of network effects, there is a problem of identification: how to dis-
tinguish the causal effect of the network on an individual from the (endogenous) choice to
build that link in the first place. Our approach is to use the fact that we have longitudinal
data and crucially that we know when the friendship was formed. In fact, in our data at
least, a substantial fraction of the friendships are very long lasting. We use friendship links
that were formed in primary school, so at least 3 years before the question on aspirations
was put, and in many cases 5 or more years before. It seems implausible to argue that 8 and
9 year old children are forming friendships strategically to aid their future prospects (see
Burgess et al.; 2011, for a discussion of homophily and the formation of friendships in this
2

data). It is not implausible to suggest that the parents of those children help them to form
links that they believe are “useful” for life, but we can control for a range of attributes of
both sets of parents (that is, the focus child’s parents and the focus child’s friend’s parents)
including their aspirations for their children. Whilst this is certainly not as clean an identi-
fication as could be achieved in experimental data, it seems a reasonable strategy to adopt
in observational data in a real world friendship network.
We focus our attention on children from disadvantaged and middle income backgrounds,
and ask whether such children who have friends from wealthier background have higher
aspirations than otherwise similar children without such links. The results suggest that
there are such effects. They are not very precisely measured but they are robust to the
inclusion of a broad set of controls concerning the child, her/his parents and the parents of
the friend.
The next section of the paper summarises the existing evidence on aspirations, and section
3 provides details of our data. Section 4 sets out the methodology, and section 5 presents
our results. We finally offer some conclusions in section 5.
2 Background
Longitudinal studies across many disciplines1 have shown that people with higher educa-
tional aspirations in adolescence achieve better educational and occupational outcomes in
adulthood, and therefore, higher socioeconomic position (SEP)2. Early works on this associ-
ation were developed in the late sixties and early seventies by Sewell et al. (1969) and Sewell
and Hauser (1972). They introduced psychological measures in a model of status attain-
ment for a cohort of high school students from Wisconsin (the “Wisconsin Model”). Their
findings suggest that high aspirations, teachers’ and parental encouragement, and friends’
aspirations are associated with higher educational and occupational attainment, and earn-
ings. Recent studies show that high teenage educational aspirations encourage educational
attainment (Chowdry et al.; 2011) and produce better occupational outcomes (Schoon and
Parsons; 2002). In contrast, low expectations stimulate risk behaviour and school dropout
(Clark et al.; 2006). Among immigrants in Spain and the United States, aspirations are
also a strong predictor of educational attainment and occupational success (Feliciano and
Rumbaut; 2005; Portes et al.; 2010). These results are consistent with economic models
which predict that non-cognitive skills and motivation are important determinants of suc-
cess (Heckman; 2000; Cunha et al.; 2010). At the macroeconomic level, economic growth
and development have been linked to aspirations since people would work hard to achieve
1Including Sociology, Psychology and Economics.2A comprehensive overview can be found in Portes et al. (2010) and Feliciano and Rumbaut (2005).
3
their aims. This behaviour outweighs the opposite effect of people giving up if they feel they
cannot reach their goals (Bogliacino and Ortoleva; 2010).
Aspirations are motivated by different internal and external factors such as gender, age,
ethnicity3, abilities, talents, personality, academic performance, family SEP, and friends’
and parental influence and behaviour (Gutman and Akerman; 2008). Parents play a key
role in shaping the aspirations of their children as they provide information, resources and
opportunities for them, as well as act as role models (Jodl et al.; 2001). Additionally, parental
academic involvement increases their children’s school performance (Gregg and Washbrook;
2011), inhibits behavioural problems and motivates higher aspirations in adolescence (Hill
et al.; 2004).
Family SEP is also a strong determinant of aspirations, mainly because family income
has an important impact on long term factors such as early cognitive development (Feinstein;
2003) and ability (Duncan and Brooks-Gunn; 2000; Cameron and Heckman; 2001). In the
short term, low-income factors such as borrowing constraints might also affect educational
outcomes (Dearden et al.; 2004) as individuals face difficulties affording educational costs.
However, this short-run effects are less relevant to discourage people from reaching higher
levels of education (Cameron and Heckman; 2001; Carneiro and Heckman; 2002; McCulloch
and Joshi; 2002). Recent longitudinal studies in the United Kingdom (UK) have analysed the
transmission mechanisms through which SEP affects educational attainment. They strongly
emphasise the central role of parental and individual aspirations in this process (Goodman
et al.; 2011; Dearden et al.; 2011; Gregg and Washbrook; 2011; Chowdry et al.; 2011).
It is undeniable that people select and influence each other through social interactions
(Jackson; 2010). This influence has been analysed by a growing literature on social networks4
and peer group effects. In networks, similarities among friends and changes in multiple
dimensions of their behaviour and beliefs –such as risk behaviour, academic aspirations
and performance, political identification, achievement beliefs, motivational beliefs, social
preferences and behavioural problems– have been associated with both an intentional choice
of friends (homophily selection) and their influence on each other (peer effects) (Kandel;
1978; Hamm; 2000; Altermatt and Pomerantz; 2003; French et al.; 2003; Wentzel et al.;
2004; Bearman and Moody; 2004; Fowler and Christakis; 2008). Positive peer effects on
academic achievement have also been amply documented (see for example, Hanushek et al.;
2003; Atkinson et al.; 2008).
One of the contributions of the present study is that it joins together the two research
areas discussed above, namely longitudinal studies with social networks, and also adds to
the recent literature on SEP and educational inequalities. We evaluate how the SEP and
3see also Bohon et al. (2006)4A review of formal models of social influence, behaviour and diffusion can be found in Jackson and Yariv
(2010) and Jackson (2008), Chapters 8-10.
4

aspirations of friends’ parents affect the educational aspirations of individuals. We believe
there are three possible mechanisms through which friends’ parents can influence individuals:
(i) indirectly, through their children friendships connections, (ii) indirectly, through the
parents of their children’s friends if they are friends among themselves (Carbonaro; 1998),
(iii) or by direct contact with their children’s friends. A recent work by Mora and Oreopoulos
(2011) has attempted to evaluate peer effects on adolescent aspirations in Spain. This is the
most relevant and similar work to ours. However, their data set is not longitudinal, just a
cross section of a friendship network, which limits the correct identification of causal effects
and confounds friendships selection with endogenous effects (Manski; 1995; Burgess et al.;
2011). In addition, their measure of adolescent aspirations is “intention to drop out” (high
school), but this does not measure other dimensions of job or educational aspirations.
3 Data and Descriptive Statistics
The Avon Longitudinal Study of Parents and Children (ALSPAC) is a long-term study which
aims to evaluate the health and development of a cohort born in the Avon area of England
from 1st April 1991 to 31st December 1992. At 15-17 years old, they received a friendships
questionnaire in which they were asked to nominate a maximum of five friends and to provide
some information about their interaction (when they met, time they spend together, what
they do together or talk about, etc., see Burgess et al. (2011) for a full description of the data).
A total of 3,123 individuals completed the questionnaire (respondents) and each nominated
on average 4.65 friends for a total of 14,503 friendship links, to 11,041 friends. Due to the
survey design, not all nominated friends are part of the ALSPAC study, thus, it is possible
that some respondents did not nominate any ALSPAC participant among their pool of
friends. For this reason, the network of ALSPAC participants consists of 2,396 respondents,
4,572 friends (including respondents nominated as friends) and and 6,961 friendship links.
In this study we are interested in the 41% (2,854) of pre-secondary school friendships,
formed when the respondent was younger than 132 months (11 years old). Our objective
is to evaluate to what extent having friends from different income backgrounds, or whose
mothers have different aspirations, affect their own educational aspirations. We want to
capture the causal effects and not the selection effects of the network. For this reason, we
select pre-secondary school friendships when the likelihood of strategic friendship fomation is
smaller, and also, before our aspiration measures were taken. Therefore, we isolate selection
effects of friendships. The variables we use are:
Individual aspirations: A questionnaire at 14 years old5 asked ALSPAC participants
5Previous research indicates that “about age 14 adolescents begin to disregard occupations that are incon-
sistent with their values, competencies, and interests” (Hill et al.; 2004; Cabinet Office Social Exclusion TaskForce; 2008)
5

whether they will carry on or leave full time education at the age of 16 (when compulsory
education ends). The questionnaire distinguished between their wish/desire (what they
would like to do) and their perception (what they think they would actually do). They
were also asked how important was having a job in which they can progress in a career.
The answers to these three questions are our measures of educational aspirations. Table A3
contains the descriptive statistics of these variables.
Parental aspirations: These are mother’s aspirations for her child’s education, reported
when the child was 9 years old. Three categories: low: if she hopes her child will get good
GCSEs6 and then leave full time education, middle: if she hopes her child will take at least
one Advanced Level (A-level) qualification7 or a similar qualification (other), and high: if
she hopes her child will go to university. We create categorical variables for each of these
levels.
Family income: Our measure of income is the log of the average of equivalised net
household income when child was young (at ages 33 and 47 months), expressed in June 1995
prices8. All ALSPAC families9 were divided into income quartiles (i.e. each representing
25% of income distribution). The second and third quartiles were grouped into one to create
three income levels: Low (25%), medium (50%) and high (25%). This data is then merged
into the friendships data. Higher and middle income families of respondents and friends are
slightly overrepresented in this sample (as shown in Table A3 and Section 3.1).
Individual characteristics: gender, ethnicity, month of birth (scaled to September
= 0), self esteem, locus of control (measured at 8 and 17 years old), and three categori-
cal variables -reported by the mother- indicating whether the child believes school results,
relationship with friends and money are important in life (sense of what is important).
Parental characteristics: Father’s education (highest educational qualification, mea-
sured just prior to the childs birth: Certificate of Secondary Education/no qualifications,
Vocational/O-level, A-level and Degree), mother’s age at the child’s birth (dummies for: less
than 20; 20-24; 25-29; 30-34; 35 or more), employment status of parents at when child was
young (four years old), the mother’s rating of whether school was a valuable experience for
her (5-point scale, standardized to unit variance); the amount and quality of mother-child
6High stakes exams at the end of compulsory schooling.7A-levels are studied over a two year period. They are also used as the standard entry qualification for
assessing applicants who want to take academic courses at universities in England, Wales and NorthernIreland.
8Income data from the ALSPAC data is banded. A median value for each band using data from theFamily Expenditure Survey was imputed to convert the income variables to real values using the 1995 RPIas a base, and then equivalise using the OECD modified scale. We also impute the value of housing benefitfor families who do not directly receive housing payments. Finally, we average over the two measures toreduce measurement error and take the log of the variable.
9Income data is available for a sample of 9,762 households to 9,888 ALSPAC children born between 1stApril 1991 and 31st December 1992.
6

educational interactions (eight 5-point items such as, helps with homework and draws or
paints with child, standardized and averaged), and other mother-child non-educational in-
teractions (nine 5-point items such as takes child to the park and does active play with child,
standardized and averaged) – see Gregg and Washbrook (2011) for further details.
3.1 Sample definition
Our unit of observation is the individual, not the friendship link. Therefore, we create a data
set of 1,650 observations, one for each respondent who nominated at least one ALSPAC pre-
secondary school friend. We take each respondent and classify their friends’ family income
and friend’s mother’s aspirations in three categories: (i) High if at least one of their friends
falls in the highest level for each parental variable (i.e. high family income/high parental
aspirations); (ii) Middle if at least one of their friends belongs to the middle level, but none
to the highest one; and (iii) Low if all their friends fall in the lowest level10.
We remove the observations with missing values for any of the variables described in
Section 3, the final sample size is 699 observations. 47% of respondents in our sample
nominated at least two primary school friends with no missing data (Table A1). 92% of
them reported that they would like to carry on full time education after finishing compulsory
education (year 11 - 16 years old). 90% believed they will continue in full time education
after years 11, and 83% considered that having a job in which they can progress in a career
is very important (Table A3). 62% of our respondents are female and 1.3% are non-white.
3.2 Descriptive statistics
On average, our respondents obtained higher KS2 scores than the full sample of ALSPAC
participants. They also have lower locus of control scores indicating that they tend to be
more internal-type individuals, who believe that an outcome is largely the result of their
own behaviour or actions. Mothers who feel that school was valuable experience are over-
represented in our sample. High income parents are also over-represented. The proportion
of families in this category is higher than the upper quartile of the distribution, for both
respondents (33%) and friends (30%). The proportion of mothers with high aspirations (child
going to university) is the same (63%) for both respondents and friends. The aspirations
of friends’ mothers are slightly higher than respondents’ mothers, as a higher proportion of
10Income: (i) High if at least one of their friends is from a high income family; (ii) Middle if at least oneof their friends belongs to a middle income family but none to a high income family; and (iii) Low if all theirfriends are from low income families. Friend’s mother’s aspirations: (i) High if at least one of their friends’mothers hopes her own child will go to university; (ii) Middle if at least one of their friends’ mothers hopesthey will take at least one A-level or will get a similar qualification, but will not go to university; and (iii)Low if all their friends’ mothers hope they will get, at most, good GCSEs.
7

them expect their children will get at least an A level or a similiar qualification (33% vs
31%), while less (4% vs 6%) hope they will just achieve good GCSEs (Table A3).
We create nine exclusive categories that combine family income and maternal aspirations
of respondents and their friends (see Table A2)11. We plot the mean value of the educational
aspirations indicator of the respondent for each category, starting from the lowest one, i.e.
low:low (Graphs 1 and 2). If friends’ parents influence individual’s aspirations we expect
that the third bar in each each level of own family income or maternal aspirations is higher
than the previous two. This is the case for most aspirations indicators in the two lower
levels of own family income and mother’s aspirations. Children from low income families
with high income friends report a higher probability of wishing (89%) and expecting (89%)
to carry on full time education after finishing compulsory school (year 11). They are also
more likely to think that having a job in which they can progress in a career is very important
(80%). Note that most of these magnitudes are higher for the low:high category than for the
mid:low, suggesting that friends’ parental SEP and aspirations might significantly influence
individual’s aspirations in both ways.
We find a similar pattern by mother’s aspirations. On average, the proportion of re-
spondents who would like and expect to carry on full time education is higher the higher
the level of their friend’s mother’s aspirations, at each level of of their own mother’s aspi-
rations. In addition, teenagers whose mother’s aspirations are low or middle and who have
friends with high aspirational mothers have higher aspirations, on average, than those in a
higher category with friends whose mother’s aspirations are low (compare bars low:high and
mid:low, and, mid:high and high:low). For the third indicator of aspirations (Having a job
in which they can progress in a career is very important) we do not observe this pattern. All
individuals in the first category (only four observations) think that having that type of job
is very important. The differences for the rest of the categories is very subtle except in the
case of mid:low and mid:mid, which are disproportionally low or high.
11In order to make the categories fully exclusive we created low:high, mid:high and high:high first. Theyindicate whether at least one friend is from the highest category either for family income or friends’ mother’saspirations. Then, each category was consecutively created excluding the previous ones as follows: low:mid,mid:mid, high:mid and low:low, mid:low, high:low. Therefore, all “-:low” categories imply all of friends arefrom the lowest category (either family income or parental aspirations), and all “-:mid” categories implythat at least a friend belongs to the middle category, but none to the highest one.
8

4 Methodology
We evaluate the influence of friends’ families and background on individual educational
aspirations, by estimating the following model,
Ai =� + �1 FPℎigℎi + �2 FPmidi + �3Pmidi × FPℎigℎi + �4Plowi × FPℎigℎi
+Xi + Ziparents+ "i
(1)
in which Ai is an aspiration indicator of young person i, as described in Section 3.
Pmidi and Plowi indicate whether the young person i belongs to a middle or low income
family. FPℎigℎi takes value of 1 if at least one of their friends belong to a high income
family. Pmidi × FPℎigℎ and Plowi × FPℎigℎ are interactions of these variables. Hence,
they indicate whether the individual, either from a middle or low income background, has
at least one friend from a high income family. �3 and �4 are the coefficients of interest
and would measure differences in the aspirations of individuals from lower categories when
they make friends from the highest category. FPmidi takes value of 1 if at least one of
their friends belongs to a middle income family but none to a high income family. We
do the same for mother’s aspirations. Xi and Zi are vectors of individual and parental
characteristics as described in section 3, and include own parental income and parental
aspirations. Equation (1) is estimated by OLS (linear probability model).
We also add school fixed effects (SFE) to control for common external factors that indi-
viduals and their friends might have been exposed to, within the school and its surroundings.
Adding SFE is important because most friends (78%) in our sample attend the same school
as the respondent. In addition, students are not randomly allocated to schools in England,
therefore, there is considerable social sorting across schools. SFE are characterized by s in
Equation (2) and the model is estimated when at least five individuals in our sample attend
each school.
Ais =� + �1 FPℎigℎis + �2 FPmidis + �3Pmidis × FPℎigℎis + �4Plowis × FPℎigℎis
+Xis + Zisparents+ s + "is
(2)
9
5 Results
5.1 Friends’ Family Income
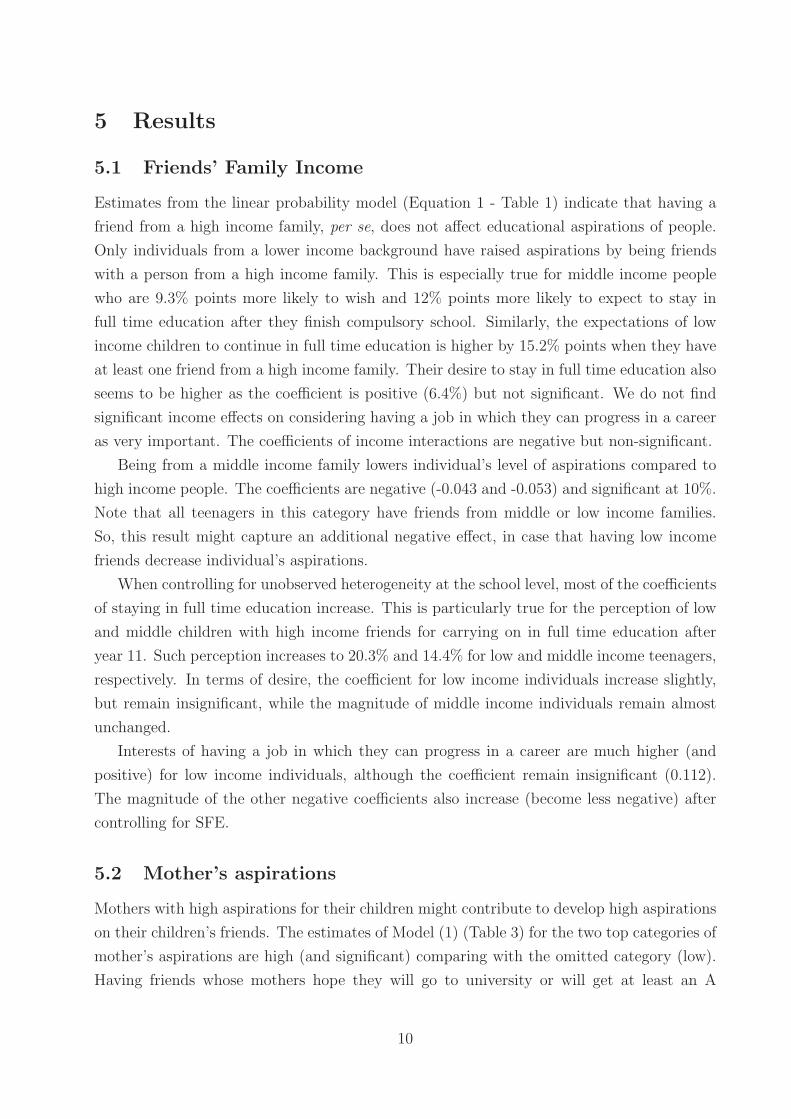
Estimates from the linear probability model (Equation 1 - Table 1) indicate that having a
friend from a high income family, per se, does not affect educational aspirations of people.
Only individuals from a lower income background have raised aspirations by being friends
with a person from a high income family. This is especially true for middle income people
who are 9.3% points more likely to wish and 12% points more likely to expect to stay in
full time education after they finish compulsory school. Similarly, the expectations of low
income children to continue in full time education is higher by 15.2% points when they have
at least one friend from a high income family. Their desire to stay in full time education also
seems to be higher as the coefficient is positive (6.4%) but not significant. We do not find
significant income effects on considering having a job in which they can progress in a career
as very important. The coefficients of income interactions are negative but non-significant.
Being from a middle income family lowers individual’s level of aspirations compared to
high income people. The coefficients are negative (-0.043 and -0.053) and significant at 10%.
Note that all teenagers in this category have friends from middle or low income families.
So, this result might capture an additional negative effect, in case that having low income
friends decrease individual’s aspirations.
When controlling for unobserved heterogeneity at the school level, most of the coefficients
of staying in full time education increase. This is particularly true for the perception of low
and middle children with high income friends for carrying on in full time education after
year 11. Such perception increases to 20.3% and 14.4% for low and middle income teenagers,
respectively. In terms of desire, the coefficient for low income individuals increase slightly,
but remain insignificant, while the magnitude of middle income individuals remain almost
unchanged.
Interests of having a job in which they can progress in a career are much higher (and
positive) for low income individuals, although the coefficient remain insignificant (0.112).
The magnitude of the other negative coefficients also increase (become less negative) after
controlling for SFE.
5.2 Mother’s aspirations
Mothers with high aspirations for their children might contribute to develop high aspirations
on their children’s friends. The estimates of Model (1) (Table 3) for the two top categories of
mother’s aspirations are high (and significant) comparing with the omitted category (low).
Having friends whose mothers hope they will go to university or will get at least an A
10

level increases the wish to carry on full time education by 30% points. The perception of
continuing on full time education is also high (27% points), although the coefficients are only
weakly significant (at 10%).
When we add controls for school common unobservable factors (SFE), the coefficients
are slightly lower but still significant. The rest of the coefficients show the correct sign, as it
is expected that children of lower aspirations mothers are less motivated to stay on full time
education after finishing compulsory school. However, all of them are not significant.
5.3 Covariates
We control for individual and parental characteristics in all models. Table A4 shows the
coefficients of those controls for the family income linear probability model (Table 1)12.
We find that aspirations and expectations of girls and non-whites are higher as previous
literature suggest (Gutman and Akerman; 2008). Academic performance is also a very
important determinant of high aspirations. Children with higher KS2 scores by 1 standard
deviation are 0.7% more likely to wish and 0.8% to expect to carry on full time education.
Parental education and involvement also encourage high aspiration levels as we find positive
effects of father’s education and mum-child educational interactions in childhood (9 years
old) on all three aspirations variables.
6 Conclusions
This paper contributes some new evidence to the discussion on the educational aspirations
of children from disadvantaged families. Policies to raise aspirations are handicapped to a
degree by an incomplete understanding of the forces shaping the aspirations of young people.
We have taken the line that one major factor might be the circumstances and attitudes of
friends. We exploit a new and unique dataset on we collected on adolescent friendship
networks, embedded in a large scale birth cohort in the UK. We argue that the longitudinal
nature of this data plus our knowledge of the length of friendships and the rich set of controls
gives us a good chance to identify a causal effect of the network.
We find that young people from low income families with friends from high income families
have higher educational expectations and aspirations than similar young people from low
income families without such friends. This effect is quantitatively and statistically significant,
and robust to the inclusion of a wide range of control variables. We also show that for a
young person, the aspirations for her own child of the young person’s friend’s mother matter
too. This is conditional on the young person’s own mother’s aspirations for her/him. This
12These results are very similar for all models. Full results available upon request.
11
result suggests that young people’s aspirations are amenable to change. The circumstances
and values of their good (long-lasting) friends do appear to modify their own aspirations.
Broadening this out, it seems that probably implicit messages from trusted sources do matter.
While it seems unlikely that there are direct policy implications in terms of influencing
friendship formation, the results do provide some hope that messages on aspirations might
have weight if carefully crafted. It also raises the policy importance of further understanding
friendship formation (which we discuss in Burgess et al.; 2011). Finally, the result suggests
that providing contexts - in this case schools - where children of different social classes can
meet and potentially befriend each other may have later implications for the aspirations of
disadvantaged children. This is part of the case for comprehensive schools, not selective or
otherwise segregated schools.
References
Altermatt, E. and Pomerantz, E. (2003). The development of competence-related and mo-
tivational beliefs: An investigation of similarity and influence among friends, Journal of
Educational Psychology 95(1): 111–123.
Atkinson, A., Burgess, S., Gregg, P., Propper, C. and Proud, S. (2008). The impact of class-
room peer groups on pupil gcse results, The Centre for Market and Public Organisation .
URL: http://www.bris.ac.uk/cmpo/publications/papers/2008/wp187.pdf
Bearman, P. and Moody, J. (2004). Suicide and friendships among American adolescents,
American Journal of Public Health 94(1): 89.
Bogliacino, F. and Ortoleva, P. (2010). Aspirations and growth: a model where the income
of others acts as a reference point, Technical report, Working paper.
Bohon, S., Johnson, M. and Gorman, B. (2006). College aspirations and expectations among
latino adolescents in the united states, Social Problems pp. 207–225.
Burgess, S., Sanderson, E. and Umana-Aponte, M. (2011). School ties: An analysis of
homophily in an adolescent friendship network., The Centre for Market and Public Or-
ganisation 11/267.
URL: http://www.bris.ac.uk/cmpo/publications/papers/2011/wp267.pdf
Cabinet Office Social Exclusion Task Force (2008). Aspiration and attainment amongst
young people in deprived communities, Department for Communities and Local Govern-
ment / Department for Children, Schools and Families.
12

URL: http://lx.iriss.org.uk/content/aspiration-and-attainment-amongst-young-people-
deprived-communities-analysis-and-discussion-
Calvo-Armengol, A. and Jackson, M. (2009). Like father, like son: Social network exter-
nalities and parent-child correlation in behavior, American Economic Journal: Microeco-
nomics 1(1): 124–150.
Cameron, S. and Heckman, J. (2001). The dynamics of educational attainment for blacks,
whites and hispanics, Journal of Political Economy 109(3): 455–499.
Carbonaro, W. (1998). A little help from my friend’s parents: Intergenerational closure and
educational outcomes, Sociology of Education pp. 295–313.
Carneiro, P. and Heckman, J. (2002). The evidence on credit constraints in post-secondary
schooling*, The Economic Journal 112(482): 705–734.
Chowdry, H., Crawford, C. and Goodman, A. (2011). The role of attitudes and behaviours
in explaining socio-economic differences in attainment at age 16, Longitudinal and Life
Course Studies 2(1): 59–76.
Clark, J., Kim, B., Poulton, R. and Milne, B. (2006). The role of low expectations in
health and education investment and hazardous consumption, Canadian Journal of Eco-
nomics/Revue canadienne d’economique 39(4): 1151–1172.
Cunha, F., Heckman, J. and Schennach, S. (2010). Estimating the technology of cognitive
and noncognitive skill formation, Econometrica 78(3): 883–931.
Dearden, L., McGranahan, L. and Sianesi, B. (2004). The role of credit constraints in
educational choices: evidence from NCDS and BCS70.
Dearden, L., Sibieta, L., Sylva, K. and for Fiscal Studies (Great Britain), I. (2011). The
socio-economic gradient in early child outcomes: evidence from the millennium cohort
study, Longitudinal and Life Course Studies: International Journal 2(1): 19–40.
Duncan, G. and Brooks-Gunn, J. (2000). Family poverty, welfare reform, and child devel-
opment, Child Development 71(1): 188–196.
Feinstein, L. (2003). Inequality in the early cognitive development of british children in the
1970 cohort, Economica pp. 73–97.
Feliciano, C. and Rumbaut, R. (2005). Gendered paths: Educational and occupational
expectations and outcomes among adult children of immigrants, Ethnic and Racial Studies
28(6): 1087–1118.
13
Fowler, J. and Christakis, N. (2008). Dynamic spread of happiness in a large social net-
work: longitudinal analysis over 20 years in the Framingham Heart Study, British Medical
Journal 337(Dec).
French, D., Jansen, E., Riansari, M. and Setiono, K. (2003). Friendships of Indonesian
children: Adjustment of children who differ in friendship presence and similarity between
mutual friends, Social Development 12(4): 605–621.
Goodman, A., Gregg, P. and Washbrook, E. (2011). Childrens educational attainment and
the aspirations, attitudes and behaviours of parents and children through childhood in the
uk, Longitudinal and Life Course Studies: International Journal 2(1): 1–18.
Gregg, P. and Washbrook, E. (2011). The role of attitudes and behaviours in explaining
socio-economic differences in attainment at age 11, Longitudinal and Life Course Studies:
International Journal 2(1): 41–58.
Gutman, L. and Akerman, R. (2008). Determinants of aspirations.
Hamm, J. (2000). Do Birds of a Feather Flock Together? The Variable Bases for African
American, Asian American, and European American Adolescents’ Selection of Similar
Friends?, Developmental Psychology 36(2): 209–219.
Hanushek, E., Kain, J., Markman, J. and Rivkin, S. (2003). Does peer ability affect student
achievement?, Journal of Applied Econometrics 18(5): 527–544.
Heckman, J. (2000). Policies to foster human capital, Research in Economics 54(1): 3–56.
Hill, N., Castellino, D., Lansford, J., Nowlin, P., Dodge, K., Bates, J. and Pettit, G. (2004).
Parent academic involvement as related to school behavior, achievement, and aspirations:
Demographic variations across adolescence, Child Development 75(5): 1491–1509.
Jackson, M. (2008). Social and economic networks, Princeton Univ Pr.
Jackson, M. (2010). An Overview of Social Networks and Economic Applications, in Hand-
book of Social Economics, edited by J. Benhabib, A. Bisin and M. Jackson .
Jackson, M. and Yariv, L. (2010). Diffusion, strategic interaction, and social structure, in
Handbook of Social Economics, edited by J. Benhabib, A. Bisin and M. Jackson .
Jodl, K., Michael, A., Malanchuk, O., Eccles, J. and Sameroff, A. (2001). Parents’ roles in
shaping early adolescents’ occupational aspirations, Child Development 72(4): 1247–1266.
Kandel, D. (1978). Homophily, selection, and socialization in adolescent friendships, The
American Journal of Sociology 84(2): 427.
14

Manski, C. (1995). Identification problems in the social sciences, Harvard Univ Press.
McCulloch, A. and Joshi, H. (2002). Child development and family resources: evidence from
the second generation of the 1958 british birth cohort, Journal of Population Economics
15(2): 283–304.
Mora, T. and Oreopoulos, P. (2011). Peers effects on high school aspirations: Evidence from
a sample of close and not-so-close friends, Economics of Education Review 30: 575–581.
Portes, A., Aparicio, R., Haller, W. and Vickstrom, E. (2010). Moving ahead in madrid:
Aspirations and expectations in the spanish second generation1, International Migration
Review 44(4): 767–801.
Schoon, I. and Parsons, S. (2002). Teenage aspirations for future careers and occupational
outcomes, Journal of Vocational Behavior 60(2): 262–288.
Sewell, W., Haller, A. and Portes, A. (1969). The educational and early occupational at-
tainment process, American Sociological Review pp. 82–92.
Sewell, W. and Hauser, R. (1972). Causes and consequences of higher education: Models of
the status attainment process, American Journal of Agricultural Economics 54(5): 851–
861.
Wentzel, K., Barry, C. and Caldwell, K. (2004). Friendships in middle school: Influences on
motivation and school adjustment., Journal of educational psychology 96(2): 195.
15

Graphs and Tables
Figure 1: Aspirations by parents’ income (Resp:Friend) - at least one friend
(a) Carry on full time educ after year 11 (desired) -@14
0.830.85
0.89
0.83
0.900.92
1.00 0.98 0.97
0.2
.4.6
.81
mean o
f F
TeducD
13
low
:low
low
:mid
low
:hig
h
mid
:low
mid
:mid
mid
:hig
h
hig
h:low
hig
h:m
id
hig
h:h
igh
(b) Carry on full time educ after year 11 (perception)- @14
0.830.85
0.89
0.83
0.900.92
1.00 0.98 0.97
0.2
.4.6
.81
mean o
f F
TeducD
13
low
:low
low
:mid
low
:hig
h
mid
:low
mid
:mid
mid
:hig
h
hig
h:low
hig
h:m
id
hig
h:h
igh
(c) Having a job in which they can progress in acareer is very important - @14
0.67
0.770.80 0.79
0.87
0.82 0.83 0.840.81
0.2
.4.6
.8m
ean o
f jo
bpro
gcare
er
low
:low
low
:mid
low
:hig
h
mid
:low
mid
:mid
mid
:hig
h
hig
h:low
hig
h:m
id
hig
h:h
igh
16

Figure 2: Aspirations by mothers’ aspirations (Resp:Friend) - at least one friend
(a) Carry on full time educ after year 11 (desired) -@14
0.75
0.70
0.79
0.64
0.870.91
0.88
0.930.97
0.2
.4.6
.81
mean o
f F
TeducD
13
low
:low
low
:mid
low
:hig
h
mid
:low
mid
:mid
mid
:hig
h
hig
h:low
hig
h:m
id
hig
h:h
igh
(b) Carry on full time educ after year 11 (perception)- @14
0.75
0.70
0.79
0.64
0.870.91
0.88
0.930.97
0.2
.4.6
.81
mean o
f F
TeducD
13
low
:low
low
:mid
low
:hig
h
mid
:low
mid
:mid
mid
:hig
h
hig
h:low
hig
h:m
id
hig
h:h
igh
(c) Having a job in which they can progress in a careeris very important - @14
1.00
0.790.76
0.70
0.860.83 0.82 0.83 0.84
0.2
.4.6
.81
mean o
f jo
bpro
gcare
er
low
:low
low
:mid
low
:hig
h
mid
:low
mid
:mid
mid
:hig
h
hig
h:low
hig
h:m
id
hig
h:h
igh
17

Table 1: Family income - OLS
Full Time Full Time Job progresseduc (14) educ (14) in a careerDesired Perception important
Friend’s Parental income (High) 0.010 -0.013 0.100[0.054] [0.062] [0.089]
Friend’s Parental income (Middle) 0.055 0.039 0.063[0.053] [0.054] [0.067]
Par inc (middle) * Frd Par inc (High) 0.093* 0.119* -0.093[0.037] [0.045] [0.082]
Par inc (low) * Frd Par inc (High) 0.064 0.152* -0.024[0.104] [0.076] [0.141]
Parental income (Middle) -0.043† -0.053† 0.04[0.023] [0.028] [0.056]
Parental income (Low) -0.022 0.009 -0.009[0.059] [0.055] [0.083]
N 524 527 519
* Significant at 5%. †Significant at 10%
Table 2: Family income - School FE
Full Time Full Time Job progresseduc (14) educ (14) in a careerDesired Perception important
Friend’s Parental income (High) 0.059 -0.008 0.073[0.072] [0.077] [0.114]
Friend’s Parental income (Middle) 0.113 0.084 0.016[0.071] [0.070] [0.060]
Par inc (middle) * Frd Par inc (High) 0.091* 0.144* -0.042[0.040] [0.047] [0.107]
Par inc (low) * Frd Par inc (High) 0.07 0.203* 0.112[0.127] [0.097] [0.170]
Parental income (Middle) -0.038† -0.045 0.012[0.022] [0.030] [0.076]
Parental income (Low) -0.027 0.019 -0.008[0.070] [0.072] [0.119]
N 455 456 444N (Sch) 40 40 39
* Significant at 5%. †Significant at 10%
18

Table 3: Mother’s aspirations - OLS
Full Time Full Time Job progresseduc (14) educ (14) in a careerDesired Perception important
Friends’ Mother’s hopes for child’s ed (High) 0.302* 0.268† 0.169[0.141] [0.143] [0.166]
Friends’ Mother’s hopes for child’s ed (Middle) 0.298* 0.267† 0.135[0.141] [0.143] [0.166]
Moth asp (middle) * Frd Moth asp (High) -0.009 -0.003 -0.018[0.062] [0.067] [0.083]
Moth asp (low) * Frd Moth asp (High) -0.23 -0.079 -0.269[0.201] [0.184] [0.182]
Mother’s hopes for child’s ed (Middle) -0.04 -0.043 0.031[0.053] [0.058] [0.075]
Mother’s hopes for child’s ed (Low) -0.019 -0.014 0.133[0.136] [0.136] [0.108]
N 499 501 493
* Significant at 5%. †Significant at 10%
Table 4: Mother’s aspirations - School FE
Full Time Full Time Job progresseduc (14) educ (14) in a careerDesired Perception important
Friends’ Mother’s hopes for child’s ed (High) 0.298* 0.247† 0.167[0.120] [0.128] [0.164]
Friends’ Mother’s hopes for child’s ed (Middle) 0.281* 0.236† 0.117[0.122] [0.138] [0.153]
Moth asp (middle) * Frd Moth asp (High) -0.013 -0.007 -0.053[0.067] [0.064] [0.072]
Moth asp (low) * Frd Moth asp (High) -0.271 -0.153 -0.333[0.221] [0.206] [0.217]
Mother’s hopes for child’s ed (Middle) -0.055 -0.045 0.067[0.068] [0.065] [0.066]
Mother’s hopes for child’s ed (Low) 0.071 0.083 0.211[0.166] [0.165] [0.143]
N 426 426 415N (Sch) 40 40 39
* Significant at 5%. †Significant at 10%
19

Appendix
Table A1: Number of primary school friends
No. of No. of No. ofnominated respondends % respondends %friends (non missings)
1 886 53.7 370 52.92 465 28.2 191 27.33 187 11.3 92 13.24 83 5.0 29 4.15 29 1.8 17 2.4
Total 1,650 100.0 699 100.0
Table A2: Respondents and friends - family income and mother’s aspirations
Family income Mother’s aspirations
Category 1/ Resp. Friend N % N %
1 low:low Low Low 45 3.97 5 0.472 low:mid Low Middle 103 9.09 23 2.153 low:high Low High 44 3.88 36 3.364 mid:low Middle Low 71 6.27 12 1.125 mid:mid Middle Middle 331 29.21 103 9.626 mid:high Middle High 195 17.21 221 20.637 high:low High Low 14 1.24 17 1.598 high:mid High Middle 134 11.83 146 13.639 high:high High High 196 17.3 508 47.43
Total 1,133 100 1,071 100
Figures based on the full sample of 1650 respondents (without removing observations with
missing values, as we are interested in graphical correlations.).1/ All these categories are exclusive. Low:high, mid:high and high:high were defined first,
so at least one friend is from the highest category (either family income or mother’s as-
pirations). Then, each category was consecutively created excluding the previous ones as
follows: low:mid, mid:mid, high:mid and low:low, mid:low, high:low. Therefore, all “-:low”
categories imply all of friends are from the lowest either income or paternal aspirations, and
all “-:mid” categories imply that at least a friend belongs to the middle category, but none
to highest one.
20

Table A3: Descriptive Statistics
Variable Description Obs Mean Std.Dev. Min Max
FTeducD14 Carry on full time educ after year 11 (desired)- @14
663 0.919 0.274 0 1
FTeduc14 Carry on full time educ after year 11 (percep-tion) - @14
669 0.903 0.296 0 1
jobprogcareer having a job in which they can progress in acareer is VERY important
660 0.830 0.376 0 1
female Female 699 0.618 0.486 0 1ethn Ethnicity: non-white 699 0.013 0.113 0 1mbirth Childs month of birth (Sept=0) 699 5.084 3.617 0 11k2avg KS2 score 699 105.8 7.051 71.0 113.6chlocus Locus of control @8y 699 99.3 10.055 71.2 124.1teenlocus17 Locus of control @17y 699 99.4 9.804 84.9 136.8magebth Mother’s age at birth 699 29.8 4.162 17.0 44.0daded Father’s education 699 2.685 0.985 1 4dadempst4 Father’s empl status @ 47m 699 0.959 0.200 0 1mumempst4 Mother’s empl status @ 47m 699 0.622 0.485 0 1schimp Child considers school results important in life 699 0.639 0.480 0 1relfrdimp Child considers relationship with friends im-
portant in life699 0.913 0.282 0 1
moneyimp Child considers money important in life 699 0.323 0.468 0 1mvaluesch Mum feels school was valuable (std) 699 0.219 0.888 -3.18 1.22medints9 Mum-child educational interactions at 9 (av
std)699 0.002 0.523 -3.66 1.43
mnonedints9 Mum-child non-educational interactions at 9(av std)
699 0.000 0.469 -2.39 1.56
Pinc1 Parental income (High) 699 0.335 0.472 0 1Pinc2 Parental income (Middle) 699 0.542 0.499 0 1Pinc3 Parental income (Low) 699 0.123 0.329 0 1FPinc1 Friends’ Parental income (High), average 549 0.299 0.409 0 1FPinc2 Friends’ Parental income (Middle), average 549 0.561 0.438 0 1FPinc3 Friends’ Parental income (Low), average 549 0.140 0.313 0 1Pasp1 Mother’s hopes for child’s ed at 9 - High (Uni) 699 0.629 0.483 0 1Pasp2 Mother’s hopes for child’s ed at 9 - Middle 699 0.312 0.464 0 1Pasp3 Mother’s hopes for child’s ed at 9 - Low
(GCSE)699 0.059 0.235 0 1
FPasp1 Friends’ Mother’s hopes for child’s ed at 9 -High (Uni), average
523 0.626 0.438 0 1
FPasp2 Friends’ Mother’s hopes for child’s ed at 9 -Middle, average
523 0.333 0.424 0 1
FPasp3 Friends’ Mother’s hopes for child’s ed at 9 -Low (GCSE), average
523 0.041 0.166 0 1
21

Table A4: Covariates
Full Time Full Time Job progresseduc (14) educ (14) in a careerDesired Perception important
Female 0.073* 0.059* -0.048[0.027] [0.028] [0.035]
Ethnicity: non-white 0.075 0.041 0.196*[0.059] [0.048] [0.064]
Childs month of birth (Sept=0) 0.003 0.004 -0.006[0.003] [0.004] [0.005]
KS2 score 0.007* 0.008* 0.000[0.002] [0.003] [0.003]
Locus of control @8y 0.000 -0.001 0.000[0.001] [0.001] [0.002]
Locus of control @17y 0.001 0.002 0.001[0.001] [0.001] [0.002]
Mother’s age at birth 0.001 0.005 -0.007[0.003] [0.003] [0.004]
Father’s education 0.044* 0.036* 0.016[0.013] [0.014] [0.018]
Father’s empl status @ 47m 0.058 0.073 -0.07[0.075] [0.072] [0.089]
Mother’s empl status @ 47m 0.024 0.044 -0.031[0.026] [0.028] [0.035]
Child considers school results 0.009 0.021 -0.005important in life [0.025] [0.027] [0.038]Child considers relationship with 0.01 -0.032 0.04friends important in life [0.048] [0.044] [0.068]Child considers money important in life 0.005 0.024 -0.047
[0.025] [0.026] [0.038]Mum feels school was valuable (std) 0.013 0.01 -0.043*
[0.014] [0.015] [0.020]Mum-child educational interactions at 9 0.044 0.062† 0.070†
[0.029] [0.033] [0.041]Mum-child non-educational interactions at 9 -0.027 -0.035 0.005
[0.031] [0.033] [0.049]Constant -0.166 -0.635 1.436
[0.680] [0.747] [1.060]
N 524 527 519
* Significant at 5%. †Significant at 10%
22