simfund mf overview
TRANSCRIPT

Simfund MF Database Overview & Functionality

2
• Overview of Simfund MF 3• Asset & Flow Data 4• Morningstar Data 5• Lipper Data 6• Graphs 9• Benchmark Index Returns 14• Fee & Expense Data 15• Prospectus Data 17• Service Provider Data 21• Views 22• Links to Simfund Filing 23
Table of Contents
3
What’s Included In Simfund MF?
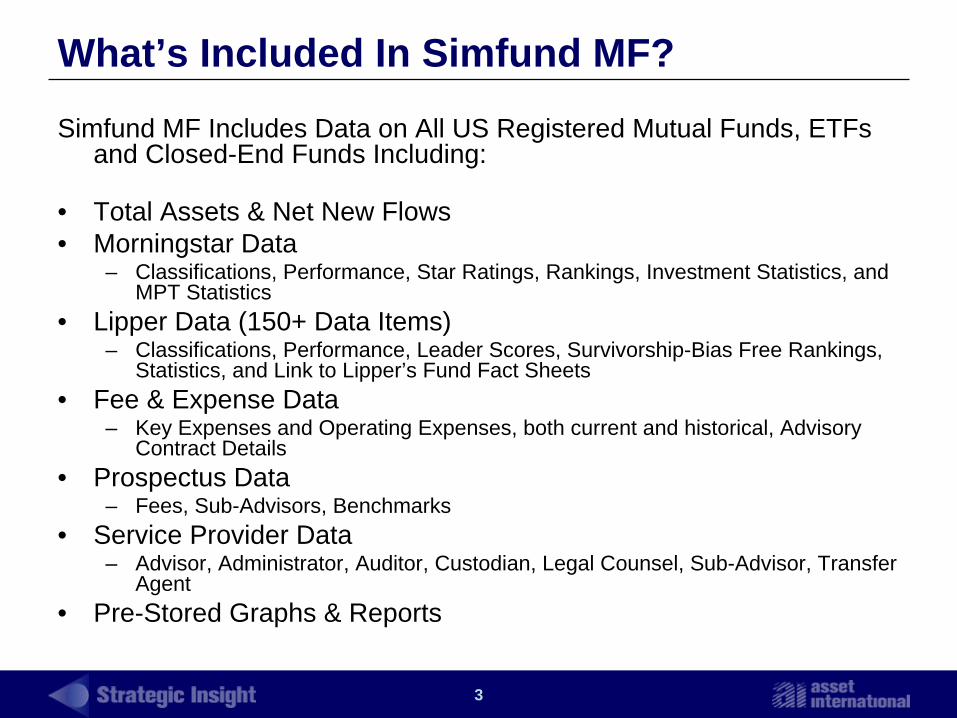
Simfund MF Includes Data on All US Registered Mutual Funds, ETFs and Closed-End Funds Including:
• Total Assets & Net New Flows• Morningstar Data
– Classifications, Performance, Star Ratings, Rankings, Investment Statistics, and MPT Statistics
• Lipper Data (150+ Data Items)– Classifications, Performance, Leader Scores, Survivorship-Bias Free Rankings,
Statistics, and Link to Lipper’s Fund Fact Sheets• Fee & Expense Data
– Key Expenses and Operating Expenses, both current and historical, Advisory Contract Details
• Prospectus Data– Fees, Sub-Advisors, Benchmarks
• Service Provider Data– Advisor, Administrator, Auditor, Custodian, Legal Counsel, Sub-Advisor, Transfer
Agent• Pre-Stored Graphs & Reports
4
Asset & Flow Data (At Share Class Level)
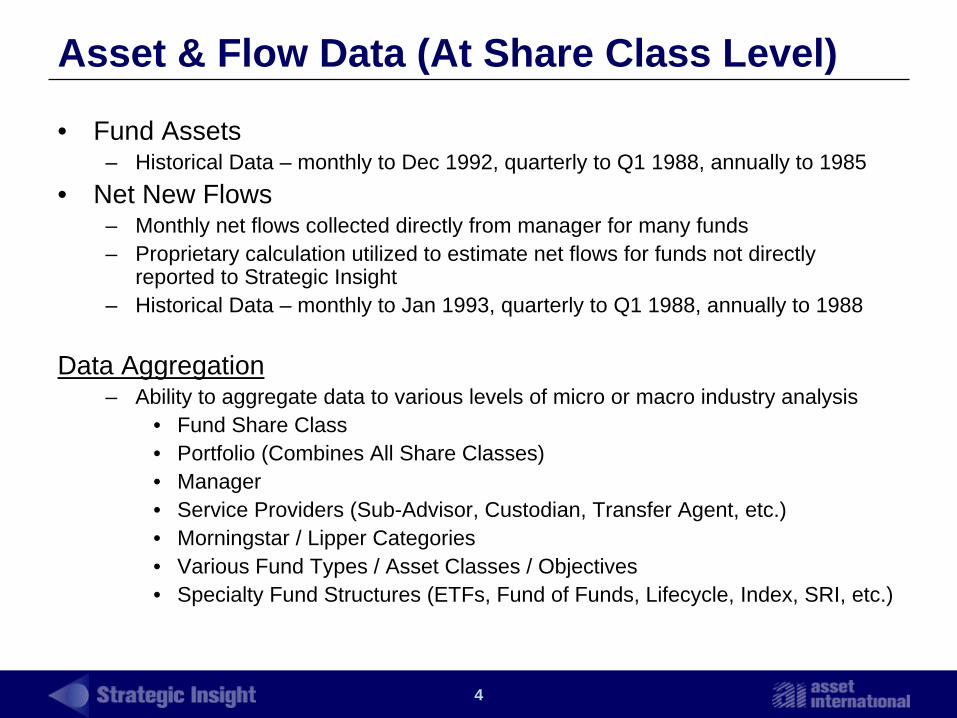
• Fund Assets– Historical Data – monthly to Dec 1992, quarterly to Q1 1988, annually to 1985
• Net New Flows– Monthly net flows collected directly from manager for many funds– Proprietary calculation utilized to estimate net flows for funds not directly
reported to Strategic Insight– Historical Data – monthly to Jan 1993, quarterly to Q1 1988, annually to 1988
Data Aggregation– Ability to aggregate data to various levels of micro or macro industry analysis
• Fund Share Class• Portfolio (Combines All Share Classes)• Manager• Service Providers (Sub-Advisor, Custodian, Transfer Agent, etc.)• Morningstar / Lipper Categories• Various Fund Types / Asset Classes / Objectives• Specialty Fund Structures (ETFs, Fund of Funds, Lifecycle, Index, SRI, etc.)

5
Morningstar Data
• Morningstar Data Points– Categories (Current and Historical)– Performance – Monthly Total Return Data for 10 Years– Category Rankings– Morningstar Category Average and Index Total Returns– Star Ratings (Current and Historical)– Portfolio Composition
Details on Fund Holdings Including Style, Market Cap, Country, Region, Equity Sectors, Fixed-Income Ratings, Valuations Metrics
– MPT StatisticsAlpha, Beta, R-Squared, Sharpe, Treynor, etc.
– Top 10 HoldingsName of Security, % of Fund’s Assets, Ticker Symbol, CUSIP
– Portfolio Manager Information Up to 5 Managers: Start Date, Tenure, Biographical Info

6
Lipper Data
• Lipper Data Points– Classifications (Current and Historical)– Performance– Rankings (Survivorship Bias-Free Rankings)– Lipper Indices– Lipper Leader Scores– Asset Composition– Lipper Flags– MPT Statistics
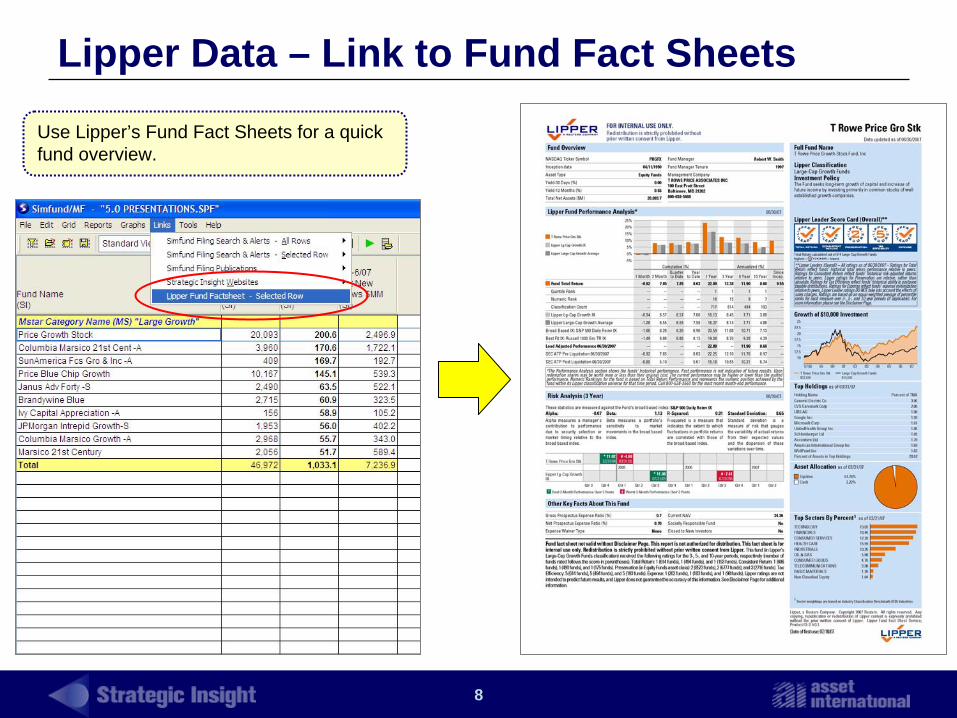
• Link to Lipper’s Fund Fact Sheets– Link directly from Simfund to pre-formatted PDF fund fact sheets from
Lipper’s website
• Early Update for Lipper Performance– Includes Performance and Rankings– Released 5th business day of each month vs. 9th business day for full
dataset

7
Multi Source Data Integration
Early update for Lipper performance and rankings is available on the 5th business day of each month.
Strategic Insight Asset & Flow Data
MorningstarData
Lipper Data (Classifications, Returns, Ranks, Class Averages, etc.)
6/07 Jun'07Assets Mstar Lipper Total Class Quintile Fund # Funds Total Class Quintile Fund # Funds
Fund Name $MM 2005 2006 Ytd-6/07 Rating Classification Ret % Avg % Rank Rank in Class Ret % Avg % Rank Rank in ClassJanus Contrarian Fund 7,519 -39 549 2,077 5 Multi-Cap Core 38.58 19.24 1 2 849 26.17 12.11 1 1 644Janus Overseas 8,703 -27 1,694 1,264 5 Intl Multi-Cap Growth 43.91 27.48 1 1 207 38.82 21.80 1 1 148Janus Adv Forty -S 2,490 50 246 522 5 Large-Cap Growth 21.90 16.37 1 37 717 15.56 8.14 1 3 614Janus Adv Intl Growth -S 1,305 -2 230 316 5 Intl Multi-Cap Growth 41.73 27.48 1 4 207 37.83 21.80 1 2 148Janus Mid Cap Value -Inv 6,088 632 194 166 3 Mid-Cap Value 22.00 22.33 3 138 297 15.18 16.35 4 147 232Janus High Yield Bond 635 -64 -25 90 3 High Current Yield 11.01 10.52 2 149 447 8.33 8.12 3 163 376Janus Global Research 197 25 48 53 Multi-Cap Growth 29.25 18.72 1 19 514 11.41Janus Adv Long/Short -A 57 4 51 Long/Short Equity 14.67 10.16Janus Adv Contrarian -A 48 0 8 37 Multi-Cap Core 36.35 19.24 1 4 849 12.11Janus Adv Fundamental Equity-S 77 6 9 12 5 Large-Cap Core 16.57 19.59 5 674 806 14.85 10.62 1 15 671Janus INTECH RiskMgd Stock 563 130 70 11 4 Multi-Cap Core 14.73 19.24 5 766 849 12.41 12.11 3 319 644Janus Adv Small Company Val -S 35 -1 0 10 3 Small-Cap Core 17.29 16.51 2 269 732 14.58 13.67 2 174 564Janus Adv INTECH RiskMngd Cr-S 45 0 22 10 4 Multi-Cap Core 14.33 19.24 5 776 849 12.33 12.11 3 329 644Janus Adv Mid Cap Value -S 107 15 25 6 3 Mid-Cap Value 21.97 22.33 3 140 297 15.03 16.35 4 152 232Janus Adv INTECH RiskMngd Gr-S 163 36 44 3 3 Multi-Cap Growth 13.92 18.72 5 438 514 8.49 11.41 5 330 410Janus Research 4,463 -408 -1,028 3 4 Large-Cap Growth 27.70 16.37 1 1 717 12.87 8.14 1 11 614Janus Adv INTECH RiskMgdIntl-A 2 2Janus Adv Orion -A 2 0 0 2 Mid-Cap Growth 26.55 18.83 1 34 608 13.20Janus Adv Float Rate Hi Inc -A 1 1 Loan Participation 6.81 5.06Janus Adv Mid Cap Growth -S 105 -26 -16 0 3 Mid-Cap Growth 24.13 18.83 1 99 608 16.41 13.20 1 72 485Janus Adv Intl Equity -A 1 1 0 Intl Multi-Cap Growth 27.48 21.80Janus Adv INTECH RiskMngd Vl-A 1 0 0 0 Multi-Cap Value 19.00 20.53 4 293 424 13.84Janus Adv Small Mid Growth -A 1 0 1 0 Small-Cap Growth 25.05 16.87 1 33 566 11.65Janus Adv High Yield -A 1 1 0 0 High Current Yield 10.86 10.52 2 164 447 8.12Janus Enterprise 1,996 -227 -234 -1 3 Mid-Cap Growth 24.65 18.83 1 81 608 16.21 13.20 1 85 485Janus Adv Flexible Bond -S 39 -13 -8 -1 3 Intmdt Inv Grade 5.65 5.54 3 233 522 3.37 3.54 4 278 450Janus Federal TxEx 92 -19 -18 -3 2 General Muni Debt 3.06 4.12 5 222 236 3.28 4.08 5 182 221Janus Short Term Bond 171 -65 -27 -5 3 Short Inv Grade 5.12 4.97 2 84 232 3.10 3.04 2 78 195Janus Glbl Opportunities 168 -58 -43 -6 2 Global Multi-Cap Value 28.54 26.98 1 8 50 12.42 20.91 5 38 38Janus Adv Large Cap Growth -S 165 -101 -47 -13 3 Large-Cap Growth 20.02 16.37 1 116 717 8.55 8.14 3 274 614
1 Year as of 6/07 (Lipper) 3 Years as of 6/07 (Lipper)Net New Flows ($MM)
8
Lipper Data – Link to Fund Fact Sheets
Use Lipper’s Fund Fact Sheets for a quick fund overview.
9
Extensive Graphing Capability
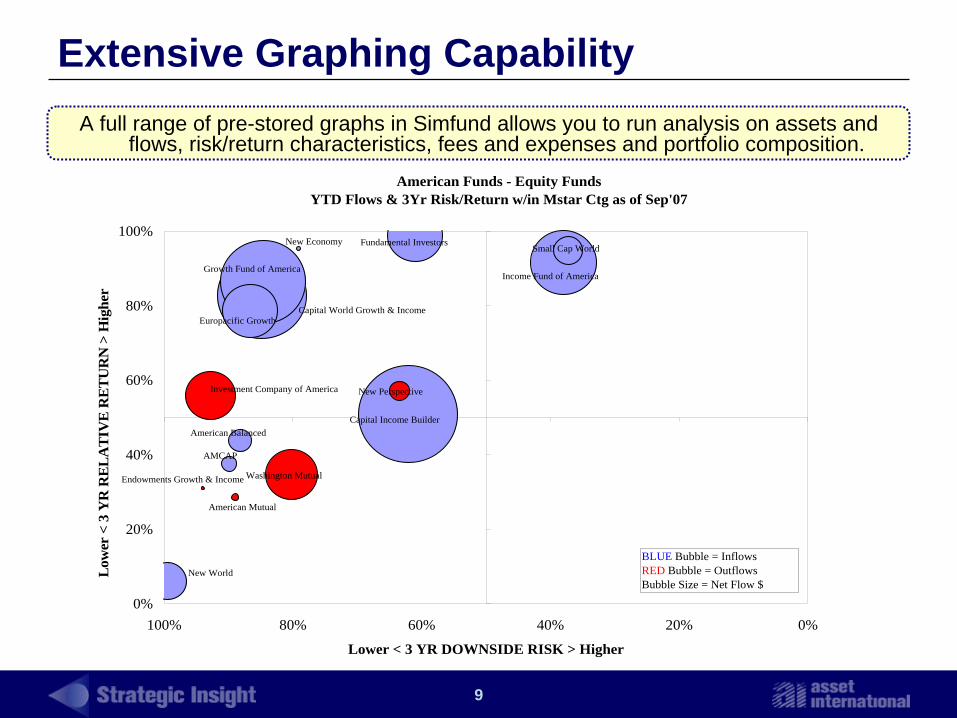
American Funds - Equity FundsYTD Flows & 3Yr Risk/Return w/in Mstar Ctg as of Sep'07
Endowments Growth & Income
New Economy
American Mutual
AMCAP
New Perspective
American Balanced
Small Cap World
New World
Investment Company of America
Washington Mutual
Fundamental Investors
Europacific Growth
Income Fund of AmericaGrowth Fund of America
Capital World Growth & Income
Capital Income Builder
0%
20%
40%
60%
80%
100%
0%20%40%60%80%100%
Lower < 3 YR DOWNSIDE RISK > Higher
Low
er <
3 Y
R R
EL
AT
IVE
RE
TU
RN
> H
ighe
r
BLUE Bubble = InflowsRED Bubble = OutflowsBubble Size = Net Flow $
A full range of pre-stored graphs in Simfund allows you to run analysis on assets and flows, risk/return characteristics, fees and expenses and portfolio composition.
10
Morningstar Graphs
Morningstar Category Mid GrowthLipper Classification Mid-Cap GrowthSI Objective Midcap EquityProspectus Benchmark - 1st Russell Mid Cap Growth
SI Fund Type EquityTotal Assets $ 1.96 BNet New Flows - YTD $ 27 MM
Annualized Returns:1 Yr 26.80%3 Yr 19.93%5 Yr 20.88%
10 Yr 10.07%
Lipper Leader Consistent Return 1Morningstar RatingSharpe Ratio 3Yr 1.32Beta (S&P 500) 3 Yr 1.24
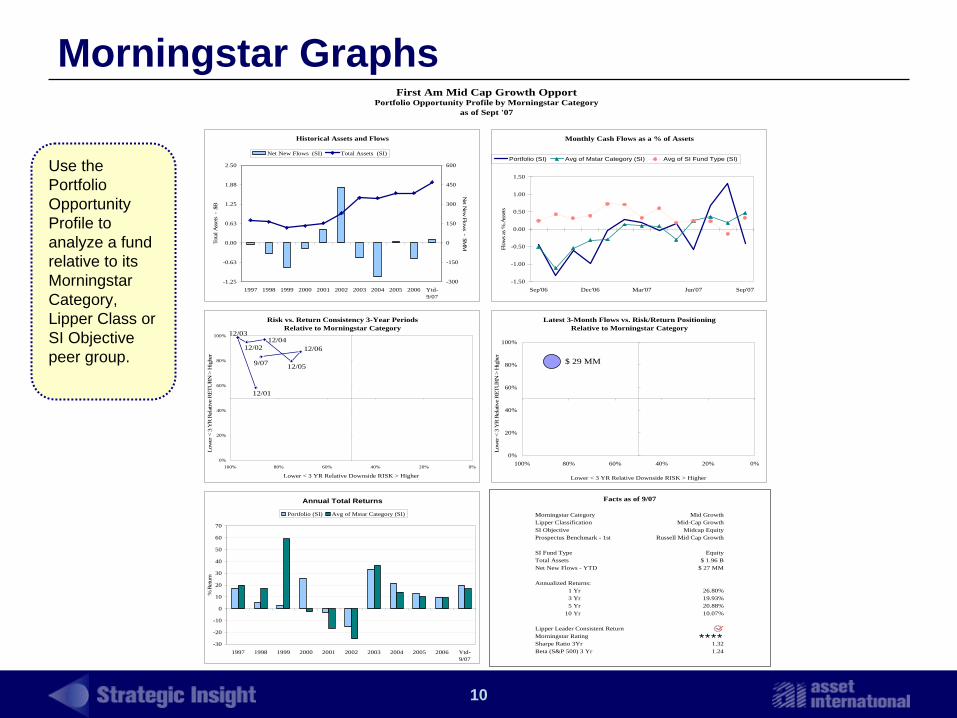
First Am Mid Cap Growth OpportPortfolio Opportunity Profile by Morningstar Category
as of Sept '07
Facts as of 9/07
Historical Assets and Flows
-1.25
-0.63
0.00
0.63
1.25
1.88
2.50
1997 1998 1999 2000 2001 2002 2003 2004 2005 2006 Ytd-9/07
Tota
l Ass
ets
- $B
-300
-150
0
150
300
450
600
Net N
ew Flow
s - $MM
Net New Flows (SI) Total Assets (SI)
Monthly Cash Flows as a % of Assets
-1.50
-1.00
-0.50
0.00
0.50
1.00
1.50
Sep'06 Dec'06 Mar'07 Jun'07 Sep'07
Flow
s as %
Ass
ets
Portfolio (SI) Avg of Mstar Category (SI) Avg of SI Fund Type (SI)
Risk vs. Return Consistency 3-Year PeriodsRelative to Morningstar Category
12/01
12/02
12/0312/04
12/05
12/06
9/07
0%
20%
40%
60%
80%
100%
0%20%40%60%80%100%
Lower < 3 YR Relative Downside RISK > Higher
Low
er <
3 Y
R R
elat
ive
RET
UR
N >
Hig
her
Latest 3-Month Flows vs. Risk/Return PositioningRelative to Morningstar Category
$ 29 MM
0%
20%
40%
60%
80%
100%
0%20%40%60%80%100%
Lower < 3 YR Relative Downside RISK > Higher
Low
er <
3 Y
R R
elat
ive
RET
UR
N >
Hig
her
Annual Total Returns
-30
-20
-10
0
10
20
30
40
50
60
70
1997 1998 1999 2000 2001 2002 2003 2004 2005 2006 Ytd-9/07
% R
etur
n
Portfolio (SI) Avg of Mstar Category (SI)
Use the Portfolio Opportunity Profile to analyze a fund relative to its Morningstar Category, Lipper Class or SI Objective peer group.

11
Morningstar Investment Profile
2002 2003 2004 2005 2006 Ytd-6/07Morningstar Rating Net New Flows $MM 6,051 9,357 7,360 4,637 4,161 998Category Large Value Assets $MM 14,036 29,437 43,266 52,184 66,186 71,977NASDAQ Ticker DODGXInception Date 1/4/1965 Overall Star RatingClosed to All Investors No Category LV LV LV LV LV LVClosed to New Investors Yes
Ann. Total Return % -10.5% 32.3% 19.2% 9.4% 18.5% 7.2%Category Average% -18.0% 28.7% 13.2% 5.9% 18.2% 9.2%
US Stocks 77.6% +/- Difference 7.4% 3.6% 6.0% 3.5% 0.3% -2.0%Non-US Stocks 18.1%US BondsNon US Bonds 1 Month 6 Months 1 Year 3 Years 5 Years 10 YearsPreferred Total Return % -1.5% 7.2% 19.7% 16.0% 14.8% 13.1%Convertible Percentile Rank 39 50 68 15 6 1Cash 4.4% Fund Rank 461 586 765 134 41 3Other # of Funds 1,454 1,424 1,346 1,099 830 392
Stock % Value Blend Growth 3 Year 5 Year 10 Year OverallLarge 32% 29% 31% Morningstar Ratings
Mid 5% 2% 1% Morningstar Return Above Avg High High HighSmall Morningstar Risk Avg Avg Avg Avg
Alpha vs. (S&P 500) 4.30 4.20 6.37Hardware 10.25% Beta (S&P 500) 0.94 0.93 0.76Software 3.29% R2 (S&P 500) 86.0 87.3 66.6Media 10.77% Sharpe Ratio 1.52 1.01 0.69Telecom 2.77% Treynor Ratio 12.81 12.81 12.34Consumer Services 8.61%Healthcare 15.13%Business Services 4.80% Price/Earning 14.96 Asset in top 10 Holdings % 29.1%Financial Services 13.80% Price/Book 1.74 Number of Stocks 81Industrial Materials 13.38% Price/Cash Flow 8.95 Number of BondsEnergy 9.96% Price/Sales 1.13 Turnover Ratio 14.00Consumer Goods 6.50% Avg Market Cap $MM 49,608Utilities 0.74%
Dodge & Cox StockMorningstar Investment Profile
Fund Information
Composition%
Sectors %
Info
rmat
ion
Serv
ices
Statistics
Man
ufac
turi
ng
12
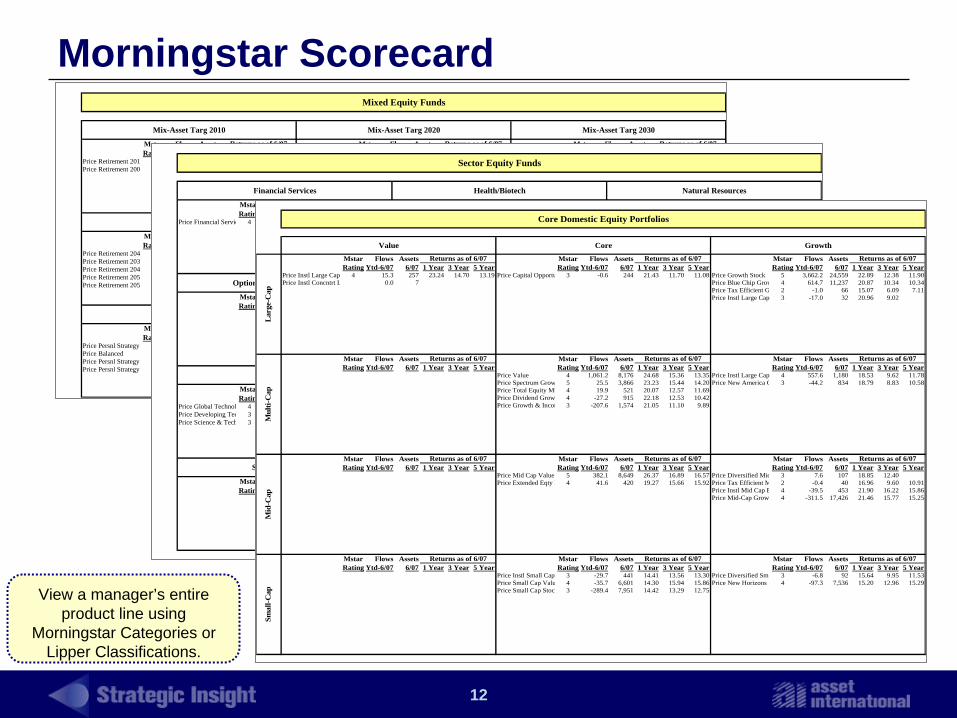
Morningstar Scorecard
View a manager’s entire product line using
Morningstar Categories or Lipper Classifications.
Mstar Flows Assets Mstar Flows Assets Mstar Flows AssetsRating Ytd-6/07 6/07 1 Year 3 Year 5 Year Rating Ytd-6/07 6/07 1 Year 3 Year 5 Year Rating Ytd-6/07 6/07 1 Year 3 Year 5 Year
Price Retirement 201 5 726.4 3,836 16.62 11.13 Price Retirement 2020 5 1,297.1 5,654 19.65 12.92 Price Retirement 203 5 876.1 3,779 21.66 14.36Price Retirement 200 5 122.8 801 14.73 9.93 Price Retirement 201 4 646.1 2,830 18.19 12.03 Price Retirement 202 5 599.5 2,564 20.77 13.63
Mstar Flows Assets Mstar Flows Assets Mstar Flows AssetsRating Ytd-6/07 6/07 1 Year 3 Year 5 Year Rating Ytd-6/07 6/07 1 Year 3 Year 5 Year Rating Ytd-6/07 6/07 1 Year 3 Year 5 Year
Price Retirement 204 5 517.3 1,942 21.87 14.44Price Retirement 203 5 345.4 1,261 21.84 14.40Price Retirement 204 149.7 412 21.81Price Retirement 205 23.2 25Price Retirement 205 16.8 18
Mstar Flows Assets Mstar Flows Assets Mstar Flows AssetsRating Ytd-6/07 6/07 1 Year 3 Year 5 Year Rating Ytd-6/07 6/07 1 Year 3 Year 5 Year Rating Ytd-6/07 6/07 1 Year 3 Year 5 Year
Price Persnl Strategy 5 49.2 684 13.53 9.20 9.18 Price Retirement Inco 4 172.4 1,138 12.37 8.33Price Balanced 4 146.7 3,210 17.22 11.16 10.20 Price Tax Efficient B 3 -2.4 39 10.82 5.40 6.06Price Persnl Strategy 5 65.2 1,230 20.51 13.61 12.81Price Persnl Strategy 4 33.9 1,500 17.15 11.47 11.16
Mixed Equity Funds
Mix-Asset Targ 2010 Mix-Asset Targ 2020 Mix-Asset Targ 2030
Returns as of 6/07 Returns as of 6/07 Returns as of 6/07
Mix Tgt All Gro Mix Tgt All Mod Mix Tgt Alloc Con
Returns as of 6/07 Returns as of 6/07 Returns as of 6/07
Mix-Asset Targ 2030+ Mix-Asset Targ 2050+ Long/Short Equity
Returns as of 6/07 Returns as of 6/07 Returns as of 6/07
Mstar Flows Assets Mstar Flows Assets Mstar Flows AssetsRating Ytd-6/07 6/07 1 Year 3 Year 5 Year Rating Ytd-6/07 6/07 1 Year 3 Year 5 Year Rating Ytd-6/07 6/07 1 Year 3 Year 5 Year
Price Financial Servic 4 -4.6 465 17.49 13.05 12.43 Price Health Sciences 4 86.0 1,948 20.30 12.11 14.75 Price New Era 4 285.0 5,725 26.12 30.66 23.27
Mstar Flows Assets Mstar Flows Assets Mstar Flows AssetsRating Ytd-6/07 6/07 1 Year 3 Year 5 Year Rating Ytd-6/07 6/07 1 Year 3 Year 5 Year Rating Ytd-6/07 6/07 1 Year 3 Year 5 Year
Price Real Estate 4 337.2 2,523 11.04 23.09 20.47 Price Equity Index 50 3 953.5 9,270 20.18 11.33 10.40
Mstar Flows Assets Mstar Flows Assets Mstar Flows AssetsRating Ytd-6/07 6/07 1 Year 3 Year 5 Year Rating Ytd-6/07 6/07 1 Year 3 Year 5 Year Rating Ytd-6/07 6/07 1 Year 3 Year 5 Year
Price Global Technol 4 4.9 157 24.28 11.27 15.28Price Developing Tec 3 -3.5 51 22.69 9.11 12.59Price Science & Tech 3 -336.3 3,193 26.19 7.45 10.70
Mstar Flows Assets Mstar Flows Assets Mstar Flows AssetsRating Ytd-6/07 6/07 1 Year 3 Year 5 Year Rating Ytd-6/07 6/07 1 Year 3 Year 5 Year Rating Ytd-6/07 6/07 1 Year 3 Year 5 Year
Price Media & Teleco 5 272.9 1,995 39.61 26.67 29.63
Returns as of 6/07 Returns as of 6/07 Returns as of 6/07
Options Arbitrage / Strategies Real Estate S&P 500 Index
Sector Equity Funds
Financial Services Health/Biotech Natural Resources
Returns as of 6/07 Returns as of 6/07 Returns as of 6/07
Specialty Dvsfd Eq Telecommunication Utility
Returns as of 6/07 Returns as of 6/07 Returns as of 6/07
Science & Tech Sector Equity Funds Specialty & Misc
Returns as of 6/07 Returns as of 6/07 Returns as of 6/07
Mstar Flows Assets Mstar Flows Assets Mstar Flows AssetsRating Ytd-6/07 6/07 1 Year 3 Year 5 Year Rating Ytd-6/07 6/07 1 Year 3 Year 5 Year Rating Ytd-6/07 6/07 1 Year 3 Year 5 Year
Price Instl Large Cap 4 15.3 257 23.24 14.70 13.19 Price Capital Opportu 3 -0.6 244 21.43 11.70 11.08 Price Growth Stock 5 3,662.2 24,559 22.89 12.38 11.90Price Instl Concntrt L 0.0 7 Price Blue Chip Grow 4 614.7 11,237 20.87 10.34 10.34
Price Tax Efficient G 2 -1.0 66 15.07 6.09 7.11Price Instl Large Cap 3 -17.0 32 20.96 9.02
Mstar Flows Assets Mstar Flows Assets Mstar Flows AssetsRating Ytd-6/07 6/07 1 Year 3 Year 5 Year Rating Ytd-6/07 6/07 1 Year 3 Year 5 Year Rating Ytd-6/07 6/07 1 Year 3 Year 5 Year
Price Value 4 1,061.2 8,176 24.68 15.36 13.35 Price Instl Large Cap 4 557.6 1,180 18.53 9.62 11.78Price Spectrum Grow 5 25.5 3,866 23.23 15.44 14.20 Price New America G 3 -44.2 834 18.79 8.83 10.58Price Total Equity Mk 4 19.9 521 20.07 12.57 11.69Price Dividend Grow 4 -27.2 915 22.18 12.53 10.42Price Growth & Incom 3 -207.6 1,574 21.05 11.10 9.89
Mstar Flows Assets Mstar Flows Assets Mstar Flows AssetsRating Ytd-6/07 6/07 1 Year 3 Year 5 Year Rating Ytd-6/07 6/07 1 Year 3 Year 5 Year Rating Ytd-6/07 6/07 1 Year 3 Year 5 Year
Price Mid Cap Value 5 382.1 8,649 26.37 16.89 16.57 Price Diversified Mid 3 7.6 107 18.85 12.40Price Extended Eqty M 4 41.6 420 19.27 15.66 15.92 Price Tax Efficient M 2 -0.4 40 16.96 9.60 10.91
Price Instl Mid Cap E 4 -39.5 453 21.90 16.22 15.86Price Mid-Cap Growt 4 -311.5 17,426 21.46 15.77 15.25
Mstar Flows Assets Mstar Flows Assets Mstar Flows AssetsRating Ytd-6/07 6/07 1 Year 3 Year 5 Year Rating Ytd-6/07 6/07 1 Year 3 Year 5 Year Rating Ytd-6/07 6/07 1 Year 3 Year 5 Year
Price Instl Small Cap 3 -29.7 441 14.41 13.56 13.30 Price Diversified Sm 3 -6.8 92 15.64 9.95 11.53Price Small Cap Valu 4 -35.7 6,601 14.30 15.94 15.86 Price New Horizons 4 -97.3 7,536 15.20 12.96 15.29Price Small Cap Stock 3 -289.4 7,951 14.42 13.29 12.75
Lar
ge-C
apReturns as of 6/07 Returns as of 6/07 Returns as of 6/07
Mul
ti-C
ap
Returns as of 6/07 Returns as of 6/07 Returns as of 6/07
Core Domestic Equity Portfolios
Value Core Growth
Mid
-Cap
Returns as of 6/07 Returns as of 6/07 Returns as of 6/07
Smal
l-Cap
Returns as of 6/07 Returns as of 6/07 Returns as of 6/07

13
Lipper Graphs
Alger Capital Appreciation - A vs. Multi-Cap Growth FundsRolling 3 Year Returns (Primary Class Only)
-80.0
-60.0
-40.0
-20.0
0.0
20.0
40.0
12/02 12/03 12/04 12/05 12/06 6/07
3 Y
ear
Tot
al R
etur
n (L
I) -
%
1st Quintile 2nd Quintile 3rd Quintile 4th Quintile 5th Quintile Alger Capital Appreciation -A
Alger Capital Appreciation - A vs. Multi-Cap Growth Funds Trailing Returns as of 6/07 (Primary Class Only)
0.0
5.0
10.0
15.0
20.0
25.0
30.0
35.0
40.0
45.0
50.0
YTD 1 Year 3 Year 5 Year 10 Year
Tot
al R
etur
n (L
I) -
%
1st Quintile 2nd Quintile 3rd Quintile 4th Quintile 5th Quintile Alger Capital Appreciation -A
Access additional graphs that use Lipper data. For example, floating bar charts compare the performance of an individual fund to the performance range of its Lipper peer group. You can also create your own peer groups in Simfund MF.
14
Benchmark Index Returns
• Performance Data on Over 900 Indices
• Ability To View Benchmark Returns Alongside Fund Returns
• Benchmark Providers– MSCI Barra– Russell– Standard & Poor’s– Morningstar– Lipper
15
Fee & Expense Data
• Researched From Audited Annual Report• Key Expenses (both as % of AUM and $ amount)
– Advisory Fee– Sub-Advisory Fee– Administration Fee– 12b-1 Fee– Reimbursements– Total Expense Ratio
• Operating Expenses (both as % of AUM and $ amount)– Auditor Fee– Transfer Agent Fee– Custodian Fee– More Detailed Fee Breakout
• Advisory / Administrator Fee Contract Data– Advisory / Administrator Fee Contract Breakpoint Schedules – Hypothetical Breakpoint Fee Schedules
• 12b-1 Details

16
Fee & Expense AnalysisMorningstar Mid Cap Growth Category
Hypothetical Advisory Fees by Portfolio with Benchmarks
0.500
0.600
0.700
0.800
0.900
1.000
1.100
100 1,000 10,000 100,000
Asset Level $MM
Hyp
o A
dvis
ory
Fee
% (S
I)
80th Percentile Median Average 20th Percentile First Am Mid Cap Growth Opport
Conduct a wide range of fee and expense analysis in Simfund. For example, you can compare a fund’s hypothetical advisory fee schedule to its peer funds.

17
Prospectus Data• Prospectus Fees
– Management Fee– Expense Waivers– 12b-1 Fee– Total Expense Ratio– Underlying Funds’ Composite Expense Ratio (Fund of Funds)
• Advisory / Sub-Advisory Fee Contract Data– Advisory / Sub-Advisory Fee Contract Breakpoint Schedules – Hypothetical Breakpoint Fee Schedules
• Stated Performance Benchmarks• Breakout of Multiple Sub-Advisors• Date of Latest Prospectus or Supplement• Link to SEC Documents (i.e. Latest Prospectus)
Prospectus data complements fee and expense data from the the audited
Annual Report.
18
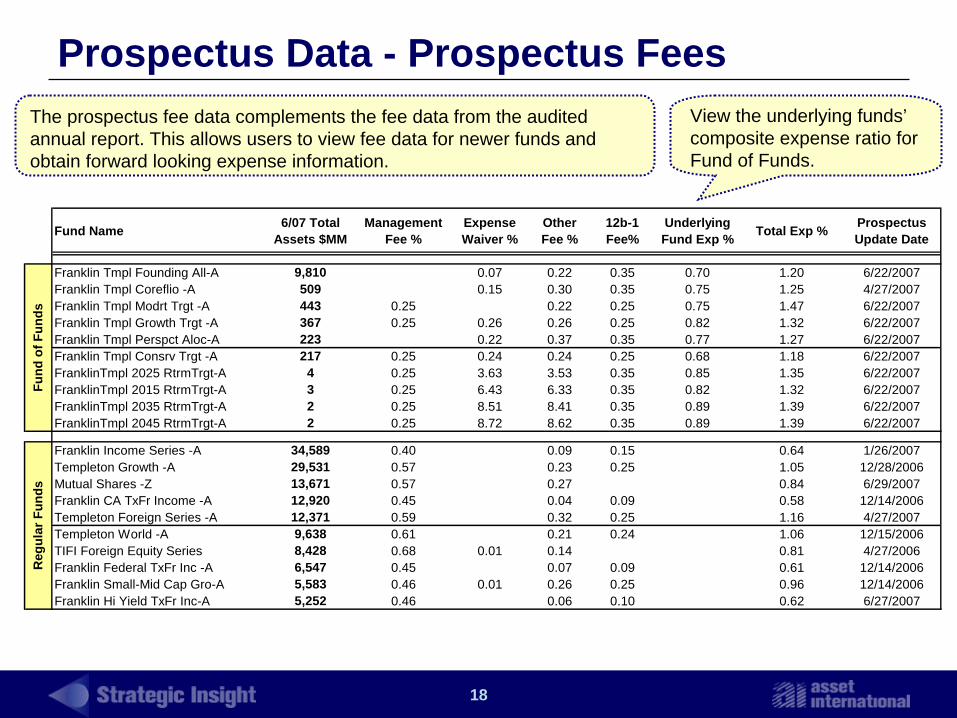
Prospectus Data - Prospectus FeesThe prospectus fee data complements the fee data from the audited annual report. This allows users to view fee data for newer funds and obtain forward looking expense information.
View the underlying funds’ composite expense ratio for Fund of Funds.
Fund Name 6/07 Total Assets $MM
Management Fee %
Expense Waiver %
Other Fee %
12b-1 Fee%
Underlying Fund Exp % Total Exp % Prospectus
Update Date
Franklin Tmpl Founding All-A 9,810 0.07 0.22 0.35 0.70 1.20 6/22/2007Franklin Tmpl Coreflio -A 509 0.15 0.30 0.35 0.75 1.25 4/27/2007Franklin Tmpl Modrt Trgt -A 443 0.25 0.22 0.25 0.75 1.47 6/22/2007Franklin Tmpl Growth Trgt -A 367 0.25 0.26 0.26 0.25 0.82 1.32 6/22/2007Franklin Tmpl Perspct Aloc-A 223 0.22 0.37 0.35 0.77 1.27 6/22/2007Franklin Tmpl Consrv Trgt -A 217 0.25 0.24 0.24 0.25 0.68 1.18 6/22/2007FranklinTmpl 2025 RtrmTrgt-A 4 0.25 3.63 3.53 0.35 0.85 1.35 6/22/2007FranklinTmpl 2015 RtrmTrgt-A 3 0.25 6.43 6.33 0.35 0.82 1.32 6/22/2007FranklinTmpl 2035 RtrmTrgt-A 2 0.25 8.51 8.41 0.35 0.89 1.39 6/22/2007FranklinTmpl 2045 RtrmTrgt-A 2 0.25 8.72 8.62 0.35 0.89 1.39 6/22/2007
Franklin Income Series -A 34,589 0.40 0.09 0.15 0.64 1/26/2007Templeton Growth -A 29,531 0.57 0.23 0.25 1.05 12/28/2006Mutual Shares -Z 13,671 0.57 0.27 0.84 6/29/2007Franklin CA TxFr Income -A 12,920 0.45 0.04 0.09 0.58 12/14/2006Templeton Foreign Series -A 12,371 0.59 0.32 0.25 1.16 4/27/2007Templeton World -A 9,638 0.61 0.21 0.24 1.06 12/15/2006TIFI Foreign Equity Series 8,428 0.68 0.01 0.14 0.81 4/27/2006Franklin Federal TxFr Inc -A 6,547 0.45 0.07 0.09 0.61 12/14/2006Franklin Small-Mid Cap Gro-A 5,583 0.46 0.01 0.26 0.25 0.96 12/14/2006Franklin Hi Yield TxFr Inc-A 5,252 0.46 0.06 0.10 0.62 6/27/2007
Fund
of F
unds
Reg
ular
Fun
ds

19
Prospectus Data – Stated Benchmarks
Compare funds that have the same performance benchmark as stated in the prospectus.
Portfolio Name 6/07 Total Assets $MM
Prospectus Benchmark 1
Prospectus Benchmark 2 Lipper Classification Morningstar
CategoryBaron Partners 3,151 Russell 2000 S&P 500 Long/Short Equity Mid GrowthMeridian Growth 2,071 Russell 2000 Mid-Cap Core Mid GrowthLongleaf Partners Small Cap 3,902 Russell 2000 Mid-Cap Core Small ValueBaron Asset 4,381 Russell 2000 Russell 2500 Mid-Cap Growth Mid GrowthFidelity Low Priced Stock 41,237 Russell 2000 Mid-Cap Value Mid BlendOppenheimer Small Mid Cp Value 5,317 Russell 2000 Russell 2500 Mid-Cap Value Mid BlendRoyce Premier Shares 5,022 Russell 2000 Small-Cap Core Mid BlendDFA US Micro Cap 5,370 Russell 2000 Small-Cap Core Small BlendDFA US Small Cap 3,731 Russell 2000 Small-Cap Core Small BlendDWS Dreman Small Cap Val 2,266 Russell 2000 Russell 2000 Value Small-Cap Core Small BlendFidelity Small Cap Stock 5,070 Russell 2000 Small-Cap Core Small BlendKeeley Small Cap Value 5,215 Russell 2000 S&P 500 Small-Cap Core Small BlendLord Abbett Sml Cap Value 4,285 Russell 2000 Russell 2000 Value Small-Cap Core Small BlendManagers Special Equity 2,653 Russell 2000 Small-Cap Core Small BlendOppenheimer Main St Sm Cap 6,036 Russell 2000 Lipper Small Cap Core Small-Cap Core Small BlendPennsylvania Mutual 4,836 Russell 2000 Small-Cap Core Small BlendRoyce Low Priced Stock 5,050 Russell 2000 Small-Cap Core Small BlendThird Avenue Small Cap Value 2,458 Russell 2000 Russell 2000 Value Small-Cap Core Small BlendWells Fgo Avtg Small Cap Value 4,036 Russell 2000 Russell 2000 Value Small-Cap Core Small BlendiShares Russell 2000 Index 11,175 Russell 2000 Small-Cap Core Small BlendFidelity Adv Small Cap 3,790 Russell 2000 Small-Cap Core Small GrowthRoyce Value Plus 2,758 Russell 2000 Small-Cap Core Small GrowthRoyce Total Return 6,347 Russell 2000 Small-Cap Core Small ValueNB Genesis 11,002 Russell 2000 Small-Cap Growth Small BlendBaron Growth 6,912 Russell 2000 S&P 500 Small-Cap Growth Small GrowthBaron Small Cap 3,481 Russell 2000 S&P 500 Small-Cap Growth Small GrowthFidelity Small Cap Independ 2,627 Russell 2000 Small-Cap Growth Small GrowthSEI SIIT Small Cap 2,095 Russell 2000 Small-Cap GrowthArtisan Small Cap Value 2,396 Russell 2000 Small-Cap Value Small ValueRoyce Opportunity 2,777 Russell 2000 Small-Cap Value Small Value
20
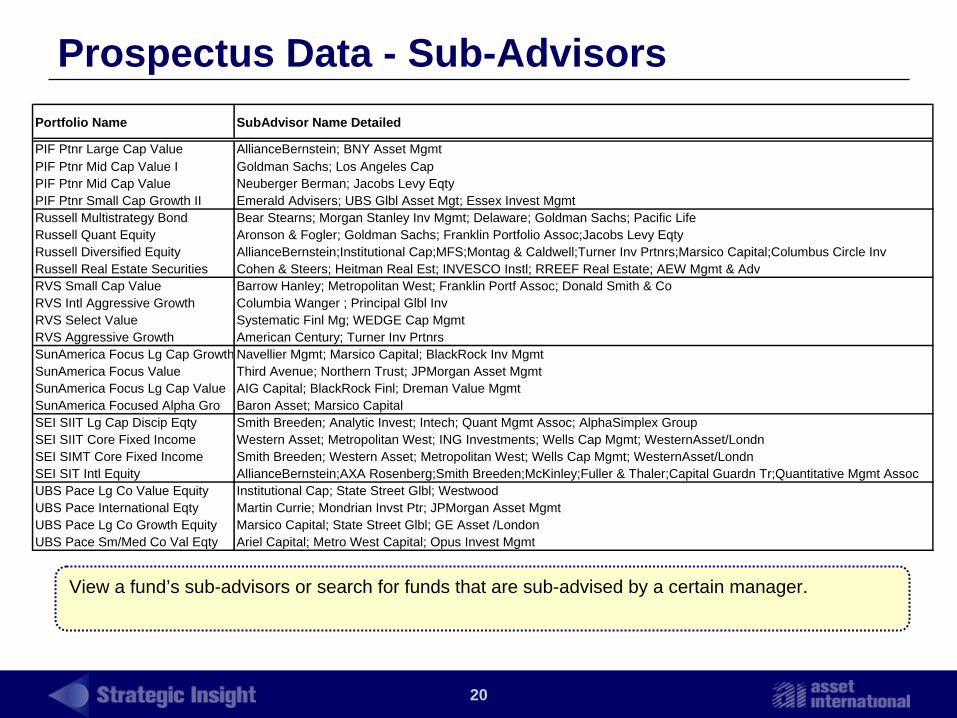
Prospectus Data - Sub-Advisors
View a fund’s sub-advisors or search for funds that are sub-advised by a certain manager.
Portfolio Name SubAdvisor Name Detailed
PIF Ptnr Large Cap Value AllianceBernstein; BNY Asset MgmtPIF Ptnr Mid Cap Value I Goldman Sachs; Los Angeles CapPIF Ptnr Mid Cap Value Neuberger Berman; Jacobs Levy EqtyPIF Ptnr Small Cap Growth II Emerald Advisers; UBS Glbl Asset Mgt; Essex Invest MgmtRussell Multistrategy Bond Bear Stearns; Morgan Stanley Inv Mgmt; Delaware; Goldman Sachs; Pacific LifeRussell Quant Equity Aronson & Fogler; Goldman Sachs; Franklin Portfolio Assoc;Jacobs Levy EqtyRussell Diversified Equity AllianceBernstein;Institutional Cap;MFS;Montag & Caldwell;Turner Inv Prtnrs;Marsico Capital;Columbus Circle InvRussell Real Estate Securities Cohen & Steers; Heitman Real Est; INVESCO Instl; RREEF Real Estate; AEW Mgmt & AdvRVS Small Cap Value Barrow Hanley; Metropolitan West; Franklin Portf Assoc; Donald Smith & CoRVS Intl Aggressive Growth Columbia Wanger ; Principal Glbl InvRVS Select Value Systematic Finl Mg; WEDGE Cap MgmtRVS Aggressive Growth American Century; Turner Inv PrtnrsSunAmerica Focus Lg Cap Growth Navellier Mgmt; Marsico Capital; BlackRock Inv MgmtSunAmerica Focus Value Third Avenue; Northern Trust; JPMorgan Asset MgmtSunAmerica Focus Lg Cap Value AIG Capital; BlackRock Finl; Dreman Value MgmtSunAmerica Focused Alpha Gro Baron Asset; Marsico CapitalSEI SIIT Lg Cap Discip Eqty Smith Breeden; Analytic Invest; Intech; Quant Mgmt Assoc; AlphaSimplex GroupSEI SIIT Core Fixed Income Western Asset; Metropolitan West; ING Investments; Wells Cap Mgmt; WesternAsset/LondnSEI SIMT Core Fixed Income Smith Breeden; Western Asset; Metropolitan West; Wells Cap Mgmt; WesternAsset/LondnSEI SIT Intl Equity AllianceBernstein;AXA Rosenberg;Smith Breeden;McKinley;Fuller & Thaler;Capital Guardn Tr;Quantitative Mgmt AssocUBS Pace Lg Co Value Equity Institutional Cap; State Street Glbl; WestwoodUBS Pace International Eqty Martin Currie; Mondrian Invst Ptr; JPMorgan Asset MgmtUBS Pace Lg Co Growth Equity Marsico Capital; State Street Glbl; GE Asset /LondonUBS Pace Sm/Med Co Val Eqty Ariel Capital; Metro West Capital; Opus Invest Mgmt

21
Service Provider Data
• Service Provider Location and Contact Information– Administrator– Advisor– Auditor– Custodian– Distributor– Legal Counsel– Transfer Agent– Sub-Advisor
• Manager, Sub-Advisor and Advisor Parent Company Data
• Service Provider Analysis Pre-Stored Reports

22
Pre-Defined Views to Quickly Filter Universe• Five Views to Filter Universe for ETFs & Fund of Funds
– Classic View (Includes Unaffiliated Fund of Funds & Open-End ETFs)– Standard View (Excludes All Fund of Funds, Includes Open-End ETFs)– Fund of Funds View (Only Includes Fund of Funds)– ETF View (Only Includes ETFs – All Structures)– Unified View (All Inclusive – Includes all Fund of Funds & ETFs)
Drop down box that gives users quick access to different Views. To the right of the drop down box, a brief description of the universe selected.

23
Link From Simfund MF to Simfund Filing
Link from Simfund MF to Simfund Filing. (Simfund Filing subscription required). For one fund or a group of funds, users can quickly access the latest prospectus, latest prospectus changes filed by the fund, all SEC filings for that fund or manager, a fund profile page, and newly registered funds by the manager.
24
Link to Simfund Filing Prospectus Profile
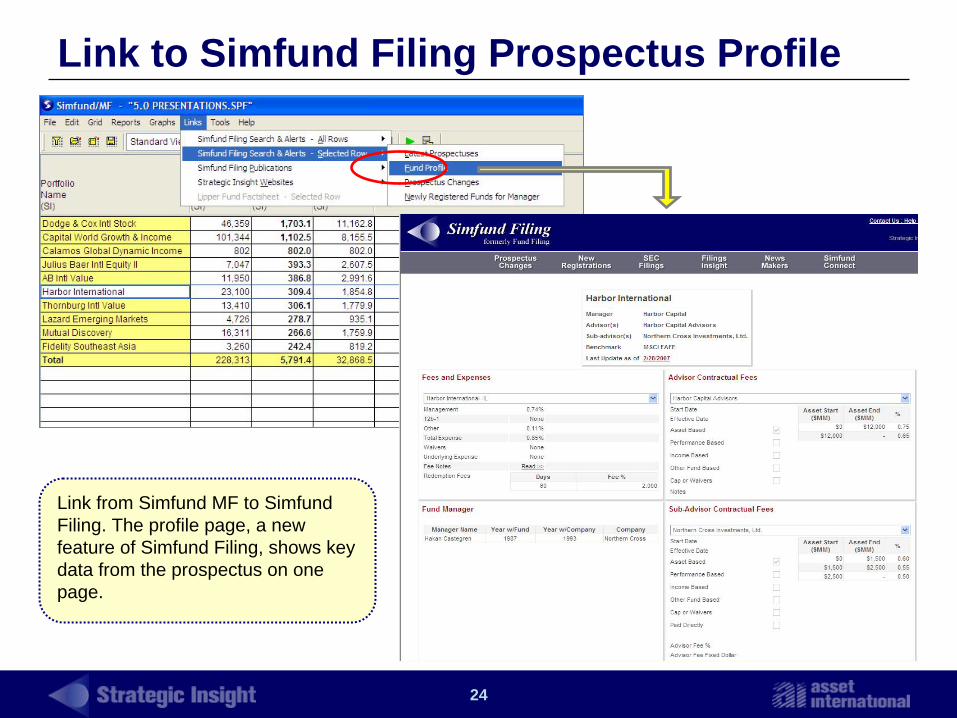
Link from Simfund MF to Simfund Filing. The profile page, a new feature of Simfund Filing, shows key data from the prospectus on one page.
25
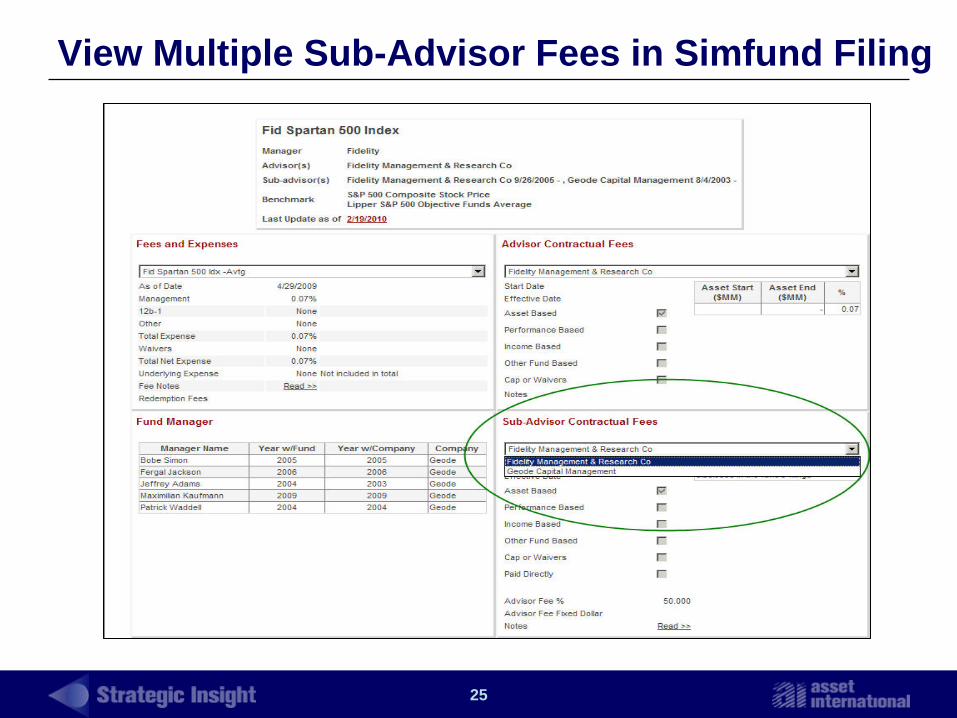
View Multiple Sub-Advisor Fees in Simfund Filing

26
For Additional Information Please Contact
(212) 944-4455
Contact Information