conventional vs mf/uf pretreatment for swro desalination · conventional vs mf/uf pretreatment for...
TRANSCRIPT
Conventional vs MF/UF Pretreatment for SWRO Desalination
PNWS AWWA Annual Conference8 May, 2009
Acknowledgements
• Co-AuthorsVal Frenkel, Kennedy/Jenks ConsultantsJim Lozier, CH2M HILL
• Marin Municipal Water DistrictBob Castle, PE – Water Quality ManagerPaul Sellier, PE - Water Quality Engineer

Presentation Overview
• Project Background• Overview of Desalination Pilot Program• Source Water Quality• Intake and Strainer System• Conventional Pretreatment• MF/UF Pretreatment • Comparison of Pretreatment

MMWD’s Current Water Supplies
Reservoirs72%
Russian River (via NMWD )
26%
Recycled2%
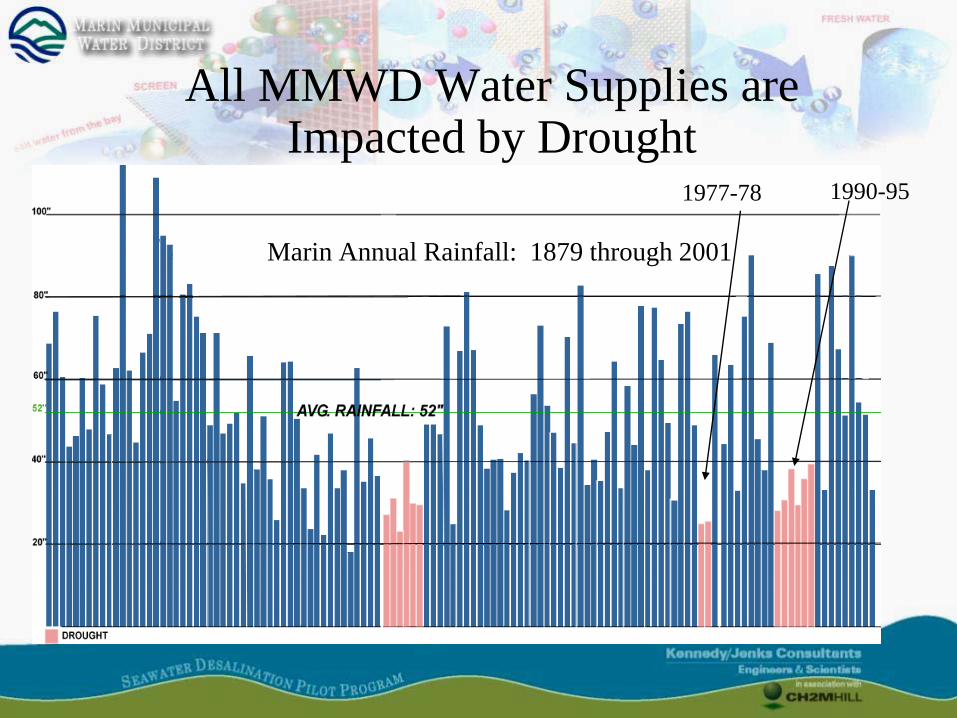
All MMWD Water Supplies are Impacted by Drought
Marin Annual Rainfall: 1879 through 2001
1977-78 1990-95

Desalination is a Drought-Proof Water Source

MMWD Seawater Desalination Pilot Program Objectives
- Demonstrate high quality drinking water
- Conduct environmental studies
- Evaluate advanced treatment technologies
- Familiarize the public with desalination
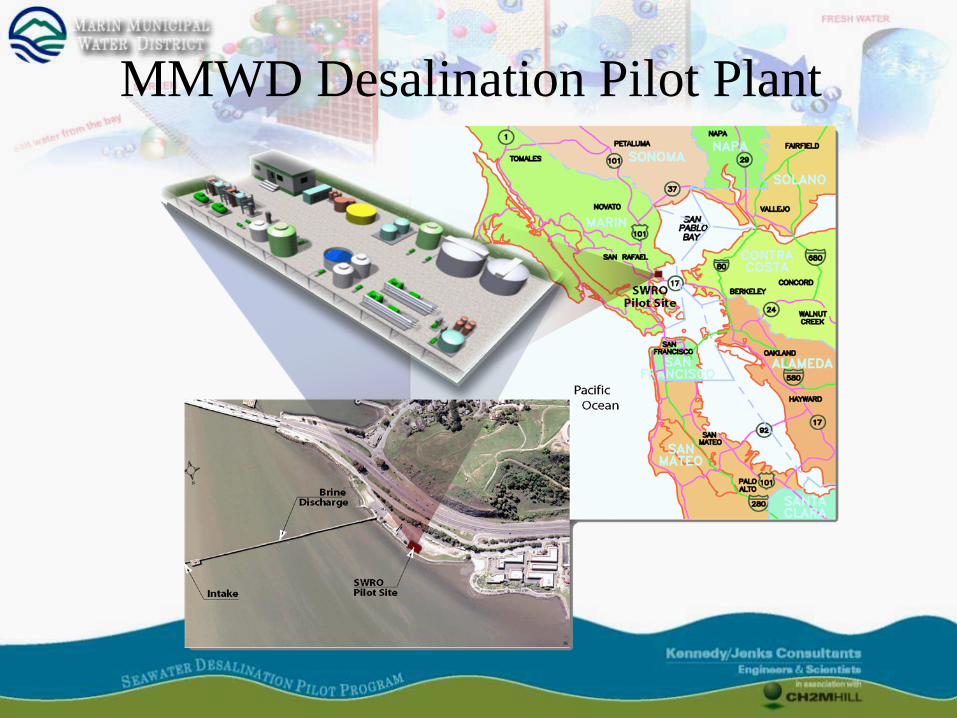
MMWD Desalination Pilot Plant

Dynamic and Complex Source Water
• San Francisco Bay is the largest estuary on the West Coast
• Bay Water is a mix of:Ocean WaterDelta WaterStorm Water RunoffMunicipal and Industrial Discharges
• Water quality varies seasonally and diurnally
URS

Salinity and Turbidity Vary Diurnally and Seasonally
MMWD Seawater Desalination Pilot Program Source Water Turbidity and TDS
0
5000
10000
15000
20000
25000
30000
08-Apr-05 28-May-05 17-Jul-05 05-Sep-05 25-Oct-05 14-Dec-05 02-Feb-06 24-Mar-06
Date
TDS
(mg/
L)
1
10
100
1000
Turb
idity
(NTU
)
Total Dissolved Solids (TDS) Turbidity (NTU)

Source Water Organics Vary with Freshwater Runoff in Bay
MMWD Seawater Desalination Pilot ProgramSource Water and Filtrate Total Organic Carbon (TOC)
0.0
1.0
2.0
3.0
4.0
5.0
6.0
7.0
8.0
2/17/2005 4/8/2005 5/28/2005 7/17/2005 9/5/2005 10/25/2005 12/14/2005 2/2/2006 3/24/2006
Date
Tota
l Org
anic
car
bon
(mg/
L)
0
5000
10000
15000
20000
25000
30000
Tota
l Dis
solv
ed S
olid
s (m
g/l)
Source Water Conventional MF/UF TDS

FreshWater
Return to the Bay
Brine
MMWD Desalination: From Bay Water to Drinking Water
Particulate and Organic matter
To Landfill
To MMWD System
BayWater

Step 1 - Intake Screening• Designed to meet
Federal and State criteria (316b) for fish protection
3/32-inch openings<0.3 fps velocityairburst cleaning
• Removes large particles and debris
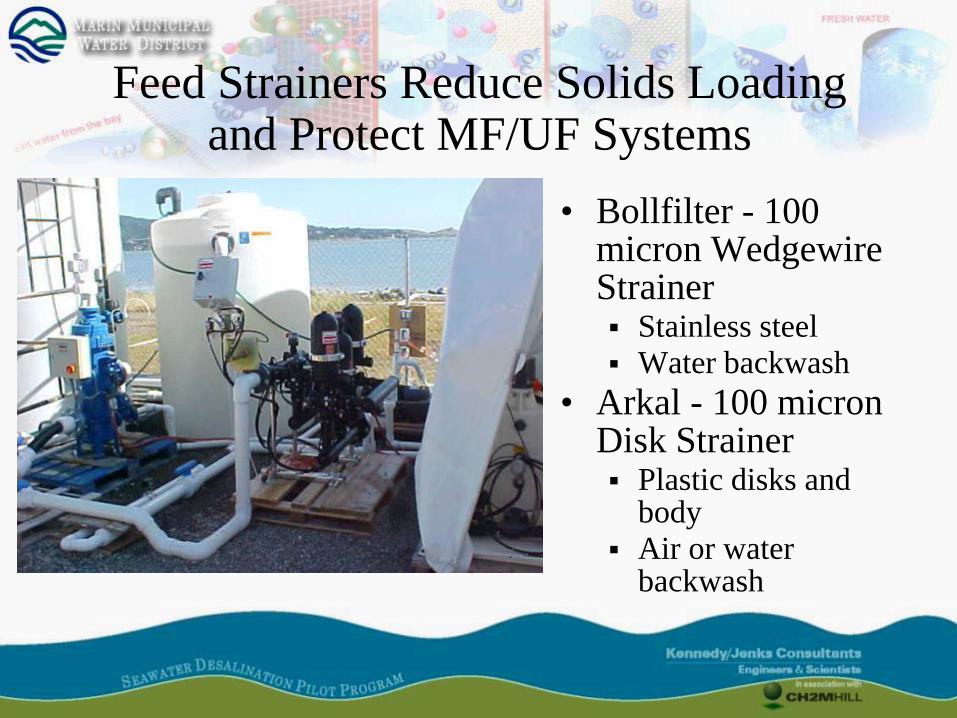
Feed Strainers Reduce Solids Loading and Protect MF/UF Systems
• Bollfilter - 100 micron Wedgewire Strainer
Stainless steelWater backwash
• Arkal - 100 micron Disk Strainer
Plastic disks and bodyAir or water backwash

Disk strainer provides better water quality with easier maintenance
• Parallel 2-hr clogging capacity test of strainer effluent
• Disk Strainer effluent contained fewer solids
• Disk strainer permitted easy access to strainer elements
• Plastic materials for corrosion resistance
100 micronWedgewireStrainer
100 micronDiskStrainer

Step -2 Pretreatment ProcessesConventional Pretreatment
MF/UF Pretreatment
Strainer MF/UF Filtration
Seawater
Desal
Coagulation Flocculation Clarification2 StageMedia
Filtration
Seawater
Desal

Conventional System Parameters
Process Pilot Plant CharacteristicsLoading Rate
(gpm/ft2)
HDT (min)/ Dose (mg/l)
FlocculatorCenter flocculation paddle mixer, 5-ft water
depth. N/A 14.8
Clarifier Cone bottom clarifier with tube settlers 2-ft deep 0.45 to 0.6 60.0
Filter #136-inches of anthracite with an effective size of
1.0-1.1 mm 3 to 4 N/A
Filter #2
24-inches of silica sand with an effective size of0.45-0.65 mm
12-inches of garnet having an effective size of0.18-0.28 mm 3 to 4 N/A
Filter BW
Backwash frequency from 18 to 48 hours.Backwash is set for 5 minutes with filter towaste for 5 minutes. 17.7 N/A
Coagulant Ferric Chloride N/A 12 - 30
Polymer PolyFloc – Coagulant Aid N/A 0.5

Conventional Treatment• Requires proper coagulation and clarification conditioning of
source water
• Particles removed by sedimentation/clarification and depth filtration
• Sensitive to changes in source water quality (change in coagulant dose)
• Provides TOC reduction in RO feedwater
• Does not require feed strainer (although strainer may be beneficial for biological control)
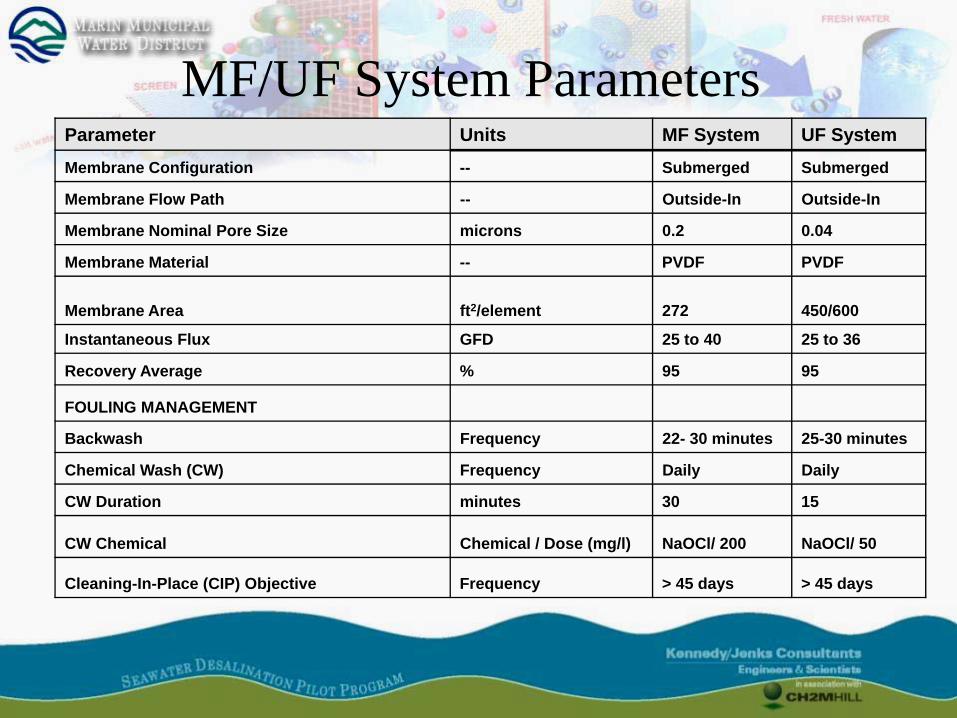
MF/UF System ParametersParameter Units MF System UF SystemMembrane Configuration -- Submerged Submerged
Membrane Flow Path -- Outside-In Outside-In
Membrane Nominal Pore Size microns 0.2 0.04
Membrane Material -- PVDF PVDF
Membrane Area ft2/element 272 450/600
Instantaneous Flux GFD 25 to 40 25 to 36
Recovery Average % 95 95
FOULING MANAGEMENT
Backwash Frequency 22- 30 minutes 25-30 minutes
Chemical Wash (CW) Frequency Daily Daily
CW Duration minutes 30 15
CW Chemical Chemical / Dose (mg/l) NaOCl/ 200 NaOCl/ 50
Cleaning-In-Place (CIP) Objective Frequency > 45 days > 45 days
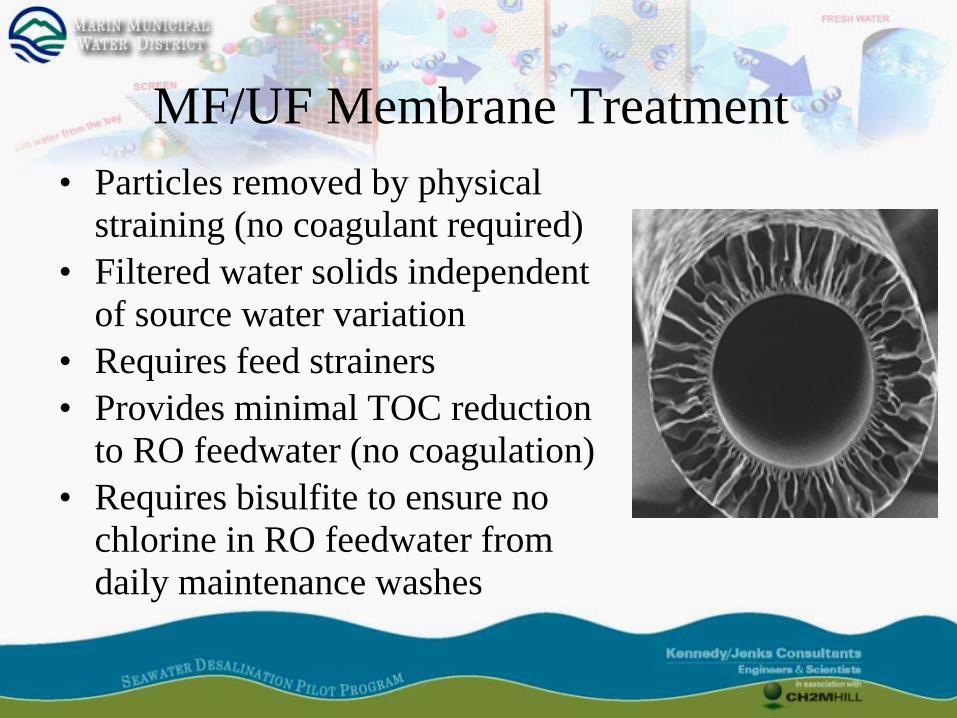
MF/UF Membrane Treatment• Particles removed by physical
straining (no coagulant required)• Filtered water solids independent
of source water variation• Requires feed strainers • Provides minimal TOC reduction
to RO feedwater (no coagulation)• Requires bisulfite to ensure no
chlorine in RO feedwater from daily maintenance washes
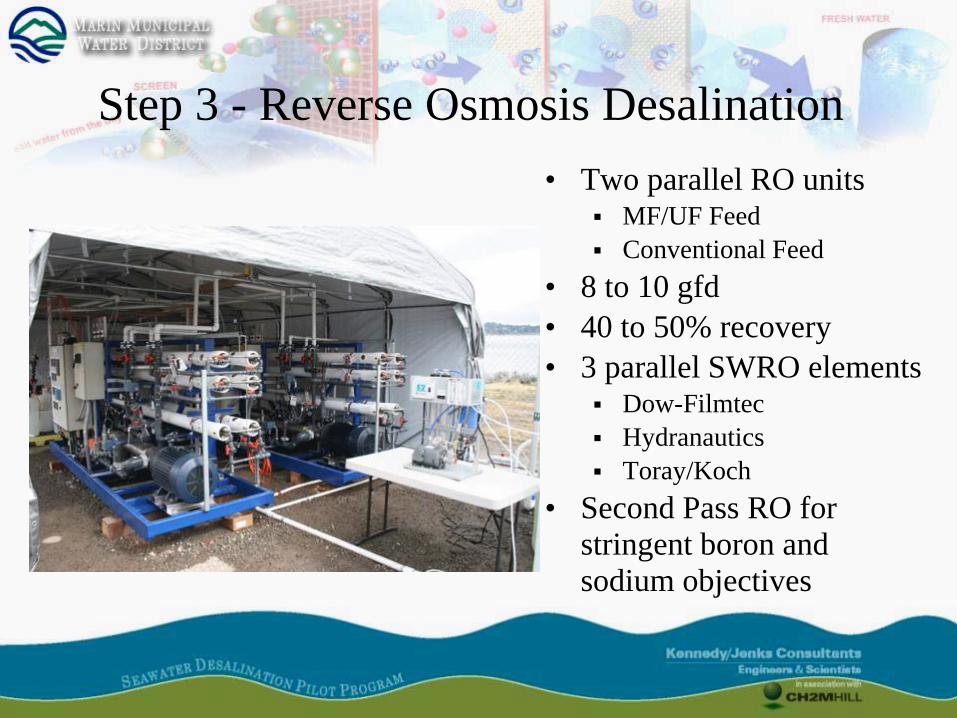
Step 3 - Reverse Osmosis Desalination• Two parallel RO units
MF/UF FeedConventional Feed
• 8 to 10 gfd• 40 to 50% recovery• 3 parallel SWRO elements
Dow-FilmtecHydranauticsToray/Koch
• Second Pass RO for stringent boron and sodium objectives

Step 4 - Post Treatment• Calcium and bicarbonate
added to match stability and taste of current MMWD water
• Disinfection similar to current MMWD practices
• MMWD customers find taste of Desal water as good as water from local reservoirs

Comparison of Conventional and MF/UF Pretreatment Performance
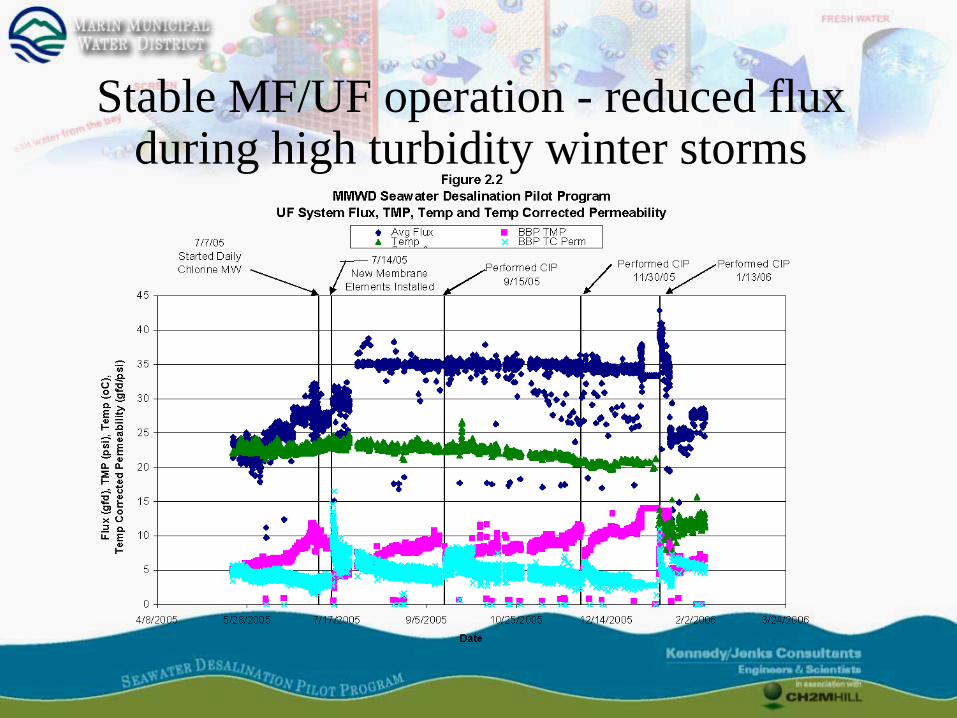
Stable MF/UF operation - reduced flux during high turbidity winter storms
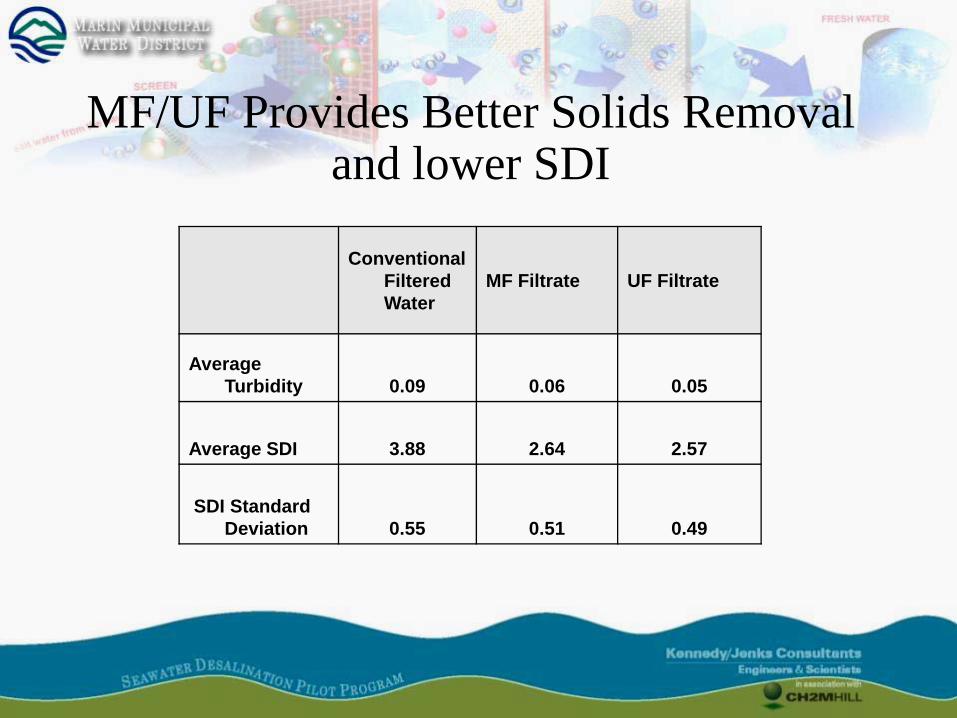
MF/UF Provides Better Solids Removal and lower SDI
Conventional Filtered Water
MF Filtrate UF Filtrate
AverageTurbidity 0.09 0.06 0.05
Average SDI 3.88 2.64 2.57
SDI Standard Deviation 0.55 0.51 0.49

Types of SWRO membrane fouling• Inorganic scale - control
with antiscalant, system recovery
• Particulate fouling –minimize feed water turbidity and SDI
• Organic fouling –minimize feed water dissolved organics
• Biofouling – control with flux rate, shock Cl
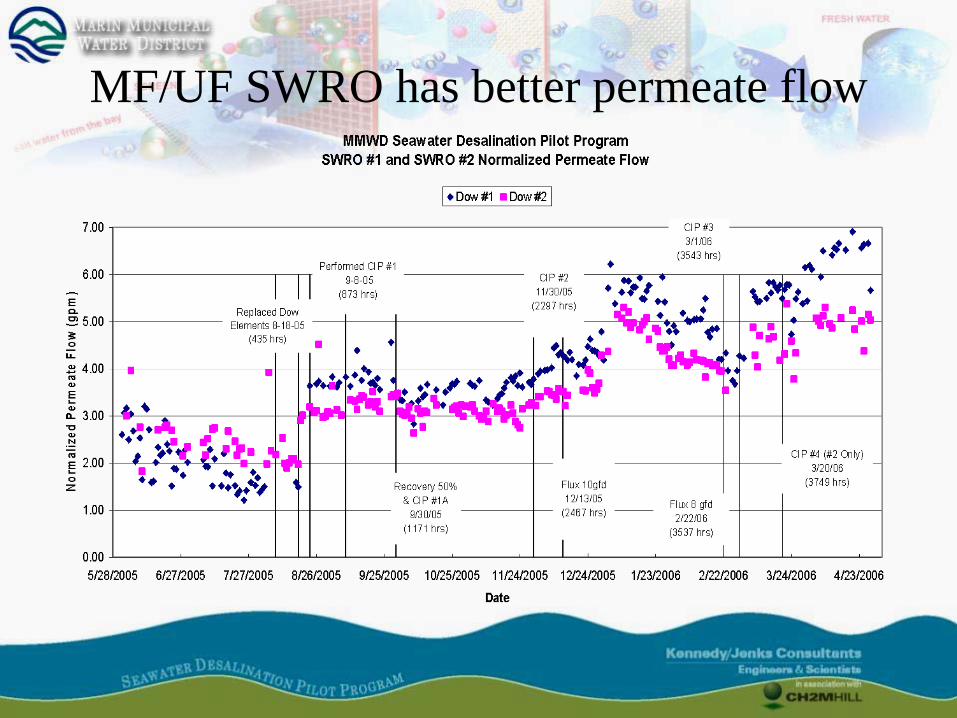
MF/UF SWRO has better permeate flow

Both systems show similar salt passage
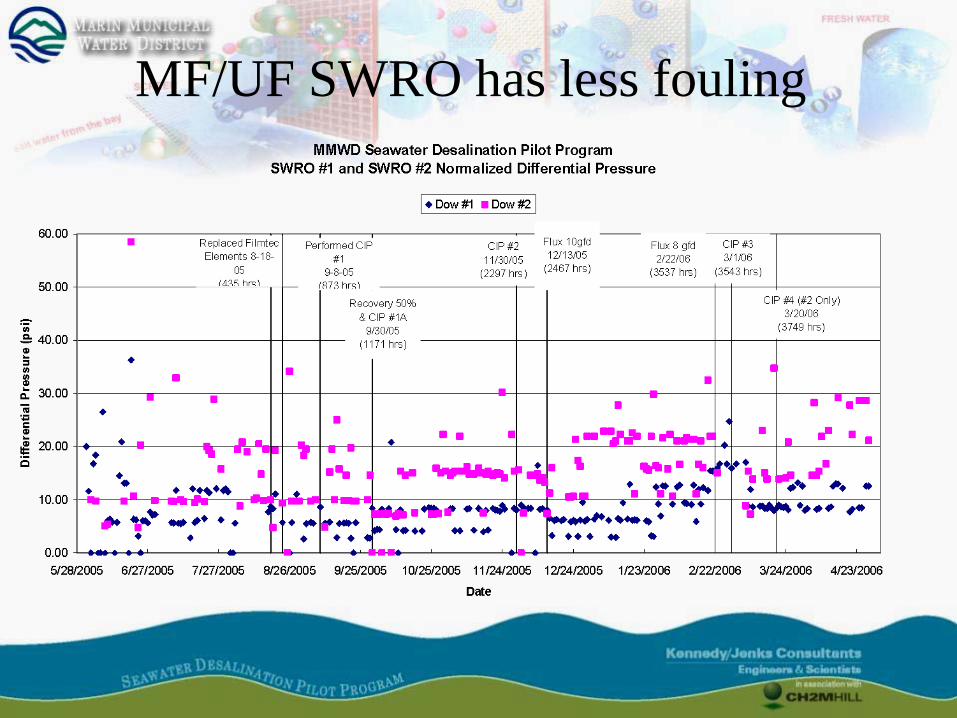
MF/UF SWRO has less fouling

Autopsy confirmed MF/UF SWRO has less fouling
Photos of SWRO Membrane Visual Analysis
MF/UF Pretreatment Conventional Pretreatment
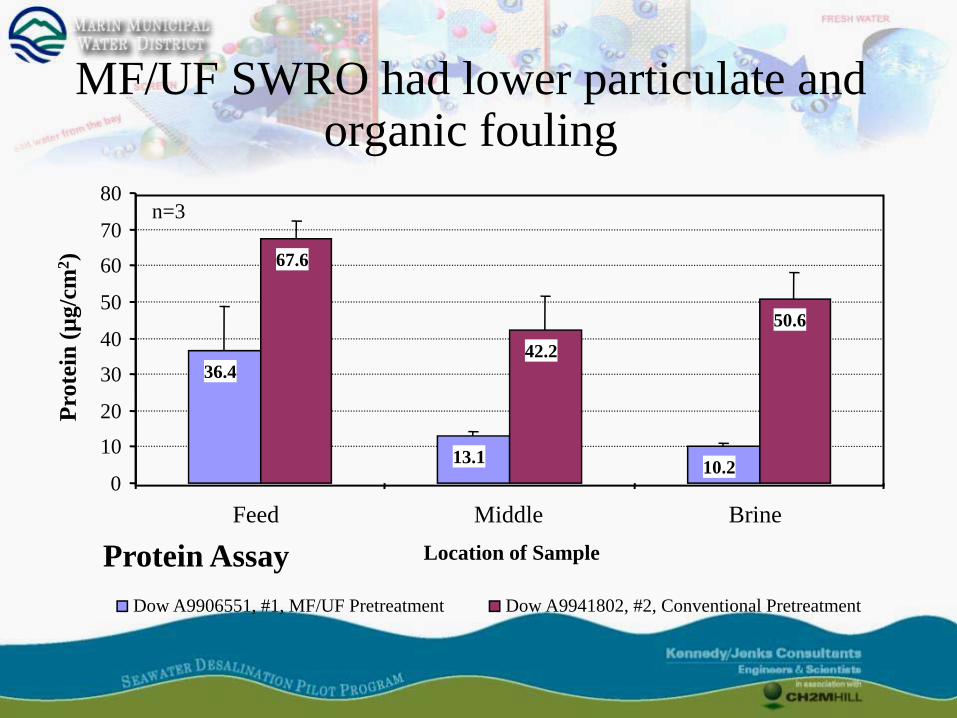
Protein Assay
36.4
13.1 10.2
67.6
42.2
50.6
0
10
20
30
40
50
60
70
80
Feed Middle BrineLocation of Sample
Prot
ein
(µg/
cm2 )
Dow A9906551, #1, MF/UF Pretreatment Dow A9941802, #2, Conventional Pretreatment
n=3
MF/UF SWRO had lower particulate and organic fouling

MF/UF requires less area than conventional pretreatment
• For 10 MGD MMWD Desal Facility• Conventional Pretreatment
Flocculation ~ 3,000 sfClarifiers ~7,000 sfFilters ~14,000 sfWW Recovery ~7,000 sfTotal Area ~31,000 sf
• MF/UF PretreatmentStrainers ~2,000 sfFlocculation ~2,000 sfMembrane Bldg ~8,000 sfWW Recovery ~2,000 sfTotal Area ~14,000 sf
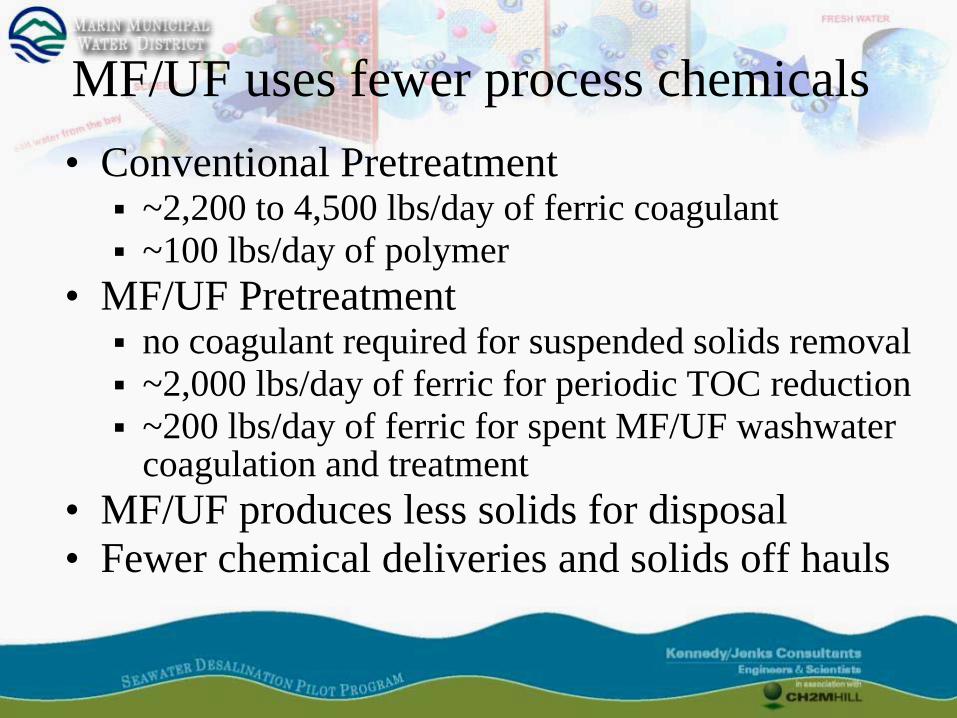
MF/UF uses fewer process chemicals • Conventional Pretreatment
~2,200 to 4,500 lbs/day of ferric coagulant~100 lbs/day of polymer
• MF/UF Pretreatmentno coagulant required for suspended solids removal~2,000 lbs/day of ferric for periodic TOC reduction~200 lbs/day of ferric for spent MF/UF washwater coagulation and treatment
• MF/UF produces less solids for disposal• Fewer chemical deliveries and solids off hauls
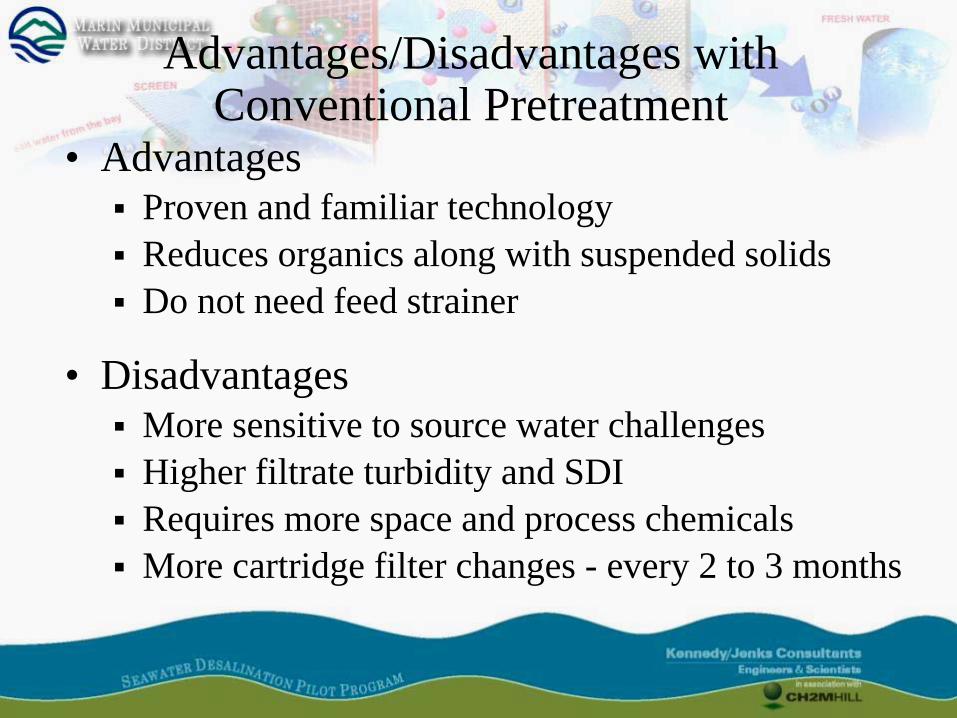
Advantages/Disadvantages with Conventional Pretreatment
• AdvantagesProven and familiar technologyReduces organics along with suspended solidsDo not need feed strainer
• DisadvantagesMore sensitive to source water challengesHigher filtrate turbidity and SDIRequires more space and process chemicalsMore cartridge filter changes - every 2 to 3 months
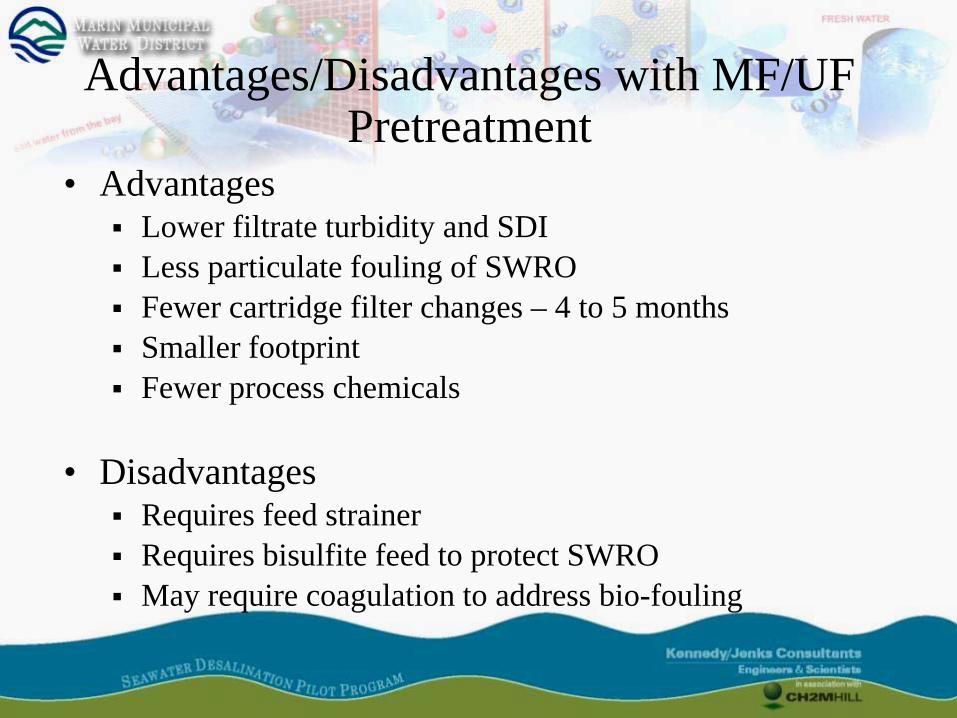
Advantages/Disadvantages with MF/UF Pretreatment
• AdvantagesLower filtrate turbidity and SDILess particulate fouling of SWROFewer cartridge filter changes – 4 to 5 monthsSmaller footprintFewer process chemicals
• DisadvantagesRequires feed strainerRequires bisulfite feed to protect SWROMay require coagulation to address bio-fouling

MF/UF pretreatment system has lower capital and operating costs
• MF/UF capital costs are approximately 15 to 20-percent lower than conventional system
• MF/UF operating costs are approximately 5 to 10-percent lower than conventional system
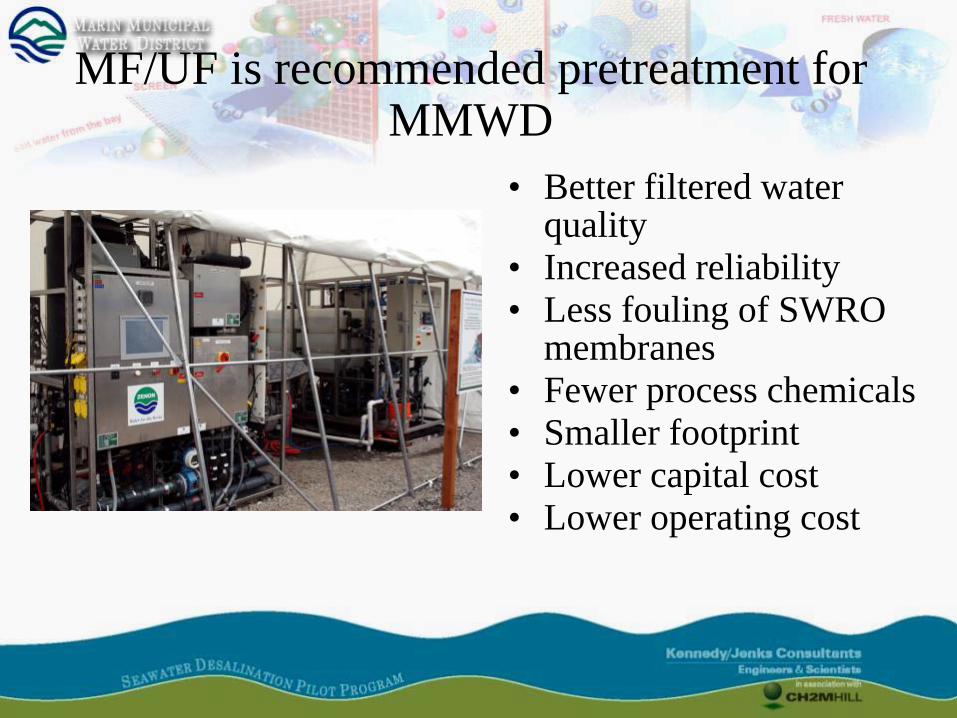
MF/UF is recommended pretreatment for MMWD
• Better filtered water quality
• Increased reliability• Less fouling of SWRO
membranes• Fewer process chemicals • Smaller footprint• Lower capital cost• Lower operating cost
Questions and Answers