signal peak landscape assessment - conservation … peak case...signal peak landscape assessment...
TRANSCRIPT

Signal Peak Landscape Assessment
Version 1
September, 2006
Gila National Forest, Las Cruces BLM, and Collaborators
Signal Peak Landscape Assessment, Version 1.0 9/4/2006
1

Table of Contents Introduction Assessment Area Objectives Current Conditions Restoration Strategies Landscape Priorities Citations Appendices Team Members
Data sources and Methods
Signal Peak Landscape Assessment, Version 1.0 9/4/2006
2

Signal Peak Landscape Assessment INTRODUCTION Restoration of fire adapted ecosystems in Southwestern forests and grasslands is a central priority for the Forest Service. Reducing risk of hazardous fire behavior, improving functionality of fire adapted ecosystems, threatened and endangered species habitat, and municipal watersheds are key design objectives of restoration strategies. Collaborative efforts with local partners are part of the agency’s strategic action plan for restoring the functionality of fire adapted ecosystems (United States Forest Service 2003). The strategic action plan emphasizes development of joint landscape assessments that support restoration project proposals on National Forest System lands funded through the Collaborative Forest Restoration Program (CFRP). The Signal Peak landscape assessment is designed to meet restoration goals for fire adapted ecosystems and provide the support information for the Jobs and Biodiversity Coalition CFRP grant awarded in June 2006. The Gila National Forest (Forest) and surrounding areas are dominated by fire adapted ecosystems including mixed conifer, ponderosa pine, juniper and shrubland vegetation types. Natural fire ignitions occur frequently across most of the area, some of the highest number of lightning ignited fires recorded in the Nation occurs on the Forest. Fire suppression has been effective at managing wildfires since the early 1900’s, so effective that much of the landscape has been excluded from the effects of natural fire. More than 80 years of fire suppression has inadvertently caused a new problem – an unnatural increase in the amount of wood surface and canopy fuels. This increase in fuels combined with certain vegetation structural characteristics and the high occurrence of lightning ignitions creates a serious risk of hazardous fire behavior for many areas of the Forest (United States Forest Service 2006). Not all areas of the Forest have been excluded from natural fires. Wildland fire use, an agency term for active management of natural fire ignitions, has been major emphasis of the Forest’s fire management program since 1974 (United States Forest Service 1978). The Forest has a long history of proactive wildland fire use management with an estimated 400 000 acres treated in the last 10 years. However, even with the proactive use of wildfire, the Forest has more than 60 percent of the landscape in fire regime condition classes 2 and 3 and an estimated 30 to 50 percent of the landscape at risk of hazardous fire behavior. This risk of hazardous fire exists because long-term wildfire suppression has had an exponential effect on fuel accumulation. The relatively short time frame of wildland fire use has not been able to catch up with the fuel increase. An increasing trend in large and catastrophic wildfires, notably the 2000 fire season, sparked the agencies decision to develop The Cohesive Strategy
Signal Peak Landscape Assessment, Version 1.0 9/4/2006
3

(United States Forest Service 2000). The strategy established a framework which emphasizes restoration and maintenance of ecosystem health in fire adapted ecosystems for priority areas across the interior West. Reversal of the hazardous conditions will require Forest-wide strategic planning, prioritization of restoration areas and considerable investment of funds and workforce over several decades. Challenges to reducing hazardous trend include modification of vegetation, composition, and structure on a landscape scale, to reduce hazardous fire behavior and improve ecological conditions. Characteristics requiring modification include surface fuels (fire behavior fuel model), canopy base height (distance between surface fuels and base of tree canopy), canopy cover (percent of tree cover above 15 feet), and successional class. The Signal Peak assessment provides a landscape strategy that can be applied to any scale landscape for design and prioritization of a program of work. The assessment process spatially identifies hazardous fire behavior risk and Fire Regime Condition Class (FRCC) (i.e., departure from historic conditions). Area prioritization is based on integration of risks and concerns. Risks include hazardous fire behavior and FRCC 2 and 3; concerns include wildland urban interface and Mexican spotted owl habitat. Land managers in collaboration with interested partners use the integrated risk and concern values to develop and prioritize a program of work to link collective interests. The assessment document also provides the basis for future decision making documents by providing the purpose and need statement for federal agency environmental documents. This landscape assessment is not intended to be used as a decision making document. Restoration strategies are intended to support project planning and are appropriate to use for development of purpose and need statements. Proposed implementation of any restoration strategies presented in this assessment, either in whole or in part will need to be supported by environmental analyses in accordance with the National Environmental Policy Act and agency directives. Field validation of vegetation and fuel characteristics is needed prior to project design. ASSESSMENT AREA The Gila National Forest prioritized 3.3 million acres in 2004 and identified landscapes with key assets potentially at risk from uncharacteristic crown fire. The assets used to prioritize watersheds included: Municipal watersheds Threatened species – Mexican spotted owl Wildland Urban Interface (WUI) Ponderosa pine and mixed conifer Large landscape fires
Signal Peak Landscape Assessment, Version 1.0 9/4/2006
4

The Signal Peak Assessment Area (Signal Peak) is one of six priority watersheds identified by the Forest for restoring the functionality of fire adapted ecosystems. The Silver City Ranger District and partners in the Bureau of Land Management, New Mexico State Forest, Grant County, Jobs for Biodiversity Coalition, The Nature Conservancy and Upper Gila Watershed Alliance, shared interests in the restoration of the Signal Peak area. The Signal Peak assessment boundary was designed to include multiple ownerships of interested partners (Map 1). The assessment area is about 360,000 acres with ownership nearly 60 percent Forest Service, 4 percent Bureau of Land Management, 7 percent State, and 29 percent private.
Map 1. The map displays the boundary of the Signal Peak assessment area located north of Silver City, near the southern end of the Gila National Forest, and in SW New Mexico.
Signal Peak Landscape Assessment, Version 1.0 9/4/2006
5

OBJECTIVES Objectives of Signal Peak landscape assessment are:
1. Identify and map hazardous fire behavior risk and Fire Regime Condition Class (FRCC) at the landscape scale;
2. Spatially integrate key resource concerns of wildland urban interface and
Mexican spotted owl habitat with hazardous fire behavior and fire regime classes 2 and 3;
3. Recommend strategic changes to reduce hazardous fire behavior risk and
improve FRCC 2 and 3 at the landscape level; and
4. Prioritize areas where a mix of integrated resource restoration techniques will reduce hazardous fuel and fire behavior risk, improve FRCC, and move landscapes into more sustainable and healthy conditions.
CURRENT CONDTIONS Vegetation Conifer vegetation types dominate more than 70 percent of the landscape, with juniper at lower elevations, and ponderosa pine and mixed conifer (Douglas-fir and ponderosa pine) at the higher elevations, although considerable intermixing occurs (Figure 1). Pine-oak vegetation types can occur as a mosaic within the dominant conifer types or in large landscape patches. Aspen is present in variable amounts ranging from single tree to small patches less than 10 acres and usually mixed with the dominant conifer type. Shrubland types occur on 11 percent of the landscape, typically a combination of several deciduous shrubs including chaparral, mountain mahogany, and oak species. This vegetation type generally occurs in large landscape patches ranging from a hundred to several thousand acres in size. Grasslands are a mix of perennial and annual species with some scattered shrubs (rabbit brush, mesquite) and desert succulent species (yucca, cactus). The west fork of the Gila river, Sapillo Creek and several other perennial streams support diverse riparian vegetation types which represents 4 percent of the area and include many deciduous tall shrub and tree species (willow, cottonwood, sycamore). Desert scrub, barren and agricultural lands represent 7 percent of the area. The existing vegetation group that covers the largest area is the Juniper type, with almost 160,000 acres (Table 1). Historically, much of what is currently Juniper was open grasslands. In contrast, the Aspen type currently only covers a couple of hundred acres, while historically it was likely somewhat more extensive. Grassland and shrubland types predominate on the eastern portion, while the Pine Oak, Ponderosa Pine, and Mixed Conifer predominate to the north and east with the Juniper Type surrounding both (Map 2).
Signal Peak Landscape Assessment, Version 1.0 9/4/2006
6

Existing Vegetation Groups
4% 7%
0%
15%
44%
11%
7%
5%7%
Mixed ConiferPonderosa PineAspenPine OakJuniperShrublandGrasslandRiparianOther
Figure 1. Existing vegetation groups based for the Signal Peak Assessment Area.
Table 1. This table displays the existing vegetation group and area (acres) within the Signal Peak assessment area. The area in acres is rounded to the nearest one hundred. The category of “Other” includes non-wildland, such as urban, agriculture, and barren, and wildland vegetation types with very sparse vegetation, such as desert succulents.
Signal Peak Landscape Assessment, Version 1.0 9/4/2006
7
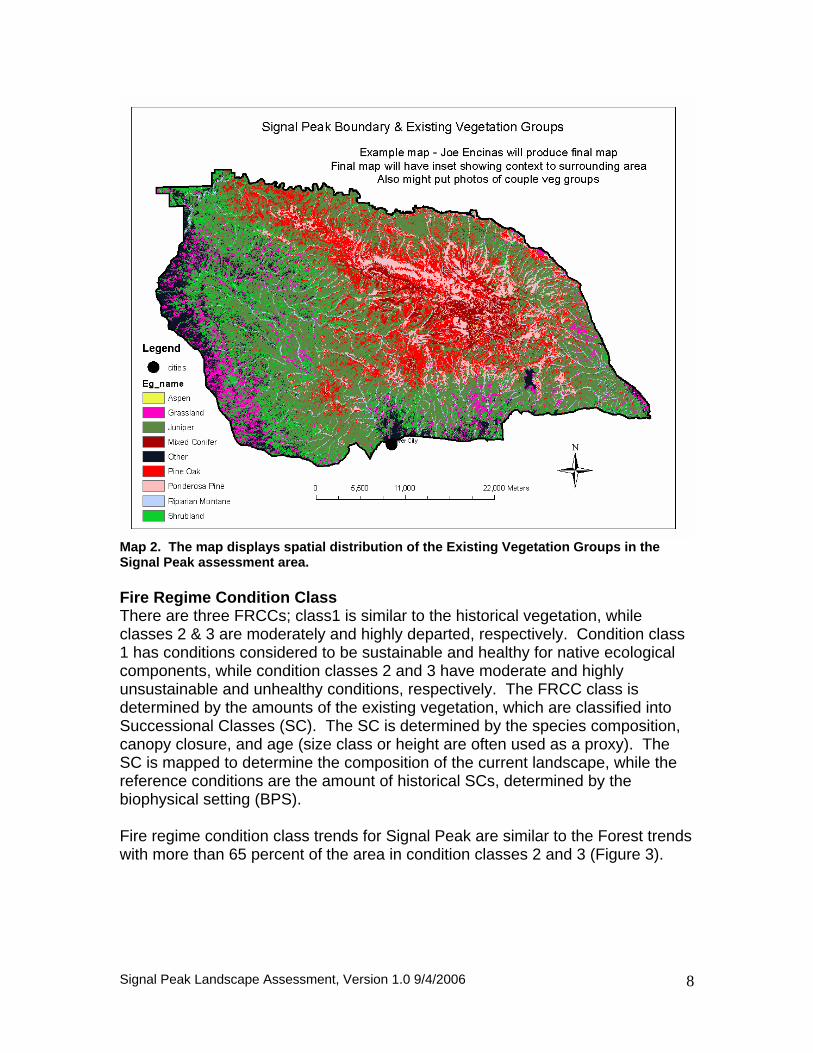
Map 2. The map displays spatial distribution of the Existing Vegetation Groups in the Signal Peak assessment area. Fire Regime Condition Class There are three FRCCs; class1 is similar to the historical vegetation, while classes 2 & 3 are moderately and highly departed, respectively. Condition class 1 has conditions considered to be sustainable and healthy for native ecological components, while condition classes 2 and 3 have moderate and highly unsustainable and unhealthy conditions, respectively. The FRCC class is determined by the amounts of the existing vegetation, which are classified into Successional Classes (SC). The SC is determined by the species composition, canopy closure, and age (size class or height are often used as a proxy). The SC is mapped to determine the composition of the current landscape, while the reference conditions are the amount of historical SCs, determined by the biophysical setting (BPS). Fire regime condition class trends for Signal Peak are similar to the Forest trends with more than 65 percent of the area in condition classes 2 and 3 (Figure 3).
Signal Peak Landscape Assessment, Version 1.0 9/4/2006
8

Fire Regime Condition Class Signal Peak Assessment Area
33%
36%
31% CC 1CC 2CC 3
Figure 3. Fire Regime Condition Class for combined vegetation types in the Signal Peak assessment area.
This trend is particularly troublesome because several vegetation types have very high amounts of condition class 3 (Figure 4). Vegetation types that are highly departed such as the mixed conifer, aspen, ponderosa pine and shrubland types are at a high risk of loss of key ecological components and are becoming increasingly difficult to restore. Mixed conifer and aspen are nearly 100 percent in condition class 3, ponderosa pine and shrublands have a slightly better distribution with less than 60 percent in condition class 3 and most of the remaining amount in condition class 1. Juniper and pine oak vegetation types have distributions more than 60 percent in FRCC 2 and the remaining amounts in FRCC 1 and 3. Grasslands and riparian vegetation types have a favorable distribution with nearly half in condition class1 and fairly equal distribution in condition classes 2 and 3. Spatially, the locations of FRCC 2 and 3 are obviously highly correlated with existing vegetation group (Map 3). The predominant reason for condition class 2 or 3 relates to closing canopies of shrubs, juniper, oaks, ponderosa pine, and Douglas-fir, and subsequent loss of open woodland or forest with interspersed patches of grass, shrub-grass, and aspen (Table 2). In addition fire-tolerant species of conifers, oaks, aspen, shrubs, and herbs have become much less dominant, and have been replaced by fire-intolerant and shade-tolerant species. A less obvious loss of ecological components relates to the loss of habitats for wildlife species adapted to the historical vegetation composition and structure.
Signal Peak Landscape Assessment, Version 1.0 9/4/2006
9

Fire Regime Condition Class (CC) Existing Vegetation Groups
0%20%40%60%80%
100%120%
Mixed C
onife
r
Aspen
Ponde
rosa P
ine
Shrubla
nd
Pine O
ak
Junip
er
Grasslan
d
Riparian
CC 1CC 2CC3
Figure 4 Fire Regime Condition Class for existing vegetation groups.
Map 3. This map displays the spatial distribution of Fire Regime Condition Class 1, 2, and 3.
Signal Peak Landscape Assessment, Version 1.0 9/4/2006
10

Table 2. This table displays the dominant Fire Regime Condition Class (CC) by existing vegetation group and the primary reason for those with CC 2 or 3.
Hazardous Fire Behavior Hazardous fire behavior is defined to include threats of fire to WUI, firefighter safety, Mexican Spotted Owl habitat, large wildfire development, potential for transition of Wildland Fire Use (WFU) to wildfire, and potential for Prescribed Fire (PF) escape. The Fire Behavior Assessment Tool (FBAT) was used to spatially simulate Flame Length (FL), Crown Fire Activity (CFA), and Rate of Spread (ROS) for the current landscape conditions. The Anderson Fire Behavior Fuel Model (FBFM) was used to assess duration of burn. Assumptions for the current condition simulation were 20 mile per hour winds and average 98th percentile fuel moistures for June at the Gila Center weather station. Hazardous fire behavior was evaluated using output from FBAT. The first indicator evaluated was ROS, however this was not highly useful for assessing the Signal Peak hazardous fire behavior threats because it was relatively high for all fuel types. Values for FL and CFA along with duration of burn were useful in assessing hazardous fire behavior. FL Class 1 (flame lengths less than 4 feet) was considered desirable, since these are conditions where hand crews can control a fire with hand line construction and there is low potential of surface fire spotting or transition to crown fire. FL Class 2 (flame lengths 4 feet to 11 feet) and Class 3 (flame lengths greater than 11 feet) were considered undesirable as dozers and air attack would be required for control, and spotting potential of surface or crown fire is moderate and high, respectively. Much of the current Signal Peak landscape is dominated by FL Class 2 and 3 (Figure 5). The spatial pattern of this hazard is scattered in large clumps across the west, south, east, and central portions of SP, rather than clumped all in one portion of SP (Map 4). In general the north central area south of Lake Roberts, and surrounding, within, and south of the area where the 2006 Skates WFU burned, is dominated by mostly FL Class 1, both before and after the fire. Tree canopy fuels are present and have a potential for crown fire with long range spotting when the tree layer has a canopy base height less than 12 to 15 feet.
Signal Peak Landscape Assessment, Version 1.0 9/4/2006
11

All FBFMs can have tree canopies and the potential for crown fire and long range spotting. Even when there are no tree canopy fuels there is still substantial potential for spotting from fires with FL of Class 2 or 3. The spatial distribution of the Flame Length predictions indicate a high hazard scattered throughout the eastern portion with a concentration through the central portion and dominant high hazard on the western portion (Map 4). However, this is driven by a fuel hazard and not a risk of hazardous fire behavior. The fuel models driving the fire hazard are fuel models 1, 2, 5, and 6. Fire behavior characteristics of these fuel models are displayed in Table 3. Two factors substantially reduce the hazard and risk related to the western portion of Signal Peak. The first is the effect of drought and grazing in reducing the grass component of these fuel models. This effect can be modeled by adjusting these fuel models to a less active fuel model such as fuel model 8 (Map 5). This adjustment results in most of the western area shifting to a flame length class 1. The second factor is the risk or probability of an actual fire occurrence. The fire occurrence data from Forest Service and BLM for this area indicates a very spatially distinct pattern of wildland fire starts for the area (Map 6). The Hell’s Half Acre unit to the west has very few fire starts for the 35 year period of data, while the area down the center has high to very high fire starts. The other hazard factor is crown fire activity. Crown fires make wildland fire management much more difficult and can produce long-range spotting. Crown fire potential is scattered over much of Signal Peak, but concentrated in the north central portion (Map 7). CFA Class 1 (surface fire) is considered desirable, while CFA Class 2 and 3 (torching, spotting, and running crown fire) are considered undesirable. CFA Classes 2 and 3 only occur currently on about 10 percent of the area, but unfortunately this potential is scattered across the whole area, such that torching, long range spotting, and crown fire can occur in a “leap frog” manner, which can result in rapid increase in uncontrolled fire perimeter size. Consequently, CFA Classes 2 and 3 are considered undesirable. The areas in Signal Peak with high concentration in the Trout Pk to Tadpole to Black Pk and Meadow Cr areas appear to have very high hazard of crown fire and long-range spotting. Areas where crown fire is not predicted (Map 7, 1-low class) may not have a high probability of crown fire, torching trees, or long-range spotting. However, if flame lengths are class 2 or 3 and they have woody fuels then short to mid-range spotting will occur (Map 5). Consequently, the combination of flame length class and crown fire activity provides a good estimate of hazard. When combined with fire occurrence the risk appears to be greatest in the north central portion of the area.
Signal Peak Landscape Assessment, Version 1.0 9/4/2006
12

Flame Length Class
44%
56%
12 & 3
Figure 5. Flame Length Class 1 (flame length that is greater than 4 feet), 2 & 3 (flame lengths greater than 4 feet).
Map 4. This map displays the spatial distribution of Flame Length Classes 1 through 3 without adjusting fuel models for effects of reduced grass because of drought and grazing.
Signal Peak Landscape Assessment, Version 1.0 9/4/2006
13

Table 3. Signal Peak Fire Behavior Fuel Model (FBFM) types with Fire Behavior (FB) and fireline intensity interpretations. Flame length (FL) and crown fire activity (CFA) at 20 mile per hour on 20 percent slopes and very dry fuel moistures FBFM FL at
20 MPHCFA Fire Behavior (FB) Interpretation with
Duration 4 110 Torching-Spotting-
Active Extreme FB with Moderate Duration
1, 2 30 Torching-Spotting Very High FB with Short Duration 10 26 Torching-Spotting-
Active High FB with Very Long Duration
5 26 Torching-Spotting High FB with Moderate Duration 6 20 Torching-Spotting Moderate FB with Moderate Duration 9 12 Torching-Spotting Low FB with Moderate Duration 8 4 Torching-Spotting Very Low FB with Moderate Duration
Map 5. This map displays the spatial distribution of Flame Length Classes 1 through 3 with adjustments of fuel models for effects of reduced grass because of drought and grazing.
Signal Peak Landscape Assessment, Version 1.0 9/4/2006
14

Map 6. This map displays the spatial distribution of Relative Fire Occurrence. Areas of very high fire occurrence had a record of 47-99 fire starts over the past 35 years, while areas of very low only had 0-4 starts.
Signal Peak Landscape Assessment, Version 1.0 9/4/2006
15

Map 7. This map displays the spatial distribution of predicted crown fire activity.
Signal Peak Landscape Assessment, Version 1.0 9/4/2006
16

Wildland Urban Interface (WUI) The Healthy Forest Restoration Act (2003) defines WUI as a 0.5 mile buffer adjacent to private land. Specific site conditions such as steep slopes, limited access allow for increasing the buffer up to one mile. Additionally, a Community Wildland Fire Protection Plan can define a WUI that exceeds the general buffer allowance when agreed to by federal agencies. Using the HFRA 0.5 mile buffer, about 12 percent or nearly 50,000 acres, of the Signal Peak area has been identified as WUI. Nearly half of the wildland urban interface has the potential for extremely hazardous fire behavior with surface flame lengths greater than 4 feet and crowning and short- and long-range spotting (Figure 6 and Map 8). Fire behavior in the remaining half will be high because of flame lengths exceeding 4 feet and potential for short-range spotting. The fuels and fire behavior alone represent a very difficult situation for fire suppression without the presence of urban interface difficulties. Extreme fire behavior is characteristic of the pine oak and mixed conifer vegetation types. Pine oak is the dominant vegetation type (35 percent) in the wildland urban interface and it can also be the most dangerous vegetation type for fire fighters. Mixed conifer is less common in the urban interface (4 percent) but its presence indicates areas of abundant fuels and high crowning and spotting potential. A very high hazardous fire risk rating occurs in ponderosa pine where there are high surface fuel loading and fuel ladders into the canopies. There are other factors in the Signal Peak wildland urban interface that in combination with hazardous fire behavior represents a serious fire management risk. These include limited access (narrow roads, many unpaved), steep and dissected slopes, and typically strong canyon winds and high summer temperatures.
Hazardous Fire Risk Rating in Wildland Urban Interface
ExtremeVery High
Figure 6. Extreme and very high risk rating for the Wildland Urban Interface (WUI).
Signal Peak Landscape Assessment, Version 1.0 9/4/2006
17

Map 8. This map displays the spatial distribution of Wildland Urban Interface (WUI) in relation to fire behavior hazard. Mexican Spotted Owl Breeding habitat for Mexican spotted owls (MSO) occurs in the upper elevations of the Signal Peak area. There are 12 identified nest areas (nearly 9,000 acres) or Protected Activity Centers (PACs) and approximately 25,000 acres of potentially suitable MSO habitat. Much of the upper elevation mixed conifer, ponderosa pine, and oak vegetation types are within designated critical habitat for this species. Signal Peak MSO PAC’s are considered potentially at risk from hazardous fire behavior (Figure 7 and Map 9). Vegetation in MSO PAC’s is predominately mixed conifer, ponderosa pine and pine oak with a contiguous tree canopy cover (greater than 45 percent) and minimal separation between surface fuels and tree crown bases (crown base heights less than 20 feet). These vegetation structural characteristics combined with flame lengths greater than 4 feet present a very high risk situation to nearly 70 percent of MSO nesting and habitat structures. Areas surrounding MSO PACs with similar high risk for hazardous fire behavior further increase the threat to MSO habitat with the potential large scale loss of existing habitat in a single large fire event. No buffers exist to slow the spread of a large wildfire between clusters of MSO PACs. The exception is the recent
Signal Peak Landscape Assessment, Version 1.0 9/4/2006
18

Skates fire (2006) which had the beneficial effect of reducing hazardous fire risk to portions of several MSO PACs. Replacement habitat for MSO’s is located in the Northwest portion of Signal Peak area. However, similar vegetation conditions and risk of hazardous fire behavior are present in the replacement habitat. Few fires have occurred in this portion of the assessment area in recent time to provide structural variability to the vegetation that could maintain and protect MSO replacement habitats.
Hazardous Fire Risk Ratings in Mexican Spotted Owl
Protect Activity Centers
ModerateExtreme
Figure 7. Hazardous fire risk rating for Mexican Spotted Owl habitat.
Signal Peak Landscape Assessment, Version 1.0 9/4/2006
19

Map 9. This map displays the spatial distribution of Mexican Spotted Owl PAC habitat in relation to fire behavior hazard.
Signal Peak Landscape Assessment, Version 1.0 9/4/2006
20

RESTORATION STRATEGIES This landscape assessment is not intended to be used as a decision making document. Restoration strategies are intended to support project planning and are appropriate to use for development of purpose and need statements. Proposed implementation of any restoration strategies presented in this assessment, either in whole or in part will need to be supported by environmental analyses in accordance with the National Environmental Policy Act and agency directives. Field validation of vegetation and fuel characteristics is needed prior to project design. Restoration strategies are designed to:
1. Improve FRCC and reduce hazardous fire behavior, or 2. Reduce hazardous fire behavior.
In the Signal Peak assessment area there is not a strategy that improves FRCC without reducing hazardous fire behavior because most changes to improve FRCC can be designed to have a direct beneficial effect on changing fuel model, increasing canopy base height, or reducing canopy cover. For example, FRCC is improved by modifying the distribution (percent of landscape) of SC. Changes to SC (for example canopy cover, age, and composition) sufficient to change condition class will typically improve FRCC and reduce hazardous fire behavior. However, many of the changes to reduce hazardous fire behavior are not designed to change SC, for example, raising canopy base height; thus not changing FRCC. As a result of this relationship the design of changes in condition should identify if the change benefits both FRCC and hazardous fire behavior reduction, or just hazardous fire behavior reduction. The restoration strategy is determined primarily by the stand FRCC. If the stand FRCC is a 2 or 3 then there is a common opportunity to both improve FRCC and reduce fire behavior hazard by implementing strategy 1. In contrast, if the stand FRCC is a 1, but fire behavior hazard can be reduced by changing surface fire behavior, increasing canopy base height, or reducing canopy cover, then implement strategy 2. When the restoration strategies are being selected and then the changes to improve FRCC or reduce fire behavior hazard are being designed there are four variables to consider: 1) fire behavior fuel model (FBFM); 2) canopy base height (CBH); 3) tree canopy cover (CC); and 4 succession class (SC) for the biophysical setting (BPS). The combinations of the four variables are sorted first by FBFM, second by presence of tree canopy fuels, and third by FRCC and the associated SC and BPS. From this sort it can then be identified if a change in SC can be accomplished or if only changes in canopy characteristics or fuel model are options. The changes are then designed to assure that changes in FBFM, CBH, and CC are logical relative to changes in SC. Changes to the SC need to be designed based on the description in the BPS model. If changes are not made with this context the FRCC model input will be incorrect.
Signal Peak Landscape Assessment, Version 1.0 9/4/2006
21

Fire Behavior Fuel Model The FBFM determines the surface fire behavior potential for flame length and spotting. FBFM types with Class 2 and 3 FL will be difficult to control and have spotting potential. Management that changes surface FBFM include treatments (typically wildland fire use, prescribed fire or thinning and prescribed fire ) to reduce small and large woody ground fuels and litter, reduce density of trees less than 15 feet in height, increase soil moisture availability for live herbaceous, and increase the live and dead fuel moistures. In general trees less than 15 feet in height are considered part of the surface FBFM and not part of the canopy. The FBFM in the Signal Peak area with interpretations of fire behavior are provided in Table 4. The rationale for changes in FBFM that can occur through typical management treatments of WFU, PF, or PF and Thinning are also provided. Table 4. Strategy for changes in fire behavior fuel model to reduce fire behavior hazard. Current FBFM
Modified FBFM
Rationale
4 5, 6 Shift extreme FB dead and live shrub fuels to lower FB fuels, lower fuel loading, or less flammable shrub species
1,2 9, 8 Shift very high FB grass with woody fuels to lower FB with woody fuel reduction or increase in live and dead fuel moisture or less flammable grass species.
10 9,8 Shift High FB because of high loading of small and large woody down fuels and small trees to lower FB by decreasing small and large woody down fuels and small trees
5 6, 9 Shift High FB because of high loading of shrub, small down wood, and litter to lower FB by live and dead woody fuel reduction
6 9, 8 Shift Moderate FB because of high shrub and small tree canopy loading to lower FB by shrub and small tree canopy reduction
9 8 Shift Low FB because of dead down wood, understory fuels, and litter to very low FB fuel through reduction
8 Lowest FB FBFM13 – no change Canopy Base Height If tree canopy fuels are present the potential for transition of a surface fire to a torching, spotting, and crown fire can be reduced through management to increase the CBH. This can be accomplished through wildland fire use, prescribed fire, or combined prescribed fire and thinning to reduce lower limbs as well as density of trees that are greater than 15 feet in height. Trees less than 15
Signal Peak Landscape Assessment, Version 1.0 9/4/2006
22

feet in height are considered part of the surface FBFM and not part of CBH. The density reduction of trees greater than 15 feet in height will also increase soil moisture availability for live herbaceous and shrub and may increase the dead fuel moistures. Density reduction of trees greater than 15 feet in height reduces the tree CC. Increasing CBH to 2 to 3 times the FL will typically reduce the chance of surface fire transition to crown fire behavior. Where tree canopy fuels occur the CBH can be increased to be approximately 2 or 3 times the expected FL in order to avoid transition from surface fire to torching, spotting, and crown fire. Canopy Cover Tree CC often has a direct relationship to the definition of the SC. In designing the restoration there are two considerations. If FRCC is being improved through a change in SC then the CC change must be done in concert with the SC definition. The second is that If CBH is being increased substantially this will require a reduction in tree density greater than 15 feet in height, which will require a reduction in canopy cover. Succession Class Succession class composition and structure definition, and reference conditions, are determined by the BPS. Opportunities for changing SC in a way that improves FRCC usually occur where a reduction in canopy closure, change in species composition, or change in age structure can be implemented. In many cases SC cannot be improved through restoration because of the need to shift age structure to an older age. For example, shifting from mid-seral to late-seral cannot occur except over time. However, throughout much of Signal Peak just the opposite is the case and improvement of FRCC requires development of SCs that have more open canopies or younger ages or more fire-adapted species or a combination of all three. Signal Peak Restoration Strategy Composition There were 30 different types of potential restoration changes conducted across approximately 100,000 acres or about 30% of the area (Figure 8 and Map 10). About 17% of the area could be restored with restoration that both reduced fire behavior hazard and improved FRCC, while about 13% of the area could be restored to only reduce fire behavior hazard.
Signal Peak Landscape Assessment, Version 1.0 9/4/2006
23

Recommended Strategies
13%
17%
70%
Fire BehaviorHazard
Fire BehaviorHazard andCondition Class No Change
Figure 8. Composition of the restoration changes to reduce fire behavior hazard only, or to reduce both fire behavior and improve fire regime condition class.
Map 10. Potential restoration treatments that either improve fire regime condition class and reduce Fire Behavior Hazard, or reduce only fire behavior hazard.
Signal Peak Landscape Assessment, Version 1.0 9/4/2006
24

Comparison of Pre and Post-Restoration Outcomes Over the whole Signal Peak assessment area there was about a 20% reduction in the fire behavior hazard class based on flame length (Figure 9 and Map 11). However, this reduction was concentrated in the central portion of the assessment area (Map 11). If reductions in spotting and crown fire potential are included the overall fire behavior hazard is reduced across 30% of the area. Considerably more could be done to reduce fire behavior hazard across the total area, but this amount was deemed to be adequate to address the objectives for the landscape assessment. There was also a substantial improvement in FRCC with a decrease of condition class 3 by about 15%, with an increase in 2 of about 3%, and an increase in 1 of about 12% for a total improvement of about 15% (Figure 10 and Map 12). This amount represents the amount of restoration focused on both improving FRCC and reducing fire behavior hazard (Figure 8 and Map 11). More could be done to improve FRCC independent from reducing fire hazard, particularly in the juniper and shrubland types. However, the amount for this restoration strategy appeared adequate to achieve the assessment objectives.
Fire Behavior Hazard Potential Landscape Changes
0
10
20
30
40
50
60
70
Pre-Restoration Post-Restoration
% o
f Lan
d A
rea
1-Low-Moderate Hazard2-High-Extreme Hazard
Figure 9. Comparison of changes in flame length class from pre-restoration to post-restoration.
Signal Peak Landscape Assessment, Version 1.0 9/4/2006
25

Map 11. Post-restoration flame length class. This map can be compared to Map 4, which is the pre-restoration flame length class.
Fire Regime Condition Class Potential Landscape Changes
0%
10%
20%
30%
40%
50%
1 2 3
FRCC PreFRCC Post
Figure 10. Comparison of changes in fire regime condition class predictions from pre-restoration to post-restoration.
Signal Peak Landscape Assessment, Version 1.0 9/4/2006
26

Map 12. Post-restoration fire regime condition class. This map can be compared to Map 3, which is the pre-restoration fire regime condition class. LANDSCAPE PRIORITIES Landscape priorities for reduction of risk and hazard were evaluated using the Multi-scale Resource Prioritization Tool. This GIS tool calculates composition of an input value and compares management reporting units. Management units used included WUI and Owl PACs. In the WUI areas Flame Length Class 2 and 3, and Fire Regime Condition Class 2 and 3, were inputs with Flame Length Class weighted with twice the importance of Condition Class. For OwlPACs, the Flame Length Class 2 and 3, and Fire Regime Condition Class 2 and 3, were weighted equally. The priorities indicate a need for focus on WUI and Owl PACs through the central portion of the assessment area (Table 5 and 6, Map 13 and 14). An optimal strategy would be to focus aggressive restoration on most of the area within the wildland buffers around these areas, and then add an additional zone of restoration adjacent but outside the buffers, where opportunity permits, to reduce fire hazard and improve conditions. The potential restoration options displayed in Map 10 indicate substantial opportunity in this central portion of the area.
Signal Peak Landscape Assessment, Version 1.0 9/4/2006
27

Table 5. Relative priority rating for the Wildland Urban Interface areas of Signal Peak. Priority based on composition of Flame Length Class 2 and 3 (greater than 4 feet) and Fire Regime Condition Class 2 and 3, with twice the importance given to the Flame Length Class inputs.
Map 13. Priority ratings for the Wildland Urban Interface areas of Signal Peak. Priority based on composition of Flame Length Class 2 and 3 (greater than 4 feet) and Fire Regime Condition Class 2 and 3, with twice the importance given to the Flame Length Class inputs.
Signal Peak Landscape Assessment, Version 1.0 9/4/2006
28

Table 6. Relative priority rating for the Mexican Spotted Owl PAC areas of Signal Peak. Priority based on composition of Flame Length Class 2 and 3 (greater than 4 feet) and Fire Regime Condition Class 2 and 3, with equal importance given to both inputs.
Map 14. Priority ratings for the Mexican Spotted Owl PAC areas of Signal Peak. Priority based on composition of Flame Length Class 2 and 3 (greater than 4 feet) and Fire Regime Condition Class 2 and 3, with equal importance given to both inputs.
Signal Peak Landscape Assessment, Version 1.0 9/4/2006
29

CITATIONS United States Forest Service. 1978. Gila National Forest Prescribed Natural Fire Report. On file at Gila National Forest, Supervisor Office, Silver City, NM. United States Forest Service. 2003. Strategic action plan for restoring the functionality of fire-adapted ecosystems. Southwestern Region, Albuquerque, NM. United States Forest Service 2006. Restoring the functionality of fire adapted ecosystems, Gila National Forest. 3005 East Camino del Bosque, Silver City, NM 88061. United States Forest Service 2000. Protecting people and sustaining ecosystems in fire-adapted ecosystems, a cohesive strategy. The Forest Service management response to the general accounting office report GAO/RCED-99-65 October 13, 2000.
Signal Peak Landscape Assessment, Version 1.0 9/4/2006
30

SIGNAL PEAK LANDSCAPE ASSESSMENT Team Members Cecilia McNicoll Team Leader
Gila NF, Retired
Bruce Anderson Wildlife Biologist Gila NF, Silver city District
Gabe Partido Timber Staff Gila NF Gordon West Gila Woodnet Silver City, NM Joe Encinas Geospatial Analyst Gila NF Keith Mathies Fire Prevention
Technician Gila NF, Silver city District
Martha Schuman The Nature Conservancy Silver City, NM Ryan Whiteaker Fuels Specialist Las Cruces BLM Todd Schulke Center for Biological
Diversity Silver City, NM
Signal Peak Landscape Assessment, Version 1.0 9/4/2006
31

DATA SOURCES Base terrain, vegetation, and fuel data from LANDFIRE (www.landfire.gov) FBAT, FRCC Map Tool, Multi-scale Resource Integration Tool from NIFTT Base geographic data from Southwest Region and Gila NF Fire occurrence data from WIMS and Fire Family Plus Data source contacts: Joe Encinas, Gila NF GIS Lead Wendel Hann, NIFTT Marc Levesque, NIFTT
Signal Peak Landscape Assessment, Version 1.0 9/4/2006
32