signal capacity modeling for shared radio system planning
TRANSCRIPT
Signal Capacity Modeling for Shared Radio System Planning
Gary Patrick, NTIA/OSM, 202-482-9132, [email protected]
Charles Hoffman, NTIA/OSM, 202-482-3456, [email protected]
Robert M atheson, NTIA/ITS, 393-497-3293, [email protected]
Abstract. Almost every major Federal agency operates an independent mobile radio system in the
162-174 MHz band to provide critical radio communications with its own agents. Last year, NTIA
began a joint OSM/ITS Spectrum Efficiency Initiative, which includes a study of whether a shared
radio system (e.g., a trunked system) could functionally and advantageously replace most of the
specialized single-agency radio systems. The first phase of this work is to understand the amount of
service provided by the current single-agency radio systems. A “signal capacity model” was
developed, which uses Federal Government Master File (GMF) license data to calculate the number
of independent radio signals that could be received by a mobile user at 1-mile increments within a
100-mile radius of Washington, D.C. Since various radio network architectures transmit the same
signal from multiple sites, different algorithms were used to calculate the signal capacity for different
types of mobile networks. Peak and average signal capacity maps were produced, based on different
assumptions about the probable location of users. This data will form the basis for the design of
possible alternatives for future shared radio systems.
1. NTIA's Role in System Planning
The National Telecommunications and Information
Administration (NTIA) is the Executive Branch agency
responsible for developing and articulating domestic and
international telecommunications policy. NTIA's
responsibilities include establishing polices concerning
Federal spectrum assignments, allocation in use, and
providing various Federal departments and agencies with
guidance to ensure that their conduct of telecom-
munications activities is consistent with these polices.
One of these policies is to ensure that Federal use of the
spectrum is as efficient as possible.
There are many well-known ways to improve the
efficiency of mobile radio systems used by Federal
agencies [1]. These methods include decreasing
bandwidth, increasing geographical frequency reuse,
increasing the amount of time that a given frequency is in
use (Erlang efficiency), using higher gain directive
antennas, and more. The Federal government has
expended considerable effort in the past on ensuring that
their use of the spectrum is as technically efficient as
practicable by adopting many of these spectrum efficient
technologies including: narrow-banding, sharing,
overlaying, relocating, and applying new spectrum
distribution analytical and planning techniques. However,
although these methods are well known and their adoption
has been strongly encouraged, they often have not been
widely applied, because they sometimes also have
substantial disadvantages. Sometimes the disadvantage is
merely a matter of higher cost (including the requirement
to buy new equipment to replace older, less-efficient
systems). Sometimes the disadvantages actually entail a
decrease in performance or convenience – in addition to
high cost.
Therefore, a more realistic objective regarding new
mobile radio technologies has been lumped together under
the title of “effectiveness.” Effectiveness includes a wider
range of factors than merely being spectrum efficient;
effectiveness also includes usability and cost factors.
Usability factors might include larger or heavier
equipment with shorter battery life, poorer intelligibility,
shorter operational range, more latency (delay time)
between a push-to-talk command and the distant user
hearing the message, less interoperability with other users,
more complexity of operation, lack of needed special
features like encryption and digital messages, etc. A new
technology with improved spectrum efficiency – by itself
– has little merit for the Federal user, if the adoption of
the new technology would result in a decrease of
effectiveness. A decrease in effectiveness would mean
that substantial cost or usability factors outweigh the
improved spectrum efficiency.
By its very definition, spectrum effectiveness means
“comparing apples and oranges.” How much should a
25% improvement in spectrum efficiency weigh against
a 60% increase in cost or a 10% decrease in intelligibility?
It is likely that the effectiveness of a proposed change
would be evaluated differently by different users, for
whom the relative benefits of various factors are evaluated
differently. Therefore, we will not be able to derive a
single formula that will serve to calculate the relative
effectiveness of a proposed change as seen by all Federal
Proceedings of the International Symposium on Advanced Radio Technologies, NTIA Special Publication SP-04-409, March 2004
77

users. For example, urban users competing for unused
channels in a crowded urban environment will probably
count spectrum efficiency as more valuable, compared to
rural users, where unused spectrum is relatively more
plentiful but where too many locations do not have
adequate coverage from widely-spaced base stations.
Nevertheless, “effectiveness” is an important concept
(even if it can't be calculated precisely), because it forces
planners to evaluate proposed changes against a much
broader and more complete set of criteria. Proposed
changes that benefit some users – but which place other
users at a disadvantage – are less likely to be pushed
through on the basis of a single factor. Effectiveness-
based changes are more likely to benefit a wider range of
users and, therefore, such changes may actually be
adopted and implemented by a larger number of users.
A study of effectiveness has led us to consider broader
questions on how the Federal government is using the
radio spectrum and to consider whether larger-scale
structural and organizational changes – such as shared
radio systems – could improve both the technical
efficiency and mission effectiveness of Federal radio
systems. Implementing a shared Federal radio system
would be a much more challenging project than merely
causing Federal users to switch to a more spectrum
efficient radio technology (and it might not be worth the
trouble, based only on spectrum efficiency gains).
However, a large number of related factors are part of the
"effectiveness" equation, including large required
expenditures to independently solve problems of
interoperability between public safety agencies (e.g.
SAFECOM ), Homeland Security (e.g., HSD and IWN),
spectrum efficiency (e.g., the narrowbanding deadlines),
improved radio capabilities (e.g., data, encryption,
emergency capacity, greatly expanded wireless Internet
systems, etc.), and very powerful economy-of-scale and
complexity arguments.
In an effort to better understand how Federal agencies are
using the spectrum and how we can improve the
effectiveness of this use, NTIA has embarked on a
multi-phased study of spectrum efficiency and
effectiveness within the Federal government land mobile
bands. The first phase of the study (described in this
paper) will analyze the present Federal use of the radio
spectrum in the 162-174 MHz band within a 100-mile
radius of Washington, DC by developing a quantitative
model of the “signal capacity” of current Federal use of
the radio spectrum. The second phase will be based on
the quantitative model results developed in the first phase
and will explore various modern radio system alternatives
to current Federal systems such as shared trunked
systems. Depend ing on the apparent overall benefits
identified by the results of this phase, one or more
concepts may be selected for further studies, detailed
engineering, and/or eventual large-scale or small-scale
implementation.
The 162-174 MHz band in the Washington, DC area was
selected for this study for the following reasons. The
162-174 MHz band is the most intensely used Federal
mobile radio band, and the Washington, DC area is one of
the most congested geographical areas for Federal users.
Therefore, this selection of frequency band and location
should provide the best of opportunities for studying
Federal system operations in highly congested areas.
Selection of a congested area such as Washington, D.C.
provides an opportunity in terms of: 1) investigating
spectrum efficiency, 2) maximum opportunity for
economic savings, 3) utility for advanced technology
solutions, and 4) a maximum familiarity with the territory
on the part of Federal spectrum management personnel.
The initial decision to include only the 162-174 MHz
band in this study was intended to help obtain initial
results more rapidly.
When considering the possible advantages of replacing
many current smaller individual-agency radio systems
with a larger shared radio system, it is necessary to have
realistic information on the services provided by the
current systems. This information is needed for various
reasons, with the main reason being that it serves as a
starting point for the design of the new system. It is the
intention that any proposed new system design could
include many additional factors (e.g., projected growth,
etc.), but as a minimum it must match levels of service
provided by current systems. Unless previous levels of
service are known, there is no way to know whether any
replacement system would provide equivalent service.
In addition, many advanced radio systems provide relative
advantages or disadvantages that depend substantially on
certain economy-of-scale factors. It is often true that the
bigger the system, the more efficiently it operates. This
is especially true for trunked radio systems, but such
results also affect many aspects of calculating peak
loading factors, etc. To compare new designed systems
with current systems, it is necessary to actually have
numeric values for some basic parameters, such as how
many channels are required for current systems. Since
these systems cannot be realistically designed or
compared without this data, the first phase of this study
must obtain quantitative information on current system
operations.
Proceedings of the International Symposium on Advanced Radio Technologies, NTIA Special Publication SP-04-409, March 2004
78

Figure 1 - Federal radios in 162-174 MHz band within
160 km of Washington, D.C.
2. Possible Sources of Current Usage Data
There are various techniques for obtaining the information
needed to estimate the level of services for current
systems. For example, a detailed survey could be
submitted to Federal users to obtain their estimates of
current and projected levels of service from their radio
networks. However, a survey of this type would be quite
difficult and time consuming for many of the agencies
since agencies may have to survey each independent
bureau and coordinate the results. Furthermore, the
individual agencies probably would each have to develop
suitable models to describe their own current levels of
service, and NTIA would need to convert the results of
these models to a common overall model.
Another method would be using the NTIA/ITS Radio
Spectrum Measurement System (RSMS) to conduct
measurements within the Washington, DC area,
measuring the actual amount of traffic on specific radio
channels for all frequencies in the band. However, the
major concern with the RSMS data would be the time
required to measure and analyze such data at many sites
over a wide geographical area. Such a concern would be
further complicated in measuring low power and
intermittent applications. Furthermore, such mea-
surements would probably not be able to collect accurate
information on multi-site systems using the same frequen-
cies, and the collected data would require much
interpretation by NTIA personnel. Some limited mea-
surements would be useful and may be considered in the
future to supplement data in some aspects of this study.
The Government Master File (GMF) is another possible
source of information. It contains records of the
frequencies assigned to all U.S. Federal Government
agencies in the U.S. Although the information contained
in the GMF information is somewhat limited, it provides
information on Federal radios over a wide geographic
range and it is easily accessible. A cursory look at
Federal licenses in the 162-174 MHz band showed 1945
specific assignments (licenses) within 100 miles of the
center of Washington, DC., as shown in Figure 1.
After considering various possible methods of obtaining
quantitative information on current Federal mobile radio
service levels, it was decided to estimate current levels of
service by analyzing the data that is already available in
the GMF, using extensive computer modeling to generate
maps showing a quantity called “signal capacity” (as
described below). When necessary, the existing GMF
data was augmented by consulting with agency
representatives to provide any required additional
operational data.
Several characteristics should be reflected in any model
that is used to characterize the amount of service that is
being provided to Federal users by current Federal mobile
radio systems in the 162-174 MHz band. The model
should calculate a quantity that is closely related to the
service delivered to Federal mobile radio users. Since
Federal radio systems use a wide range of radio
technologies, the model should be able to reduce these
services to a “lowest common denominator,” under which
all mobile services could be added together and
summarized. Ideally, the model should use only data that
is easily available, as provided within the GMF. The
model results should also be additive or otherwise allow
easy manipulations to include different agencies or other
user populations. The model should be transparent, in the
sense that a given user population can identify and verify
its own contribution to the total model results. The model
should allow easy determination of anticipated results
from prototype or imaginary alternative radio systems, to
facilitate comparisons between existing and alternative
systems. Finally, the model should require a minimum
number of assumptions that could drastically change the
model results.
3. The Signal Capacity Model
Based on the above considerations, we selected a “signal
capacity” model to estimate the amount of radio service
currently available to Federal users. The signal capacity
model assumes that most Federal radio users operate in a
Proceedings of the International Symposium on Advanced Radio Technologies, NTIA Special Publication SP-04-409, March 2004
79
mobile or portable environment and depend on a two-way
voice channel created by a Federal-owned base station.
Therefore, service can be quantified by merely counting
the number of independent voice channels that are
available at any given geographical location.
Signal capacity (SC) is defined as “the number of
independent 2-way voice radio channels that can be
received by a typical mobile radio user at a given
geographical location.”
The SC model considers only the geographical
distribution of the signal field strength from base station
transmitters that could be received by mobile users. Field
strength values higher than a selected threshold are
considered to provide “radio coverage.” The SC model
includes no information about base station receivers, or
any receivers whatever. However, any future radio system
designed to meet the signal capacity specifications
produced by the model would obviously also need to meet
suitable base station receiver functions (possibly including
receive-only sites) and (probably) be capable of
mobile-to-mobile operation.
This SC definition is particularly useful for our purposes
for several reasons:
1. The major service provided to Federal users in the
162-MHz band is two-way voice channels to mobile
users. Therefore, this definition captures most of the use
in the 162-MHz band.
2. The SC is additive. This means that the SC values
produced by individual transmitters can be simply added
to give a cumulative SC value for the group of
transmitters.
3. The SC can be calculated from data that is availab le in
GMF license records and technical models, including
transmitter data, terrain/ground cover data, and
propagation models.
However, the SC definition makes many simplifications
that might limit its usefulness in specific circumstances.
These include:
1. There is no data on whether a given channel is lightly
or heavily used. However, the actual existence of a radio
channel suggests that the system was needed, and that
need is presumed to exist when a future system is
designed.
2. All voice channels are considered identical, whether
analog or digital, narrowband or wideband, simplex or
duplex, high priority or low, etc. Equally important, signal
capacity considers only the radio link, with no distinction
as to what capabilities are available via that link: data,
encryption, database access, telephone access, wide area
access, etc. For SC purposes, “a channel is a channel is a
channel.”
In summary, although the SC model may not provide an
exact measure of the service that a radio produces, it
provides a useful measure of service that can be calculated
fairly easily. The SC is a useful model because radio
systems can be designed to match or exceed given SC
values with a reasonable assurance that a new
full-featured radio system (e.g., a trunked system) would
match or exceed most performance measures of the old
systems.
4. Signal Capacity Analysis Program
The signal capacity analysis program (SCAP) performs its
analysis in several stages. The first stage includes reading
a modified version of the GMF, which has been sorted to
include assignments (licenses) in the 162-174 MHz band
within a 100-mile radius of Washington, DC. Each
assignment record has been augmented with a function
code that tells SCAP how each assignment record is to be
analyzed. The function code includes a determination of
function and a network identification. SCAP uses the
function code to identify base station transmitters, which
are used with a terrain-based Longley-Rice propagation
program to compute predicted field strengths from that
transmitter. The field strength predictions are used to
predict a coverage area for each transmitter; all field
strengths higher than a certain threshold will be assumed
to provide coverage (service) for mobile users. Each
independent transmitter that provides coverage at a given
location adds to the SC value.
However, the definition of SC counts only independent
voice channels. It is necessary to determine that multiple
radio signals received at a given location are actually
independent, since some networks transmit identical
signals from multiple sites or prevent multiple sites from
transmitting simultaneously. SCAP uses the function and
network identification codes to identify transmitters that
might not be independent (for example, signals from the
same channel of multiple simulcast sites). A network is
defined as any related set of transmitters that are part of an
integrated system (or network) following a uniform set of
signal capacity rules. Because of the need to determine
independence, the transmitters belonging to each network
must be analyzed as a single unit. A minimal network
includes a single transmitter, but other networks could
Proceedings of the International Symposium on Advanced Radio Technologies, NTIA Special Publication SP-04-409, March 2004
80

Figure 2 - PSC map for single transmitter
include systems with many sites and many transmitters at
each site.
SCAP uses the basic coverage information to calculate a
pair of peak and average signal capacity maps for each
network, following the specific algorithms for each
function code. Specific algorithms have been developed
for various technologies, including simulcast, trunked,
various repeater networks, and more. The peak SC and
average SC maps for each network can be combined to
give similar paired peak and average SC maps for
multiple networks by simply adding the corresponding
elements representing peak or average signal capacity at
respective geographical locations. The peak and average
SC maps can continue to be added respectively to obtain
peak and average SC maps for various larger groups of
networks. Continuing the process of addition, coverage
maps for groups of networks for individual agencies can
become coverage maps for whole Federal departments,
and finally for the Federal Government as a whole.
The SC map values are calculated at 1-mile intervals for
all locations over a 200-mile square area. However, the
GMF database used for these calculations included only
GMF records for systems located within a 100-mile radius
circle, centered on W ashington, DC. Therefore, there can
be some substantial “edge” effects in this modeling. A
transmitter located just outside the 100-mi radius circle
would not be included in the model at all, even though it
could have a substantial portion of its coverage area inside
the area of the map. A transmitter just inside the circle
would be included in the model, but part of its coverage
area could lie outside the calculated area of the square
map. This reduction in the apparent size of its coverage
area could affect the numbers in the average signal
capacity maps.
5. Use of Peak and Average SC M aps
Although the signal capacity (SC) was defined initially at
a given location, it is convenient to summarize the SC at
many adjacent locations as a map, using shading to
identify areas that have certain ranges of SC values.
Figure 2 is an example of such a map from a single
transmitter, calculated for a 200-mi square.
This map shows geographical areas of coverage from a
single transmitter. Although this map follows the earlier
definition of signal capacity, it is called a “peak” signal
capacity (PSC) map to distinguish it from an “average”
signal capacity (ASC) map described later. The
light-shaded areas of the map indicate coverage from the
associated transmitter. Since only one transmitter is
present in this example, every point on the map will have
coverage from either 1 or 0 transmitters, giving SC values
of either 0 or 1 (no coverage, or coverage by one
transmitter). The peak (PSC) map can be understood as
showing the maximum number of independent users that
could be simultaneously served at any given location.
Note that this does not imply that only one individual user
can actually be served by the system at a given time. It
means that users are served by only one independent
signal; the “user” could be a talk group with a hundred
members that are receiving a common message. Or, it
could be an individual user.
An “average” signal capacity (ASC) map can also be
defined, which is different from the earlier definition for
signal capacity. The ASC map shows the number of
independent users per square mile that could be served at
one time if users were distributed evenly across the
coverage area of a transmitter. The ASC map for an
individual transmitter is determined by calculating the
PSC map, totaling the number of square miles of
coverage, and normalizing the PSC values by dividing by
the total coverage area. The ASC values are expressed in
terms of the number of independent users per square mile
to which the transmitter could provide service, assuming
that users are evenly spaced across all of the coverage
area. Integrating the ASC values across the entire
coverage area of one transmitter will always give a total
of “one user.” The ASC map of a single transmitter looks
identical to the PSC map for that transmitter, except that
the numeric value of coverage areas is different.
Specifically, Figure 2 showed radio coverage of about
6,500 square miles (out of a total of 40,000 sq mi
included in the map). Therefore, the ASC map shows that
this transmitter would provide coverage to about .00016
independent users per square mile, if the users were
evenly distributed over the whole 6,500 sq mi area of
Proceedings of the International Symposium on Advanced Radio Technologies, NTIA Special Publication SP-04-409, March 2004
81

coverage. (6500 mi sq x .00016 users/mi sq = 1 user.)
Note that a smaller transmitter coverage area provides
larger values on an ASC map.
The PSC map and the ASC map provide two different
ways of looking at the problem of providing comparable
service, based on different assumptions about how mobile
users are distributed geographically. The PSC map
assumes that all users might be concentrated at the same
geographical location. The ASC map assumes that users
are evenly distributed across the coverage areas of their
respective base station transmitters. In analyzing the
signal capacity that is provided by an existing transmitter,
one does not know whether that transmitter was intended
to serve users who are statistically evenly distributed
across the coverage area or users that are sometimes
located in one small portion of the coverage area.
Lacking this specific insight for each transmitter, the
analysis covered the extreme cases by calculating both the
PSC and ASC maps. In many ways, the PSC and ASC
maps represent the worst and best cases of user
geographical distributions, respectively. Real-world user
distributions presumably must lie somewhere between
these two extremes, but it is not necessarily clear exactly
where. Nevertheless, the peak and average SC maps place
bounds on the effects of user location.
If transmitters with one coverage area are replaced with
future transmitters having a different coverage area, the
assumptions about whether replacement transmitter
requirements scale proportionally to coverage area or
whether they do not become very important, since these
two different assumptions give much different results.
ASC values scale proportional to coverage area; designing
a new system with microcells having 10% of the coverage
area of standard cells would imply designing the
microcells to handle 10% of the traffic. PSC values do
not scale with coverage area. If PSC rules hold in the real
world, a 10%-sized microcell would still need to handle
all of the traffic of the standard cell, since it is possible
that all of the users from the standard cell might sometime
be crowded into that single micro-cell. Therefore, the
availability of both sets of maps is important as a more
complete basis for designing a range of possible
alternative radio systems to match the current capabilities
of Federal users in the 162-174 M Hz band.
6. How Function and Network Codes Define SC
Algorithms
The lowest level of a radio system that can be analyzed to
produce peak or average SC maps is not a single
transmitter but is instead a “network.” A network is a
group of transmitters (one or more) designed to
cooperatively produce a specific type of service over a
given area. The concept of network must be used to
compute SC, because SC is defined only for independent
signals. However, sometimes signals received from
different transmitters are not independent. For example,
signals received at the same frequency from different
simulcast sites cannot contain different information. The
network (as defined here) is the smallest set of
transmitters that must be included in the SC calculations
to obtain a correct value. Once the ASC and PSC maps
for a network have been properly calculated, these values
are independent quantities and SC maps from one
network can be freely combined with other SC maps.
The Signal Capacity Analysis Program (SCAP) uses the
GMF license database as a source of technical
information. A function code (F, N) is added to each
GMF assignment record. The parameter F shows SCAP
what type of technology the network uses. Different
algorithms are employed for independent base stations,
repeaters and multi-site repeater systems, simulcast
systems, trunked base stations and multi-site systems. N
shows which other transmitters to include in this analysis
(all transmitters with the same N belong to the same
network).
At present, the function codes are determined by NTIA
staff, following a study of the GMF records and (usually)
consultation with frequency management staff at the
respective Federal agencies. These consultations provided
very useful insights into how specific systems were used.
In some cases, systems were identified that provided
services that could not reasonably be supplied by a shared
Federal system.
As an example of the SCAP analysis of a basic network,
showing how different types of networks give different
peak and average SC map results, consider a network that
consists of a group of four base stations, each station
having one channel. The individual coverage areas of
these four base stations are shown as Figure 3. These four
transmitters will be analyzed as a simulcast network
(Figure 4) and as a network of single-channel trunked
radio stations (Figures 5 and 6).
The PSC map for the simulcast system is shown in Figure
4. This map is calculated by first calculating the coverage
areas of each base station and placing a “1” at each
location where coverage is available. In locations where
coverage is available from multiple base stations, the peak
signal capacity for the simulcast system is still “1,” since
all base stations transmit an identical message, so only 1
independent message can be received at any location.
Proceedings of the International Symposium on Advanced Radio Technologies, NTIA Special Publication SP-04-409, March 2004
82

Figure 3 - Coverage areas of four transmitters
Figure 5 - PSC map for 4 trunked radio sites
Figure 4 - PSC (and ASC) map for 4 simulcast sites
The average signal capacity is determined by dividing the
peak signal capacity at a specific location by the area over
which each transmitter provides coverage. In this case,
the entire 4-site coverage area acts like the coverage area
of a single transmitter that covers a very large area.
Therefore, the simulcast ASC map looks identical to the
simulcast PSC map, except for a scaling factor that shows
a single relatively low average number of independent
users per square mile that can be served by the simulcast
system.
The PSC map for a 4-site trunked radio system using
independent frequencies to provide coverage around each
site (Figure 5) shows that each site could provide
independent service to a user (serving as many as 4
independent users at some locations). PSC values add
together in areas where coverage is available from
multiple sites.
The ASC values for the 4-site trunked network are
calculated by finding the ASC values for each base station
on an individual basis, and adding the ASC values at
points where coverage is available from multiple stations
(Figure 6). In this case, the transmitters operate
independently, so the coverage area is the respective area
for each separate transmitter. Since each transmitter can
serve a different population of independent users, the
ASC values add together where coverage is available
from multiple transmitters.
Although not visible in these maps, the trunked ASC and
PSC maps differ by more than a simple scaling factor,
since the coverage areas of the 4 sites are different and the
corresponding ASC numeric values for each site are
therefore somewhat different.
The maps are quite different for the 4-site simulcast
network and the 4-site trunked network. The peak SC per
simulcast channel would be one independent user per
channel over the entire 4-site coverage area. The peak SC
per trunked channel would be one independent user per
channel, but there would be many locations that might
Proceedings of the International Symposium on Advanced Radio Technologies, NTIA Special Publication SP-04-409, March 2004
83
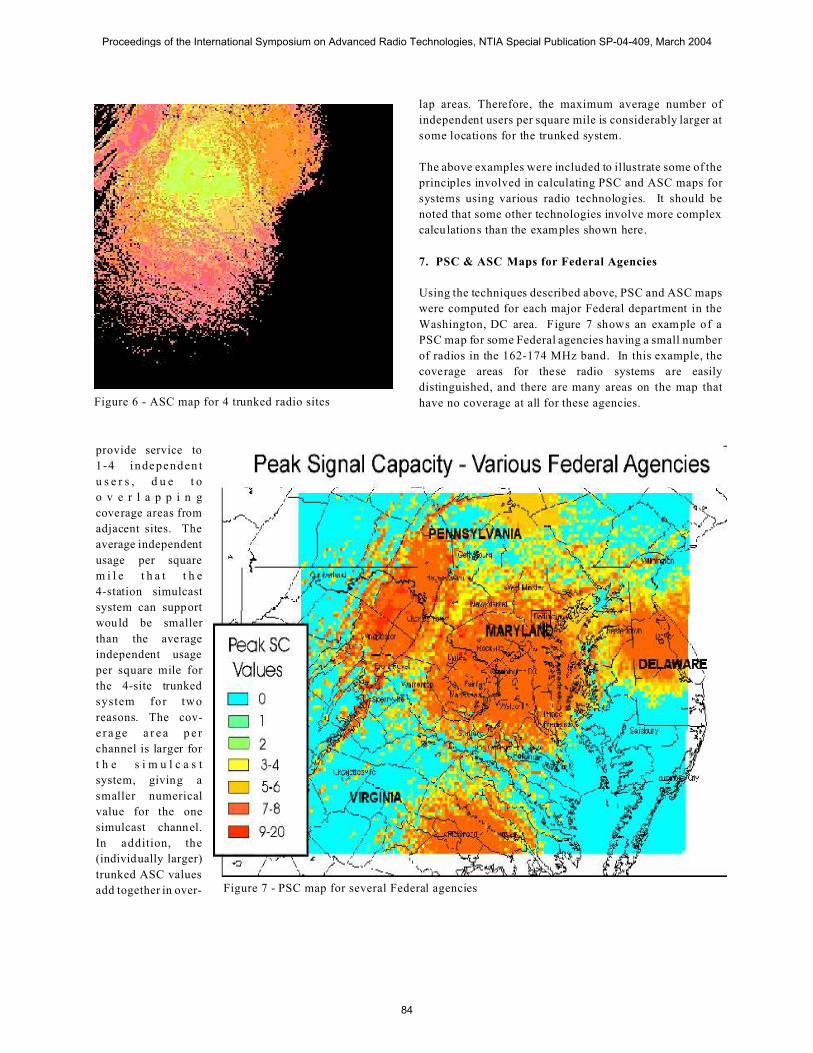
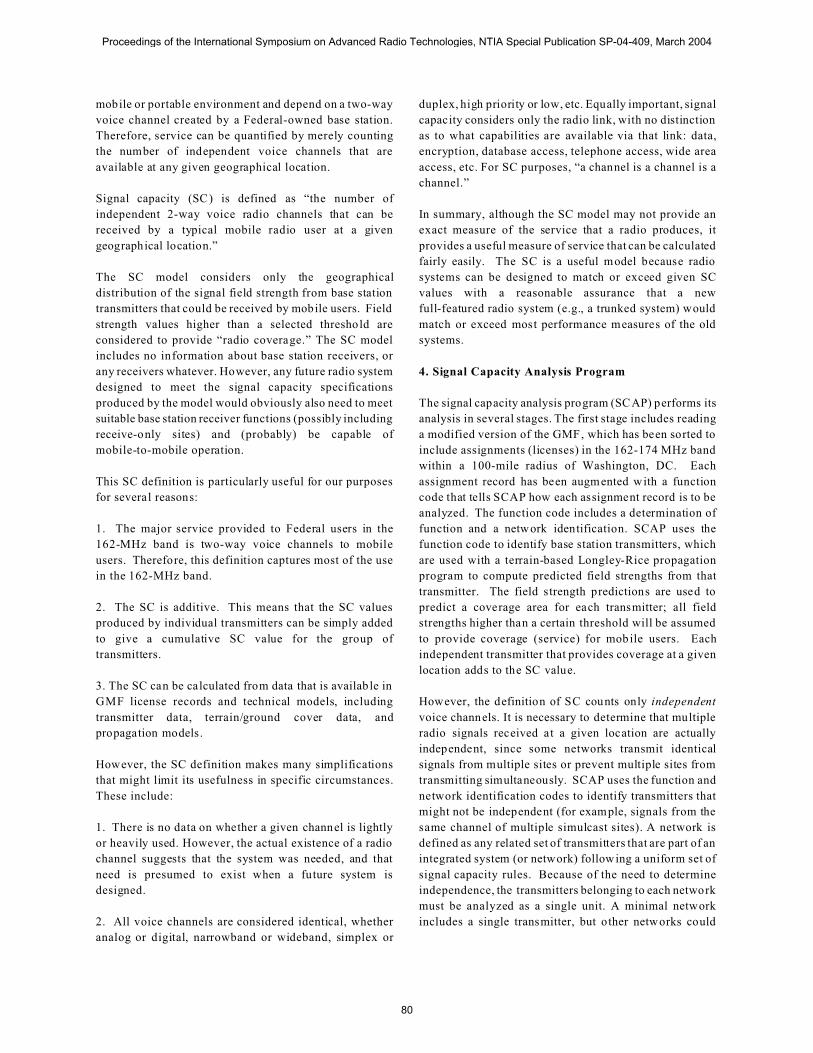
Figure 7 - PSC map for several Federal agencies
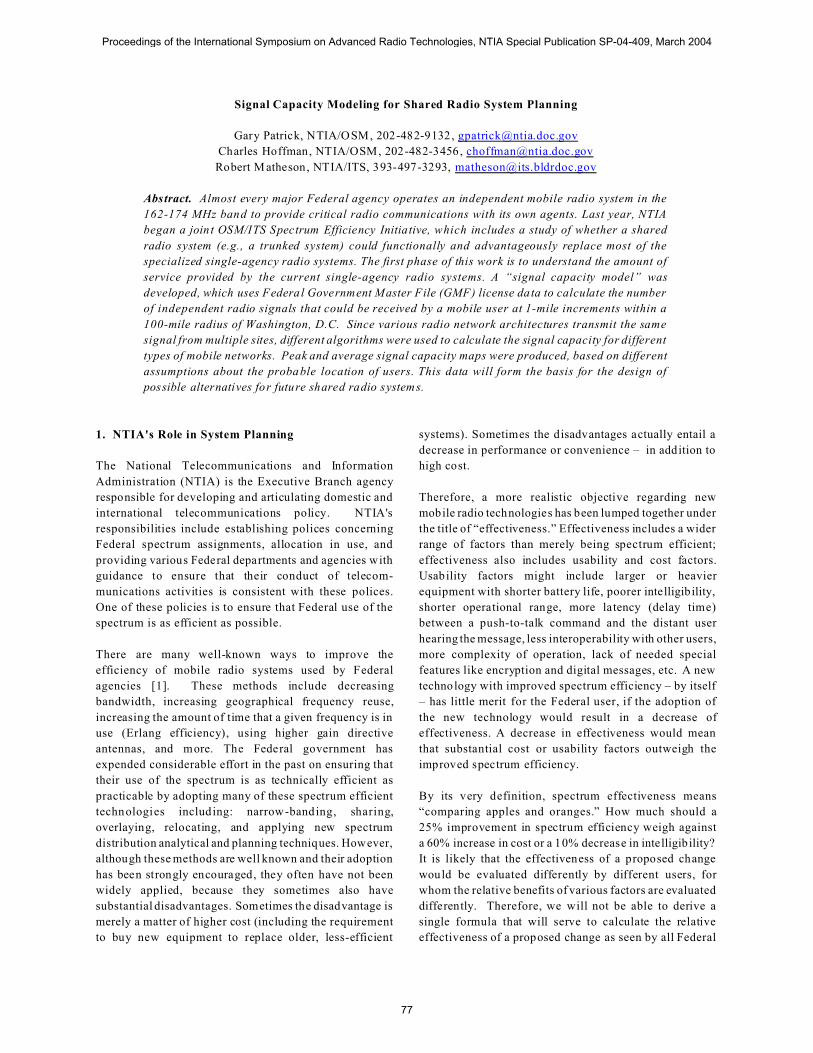
Figure 6 - ASC map for 4 trunked radio sites
provide service to
1-4 independen t
u s e r s , d u e t o
o v e r l a p p i n g
coverage areas from
adjacent sites. The
average independent
usage per square
m i l e t h a t t h e
4-station simulcast
system can support
would be smaller
than the average
independent usage
per square mile for
the 4-site trunked
system for two
reasons. The cov-
e r a ge a r e a p e r
channel is larger for
t h e s i m u l c a s t
system, giving a
smaller numerical
value for the one
simulcast channel.
In addition, the
(individually larger)
trunked ASC values
add together in over-
lap areas. Therefore, the maximum average number of
independent users per square mile is considerably larger at
some locations for the trunked system.
The above examples were included to illustrate some of the
principles involved in calculating PSC and ASC maps for
systems using various radio technologies. It should be
noted that some other technologies involve more complex
calculations than the examples shown here.
7. PSC & ASC Maps for Federal Agencies
Using the techniques described above, PSC and ASC maps
were computed for each major Federal department in the
Washington, DC area. Figure 7 shows an example of a
PSC map for some Federal agencies having a small number
of radios in the 162-174 MHz band. In this example, the
coverage areas for these radio systems are easily
distinguished, and there are many areas on the map that
have no coverage at all for these agencies.
Proceedings of the International Symposium on Advanced Radio Technologies, NTIA Special Publication SP-04-409, March 2004
84
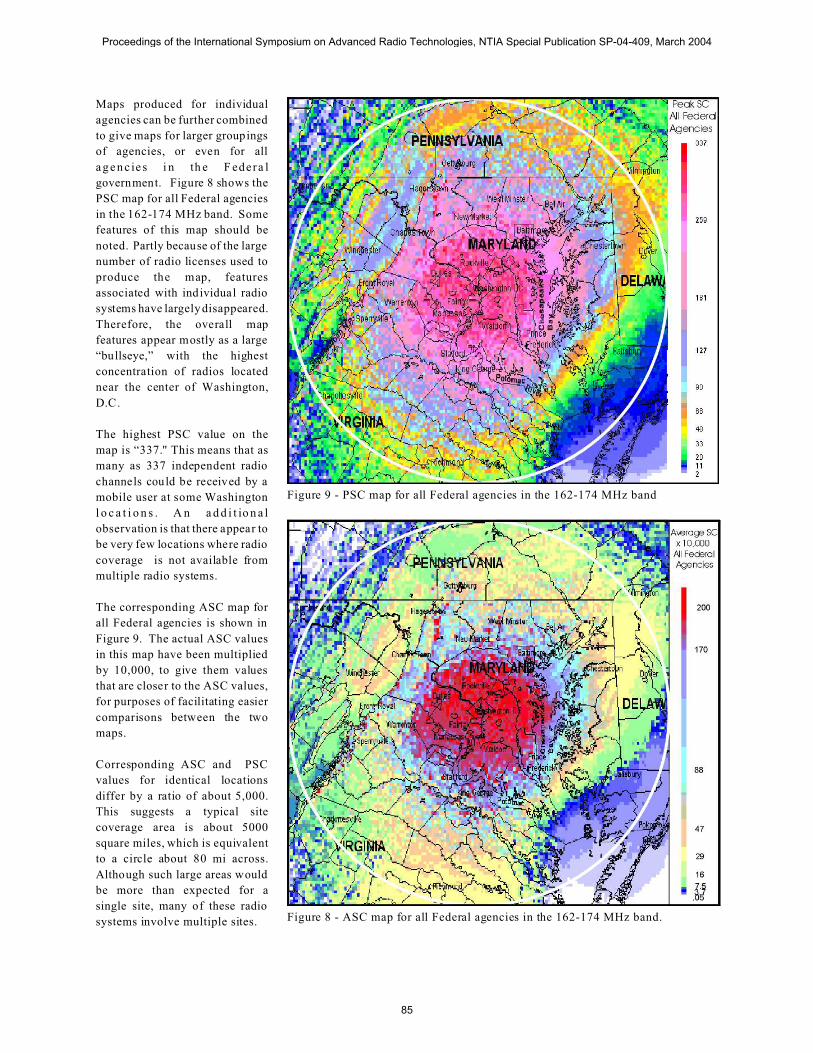
Figure 8 - ASC map for all Federal agencies in the 162-174 MHz band.
Figure 9 - PSC map for all Federal agencies in the 162-174 MHz band
Maps produced for individual
agencies can be further combined
to give maps for larger groupings
of agencies, or even for all
a g e n c ie s i n th e F edera l
government. Figure 8 shows the
PSC map for all Federal agencies
in the 162-174 MHz band. Some
features of this map should be
noted. Partly because of the large
number of radio licenses used to
produce the map, features
associated with individual radio
systems have largely disappeared.
Therefore, the overall map
features appear mostly as a large
“bullseye,” with the highest
concentration of radios located
near the center of Washington,
D.C.
The highest PSC value on the
map is “337." This means that as
many as 337 independent radio
channels could be received by a
mobile user at some Washington
l o c a t i o n s . A n a d d i t io n a l
observation is that there appear to
be very few locations where radio
coverage is not available from
multiple radio systems.
The corresponding ASC map for
all Federal agencies is shown in
Figure 9. The actual ASC values
in this map have been multiplied
by 10,000, to give them values
that are closer to the ASC values,
for purposes of facilitating easier
comparisons between the two
maps.
Corresponding ASC and PSC
values for identical locations
differ by a ratio of about 5,000.
This suggests a typical site
coverage area is about 5000
square miles, which is equivalent
to a circle about 80 mi across.
Although such large areas would
be more than expected for a
single site, many of these radio
systems involve multiple sites.
Proceedings of the International Symposium on Advanced Radio Technologies, NTIA Special Publication SP-04-409, March 2004
85

8. Conclusion
In summary, this first phase of a multi-phase effort has
made a careful effort to understand the radio services
provided by many different Federal agencies in the
Washington, D.C. area, who are using a wide range of
mobile architectures and technologies. Throughout the
analysis, we had substantial interaction with many
agencies to learn how each radio system was used and to
confirm the correct interpretation of GMF data. We
believe that we have developed a useful conceptual and
quantitative model of the capabilities of current Federal
agency mobile radio systems.
We believe that a proper application of modern
technologies might provide opportunities for very
substantial improvements to the effectiveness and
efficiency of Federal mobile radio systems. This signal
capacity model and the Washington, D.C. data were
developed to serve as a realistic foundation for exploring
these opportunities by designing alternative future shared
radio systems for Federal agencies. The payoff strategy
for all shared systems is essentially as follows:
1. Most current mobile radio systems provide services that
could be duplicated or improved by modern shared radio
systems. (The signal capacity model shows the
quantitative aspects of this conversion .)
2. Trunked radio systems, for example, can carry 3-10
times more traffic (Erlangs) over each channel, compared
to most single-channel radio systems and still provide
very high channel availability. However, this
improvement in channel capacity is present only for
trunked systems with a large number of channels (ten or
more). Most agencies don’t use many channels, so
trunked systems have fewer advantages unless multiple
agencies combine their requirements within a single
shared system.
3. If many agencies share a trunked system, it will require
relatively fewer channels to carry the combined traffic.
Moreover, multisite trunked networks could provide
large coverage areas, fast priority access for selected
users, very effective interoperability solutions, flexibility
to reconfigure for emergencies (including additional
channels and preemptive access when crowded), and
many other advanced features.
4. Because of #3 , shared trunked systems can require
fewer frequencies, give better service and coverage, and
even cost less money. However, many of these
advantages disappear if there are not enough users on the
trunked system. Therefore, a realistic study of trunked
system advantages needs good information on the number
of users, the total amount of radio traffic, and more.
Over the next couple years we intend to use this data to
design multiple systems using different assumptions about
how many agencies might be participating in a shared
system and how fully these agencies would integrate their
systems, varying the coverage area of typical sites, the use
of receive-only sites versus small-cell full-feature sites,
alternative ways to handle emergencies, use of advanced
non-trunked technologies, and different ways to achieve
interoperability.
The signal capacity model will facilitate many aspects of
these studies. The SC maps show where base station
coverage is needed and provide information on how many
signals are needed at each location. This information can
be easily modified, depending on assumptions about
which agencies are to be included in a particular version
of some future shared system. Some agencies will need
coverage in some geographical areas, while others need
coverage in different locations. Therefore, changing
among different combinations of agencies will generally
change both the magnitude of the highest PSC values and
the shape of the coverage area on the map. Similarly, the
ASC maps provide usage on a “per square mile” basis.
This data allows the design of alternative future radio
systems having base stations that provide different sized
coverage areas. Finally, after a radio system is designed,
the signal capacity model can be used to compare the
current SC values with corresponding SC values derived
from the new system design. Thus, the SC model will be
useful at several stages in the process of designing shared
radio systems.
Although none of these studies is aimed at a specific
deployment of new systems, we hope that such data and
studies will help provide realistic and useful insights on
Federal and public safety spectrum requirements, how the
benefits of shared systems and interoperability solutions
scale with size or the number of users, new
interoperability solutions based on shared systems,
identification of the best possibilities for additional
sharing of facilities and frequency bands, and more.
In current and future studies, we look forward to working
closely with other agencies and organizations to help us
with planning our work, performing our studies, and
critiquing our results.
References
[1]. R. J. Matheson. “A survey of relative spectrum
efficiency of mobile voice communication systems,”
NTIA Report 94-311. 1994.
Proceedings of the International Symposium on Advanced Radio Technologies, NTIA Special Publication SP-04-409, March 2004
86